


Bahasa
Halaman
Hukum

Predictors of poor glycemic control in adult with type 2 diabetes in South-Eastern Nigeria
Innocent Chidi Anioke1,2, Azubike Nnamdi Ezedigboh3, Ogechukwu Calista Dozie-Nwakile4, Ikechukwu Johnpaul Chukwu1,5, Peculiar Ngozi Kalu6
1. Clinical Chemistry Unit; Department of Medical Laboratory Sciences, Faculty of Health Sciences and Technology, College of Medicine, University of Nigeria Enugu Campus, Nigeria.2. Public Health- Health Promotion, School of Health and Wellbeing, Faculty of Health and Social Science, Leeds Beckett University, Leeds, United Kingdom.3. Chemical pathology Unit; Department of Medical Laboratory Services, University of Nigeria Teaching Hospital Ituku/Ozolla Enugu, Nigeria. 4. Medical Laboratory Microbiology Unit; Department of Medical Laboratory Sciences, Faculty of Health Sciences and Technology, College of Medicine, University of Nigeria Enugu Campus, Nigeria.5. Biomolecular and Biomedical Sciences, Glasgow Caledonian University, United Kingdom.6. Department of Chemical Pathology, College of Medicine, Nnamdi Azikiwe University, Nnewi, Nigeria. Emails: [email protected];[email protected]; [email protected]; [email protected]
AbstractBackground: The study investigated predictors of poor glycemic control in type 2 diabetes (T2DM).Methods: Data on demographics, anthropometric and clinical parameters were collected in a cross-section survey from 140 adults with T2DM, using standard tools/instruments. Glycated hemoglobin (A1C) was assessed as a measure of glycemic con-trol. Results: Majority (83.3%) had poor glycemic control status of which about 95% constitute the elderly. The elderly (OR= 5.90, 95% Cl: 1.66-20.96) were more likely associated with poor glycemic control than the non-elderly (p = 0.006). Adjustment for significant predictor variables: Age, waist-hip ratio (WHR), Fasting plasma glucose (FPG) and Systolic blood pressure (SBP), although attenuated the odds (OR= 5.00, 95% CI: 1.19-20.96) of poor glycemic control, it still remained significantly (p = 0.028) higher in the elderly. Patients outside tight FPG control significantly (p = 0.001) showed poor glycemic cotrol than those within tight FPG (OR= 17.39, 95%Cl: 5.83-51.90), even with attenuated OR (OR= 10.85, 95%Cl: 3.10-37.96) and (OR=12.08, 95%Cl: 3.64-40.09) when non- significant and significant predictor variables were accounted for, respectively.Conclusion: Age, WHR, FPG, and SBP were significantly associated with differences in glycemic control. The elderly and FPG outside tight control showed significantly increased odds of poor glycemic control status.Keywords: Type 2 Diabetes Mellitus; glycemic control status; A1C; Elderly; Fasting plasma glucose; glycemic control predictors.DOI: https://dx.doi.org/10.4314/ahs.v19i4.3Cite as: Anioke IC, Ezedigboh AN, Dozie-Nwakile OC, Chukwu IJ, Kalu PN. Predictors of poor glycemic control in adult with type 2 diabetes in South-Eastern Nigeria. Afri Health Sci. 2019;19(4):2819-2828. https://dx.doi.org/10.4314/ahs.v19i4.3
Corresponding author:Innocent Chidi Anioke,Clinical Chemistry Unit; Department of Medical Laboratory Sciences, Faculty of Health Sciences and Technology, College of Medicine, University of Nigeria Enugu Campus, Nigeria.Tel:+2348066752664Email: [email protected]
IntroductionThe growing incidence of type 2 diabetes mellitus (T2DM) would likely heighten the prevalence of DM globally, with about 11% adults (approximately 114 mil-lion) currently suffering with T2DM. This is projected to increase to about 150 million by 20401, with 80% of the cases occurring among population in resource-poor settings2. In Africa, the estimated prevalence of diabetes is 1% in rural areas, and about 5% to 7% in urban sub-Sa-
© 2019 Anioke et al. Licensee African Health Sciences. This is an Open Access article distributed under the terms of the Creative commons Attribution License (https://creativecommons.org/licenses/BY/4.0), which permits unrestricted use, distribution, and reproduction in any medium, provided the original work is properly cited.
African Health Sciences
African Health Sciences Vol 19 Issue 4, December, 2019 2819
haran Africa3, with Nigeria having the highest burden of the disease4. Data from National Survey on Non-Com-municable Disease indicates that the prevalence of DM in Nigeria was 2.2% in19975. In 2015, this has increased to 5.0%4. Although, the current prevalence of DM in Ni-geria is not well documented, however, this may possibly vary between 8%-10%6. Epidemiological evidence indi-cates an increasing burden of T2DM among adult Nige-rian (20-79 years) with about 874 000 cases representing 2.0% estimated prevalence rates in 1990 to 4.7 million cases (5.7%) in 20157. Females have higher prevalence than males8,9. However, prevalence increases with ageing in both sexes8.
Regardless of sex, maintaining tight glycemic control among patients is fundamental in preventing complica-tions associated with the disease. Several factors, both clinical and non-clinical factors, have been noted to im-pact the level of glycemic control in individuals. For in-stance, there are few non-modifiable (e.g. ethnicity, age, family history/genetic factor, sex) and modifiable (e.g. excess alcohol intake, smoking, physical inactivity, un-healthy diet, educational status, metabolic abnormalities and obesity/overweight) factors reported to influence the outcome of T2DM management4,8. Interestingly, pri-or studies1,10,11, have reported ethnic difference particu-larly in T2DM. Perhaps, given the ethnic disparities in glycemic control12 arising from the differences in the distribution of critical risk factors that impact glycemic control such as age1,13, sex, social economic status, body mass index (BMI)1, lifestyles, processes of care/adher-ence to treatment14,15,16,18, blood pressure and duration of the disease16,17,18 etc. However, in Nigeria- especially South-Eastern part, there still remains dearth of data re-garding glycemic control status, a pivotal step for achiev-ing marked reduction of diabetic complications. Against this background, it became pertinent in this study to identify first, the level of glycemic control status among T2DM patients under treatment. Secondly, investigate the demographic, anthropometric and clinical factor(s) asso-ciated with glycemic control in T2DM patients with dif-ferent diabetic complications in south-east Nigeria, and the extent of association with or without accounting for joint influence of significant predictor variables.
Patients and methodsStudy design, setting and ethicsA cross-sectional survey was used for the study. Whilst this design was unable to establish a causal link19 between glycemic control status and studied demographic-clinical variables, it was a useful methodology for comparison and demonstration of the relationship (association) be-tween dependent variable (glycemic control status) and independent (demographics, anthropometrics & clinical) variables. By this design, it implies that changes in one variable accompany changes in another rather than cause and effect19 .This study was conducted at the diabetic clinic of Nnamdi Azikiwe University Teaching Hospital, NAUTH, Nnewi. NAUTH is one of the major tertiary hospitals located in South-East of Nigeria. This study re-ceived ethical approval in line with the Research Ethics Policy and Procedures of the above named hospital prior to initiation of the study.
Study population and sample sizeThe study population consists of clinically confirmed T2DM out-patients under treatment, attending NAUTH for check-up. A sample size of 132 participants was cal-culated for the study considering absolute precision of 5% with a design effect of 1.5 using online method as described by Dean et al.20. This was based on assumed population size of 1000 for the setting selected, and a documented prevalence of T2DM in South-East Nigeria reported to be 6.7%21. However, a higher number of 150 patients were targeted to account for possible refusals and dropouts during the study.
Sampling procedureOut-patients with T2DM who attends the diabetic clinic at NAUTH were recruited based on inclusion and exclu-sion criteria set for the study. Patients were included if they satisfied the following inclusion criteria: were clini-cally confirmed T2DM patients within the clinic, are 30 years and above, under treatment for at least one year, and the willingness to participate and is able to give consent. However, those who met these inclusion criteria but were on drugs that could affect glucose metabolism e.g. steroid and B-blockers or pregnant for the females, were also ex-cluded from the study. Informed consent was provided
African Health Sciences Vol 19 Issue 4, December, 20192820
by each eligible patient who was willing to participate in the study after the purpose, risk and benefits of the study was explained to all participants. A convenient sampling method was used to select samples of the population be-tween June 2, 2013 and September 28, 2013. Finally, the study comprised data collected from 140 patients who cooperated in every stage of the project.
Data collectionDemographic and anthropometric assessmentPatient’s clinical characteristics, including duration of T2DM since diagnosis, kind of diabetic complications, and anti-diabetic medications and other concurrent med-ications received by patients were obtained by review of patients’ medical records. The data on patients demo-graphic (age and sex) were also obtained from the record while they underwent a standardised medical examina-tion that included routine anthropometric and clinical assessment. Weight was taken with patients having any heavy wears such as shoes, clothing and belts removed, using digital Soehnle electronic scales (Leifheit AS, Nas-sau, Germany). Height was measured using a stadiometer with the participant standing erect in bare feet with head in the Frankfurt plane. BMI was calculated by dividing weight (in kg) by height squared (in m2) and categorized using the WHO classification22 into: < 18.5 kg/m2 (un-derweight), 18.5–24.9 kg/m2 (normal weight), 25–29.9 kg/m2 (overweight), ≥ 30 kg/m2 (obese). Three BMI categories were created for the purpose of the study by collapsing the under-weight with normal-weight to form a single category. WHR was calculated by dividing waist circumference (WC) by hip circumference (HC) all in centimetre (cm).WC was measured at the level of the il-iac crest while the participants breathed out gently using a measuring tape whereas measurement for the HC was taken at the maximal gluteal protrusion. The blood pres-sure was measured twice in a sitting position after 5 min of rest with a mercury Sphygmomanometer according to a standard protocol. The average of the two readings was considered as the blood pressure value in mmHg for each patient. To ensure reliability and validity of results, all the patients’ data were collected using same measuring instrument.
Biochemical laboratory assessmentAbout 5ml of venous blood was taken from each subject in a fasting state (i.e. after overnight fast) by a medical laboratory scientist, who is a member of the research team. About 2ml of blood sample collected were dis-
pensed into EDTA anticoagulant bottle and 3ml into fluoride oxalate bottle. Whole blood for A1C assay was stored at 40C up to one week while the FPG was imme-diately analysed. The quantitative determination of A1C, an index of glycemic control status in this study, was car-ried out by Direct Enzymatic (fructosyl valine oxidase) method whereas FPG was estimated by glucose oxidase method using Randox kit.In line with the therapeutic goal of A1C in diabetes which is to maintain a value < 7% as recommended by the International Diabetes Federation (IDF) and Ameri-can College of Endocrinology (ACE)2, A1C data was di-vided into two categories: Good glycemic control (< 7%)
and poor glycemic control ( 7%). This was to satisfy the purpose of the study.
Data analysisAll data analyses were performed using SPSS, IBM® SPSS® Statistics for Windows Version 20.0(IBM Corp. Armonk, NY, USA). Descriptive analysis was carried out for the predictor (independent) variables (Age, Sex, BMI, WHR, FPG, Complications, SBP and diastolic blood pres-sure (DBP)) and outcome (dependent) variable (A1C). The characteristics of the sample were presented as per-centage (frequencies) or mean SD where appropriate, first by demographic, anthropometric and clinical status and then as a function of glycemic control categories. The association between variations in glycemic control status and variations in predictor variables were shown with cross-tabulation, and Pearson Chi-squared, Fisher's exact and student t-tests were used, where appropriate to select significant predictors of good or poor glycemic control status. Binary logistic regression analysis was used to analyze the level of association between significant pre-dictor factors (Age, WHR, FPG and SBP) and the index of glycemic control status (A1C). First, crude odds ratios (ORs) and 95% confidence intervals (CIs) for each signif-icant predictor variable were calculated using univariable logistic regression. Secondly, the independence of any as-sociation was examined by accounting for the influence of non-significant predictor variables such as Sex, BMI, Complications and DBP in a multivariable logistic regres-sion model. Finally, the Odds Ratio and 95% confidence intervals were calculated to identify predictor(s) of glyce-mic control status using multivariable logistic regression model including only the significant predictor variables: Age, WHR, FPG, and SBP. p < 0.05 was considered sta-tistically significant value for all comparisons.
African Health Sciences Vol 19 Issue 4, December, 2019 2821
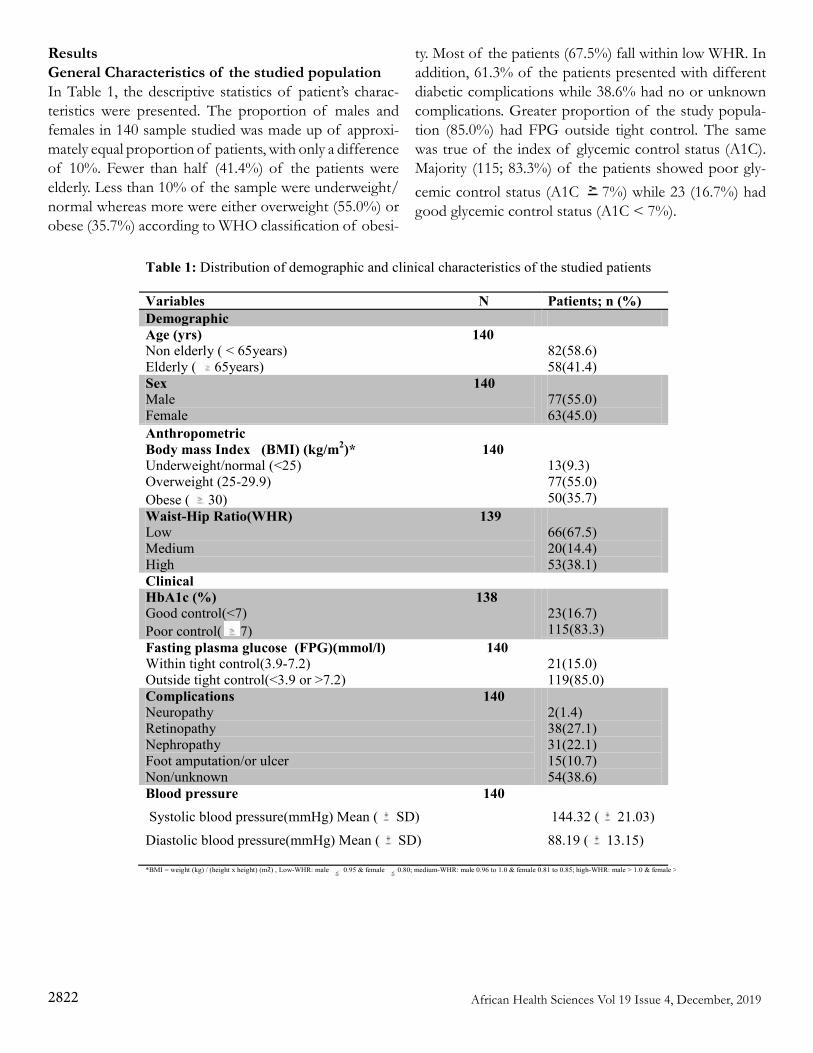
ResultsGeneral Characteristics of the studied populationIn Table 1, the descriptive statistics of patient’s charac-teristics were presented. The proportion of males and females in 140 sample studied was made up of approxi-mately equal proportion of patients, with only a difference of 10%. Fewer than half (41.4%) of the patients were elderly. Less than 10% of the sample were underweight/normal whereas more were either overweight (55.0%) or obese (35.7%) according to WHO classification of obesi-
ty. Most of the patients (67.5%) fall within low WHR. In addition, 61.3% of the patients presented with different diabetic complications while 38.6% had no or unknown complications. Greater proportion of the study popula-tion (85.0%) had FPG outside tight control. The same was true of the index of glycemic control status (A1C). Majority (115; 83.3%) of the patients showed poor gly-cemic control status (A1C 7%) while 23 (16.7%) had good glycemic control status (A1C < 7%).
Table 1: Distribution of demographic and clinical characteristics of the studied patients
Variables N Patients; n (%) Demographic Age (yrs) 140 Non elderly ( < 65years) Elderly ( 65years)
82(58.6) 58(41.4)
Sex 140 Male Female
77(55.0) 63(45.0)
Anthropometric Body mass Index (BMI) (kg/m2)* 140 Underweight/normal (<25) Overweight (25-29.9) Obese ( 30)
13(9.3) 77(55.0) 50(35.7)
Waist-Hip Ratio(WHR) 139 Low Medium High
66(67.5) 20(14.4) 53(38.1)
Clinical HbA1c (%) 138 Good control(<7) Poor control( 7)
23(16.7) 115(83.3)
Fasting plasma glucose (FPG)(mmol/l) 140 Within tight control(3.9-7.2) Outside tight control(<3.9 or >7.2)
21(15.0) 119(85.0)
Complications 140 Neuropathy Retinopathy Nephropathy Foot amputation/or ulcer Non/unknown
2(1.4) 38(27.1) 31(22.1) 15(10.7) 54(38.6)
Blood pressure 140 Systolic blood pressure(mmHg) Mean ( SD)
Diastolic blood pressure(mmHg) Mean ( SD)
144.32 ( 21.03)
88.19 ( 13.15)
*BMI = weight (kg) / (height x height) (m2) , Low-WHR: male 0.95 & female 0.80; medium-WHR: male 0.96 to 1.0 & female 0.81 to 0.85; high-WHR: male > 1.0 & female > 0.85
African Health Sciences Vol 19 Issue 4, December, 20192822
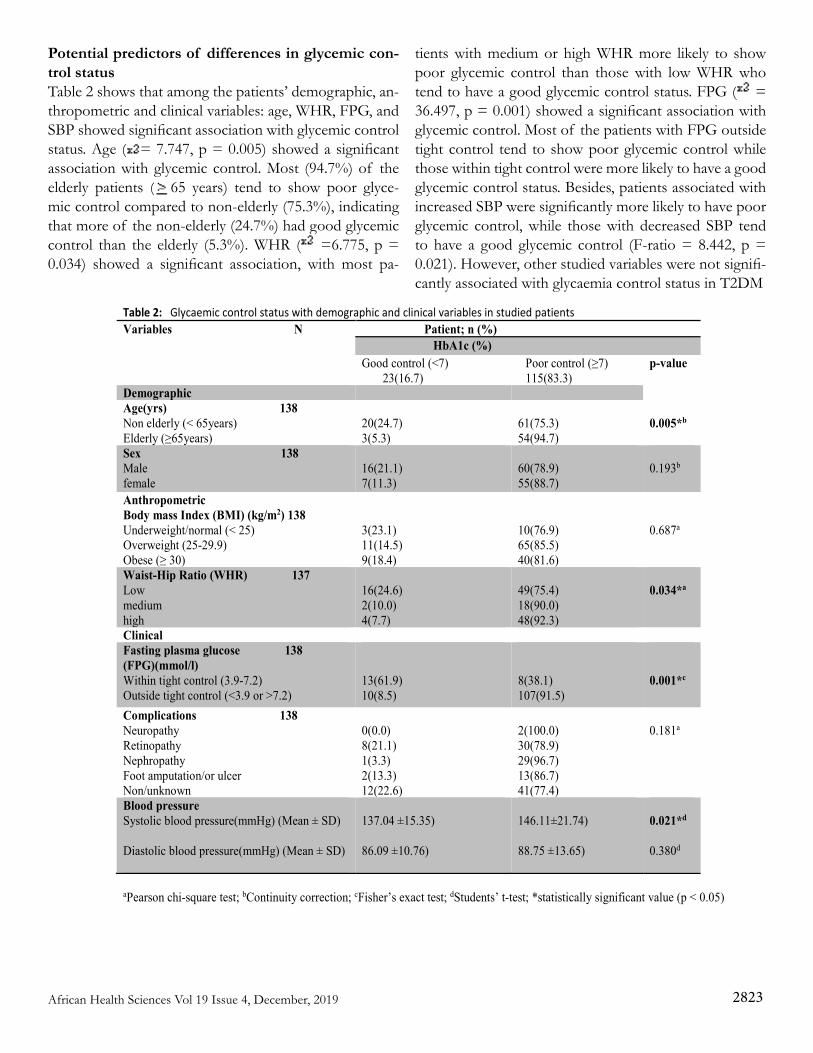
Potential predictors of differences in glycemic con-trol statusTable 2 shows that among the patients’ demographic, an-thropometric and clinical variables: age, WHR, FPG, and SBP showed significant association with glycemic control status. Age ( = 7.747, p = 0.005) showed a significant association with glycemic control. Most (94.7%) of the elderly patients ( 65 years) tend to show poor glyce-mic control compared to non-elderly (75.3%), indicating that more of the non-elderly (24.7%) had good glycemic control than the elderly (5.3%). WHR ( =6.775, p = 0.034) showed a significant association, with most pa-
tients with medium or high WHR more likely to show poor glycemic control than those with low WHR who tend to have a good glycemic control status. FPG ( = 36.497, p = 0.001) showed a significant association with glycemic control. Most of the patients with FPG outside tight control tend to show poor glycemic control while those within tight control were more likely to have a good glycemic control status. Besides, patients associated with increased SBP were significantly more likely to have poor glycemic control, while those with decreased SBP tend to have a good glycemic control (F-ratio = 8.442, p = 0.021). However, other studied variables were not signifi-cantly associated with glycaemia control status in T2DM
Table 2: Glycaemic control status with demographic and clinical variables in studied patients Variables N Patient; n (%)
HbA1c (%) Good control (<7) 23(16.7)
Poor control (≥7) 115(83.3)
p-value
Demographic Age(yrs) 138 Non elderly (< 65years) Elderly (≥65years)
20(24.7) 3(5.3)
61(75.3) 54(94.7)
0.005*b
Sex 138 Male female
16(21.1) 7(11.3)
60(78.9) 55(88.7)
0.193b
Anthropometric Body mass Index (BMI) (kg/m2) 138 Underweight/normal (< 25) Overweight (25-29.9) Obese (≥ 30)
3(23.1) 11(14.5) 9(18.4)
10(76.9) 65(85.5) 40(81.6)
0.687a
Waist-Hip Ratio (WHR) 137 Low medium high
16(24.6) 2(10.0) 4(7.7)
49(75.4) 18(90.0) 48(92.3)
0.034*a
Clinical Fasting plasma glucose 138 (FPG)(mmol/l) Within tight control (3.9-7.2) Outside tight control (<3.9 or >7.2)
13(61.9) 10(8.5)
8(38.1) 107(91.5)
0.001*c
Complications 138 Neuropathy Retinopathy Nephropathy Foot amputation/or ulcer Non/unknown
0(0.0) 8(21.1) 1(3.3) 2(13.3) 12(22.6)
2(100.0) 30(78.9) 29(96.7) 13(86.7) 41(77.4)
0.181a
Blood pressure Systolic blood pressure(mmHg) (Mean ± SD) Diastolic blood pressure(mmHg) (Mean ± SD)
137.04 ±15.35) 86.09 ±10.76)
146.11±21.74) 88.75 ±13.65)
0.021*d
0.380d
aPearson chi-square test; bContinuity correction; cFisher’s exact test; dStudents’ t-test; *statistically significant value (p < 0.05)
African Health Sciences Vol 19 Issue 4, December, 2019 2823
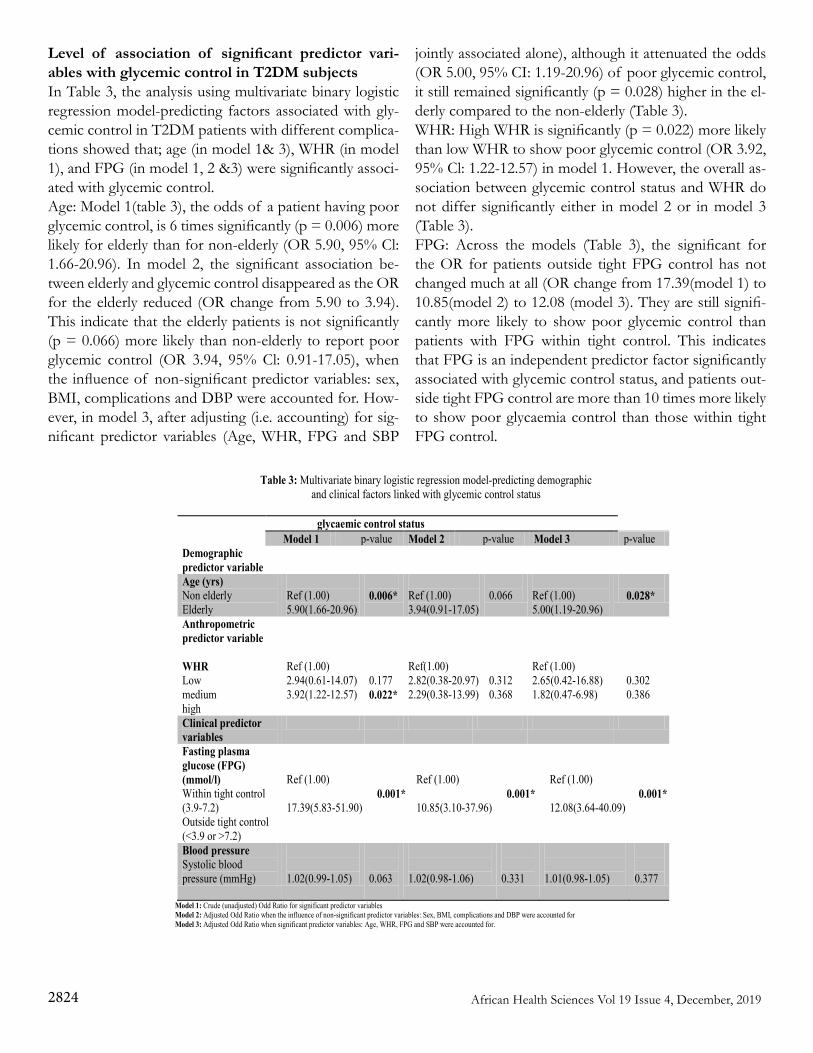
Level of association of significant predictor vari-ables with glycemic control in T2DM subjectsIn Table 3, the analysis using multivariate binary logistic regression model-predicting factors associated with gly-cemic control in T2DM patients with different complica-tions showed that; age (in model 1& 3), WHR (in model 1), and FPG (in model 1, 2 &3) were significantly associ-ated with glycemic control.Age: Model 1(table 3), the odds of a patient having poor glycemic control, is 6 times significantly (p = 0.006) more likely for elderly than for non-elderly (OR 5.90, 95% Cl: 1.66-20.96). In model 2, the significant association be-tween elderly and glycemic control disappeared as the OR for the elderly reduced (OR change from 5.90 to 3.94). This indicate that the elderly patients is not significantly (p = 0.066) more likely than non-elderly to report poor glycemic control (OR 3.94, 95% Cl: 0.91-17.05), when the influence of non-significant predictor variables: sex, BMI, complications and DBP were accounted for. How-ever, in model 3, after adjusting (i.e. accounting) for sig-nificant predictor variables (Age, WHR, FPG and SBP
jointly associated alone), although it attenuated the odds (OR 5.00, 95% CI: 1.19-20.96) of poor glycemic control, it still remained significantly (p = 0.028) higher in the el-derly compared to the non-elderly (Table 3).WHR: High WHR is significantly (p = 0.022) more likely than low WHR to show poor glycemic control (OR 3.92, 95% Cl: 1.22-12.57) in model 1. However, the overall as-sociation between glycemic control status and WHR do not differ significantly either in model 2 or in model 3 (Table 3).FPG: Across the models (Table 3), the significant for the OR for patients outside tight FPG control has not changed much at all (OR change from 17.39(model 1) to 10.85(model 2) to 12.08 (model 3). They are still signifi-cantly more likely to show poor glycemic control than patients with FPG within tight control. This indicates that FPG is an independent predictor factor significantly associated with glycemic control status, and patients out-side tight FPG control are more than 10 times more likely to show poor glycaemia control than those within tight FPG control.
Table 3: Multivariate binary logistic regression model-predicting demographic and clinical factors linked with glycemic control status
glycaemic control status
Model 1 p-value Model 2 p-value Model 3 p-value Demographic predictor variable
Age (yrs) Non elderly Elderly
Ref (1.00) 5.90(1.66-20.96)
0.006*
Ref (1.00) 3.94(0.91-17.05)
0.066
Ref (1.00) 5.00(1.19-20.96)
0.028*
Anthropometric predictor variable WHR Low medium high
Ref (1.00) 2.94(0.61-14.07) 3.92(1.22-12.57)
0.177 0.022*
Ref(1.00) 2.82(0.38-20.97) 2.29(0.38-13.99)
0.312 0.368
Ref (1.00) 2.65(0.42-16.88) 1.82(0.47-6.98)
0.302 0.386
Clinical predictor variables
Fasting plasma glucose (FPG) (mmol/l) Within tight control (3.9-7.2) Outside tight control (<3.9 or >7.2)
Ref (1.00) 17.39(5.83-51.90)
0.001*
Ref (1.00) 10.85(3.10-37.96)
0.001*
Ref (1.00) 12.08(3.64-40.09)
0.001*
Blood pressure Systolic blood pressure (mmHg)
1.02(0.99-1.05)
0.063
1.02(0.98-1.06)
0.331
1.01(0.98-1.05)
0.377
Model 1: Crude (unadjusted) Odd Ratio for significant predictor variables Model 2: Adjusted Odd Ratio when the influence of non-significant predictor variables: Sex, BMI, complications and DBP were accounted for Model 3: Adjusted Odd Ratio when significant predictor variables: Age, WHR, FPG and SBP were accounted for.
African Health Sciences Vol 19 Issue 4, December, 20192824
DiscussionType 2 diabetes mellitus accounts for approximately 80-90% of all cases of diabetes in adults with varying fac-tors affecting glycemic control level, a key strategy in pre-venting as well as reducing possible complications arising from the disease. The present study investigated the gly-cemic control status among T2DM adult patients under treatment, association of demographic, anthropometric and clinical factor(s) with glycemic control in T2DM pa-tients with complications, and the extent of association with or without accounting for joint influence of signifi-cant predictor variables.The study revealed that age, WHR, FPG as well as SBP distribution were significantly associated with differences in glycaemic control- assessed with A1C Measurement. Elderly patients , patients with high WHR and a FPG outside the tight control range (< 3.9 or > 7.2 mmol/l) have significantly increased odds of poor glycemic con-trol compared to non-elderly, patient with medium/low WHR and a FPG within the tight control range of 3.9- 7.2 mmol/l, respectively. However, after adjustment for significant predictor variables, only elderly patients and patients with FPG outside the tight control range were still significantly associated with increased odds of poor glycaemia control status. These results, incongruent with other previous studies, indicate that the glycemic con-trol status of diabetic patients is significantly linked with age12,18,23,24, and FPG of each patient in question23. In the contrary, these results disagree with a prior study25, that reported no significant association between age groups and glycemic control.
According to cumulative advantage/disadvantage theory, several explanatory factors relating to health outcomes are subject to modification with ageing26. Metabolic health changes associated with advanced age could possibly be a critical factor to consider in light of the suboptimal or poor glycemic control status noted among such a hetero-geneous group as the elderly27. For instance, normal ag-ing is characterized with a progressive glucose intolerance arising from an impairment linked to glucose-induced insulin release. This age-related impairment has been at-tributed to substantial decrease in beta-cell response to anti-diabetic agent (e.g. glucose-dependent insulinotropic polypeptide), particularly in hyperglycaemic state28. More-over, elderly patients have been reported to exhibit poor compliance to recommended therapy required to achieve
optimal glycemic control18. Undoubtedly, however, most treatment options for this group has been derived to a large extent from data generated among the nonelder-ly29,30,31 given the few evidence-based research works from which guidelines for treatment for the elderly patients can be derived27. Arguably, such treatment approach in terms of achieving better glycemic control may likely favour the nonelderly patients than their elderly counterparts, which is the case in the present study. This finding is not consis-tent with one prior study31. However, in elderly patients, more complex factors may be influencing the glycemic control status than in the younger adults as our finding suggests.
BMI in the current study was not a significant predictor of poor glycemic control, even though higher proportion of overweight/obese individuals were associated with poor glycemic control status. WHR (an indicator of central ad-iposity) was found to be a significant potential predictor of poor glycemic control in diabetes. The prediction of T2DM, and perhaps its attendant poor glycemic control, has been suggested by clinical evidence to be better and stronger with indicators of central adiposity (e.g. WHR) than with general adiposity (e.g. BMI)32,33. This was at-tributed to the fact that central adiposity has been linked with impairment in glucose-insulin homeostasis leading to a decrease in both glucose tolerance and insulin-stim-ulated glucose disposal33. According to Vazquez et al.33, the ability of both adiposity indicators to predict T2DM may vary by demography such as ethnicity, sex and age. Perhaps, this is why our finding on BMI and poor glyce-mic control did not echo a prior study24, which reported BMI as a significant predictor of poor glycemic control. However, the finding on WHR as a significant predic-tor of poor glycemic control lends support to the clinical evidence, suggesting that indicators of central adiposity are better predictors of poor glycemic control in type 2 DM32,33,34.
Majority of patients in the study had FPG outside tight control. This, of course, was not contrary to expectation, because previous documented evidence had reported that FPG have good predictive value for overall glycemic con-trol35,36. Thus, in the context of existing body of research, the result in congruent with35,36 indicates that FPG is one biomarker that has a strong positive association with gly-cated haemoglobin (A1C).
African Health Sciences Vol 19 Issue 4, December, 2019 2825
Patients associated with increased SBP were significantly linked with poor glycemic control, while those with de-creased SBP tend to show good glycemic control. For diabetic patients and other high-risk patients, the recom-mended guidelines suggested lowering the systolic blood pressure to a treatment goal less than 130 mm Hg37. The guideline seems to uphold “the lower the better” approach to blood pressure control in diabetic individuals38, which the present finding, in agreement with prior study39, is in line with. Although, some authors have argued that below this recommended blood pressure guideline (130/80 mm Hg) in diabetes,increased risk for poor outcomes have also been recorded40.
Limitation of the studyWe recognised that multiple factors may interact to affect glycemic control. Our model, however, examined just a few of those; demographics (age and sex), anthropomet-ric (BMI and WHR) and clinical (FPG and BP) factors, variables capable of yielding data less subject to bias. So-cial-economic determinants (confounders) of glycemic control status such as lifestyle/behavioural factors (diet, exercise, smoking etc), educational level, social class sta-tus, knowledge of self-care, etc were left unexplained, because information on such patients' data are meant to be collected with a questionnaire, a tool often subject to social desirability bias41 and recall bias, especially in study area such as ours. Postprandial plasma glucose (PPG) was not assessed in the study. Although PPG is a better predictor of overall glycemic control than FPG, but that, is in the absence of HbA1c. However, whether FPG or PPG is a better predictor of glycemic control is still a subject of debate42. Moreover, given that HbA1c was the measure of glycemic control used in the present study, we included only FPG, the most common routine test for day-to-day monitoring of diabetic patients in South-East-ern Nigeria hospitals. Besides, FPG is considered to be the major contributor for glycation of haemoglobin and can account for a shift in glycemic status of the patients43.However, our result may have been affected by those un-accounted possible confounders. As such, given the few predictor variables considered in our study, we wish to sub-mit that our findings alone may not be sufficient enough to explain the difference in glycemic control in adult with T2DM. Furthermore, no causal associations between po-tential predictor factors and poor glycemic control can
be drawn because of the cross-sectional design adopted in the study. Besides, this study did not account for the differences in drug treatment between various groups, a factor that may partly explain the differences in glycemic control status, particularly among elderly and non-elderly groups. Finally, as a single centre study which adopted convenience sampling technique for recruitment of pa-tients rather than random sampling, generalization of findings should be undertaken with caution-as only the patients who visited the NAUTH diabetic clinic during the period of study were included.
Strength and clinical implication of the studyThis study is first of its kind to show the level of glyce-mic control status among adult with T2DM in south-east Nigeria, suggesting that older adult ( 65 years) show poor glycemic control status regardless of complications and the treatment options. Interestingly, also the study re-vealed those significant predictors (age, WHR, FPG and SBP) of poor glycemic control among the population. Findings indicate that these potential predictors of poor glycemic control require adequate consideration during the course of clinical management of diabetes in order to improve, especially elderly patients’ outcome. Of great-er interest is the practical implication of these findings, which apparently underpins the increasing body of litera-ture advocating a tailored management of the disease for elderly patients44,45.
ConclusionTaken together, age, WHR, FPG and SBP were signifi-cantly associated with differences in glycemic control. The study revealed that the level of DM management in south-east Nigeria is unsatisfactory, as majority showed poor glycemic control status, particularly among the el-derly DM patients. Therefore, the complex interactions between potential predictors of poor glycemic control among this age group -beyond the ones considered in this study- require further investigation in a wider scale such as population-based study in a low-income setting as ours. This may help to come up with improved treatment interventions and strategies that would favour better gly-cemic control status, as such reduce the risk of diabetic complication among the elderly population. Competing interestsThe authors have no competing interests to declare.
African Health Sciences Vol 19 Issue 4, December, 20192826
References1. International Diabetes Federation. The IDF Diabetes Atlas.8th ed. Brussels: Belgium, international Diabetes Federation, 2017.2.Negandhi PH, Ghouri N, Colhoun HM, Fischbacher CM, Lindsay RS, et al. Ethnic Differences in Glycemic Control in People with Type 2 Diabetes Mellitus Living in Scotland. PLoS One, 2013, 8(12): e83292.3. Kengne AP, Amoah AG, Mbanya JC. Cardiovascular complications of diabetes mellitus in sub-Saharan Africa. Circulation 2005; 112: 3592-36014. Oputa,R. & Chinenye, S. Diabetes in Nigeria – a trans-lational medicine approach. African Journal of Diabetes Medicine, 2015; 23(1):7-10.5 Akinkugbe,O. & Akinyanju,O. “Final report.Nation-al Survey on Non-Communicable Disease,” Tech. Rep., Federal Ministry of Health, Lagos, Nigeria.1997.6. Ogbera AO, Ekpebegh C. Diabetes mellitus in Nigeria: The past, present and future. World J Diabetes 2014; 5(6): 905-9117. Adeloye, D., Ige, J., Aderemi, A., et al. Estimating the prevalence, hospitalisation and mortality from type 2 di-abetes mellitus in Nigeria: a systematic review and me-ta-analysis. BMJ Open, 2017;7.8. Ekpenyong,C., Akpan,U., Ibu,J.& Nyebuk,D. Gen-der And Age Specific Prevalence And Associated Risk Factors Of Type 2 Diabetes Mellitus In Uyo Metropo-lis, South Eastern Nigeria. Diabetologia Croatica, 2012; 41(1):17-28.9. Ogedengbe,S. & Ezeani,I. Profile of metabolic abnor-malities seen in patients with type 2 diabetes mellitus and their first degree relatives with metabolic syndrome seen in Benin City, Edo state Nigeria. Journal of Diabetes & Met-abolic Disorders, 2014; 13:61.10. Shaw JE, Sicree RA, Zimmet PZ . Global estimates of the prevalence of diabetes for 2010 and 2030. Diabetes Res Clin Pract, 2010; 87: 4–14. PubMed 11. Hall LML, Sattar N, Gill JMR (2008) Risk of metabol-ic and vascular disease in South Asians: potential mecha-nisms for increased insulin resistance. Future Lipidology 3: 411–424.12. Harris MI, Eastman RC, Cowie CC, Flegal KM, Eber-hardt MS: Racial and ethnic differences in glycemic con-trol of adults with type 2 diabetes. Diabetes Care 1999, 22:403-408. 13. Mukhopadhyay B, Forouhi NG, Fisher BM, Kesson CM, Sattar N: A comparison of glycaemic and metabol-
ic control over time among South Asian and European patients with Type 2 diabetes: results from follow-up in a routine diabetes clinic. Diabet Med, 2006; 23: 94–98.14. Fischbacher CM, Bhopal R, Steiner M, Morris AD, Chalmers J : Is there equity of service delivery and inter-mediate outcomes in South Asians with type 2 diabetes? Analysis of DARTS database and summary of UK publi-cations. J Public Health (Oxf), 2009; 31: 239–249.15. McElduff P, Edwards R, Burns JA, Young RJ, Heller R, Long B, Jones G, New JP: Comparison of processes and intermediate outcomes between South Asian and Eu-ropean patients with diabetes in Blackburn, North-West England. Diabet Med, 2005;22: 1226–1233.16. Hartz A, Kent S, James P, Xu Y, Kelly M, Daly J. Factors that influence improvement for patients with poorly controlled type 2 diabetes. Diabetes Res Clin Pract. 2006;74(3):227-32.17. Mendes Beatriz Valverde Ana, Fittipaldi Antônio Saraiva João, Neves Celestino Silva Raimundo, Chacra Roberto Antônio, Moreira Jr Duarte Edson. Prevalence and correlates of inadequate glycaemic control: results from a nationwide survey in 6,671 adults with diabetes in Brazil. Acta Diabetologica. 2010; 47(2):137-145.18. Chiu C-J, Wray LA. Factors predicting glycemic con-trol in middle-aged and older adults with type 2 diabetes. Prev Chronic Dis 2010;7(1):A08.19. Crosby,R., DiClemente, R.&Salazar,L.Research Meth-ods In Health Promotion. USA: Jossey-Bass, 200620. Dean, A., Sullivan, K. & Soe, M. Epidemiologic Sta-tistics for Health version, http://www.openepi.com/Menu/OE Menu.htm ; 2015[accessed 11.02.16].21. Osuji, C. U. , Nzerem, B. A., Dioka, C. E., Meludu, S. C. & Onwubuya, E. I. “Prevalence of diabetes mellitus in a group of women attending “August meeting” at Naze South East Nigeria,” Journal of Diabetes Mellitus, 2012;2(3), 321– 326.22. WHO. Obesity: preventing and managing the global epidemic. Report of a WHO consultation. World Health Organ Tech Rep Ser, 2000; 894:i-xii:1–253.23. Emmanuel M. M, Alexey M., Boyd M., Charles M. Glycaemic control in diabetic patients in Zambia, Pan Af-rican Medical Journal. 2014; 19:354 PubMed doi:10.11604/pamj.2014.19.354.5264.24. Nichols GA, Hillier TA, Javor K, Brown JB: Predic-tors of glycemic control in insulin-using adults with type 2 diabetes. Diabetes Care 2000, 23:273-277.25. Shorr RI, Franse LV, Resnick HE, Di Bari M, John-
African Health Sciences Vol 19 Issue 4, December, 2019 2827
son KC, Pahor M: Glycemic control of older adults with type 2 diabetes: Find Findings from the Third National Health and Nutrition Examination Survey, 1988–1994. J Am Geriatr Soc 2000, 48:264-267.26. Dannefer D. Cumulative advantage/disadvantage and the life course: cross-fertilizing age and social science the-ory. J Gerontol B Psychol Sci Soc Sci 2003;58(6):S327-37.27. Bhargava,A., Chan,V., Kimball,ES., & Oyer,DS. Ef-fects of Age on Glycemic Control in Patients With Type 2 Diabetes Treated with Insulin Detemir: A Post-Hoc Analysis of the PREDICTIVETM 303 Study. Drugs Ag-ing, 2016; 33:135–141. PubMed 28. Meneilly,GS., Ryan,AS., Minaker,KL., & Elahi,D. The Effect of Age and Glycemic Level on the Response of the b-Cell to Glucose-Dependent Insulinotropic Poly-peptide and Peripheral Tissue Sensitivity to Endogenous-ly Released Insulin. Journal of Clinical Endocrinology and Me-tabolism 1998;83(8): 2925- 293229. Sinclair A, Morley JE. How to manage diabetes mel-litus in older persons in the 21st century: applying these principles to long term diabetes care. J Am Med Dir Assoc. 2013;14(11):777–80.30. Kirkman MS, Briscoe VJ, Clark N, et al. Diabe-tes in older adults: a consensus report. Diabetes Care. 2012;35(12):2650–64.31. J. Barrot-de la Puente, M. Mata-Cases, J. Franch-Na-dal,X. Mundet-Tudur, A. Casellas, J. M. Fernandez-Real, & D. Mauricio. Older type 2 diabetic patients are more likely to achieve glycaemic and cardiovascular risk factors targets than younger patients: analysis of a primary care database. Int J Clin Pract, 2015; (69): 12, 1486–149532. Sushil,MI., Muneshwar,JN.&Khan,ST. To Study Body Mass Index, Waist Circumference, Waist Hip Ratio,Body Adiposity Index And Lipid Profile Level In Patients With Type-2 Diabetes Mellitus. OSR Journal of Dental and Medi-cal Sciences 2015;14(5): 98-101 33. Vazquez, G., Duval,S., Jacobs,DR., & Silventoinen,K. Comparison of Body Mass Index, Waist Circumference, and Waist/Hip Ratio in Predicting Incident Diabetes: A Meta-Analysis. Epidemiologic Reviews, 2007;9: 115–12834. Ashok,K . Prevalence of Glycemic Status, Obesity & Waist Circumference in Punjabi Type 2 Diabetics. Journal of Exercise Science and Physiotherapy, 2013; 9(1): 1-5.35. Ketema,EB. & Kibret,KT. Correlation of fasting and
postprandial plasma glucose with HbA1c in assessing gly-cemic control; systematic review and meta-analysis. Ar-chives of Public Health;2015; 73:43 PubMed DOI 10.1186/s13690-015-0088-636. Valensi, P., Husemoen,LN., Weatherall,J.& Monnier,L. Association of postprandial and fasting plasma glucose with HbA1c across the spectrum of glycaemic impair-ment in type 2 diabetes. Int J Clin Pract. 2017;71:e13041.37. Standards of medical care in diabetes—2010. Diabetes Care 2010;33(suppl 1):S11-61.38. Rutter MK, Nesto RW. Blood pressure, lipids and glu-cose in type 2 diabetes: how low should we go? Re-dis-covering personalized care. Eur Heart J, 2011;32:2247-55.39. Yoda, K., Inaba,M., Hamamoto,K., Yoda,M., Tsu-da,A., Mori,K., Yamada,S., Emoto,M., Koyama,H.& Imanishi,Y. Association between glycemic control and morning blood pressure surge with vascular endothelial dysfunction in type 2 DM patients. Diabetes Care, 2013 (Publish Ahead of Print, published online December 2, 2013)40. Vamos,EP., Matthew Harris,M., Millett,C., Pape,UJ., Khunti,K., Vasa Curcin,V., Molokhia,M.& Majeed,A. As-sociation of systolic and diastolic blood pressure and all cause mortality in people with newly diagnosed type 2 di-abetes: retrospective cohort study. BMJ, 2012; 345:e5567.41. Adams SA, Matthews CE, Ebbeling CB, Moore CG, Cunningham JE, Fulton J, et al. The effect of social de-sirability and social approval on self-reports of physical activity. Am J Epidemiol 2005;161(4):389-98. PubMed 42. Ketema,EB. & Kibret, KT. Correlation of fasting and postprandial plasma glucose with HbA1c in assessing gly-cemic control; systematic review and meta-analysis. Ar-chives of Public Health, 2015; 73:4343. Patel,S.,Nanda,R., Sahoo,S. & Mohapatra,E. Predic-tive Role of Fasting and PostPrandial Glucose towards Glycemic Control. National Journal of Laboratory Medicine, 2016; 5(4): BO15-BO2144. Hainer TA. Managing older adults with diabetes. J Am Acad Nurse Pract 2006;18(7):309-317.45. Brown AF, Mangione CM, Saliba D, Sarkisian CA; California Healthcare Foundation/American Geriatrics Society Panel on Improving Care for Elders With Diabe-tes. Guidelines for improving the care of the older person with diabetes mellitus. J Am Geriatr Soc 2003;51(5 Suppl Guidelines):S265-80.
African Health Sciences Vol 19 Issue 4, December, 20192828
Top Related
Copyright © 2022 FDOKUMEN

