


Bahasa
Halaman
Hukum


Post-Benchmarking Guide October 2020
Prepared by:

ESA CAM – Post-Benchmarking Guide
i
TABLE OF CONTENTS
Glossary .................................................................................................................................................. 1
1. Introduction ....................................................................................................................................... 3
1.1 After Benchmarking Guide Overview ......................................................................................... 3
2. PG&E Building Benchmarking Portal ................................................................................................ 4
2.1 Logging In .................................................................................................................................. 4
2.2 Manage Buildings ...................................................................................................................... 4
2.3 My Profile .................................................................................................................................. 5
2.4 Building Detail ............................................................................................................................ 5
3. Energy Star Portfolio Manager .......................................................................................................... 6
3.1 Logging In .................................................................................................................................. 6
3.2 Updating Account Settings ......................................................................................................... 6
3.3 ESPM Dashboard/Tabs ............................................................................................................. 7
3.4 Buildings .................................................................................................................................... 7
3.5 Maintaining ESPM Account ........................................................................................................ 9
3.5.1 Overlapping Data ................................................................................................................ 9
3.5.2 Missing Data ..................................................................................................................... 11
4. CEC Reporting – How to ................................................................................................................ 14
4.1 AB 802 Requirements: ............................................................................................................. 14
4.2 CEC Reporting: ........................................................................................................................ 14

ESA CAM – Post-Benchmarking Guide
1
GLOSSARY
Environmental Protection Agency (EPA) – An independent executive agency of the United States
federal government tasked with environmental protection matters.
Assembly Bill 802 (AB 802) – Statewide energy benchmarking and disclosure law, replacing the
previous bill, AB 1103. It requires buildings over 50,000 sq. ft. to report their energy usage on an annual
basis to the CEC via the EPA’s Energy Star Portfolio Manager software.
Benchmarking – A method used to determine whether a building is using more or less energy than its
peer facilities with similar characteristics such as occupancies, climates, and sizes.
California Energy Commission (CEC) – The state's primary energy policy and planning agency that is
committed to reducing energy costs and environmental impacts of energy use while ensuring a safe,
resilient, and reliable supply of energy.
Third-Party Benchmarking Service – Outside company that completes the benchmarking for a
property.
PG&E Building Benchmarking Portal (BMP) – Database that is used to find, consolidate, and track all
of a building or property’s energy meters. The data from these meters can then be linked with an
ENERGY STAR Portfolio Manager account for further analysis.
Energy Star Portfolio Manager (ESPM) – Online tool managed by the EPA that allows building owners
to measure and track energy usage and greenhouse gas emissions for their buildings.
ENERGY STAR Certification – Awarded to buildings and manufacturing plants that earn a score of 75
or higher on ENERGY STAR's 1-100 energy performance scale, indicating that the facility performs
better than at least 75% of similar buildings nationwide. The ENERGY STAR performance scale
accounts for differences in operating conditions, regional weather data, and other important
considerations.
ENERGY STAR Score – A measure of how well a property is performing relative to similar properties
when normalized for climate and operational characteristics. The 1-100 scale is set so that 1 represents
the worst performing buildings and 100 represents the best performing buildings. A score of 50 indicates
that a building is performing at the national median, considering its size, location, and operating
parameters.
ESA CAM Benchmarking Report – An appendix to the ESA CAM Audit Report that provides an in-
depth look into the property’s benchmarking information.
EUI – Energy Use Intensity is the energy use per square foot at a property (energy divided by square
foot). EUI enables you to compare different sized buildings.
Exchange Data - Allows an owner to select an organization (which is registered to use web services) to
exchange data with your ESPM account. The owner will be able to specify specific permissions regarding
whether the organization will be able to view or modify property, building, and meter information.

2
Full Access – The ability to view and edit your property in ESPM. With Full Access, the user can do
perform the same functions as the owner except delete the property. Full Access also comes with the
ability to "Share Forward,” which means the person with whom you share can also share that property
with others.
Greenhouse Gas (GHG) Emissions – The carbon dioxide (CO2), methane (CH4), and nitrous oxide
(N2O) gases released into the atmosphere as a result of energy consumption at the property. GHG
emissions are expressed in carbon dioxide equivalent (CO2e), a universal unit of measure that combines
the quantity and global warming potential of each GHG.
Mapping – The organization of gas and electric meters at a property. Usually used in reference to the
PG&E Building Benchmarking Portal.
Permissions – When the owner shares a property, they determine the specific information that is shared
and the specific actions that can performed on the property. There are four permission levels: Read Only
Access, Full Access, Custom Access, and Exchange Data. Usually used in reference to ESPM.
Read Only Access – The ability to view all information about a property but not to make any additions or
changes. For example, the person could view a property’s energy consumption information but could not
make corrections or add new energy bills. Usually used in reference to ESPM.
Site Energy Use – The annual amount of all the energy a property consumes on-site, regardless of the
source. It includes energy purchased from the grid or in bulk, as well as renewable energy generated and
consumed on-site such as from solar and wind.
Site EUI – The Site Energy Use divided by the property square foot.
Source Energy Use – The total amount of all the raw fuel required to operate your property, including
losses that take place during generation, transmission and distribution of the energy.
Source EUI – The Source Energy Use divided by the property square foot.

3
1. INTRODUCTION
Property level benchmarking is a program requirement for all properties that enroll in the Energy Savings
Assisance Common Area Measures (ESA CAM) Program. This stems from the California Energy
Commission’s (CEC) statewide energy benchmarking public disclosure requirement backed by Assembly
Bill (AB) 802. This program requirement can be met in two ways:
1. Property/Owner has hired a third party to benchmark the entire property using the PG&E
Benchmarking Portal and ENERGY STAR Portfolio Manager (ESPM) websites. Once the
benchmarking for the property is complete, the entity is required to share the property’s
benchmarking data with the ESA CAM Benchmarking team via the ESPM.
2. If the property has not been previously benchmarked by another entity, the ESA CAM
Benchmarking team will set up the PG&E Building Benchmarking Portal and ESPM accounts and
complete the benchmarking for the property.
Using the data provided by these two accounts, ESA CAM Benchmarking reports are created for each
property that enrolls in the program. Reports provide energy consumption, cost, and greenhouse gas
(GHG) emission information, as well as actionable goals. These reports also provide national and
regional comparisons to similar properties with tailored recommendations to empower customers to
address overall property energy consumption, as well as spikes in monthly energy usage.
The benchmarking services provided by the ESA CAM meet the benchmarking requirements set
by Assembly Bill 802. If your property is required to report its energy data to the CEC to comply with the
AB802, this can be done using the ESPM account that was created for your property. For steps on how
to report your property to the CEC, please read section titled CEC Reporting – How To (Section 4).
1.1 After Benchmarking Guide Overview
The purpose of this guide is to provide a high-level overview of the PG&E Building Benchmarking Portal
and ESPM accounts created for each property or portfolio of properties, as well as, describe how to
maintain these accounts, and report property energy data to the CEC.
It should be noted that after a property’s benchmarking has been completed, each benchmarking
account, PG&E’s Portfolio Manager and ESPM, should automatically update a property’s energy data on
a monthly basis. However, please review each property’s energy data before reporting its energy usage
to the CEC, as the systems sometimes miss or duplicate energy data. This is detailed further in Section
2.2 and Section 3.5.
4
2. PG&E BUILDING BENCHMARKING PORTAL
The Building Benchmarking Portal is a PG&E database that is used to find, consolidate, and track all of a
building or property’s energy meters. The data from these meters can then be linked with an ESPM
account for further analysis. The Building Benchmarking Portal account created for ESA CAM properties
should not need much, if any, yearly maintenance, however, a brief overview of the account is described
in the sections below.
2.1 Logging In
A PG&E Building Benchmarking Portal account has already been set
up for your property. The account log-in username and password can
be found on page 4, under Account Login of the property’s ESA CAM
Benchmarking Report. Navigate to the Building Benchmarking Portal
and log-in with your username and password.
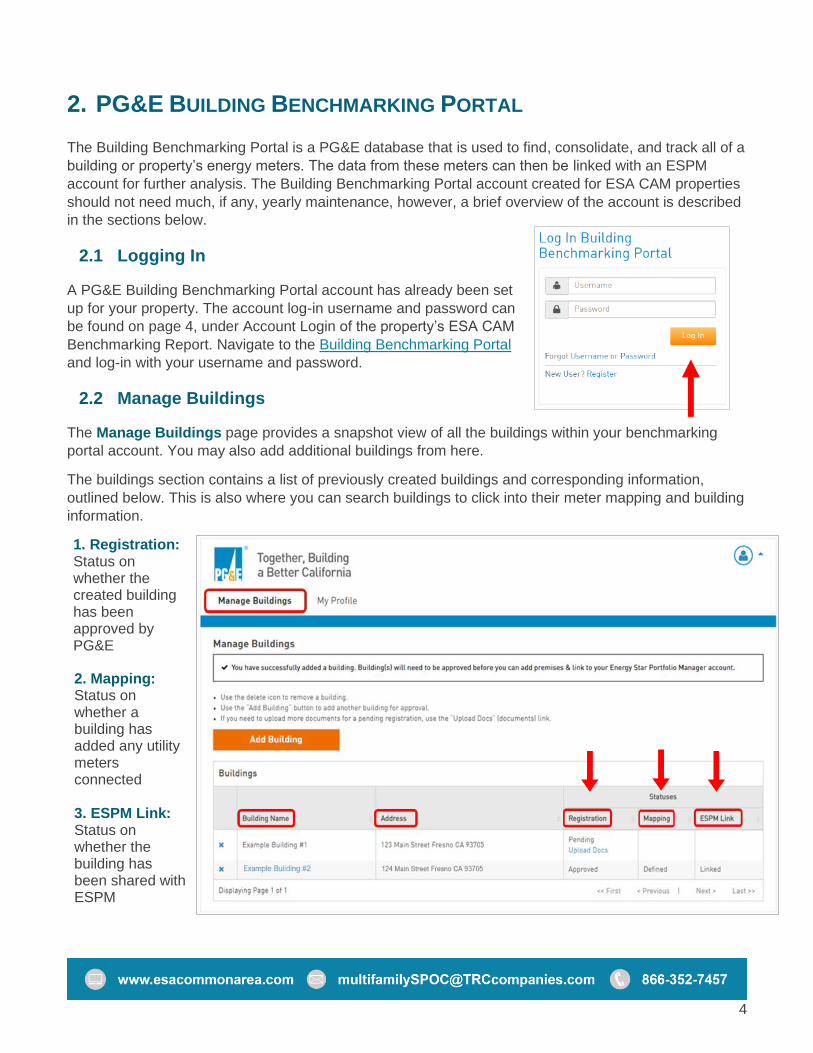
2.2 Manage Buildings
The Manage Buildings page provides a snapshot view of all the buildings within your benchmarking
portal account. You may also add additional buildings from here.
The buildings section contains a list of previously created buildings and corresponding information,
outlined below. This is also where you can search buildings to click into their meter mapping and building
information.
1. Registration: Status on whether the created building has been approved by PG&E
2. Mapping: Status on whether a building has added any utility meters connected
3. ESPM Link: Status on whether the building has been shared with ESPM

5
2.3 My Profile
The My Profile page contains information about the
account such as the owner’s name, email, username,
and security question. This is also where you can
update account information such as email address,
password, and security question.
The default security question was established by
selecting “The city I was born in” and using the
applicant’s city from the ESA CAM Application.
2.4 Building Detail
To navigate to the Buildings Detail page, click on a
building name in the Manage Buildings tab. The
Building Detail page contains additional information
about the property including its meter mapping. For
more information regarding the meter mapping and
unmapping process, please refer to the document
created by PG&E - Building Benchmarking Portal – Guidance and Instruction.
1. Energy Star Portfolio Manager
a. User ID – account number for BMP used to share buildings with ESPM
b. Building ID – specific Building ID number used to share the building with ESPM
2. Meter Status (Gas/Electric)
a. Linked – Gas/Electric meters successfully linked with ESPM
b. Not Linked – Gas/Electric meters not linked with ESPM
3. Premise – specific addresses for each meter associated with the building
4. View Meter IDs - Contains the gas/electric meter IDs for each mapped meter

6
3. ENERGY STAR PORTFOLIO MANAGER
ESPM is an online tool managed by the EPA that allows building owners to measure and track energy
usage and GHG emissions for their buildings. The CEC requires that building data be reported through
ESPM because it offers a standardized way to compare different buildings and their energy usage on a
national scale.
3.1 Logging In
An ESPM account has already been set up for your
property. The account log-in username and
password can be found on page 4, under Account
Login of the property’s ESA CAM Benchmarking
Report. Navigate to ENERGY STAR Portfolio
Manager and log-in with your username and
password.
3.2 Updating Account Settings
Upon first logging in, navigate to Account Setting in the top right corner of the webpage. Here you may
update the ESA CAM Benchmarking placeholder account information with your current primary contact
information.
The following tabs and fields will need to be updated with new information pertaining to the building
management team:
• About Yourself – update name, organization, job title, email, phone, and address
• Password – update as needed/necessary
• Your Preferences – some customizable options, but should largely stay the same

7
3.3 ESPM Dashboard/Tabs
1. My Portfolio is the home page where you can create a new building or navigate to previously
created buildings. It also contains a snapshot of various metrics for each building and an
overview of your entire portfolio’s energy use.
2. Sharing is the location where you can share access to a property or allow others to view it. The
first person we share a property with is Pacific Gas and Electric Whole Building which connects
the PG&E Benchmarking Portal with ESPM to transfer meter data.
3. Reporting is where one can download various reports on their portfolio or buildings energy use
and beyond. There are a variety of reports that explore different metrics including Total GHG
Intensity and others.
4. Recognition contains information on the status of buildings who are aiming to gain ENERGY
STAR certification. For more information, please visit the ENERGY STAR webpage.
3.4 Buildings
Clicking on a buildings name from the MyPortfolio homepage will take you into that specific property’s
page and provide further information on the building. For ESA CAM purposes, only the Summary,
Details, Energy, and Goals tabs were used, however, using the Water, Waste & Material, and Design
tabs may provide a more comprehensive view of a property’s resource and GHG metrics.

8
1. Summary - Like the Homepage, the Summary tab for each building provides a snapshot view of
the building and includes various metrics. It also displays who has access to the property data.
2. Details - The Details tab contains information about the building
itself such as gross floor area, total number of residential living
units, and number of bedrooms. You can edit this information by
selecting “I want to…” under “Action” and selecting “Correct
Mistakes.”
• The Basic Information section also contains information
you can update including the name, address, year built, etc.
3. Energy - The Energy tab provides information regarding the building’s meters and their usage
data. There is a graph displaying energy use by calendar month to provide a snapshot of energy
use. You can click into each meter to see monthly usage and cost data for your building’s energy
meters. This is where you will navigate to perform meter maintenance (Section 3.5).
4. Goals - The Goals section displays the building’s baseline metrics compared to a target goal of
energy reduction. This is the section that makes up most of the information found in the ESA
CAM Benchmarking Report. You can manipulate the baselines and targets in several ways.
Typically, for a property below an ENERGY STAR Score of 75, we set the target to 75 and for a
property above 75 we set the target at 10% Better than Baseline Source EUI.
9
3.5 Maintaining ESPM Account
New energy data from the PG&E Building Benchmarking Portal should be automatically uploaded
monthly to the properties in ESPM. However, sometimes the system will send over the same month’s
data twice creating what ESPM calls overlapping data, or sometimes the system will miss a month. We
recommend reviewing a property’s energy data for these two issues before submitting data to the CEC. It
is also important to clean up the meter data because ESPM cannot generate an ENERGY STAR Score
for the year that has missing or overlapping energy data.
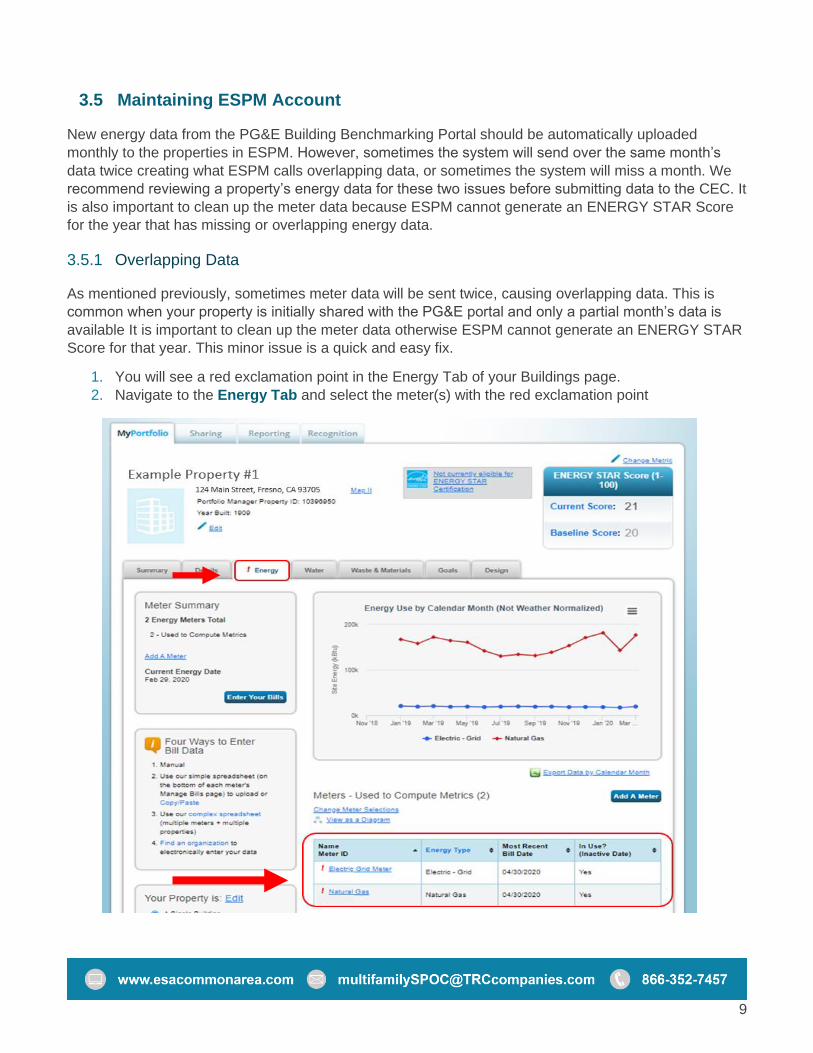
3.5.1 Overlapping Data
As mentioned previously, sometimes meter data will be sent twice, causing overlapping data. This is
common when your property is initially shared with the PG&E portal and only a partial month’s data is
available It is important to clean up the meter data otherwise ESPM cannot generate an ENERGY STAR
Score for that year. This minor issue is a quick and easy fix.
1. You will see a red exclamation point in the Energy Tab of your Buildings page.
2. Navigate to the Energy Tab and select the meter(s) with the red exclamation point

10
3. Check the box(es) on the left of the earlier month(s) of the duplicated data. This is important as
you want to delete the month with the incomplete data, which is often the earlier months which
will show lower usage and cost data.
4. Scroll to the bottom of the page. Click on Delete Selected Entries and then select Save Bills
5. The red exclamations point will disappear once the page has been refreshed and the meters
have been removed successfully. Repeat for additional meters.

11
3.5.2 Missing Data
In addition to overlapping data, sometimes the data being sent from the PG&E Portal to ESPM will skip a month. You will need to unshare and reshare the property with the PG&E Portal.
1. Similar to overlapping data, you will see a red exclamation point in the Energy Tab and by the meter(s).
2. Go to the Summary tab of your property profile in Portfolio Manager.
3. Under the Summary tab, scroll down to the Sharing this Property section. In the I want to dropdown box to the right of Pacific Gas and Electric Company (pge_agg_benchmark), choose Remove Contact’s Access to Property.
4. A pop-up window will ask you to confirm your intentions to remove PG&E’s access to this property. Click Continue. Next, we will establish a fresh site share connection with PG&E
5. Click the Sharing tab at the top of the page. Click Share (or Edit Access to) a Property.

12
6. Select the Property you wish to Re-share and select the pge_agg_benchmark contact for re-sharing.
7. Select Personalized Sharing & Exchange Data (Custom Orders), click Continue and select the Exchange Data button
8. A pop-up screen will appear and should already be populated with the Building ID and User ID
data from the PG&E Portal.

13
9. Set Property Information, Aggregate Electric, Aggregate Natural Gas, and Goals to Full Access (nothing should be set to Read Only). Share Forward may be selected as yes or no, depending on preference – it does not affect this process.
10. Finally, click Apply Selections and Authorize Exchange then Share Property(ies). Once you
complete the un-share / re-share energy usage data will upload within 24 hours.
11. After 24 hours, your property’s energy data should be reshared. However, you will notice that the
red exclamation point is still there, this is because now there are overlapping meters
12. Remove all overlapping or repeating data entries. Please see the Overlapping Data section (3.5.1) for more information.

14
4. CEC REPORTING – HOW TO
4.1 AB 802 Requirements:
Buildings or properties that meet all of the following criteria are required to be reported to the CEC:
1. If the total square footage of an
individual building, or the sum of
buildings on a property, is 50,000
square feet or more.
2. If an individial building or property has
17 or more residential units.
3. If a property has any shared energy
meters between buildings.
Note: Shared energy meters include any
gas or electric meters that provide service
to two or more buildings and is not limited to
master metered properties.
4.2 CEC Reporting:
1. Follow this link to the CEC website -
Building Energy Benchmarking
Program Ppage.
2. Click on the link titled Property Report
with Energy Data or Report 20XX
Energy Use. The title of the link may
change year over year but the location
on the page and the image should be
the same as what is shown in the
image to the right.
3. The link will take you to ESPM. Log-in
using your username and password.
4. After logging-in, you will be taken to the
2019 California Benchmarking Data
Request page.

15
5. Scroll to the bottom of the page to
the About your Response and Your
Response sections.
a. In the About your Response
section, select the user
whose data is being
submitted.
i. Select myself to
submit the response
on your own behalf.
ii. Select someone else
to submit the response
on behalf of a contact.
A drop down will
appear allowing you to
select the contact.
b. In the Your Response section:
i. No action is required in the Timeframe section because the CEC has specified the
timeframe for the request. You will not be able to change it.
ii. Under the Properties section, you may select one or multiple properties that are
ready to be submitted.
1. The drop down will display every every property and building in your
account. Since you only want to submit the total property data, scroll until
you see the name of the property that is ready to be submitted.
c. Click Generate Response Preview after completing each section.

16
6. After the preview response is generated, you will be taken to the Templates & Reports page. Find
the row named 2019 California Benchmarking Request with Energy Use Data and select Send
Response under the Action column.
7. Send Response:
a. Select or enter the email of anyone else you want to receive a confirmation email.
b. Select the format of your data for the email attachment (Excel is standard).
c. E-sign your response by entering your username and password. Then click E-Sign
Response.
8. Click Send Data to submit your energy data response. You should receive a confirmation email
with a receipt and copy of the data submitted.
Top Related
Copyright © 2022 FDOKUMEN

