


Bahasa
Halaman
Hukum

The Science of the Total Environment, 63 (1987) 259-270 Elsevier Science Publishers B.V., Amsterdam - Printed in The Netherlands
POLLUTION EPISODES AT VENICE RELATED TO WEATHER TYPES: AN ANALYSIS FOR A BETTER PREDICTABILITY
ADRIANA BERNARDI and DARIO CAMUFFO
National Research Council, CNR-ICTR, Corso Stati Uniti 4, 1-35020 Padova (Italy)
ALDO DEL TURCO
Ente Zona Industriale di Porto Marghera, Accademia 1056, 1-30123 Venice (Italy)
DINO GAIDANO
Montedipe Research Center, Via delta Chimica, 1-30175 Porto Marghera, Venice (Italy)
IRMA LAV AGNINI
Environmental Science Department, University of Venice, Calle larga S. Marta 2137, 1-30123 Venice (Italy)
(Received January 15th, 1986; accepted August 16th, 1986)
ABSTRACT
259
In order to obtain a rational strategy for the control and management of emissions from the industrial area of Venice, determination of the air quality is made from different perspectives. A source-receptor oriented approach shows a remarkable scatter of data due to the complex source field and variability of atmospheric conditions at a coastal site. As many pollution episodes are initiated by local diffusion potentia Is induced by the interaction between topographic irregularities (i.e. Alpine chain and Adriatic Sea) and the mesoscale atmospheric circulation system, a correlation between pollution events and synoptic conditions is made. Two periods of two years each were considered, the former characterized by very frequent, moderate episodes, the latter by more rare but potentially more severe episodes, although the emission rate was reduced. Four different criteria (i.e. weather types as classified by the U.K. Meteorological Office, by Borghi and Giuliacci, and by Urbani, and the passage of fronts) are considered and compared in order to describe the synoptic conditions and to make a reasonable prediction of the local dynamic climatology. A risk index (RI) is computed for each weather type. The U.K. classification appears to be the most suitable as it classifies the maximum number of synoptic maps and has the greatest spread of RI, thus making a more sound prediction. The analysis shows that the pollution episodes are associated with instability phenomena, i.e. passage of fronts or the onset of moderate to fresh winds, and not with stationary conditions. Also, the areal extension over which the highest pollution levels are recorded is related to particular weather types. The statistics of the meteorological weather types occurring during the pollution events give satisfactory results for some weather types, especially for those correlating highly or poorly with pollution events.
INTRODUCTION AND CRITERIA USED
This research was carried out to elucidate whether or not the determination of the quality of the air in Venice could be made on the basis of local meteo-
0048-9697/87/$03.50 © 1987 Elsevier Science Publishers B.V.
260
rological conditions (see, e.g., Loewenstein, 1973; Zannetti et al., 1977; King and Vubovich, 1982) as deduced from the synoptic pressure pattern, thus permitting a rational strategy for the control and management of emissions from the nearby industrial area. In fact, for any given local meteorological condition and therefore diffusion potential, the pollution level is a function of the emission rate. However, in the industrial area, the emission is more or less stationary during the whole year and the local meteorological condition is related to the synoptic situation. In turn, the synoptic situation induces certain and recurring effects which are due to the interaction between the general circulation of the air and the local topography. Sea water and the Alpine mountain chain are particularly important (Camuffo, 1980, 1981, 1982; Camuffo et al., 1979a,b, 1980, 1981, 1984; Lavagnini et al., 1986). It was decided to study the air pollution problem from two different perspectives and to compare them on the basis of the reliability of evaluating 'pollution episodes'. 'Pollution episodes' are defined as pollution events where the S02 concentration exceeds the 50 ppb threshold.
The first approach considered the pollution episodes from the source-receptor oriented aspect. An air quality simulation model was used as suggested by previous work (Lavagnini et al., 1982). The model is similar to Shir and Shieh's and adapted for the area of Venice by Marziano et al. (1976, 1978). The model is based on the assumption that the concentration, C, of a pollutant gas is the solution of the differential equation:
(1)
where V is the wind velocity, a function of space and time; V is the gradient operator; KH and Ky the horizontal and vertical turbulent diffusion coefficients (Ky is a function of z and atmospheric stability); V~ is the horizontal Laplacian of C, and Q the intensity of the emitting source. The chemical reactivity of pollutants has been neglected as only pollution close to the sources is considered.
The failure of this approach in gaining an insight into practical questions in which we are interested, initiated the investigation of the statistical relationship between meteorological conditions and pollution events. It was decided to analyze the correlation between the synoptic situation and pollution episodes, in order to determine their frequency and test the reliability of a weather type for forecast and prevention of pollution episodes.
For the purposes of this analysis four years were considered and divided into two periods (i.e. 1978--79 and 1982-83). The two periods were so chosen to account for two different constant emission rates. The first 2-year period was characterized by higher emission rates and very frequent episodes, which occurred mostly during the winter. In the second 2-year period, only few episodes occurred, due to the different strategy used with regards to the emissions i.e. reduced rate and increased height of some stacks. As the number of events was fewer, the statistics were poorer, but the pollution episodes were potentially more severe and therefore physically more representative.

261
The different number of events in the two periods suggests that meteorological conditions associated with the very frequent episodes during the first period favoured the more common, moderate pollution events. The conditions associated with the rarer pollution events of the second period, in which the same concentrations were reached even though the emissions were reduced, favoured potentially higher pollution levels. With this distinction in mind, the data of the two periods were examined separately.
The synoptic situations which occurred during the episodes were first considered on the basis of three different classifications in order to determine which would be the most convenient when describing the meteorological situation associated with the local dynamic climatology and to make a reasonable prediction. Among the more widely used criteria, three were chosen for the purpose of this research; the first, used by the U.K. Meteorological Service (1962) and two used by the Italian Meteorological Service, i.e. Borghi and Giuliacci (1979) and Urbani (1955). These three classifications (reported in the Appendix) were selected as the most suitable because they were expressly established for the consideration of the weather in the Mediterranean and in particular in northern Italy.
A further classification criterion is based on the passage of fronts and instability lines, which are critical for pollution events.
APPLICATION OF THE DIFFUSION MODEL TO THE STUDY OF S02 DISTRIBUTION
The integration of Eqn (1) requires values for V, KH and Q as a function of time. The input parameters have been described extensively elsewhere (Marziano et al., 1976; Lavagnini et al., 1982).
The differential equation was integrated using a finite difference scheme. The advection and horizontal diffusion terms were approximated by secondorder central difference, and the Crank-Nicholson formula was used for the vertical diffusion.
The urban and industrial area of Venice (Fig. 1) was divided into grids, each of 500 m2
• Vertical grids with size increasing with height were also considered. The height of the model was assumed to be time-dependent taking into account the diurnal evolution of the mixing layer extending up to a variable height, ranging from 500 to 1000 m depending on the meteorological conditions.
In the application of the air quality simulation model, 15 'scenarios' occurring during 1978 were chosen, characterized by stationary meteorological conditions. The model considered the contribution of 26 main stacks of industrial plants.
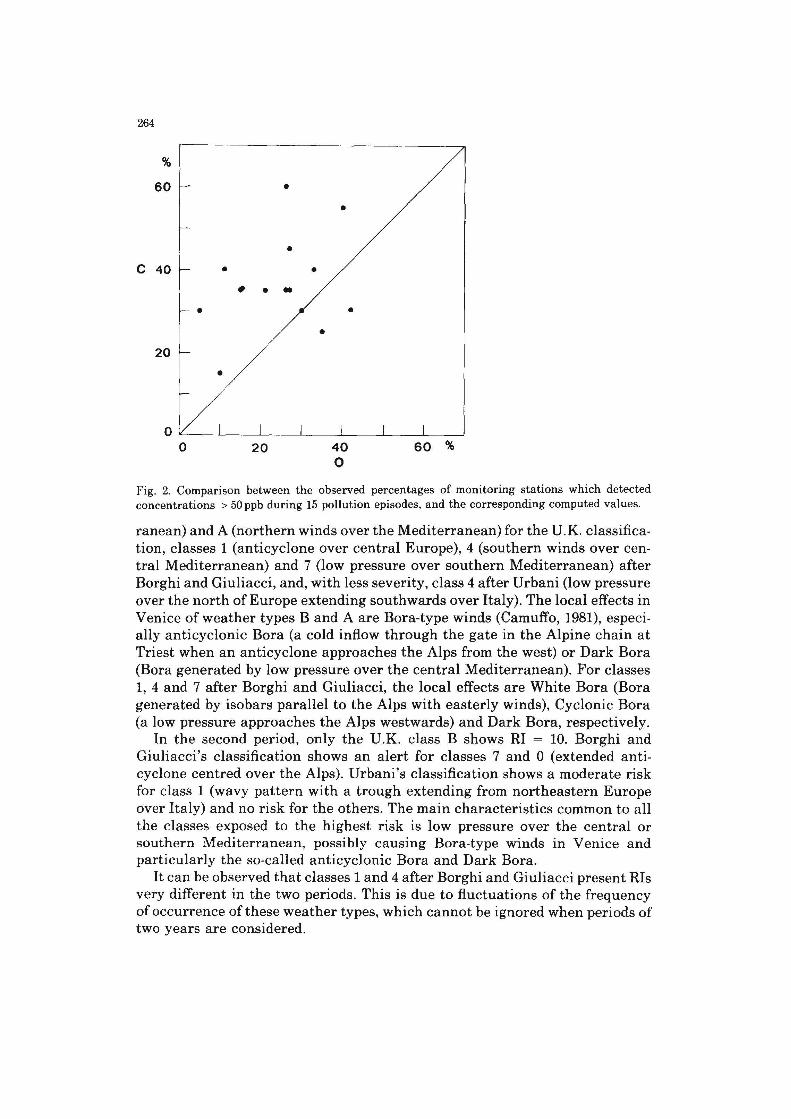
Figure 2 shows the percentage of monitoring stations which were affected by concentrations> 50 ppb during the episodes, as deduced from experimental and computed values. In general, the model overestimates the groundlevel concentrations. The departures ofthe computed from the observed values indicate that the atmosphere (sea-land transition area) causes a major dispersion locally of the pollutants with respect to the model.
As a measure ofthe statistical significance ofthis model we refer to the mean

262
(b)
Fig. 1. (a) Map of the northern Adriatic, and (b) magnification showing the monitoring network in the industrial area west of Venice and in Venice itself.

263
percentage of stations which detected 802 concentrations higher than the threshold. The mean percentage deduced from experimental concentration data was 24, with a standard deviation of 11; the corresponding values deduced from the calculated data were 36 and 11, respectively. The relative departures, i.e. the differences between the percentages computed and observed, divided by the observed departures show a noticeable scatter, (]" = 1.31, which discourages the use of this source-receptor oriented approach, due to the complicated pattern of sources and variability of atmospheric conditions in a coastal zone.
Another receptor-only approach, based on a generalized gamma distribution, has been described by Lavagnini and Camuffo (1987). From the analysis of the distribution functions for the concentration frequencies which are seasonally observed at each station, two basic patterns can be seen. They correspond to stations with the minimum or maximum value for the shapeparameter in the warm season, all other stations being characterized by a seasonal trend which may be regarded as a superposition of the two basic patterns. The shape-parameter values of the two extreme distribution functions exhibit the different physical features of the corresponding stations and represent the heterogeneous behaviour of the zone mathematically and quantitatively.
These different approaches show that deterministic models in this complex area do not give satisfactory results, so that a statistical approach seems to be preferable.
ANALYSIS OF THE SYNOPTIC CLASSIFICATIONS AND COMMENTS
The number of pollution episodes (NJ for each weather type according to the different classifications is shown in Table 1.
For both periods the U.K. classification is more suitable for classifying the largest number of synoptic situations, as it is here that the lowest number of non-classifiable cases is found. However, as more cases can be grouped, the characterization is poorer for each particular meteorological condition associated with the events considered. Therefore, a high number of events is not an index of risk in itself, but must be normalized with reference to the occurrence of the related weather type. The risk index (RI) was obtained by dividing Ni by the frequency of occurrence of the related weather type. The normalized values of RI are expressed as integer numbers between 0 (no risk) and 10 (certain occurrence of the pollution event). The statistics of synoptic maps have been compiled according to the U.K. Meteorological Office, Urbani, and Borghi and Giuliacci for the months between November and April and the period 1881- 1967 for the 28 weather types reported with their relative frequency by Reiter (1975). As these weather types were obtained from an unbroken 86-year period their frequency can be considered statistically representative.
In the first period when the frequency of the pollution events was high (282 cases) the risk index is generally higher than in the second period for the rarer but more severe episodes. In the first period the highest RIs are for: classs B (anticyclone over northern Europe and lower pressure over the Mediter-
264
%
60
C 40 • •
•
20
•
o
•
• •
• -
20
•
•
40 o
•
60 %
Fig. 2. Comparison between the observed percentages of monitoring stations which detected concentrations > 50 ppb during 15 pollution episodes, and the corresponding computed values.
ranean) and A (northern winds over the Mediterranean) for the U.K. classification, classes 1 (anticyclone over central Europe), 4 (southern winds over central Mediterranean) and 7 (low pressure over southern Mediterranean) after Borghi and Giuliacci, and, with less severity, class 4 after Urbani (low pressure over the north of Europe extending southwards over Italy). The local effects in Venice of weather types B and A are Bora-type winds (Camuffo, 1981), especially anticyclonic Bora (a cold inflow through the gate in the Alpine chain at Triest when an anticyclone approaches the Alps from the west) or Dark Bora (Bora generated by low pressure over the central Mediterranean). For classes 1, 4 and 7 after Borghi and Giuliacci, the local effects are White Bora (Bora generated by isobars parallel to the Alps with easterly winds), Cyclonic Bora (a low pressure approaches the Alps westwards) and Dark Bora, respectively.
In the second period, only the U.K. class B shows RI = 10. Borghi and Giuliacci's classification shows an alert for classes 7 and 0 (extended anticyclone centred over the Alps). Urbani's classification shows a moderate risk for class 1 (wavy pattern with a trough extending from northeastern Europe over Italy) and no risk for the others. The main characteristics common to all the classes exposed to the highest risk is low pressure over the central or southern Mediterranean, possibly causing Bora-type winds in Venice and particularly the so-called anticyclonic Bora and Dark Bora.
It can be observed that classes 1 and 4 after Borghi and Giuliacci present RIs very different in the two periods. This is due to fluctuations of the frequency of occurrence of these weather types, which cannot be ignored when periods of two years are considered.

265
TABLE 1
Number of pollution events (Ni) for each weather type and risk index (RI) according to U.K. Meteorological Service (UK), Borghi and Giuliacci (BG) and Urbani (U)
(a) Period 1978-79 UK A B C D E Ne"
Ni 38 27 53 57 25 82 RI 9 10 3 7
BG 0 1 2 3 4 5 6 7 Ne Ni 9 37 4 12 17 27 15 21 140 RI 7 10 2 4 10 5 10
U 1 2 3 4 5 6 7 Ne Ni 4 13 18 26 6 6 1 140 RI 4 2 3 6 1
(b) Period 1982-83 UK A B C D E NC
Ni 16 16 21 17 30 RI 4 10 1 3
BG 0 1 2 3 4 5 6 7 Ne Ni 7 8 7 5 3 4 8 14 45 RI 6 3 3 2 3 1 1 7
U 1 2 3 4 5 6 7 Ne Ni 4 8 7 4 4 4 3 67 RI 4 1 1 1 2
a Ne = not classifiable. b Weather type not reported in Reiter (1975).
It should be noted that, in Venice, mesoscale circulations are locally disturbed by orographic effects, except in the case of westerly winds, which blow along the Po Valley and are less affected by the Alpine chain. In the other cases, reliable forecasting may be made only if the contribution of the local scale is correctly evaluated. The local circulations and the interactions between the air mass and the Adriatic Sea and Alpine chain should be taken into particular consideration, as has been observed in many field studies. For example, when a western anticyclonic area approaches the Alps, the northern air masses can invade the northern Adriatic through the Triest gate, giving rise to an anticyclonic Bora at Venice with a wide range of wind speed. In the case of a cyclonic area, the dynamic pressure field associated with the southern air masses passing over the Alps causes the northern Adriatic to be subjected to a cyclonic Bora. Locally the wind direction may be the same but the atmospheric stability, and therefore the diffusion potential, is different. In this case, in addition to a qualitative analysis of the weather type which is initiated locally, a quantitative forecast of both the wind speed and atmospheric stability (dynamic and thermal) is required.
The frequency of the pollution episodes grouped according to the passage of
266
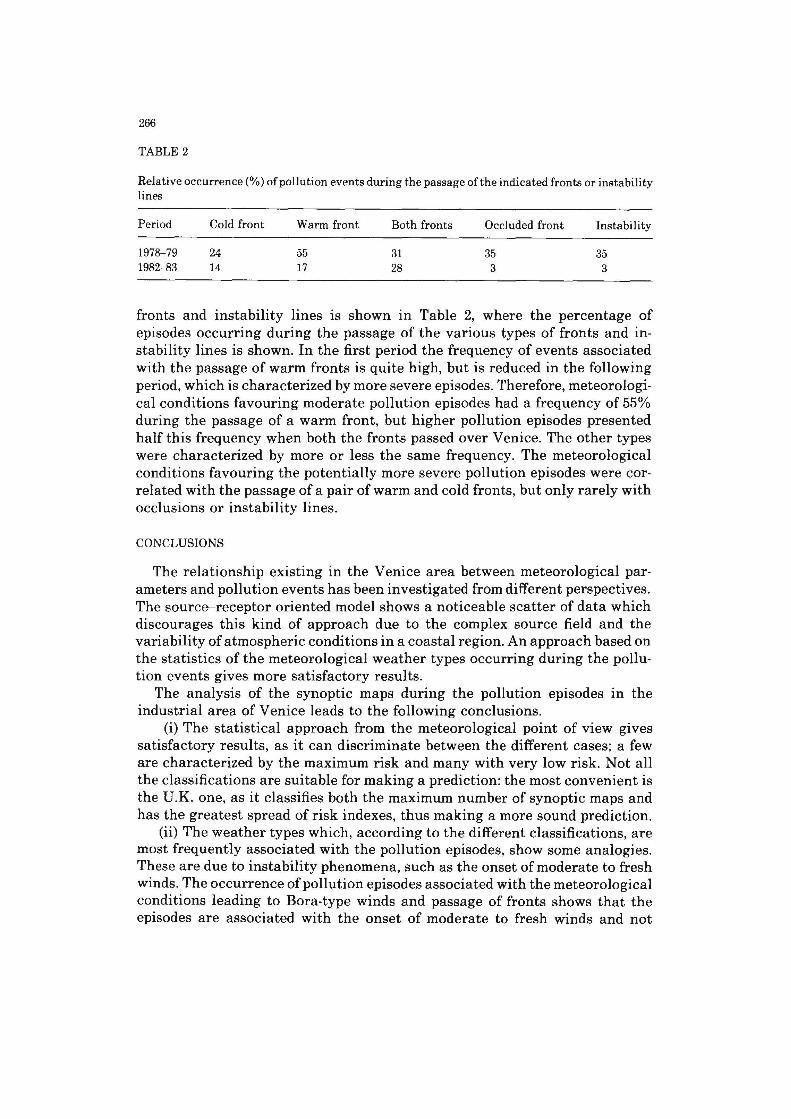
TABLE 2
Relative occurrence (%) of pollution events during the passage of the indicated fronts or instability lines
Period
1978-79 1982-83
Cold front
24 14
Warm front
55 17
Both fronts
31 28
Occluded front
35 3
Instabili ty
35 3
fronts and instability lines is shown in Table 2, where the percentage of episodes occurring during the passage of the various types of fronts and instability lines is shown. In the first period the frequency of events associated with the passage of warm fronts is quite high, but is reduced in the following period, which is characterized by more severe episodes. Therefore, meteorological conditions favouring moderate pollution episodes had a frequency of 55% during the passage of a warm front, but higher pollution episodes presented half this frequency when both the fronts passed over Venice. The other types were characterized by more or less the same frequency. The meteorological conditions favouring the potentially more severe pollution episodes were correlated with the passage of a pair of warm and cold fronts, but only rarely with occlusions or instability lines.
CONCLUSIONS
The relationship existing in the Venice area between meteorological parameters and pollution events has been investigated from different perspectives. The source--receptor oriented model shows a noticeable scatter of data which discourages this kind of approach due to the complex source field and the variability of atmospheric conditions in a coastal region. An approach based on the statistics of the meteorological weather types occurring during the pollution events gives more satisfactory results.
The analysis of the synoptic maps during the pollution episodes in the industrial area of Venice leads to the following conclusions.
(i) The statistical approach from the meteorological point of view gives satisfactory results, as it can discriminate between the different cases; a few are characterized by the maximum risk and many with very low risk. Not all the classifications are suitable for making a prediction: the most convenient is the U.K. one, as it classifies both the maximum number of synoptic maps and has the greatest spread of risk indexes, thus making a more sound prediction.
(ii) The weather types which, according to the different classifications, are most frequently associated with the pollution episodes, show some analogies. These are due to instability phenomena, such as the onset of moderate to fresh winds. The occurrence of pollution episodes associated with the meteorological conditions leading to Bora-type winds and passage of fronts shows that the episodes are associated with the onset of moderate to fresh winds and not
267
stationary winds. Therefore, the pollution episodes are more dependent on instability rather than stationary meteorological conditions. The Alps are a natural shield against the synoptic circulations, so that the local circulation is due to land and sea breezes and cold Bora-type inflows from the Triest gate. As most of the sources in the industrial area are tall stacks, the light winds associated with the breezes cannot bring the plumes down to ground level; the fresh wind associated with a mature Bora-type wind dilutes the emissions so that the ground concentration remains low; the onset of the wind may cause severe fumigations due to the presence of internal layers over the mainland and the lagoon with different stability.
(iii) The number of pollution events is higher during the cold season than during the warm season, thus showing a strong seasonal dependence. The frequent winter events confirm the unfavourable dynamics of the local climate. In fact, during winter the general conditions of atmospheric stability often result in fumigation due to the instability created by the water of the lagoon, which is warmer than the atmosphere above it. Moderate winds can transport the boundary of the unstable layer for a short distance inland and eventually destroy it. In addition, the heat island due to the industrial area favours thermal instability, and large buildings cause further turbulence.
(iv) Warm fronts are more efficient than cold fronts, occluded fronts or instability lines in causing pollution episodes. In the second period, representative of potentially higher pollution levels, the passage of both warm and cold fronts in one day increased the frequency of pollution episodes.
(v) The statistics of the number of monitoring stations recording levels above the chosen threshold shows also that the areal extension of the episode can be associated with the weather type The largest extensions are not frequent and are associated with westerly winds, and in this case ~ 50% of the industrial area is affected by high concentrations; ~ 30% is affected during the more frequent easterly winds.
ACKNOWLEDGEMENTS
This study was supported by the National Research Council, Progetto Finalizzato Energetica and the Ente dell a Zona Industriale di Porto Marghera.
APPENDIX
Weather types
(i) The classification adopted by the U.K. Meteorological Office, the most general, is based on the positions, relative to the Mediterranean area, of the anticyclones and, to a lesser extent, on the positions of major low-pressure systems surrounding the area. In fact, they exert a controlling influence on weather dynamics. The weather types are:

268
Type A: An anticyclone or ridge of high pressure lies over the north-eastern Atlantic or British Isles. To the east of this lies a depression causing a flow of northerly winds towards the Mediterranean. The air temperature drops at Venice. Pressure is relatively low over the Mediterranean. Cyclogenesis may occur in the western Mediterranean. This type of weather is often associated with blocking.
Sub-type AI: An extensive anticyclonic area also lies over eastern Europe and a trough extends from the Mediterranean north or north-eastwards between the two anticyclones. Frontogenesis may be favoured.
Type B: Northern Europe is dominated by an anticyclone. Pressure is relatively low over the Mediterranean.
Sub-type BI: To the east of the north European anticyclone, a depression lies over Russia or western Siberia. Dark Bora (Camuffo, 1981) and cyclogenesis may occur, causing 'high water' at Venice in the cold season.
Sub-type B2: The north European anticyclone extends into Siberia and a low pressure lies to the south, from the eastern borders of the Mediterranean eastwards.
Sub-type B3: The north European anticyclone extends eastwards into Siberia and pressure is also high in the south as far as Syria and Palestine. Dark Bora and cyclogenesis may occur, causing 'high water' at Venice in the cold season.
Type C: Deep depressions dominate the middle latitudes of Europe. Westerly winds prevail over the greater part of the Mediterranean. Maritime air flows over the Mediterranean and rainfall is frequent at Venice.
Type D: An anticyclone dominates central and southern Europe causing easterly winds over the greater part of the Mediterranean. Pressure is relatively low over northern Europe. White Bora and clear sky are favoured at Venice.
Type E: An anticyclone covers most ofthe Mediterranean area giving generally light winds, mainly westerly in the north, easterly in the south, and northerly in the east. Pressure is relatively low over central Europe. During the cold season showers may occur at Venice; fine weather during the warmer season.
(ii) Borghi and Giuliacci's classification was especially conceived for northern Italy, and is based on the positions of cyclonic and anticyclonic areas which give rise to the circulation of air masses, particularly to the Po Valley. Namely:
Type 0: An anticyclone lies over the whole of Europe and its centre lies over Italy. In the Po Valley, continental, tropical or maritime polar air prevails.
Type 1: An anticyclone in the south-west and a depression in the north-east of Italy cause a flow from north-north west. Cases of 'anticyclonic Bora' may occur in the northern Adriatic (Camuffo et aI., 1984).
Type 2: A deep depression with two centres, in the north-west Adriatic and south-eastern Mediterranean, causes an easterly flow of tropical air to northern Italy.
Type 3: Maritime polar and maritime arctic air flow over northern Italy. In
269
this case an anticyclone dominates the south-west region of the Atlantic, and a depression in north-east Europe extends into Russia.
Type 4: A deep depression extends from the British Isles to the western Mediterranean where a secondary depression forms. South-easterly winds transport African air northwards. In this situation 'dark Bora' may develop in the Adriatic and, in particular, at Venice.
Type 5: A deep depression over the north of the British Isles extends towards the south, sometimes forming a secondary depression over the region north of the Alps. In the Po Valley, south-westerly winds prevail and transport African air. This situation favours the 'cyclonic Bora' at Venice.
Type 6: A large anticyclonic zone having its centre in north Africa causes a westerly flow of maritime or continental tropical air over northern Italy.
Type 7: A deep depression over Libya extends towards Italy, resulting in easterly winds from Libya. If the centre of the depression is westerly the southern air favours the 'dark Bora' at Venice.
(iii) Urbani's classification considers seven weather types for the cold season in which we are interested. This classification is based on dynamic and statistical considerations regarding the general wind directions over Europe, and particularly over the Mediterranean and Italy, namely:
1st type: A very large ridge of high pressure dominates the Atlantic and the western coasts of Europe. A deep depression lies over the continent and extends towards the Mediterranean. Northerly winds prevail over most of the Mediterranean.
2nd type: The anticyclone of the Azores extends over south-western Europe. The winds are mainly from the north-west.
3rd type: A large anticyclone extends from north Africa towards central Europe. In Italy fine weather prevails.
4th type: A deep depression dominates Italy and the central part of the Mediterranean. Humid air flows over the western Mediterranean. A depression lies over the higher latitudes.
5th type: A sequence of depressions dominates the Atlantic and Europe between latitude 55 and 65. In the Mediterranean westerly winds prevail.
6th type: A depression extends from the Atlantic towards Russia, where a deep minimum is found. An anticyclone extends over northern Europe. Polar or arctic air invades Italy.
7th type: A depression surrounded by anticyclones lies over the central Mediterranean.
(iv) A further classification, based on the passage of fronts and instability lines, was introduced, as these phenomena occurred frequently during the pollution events. The types considered are: (1) cold front; (2) warm front; (3) occurrence of a pair of both fronts; (4) occluded front; (5) instability line. The rather rare stationary fronts were not found during these pollution episodes.
270
REFERENCES
Borghi, S. and M. Giuliacci, 1979. Circolazione atmosferica nella Valle Padana centro occidentale e suo impatto nel trasporto delle particelle. Osservatorio Meteorologico di Brera, Milano.
Camuffo, D., 1980. Fog and related diffusion potential at Venice: two case studies. Boundary Layer Meteorol., 18: 453-· 471.
Camuffo, D., 1981. Fluctuations in wind direction at Venice, related to the origin of the air masses. Atmos. Environ., 15: 1543-1551.
Camuffo, D., 1982. The sea breeze at Venice, as related to daily global solar radiation. Boundary Layer Meteorol., 23: 175-184.
Camuffo, D. and L. Cavaleri, 1980. Oscillations in pollutant concentration occuring in cold offshore flow over Venice. Atmos. Environ., 14: 12551262.
Camuffo, D. and A. Bernardi, 1981. A comparison of the evaporation rate over the mainland with that over the sea. Nuovo Cimento, 4C: 63fr·646.
Camuffo, D., M. De Bortoli and P. Gaglione, 1979a. Tests on Atmospheric Diffusion with Tracers in an Urban Area. NATO CC MS No. 108, Bruxelles, pp. 347·359.
Camuffo, D., F. Tampieri and G. Zambon, 1979b. Local mesoscale circulation at Venice as a result of the mountain sea interaction. Boundary Layer Meteorol., 16: 83-92.
Camuffo, D., M. Del Monte and A. Ongaro, 1984. The pH of the atmospheric precipitation in Venice, related to the dynamics of precipitation events and the weathering of monuments. Sci. Total Environ., 40: 125--139.
King, W.Y. and F.M. Vubovich, 1982. Some dynamical aspects of extended pollution episodes. Atmos. Environ. 16: 1171-1181.
Lavagnini, t and D. Camuffo, 1987. Applications of the generalized gamma distribution to air pollution problems: the case of Venice. Sci. Total Environ., 61 (1987) 91-105.
Lavagnini, t, A. Marani, C. Buttazzoni, A. Del Turco and F. Zilio Grandi, 1982. Simulazione dell'inquinamento atmosferico nella zona di Marghera·Venezia. Atti del X Convegno Nazionale Ambiente e Risorse. Bressanone, 6--11 settembre, Universita' di Padova, A6.
Lavagnini, t, D. Camuffo and A. Bernardi, 1986. Reconstruction and analysis of meteorological data for energy balances over the Venetian Lagoon and its hinterland. Sci. Total Environ., 50: 139-146.
Loewenstein, J.C., 1973. Influence separee du climat et des emissions de pollutants sur l'evolution des taux quotidiens d'acidite et des fumees dans I'agglomeration parisienne entre 1962 et 1972. Proc. 3rd Int. Clean Air Cungr., Dusseldorf 8 to 12 October 1973. VDI-Verlag, Dusseldorf, pp. B79--B84.
Marziano, G.L., A. Sutera, L. Gianolio and M. Ciprian, 1976. Further developments in the application of Shir's model to the Venice area. 7th Int. Techn. Meeting on Air Pollution Modeling and its Application, September 710, 1976, Airlie, Virginia.
Marziano, G.L., C.C. Shir, L.J. Shieh, A. Sutera, L. Gianolio and M. Ciprian, 1978. Study of S02 distribution in Venice by means of an air quality simulation model. Atmos. Environ., 13: 477-487.
Reiter, E.R., 1975. Handbook for Forecasters in the Mediterranean. Envpredrschfac, T.P. pp. 5-75. U.K Meteorological Service, 1962. Weather in the Mediterranean. HMSO, London. Urbani, M., 1955. Su una classificazione dei tipi di tempo in Europa. Riv. Meteorol. Aeronaut., 15:
30-37. Zannetti, P., P. Melli and E. Runca, 1977. Meteorological factors affecting SO, pollution levels in
Venice. Atmos. Environ., 11: 605--616.
Top Related
Copyright © 2022 FDOKUMEN

