


Bahasa
Halaman
Hukum

UNITED STATES
SECURITIES AND EXCHANGE COMMISSION
Washington, D.C. 20549
FORM 10-K
☒ Annual report pursuant to Section 13 or 15(d) of the Securities Exchange Act of 1934
For the fiscal year ended December 31, 2018
or
☐ Transaction report pursuant to Section 13 or 15(d) of the Securities Exchange Act of 1934
Commission file number: 000-49883
PLUMAS BANCORP
(Exact name of Registrant as specified in its charter)
California 75-2987096
(State or other jurisdiction of incorporation or organization) (IRS Employer Identification No.)
35 S. Lindan Avenue, Quincy, CA 95971
(Address of principal executive offices) (Zip Code)
Registrant's telephone number, including area code: (530) 283-7305
Securities registered pursuant to Section 12(b) of the Act:
Title of Each Class: Name of Each Exchange on which Registered:
Common Stock, no par value The NASDAQ Stock Market LLC
Securities registered pursuant to Section 12(g) of the Act: None.
Indicate by check mark if the registrant is a well-known seasoned issuer, as defined in Rule 405 of the Securities Act.
☐ Yes ☒ No
Indicate by check mark if the registrant is not required to file reports pursuant to Section 13 or Section 15(d) of the Act.
☐ Yes ☒ No
Indicate by check mark whether the registrant: (1) has filed all reports required to be filed by Section 13 or 15(d) of the
Securities Exchange Act of 1934 during the preceding 12 months (or for such shorter period that the registrant was required
to file such reports), and (2) has been subject to such filing requirements for the past 90 days.
☒ Yes ☐ No
Indicate by check mark whether the registrant has submitted electronically every Interactive Data File required to be
submitted pursuant to Rule 405 of Regulation S-T (§232.405 of this chapter) during the preceding 12 months (or for such
shorter period that the registrant was required to submit such files). Yes ☒ No ☐
Indicate by check mark whether the registrant is a large accelerated filer, an accelerated filer, a non-accelerated filer, a
smaller reporting company or an emerging growth company. See definition of “large accelerated filer,” “accelerated filer,”
“smaller reporting company” and “emerging growth company” in Rule12b-2 of the Exchange Act:
Large Accelerated Filer ☐ Accelerated Filer ☒ Non-Accelerated Filer ☐ Smaller Reporting Company ☒
Emerging Growth Company ☐
If an emerging growth company, indicate by check mark if the registrant has elected not to use the extended transition
period for complying with any new or revised financial accounting standards provided pursuant to Section 13(a) of the
Exchange Act. ☐

Indicate by check mark if the registrant is a shell company (as defined in Rule 12b-2 of the Exchange Act).
☐ Yes ☒ No
As of June 30, 2018, the aggregate market value of the voting and non-voting common equity held by non-affiliates of
the Registrant was approximately $130.6 million, based on the closing price reported to the Registrant on June 29, 2018 of
$28.20 per share.
Shares of Common Stock held by each officer and director have been excluded in that such persons may be deemed to
be affiliates. This determination of the affiliate status is not necessarily a conclusive determination for other purposes.
The number of shares of Common Stock of the registrant outstanding as of March 4, 2019 was 5,150,876.
Documents Incorporated by Reference: Portions of the definitive proxy statement for the 2019 Annual Meeting of
Shareholders to be filed with the Securities and Exchange Commission pursuant to SEC Regulation 14A are incorporated by
reference in Part III, Items 10-14.
i
TABLE OF CONTENTS
Page
PART I
Item 1. Business 2
Item 1A. Risk Factors 11
Item 1B. Unresolved Staff Comments 16
Item 2. Properties 17
Item 3. Legal Proceedings 18
Item 4. Mine Safety Disclosures 18
PART II
Item 5. Market for Registrant’s Common Equity, Related Stockholder Matters and Issuer Purchases of Equity
Securities 19
Item 6. Selected Financial Data 20
Item 7. Management's Discussion and Analysis of Financial Condition and Results of Operations 21
Item 7A. Quantitative and Qualitative Disclosures About Market Risk 39
Item 8. Financial Statements and Supplementary Data 40
Item 9. Changes in and Disagreements with Accountants on Accounting and Financial Disclosure 41
Item 9A. Controls and Procedures 41
Item 9B. Other Information 41
PART III
Item 10. Directors, Executive Officers and Corporate Governance 41
Item 11. Executive Compensation 41
Item 12. Security Ownership of Certain Beneficial Owners and Management and Related Stockholder Matters 41
Item 13. Certain Relationships and Related Transactions, and Director Independence 41
Item 14. Principal Accountant Fees and Services 41
PART IV
Item 15. Exhibits and Financial Statement Schedules 42
Signatures 45
1
PART I
Forward-Looking Information
This Annual Report on Form 10-K includes forward-looking statements and information is subject to the “safe harbor”
provisions of Section 27A of the Securities Act of 1933 and Section 21E of the Securities Exchange Act of 1934. These forward-
looking statements, which involve Plumas Bancorp’s plans, beliefs and goals, refer to estimates or use similar terms, involve
certain risks and uncertainties that could cause actual results to differ materially from those in the forward-looking
statements. Such risks and uncertainties include, but are not limited to, the following factors:
■ Local, regional, national and international economic conditions and the impact they may have on us and our
customers, and our assessment of that impact on our estimates including, but not limited to, the allowance for loan
losses.
■ The effects of and changes in trade, monetary and fiscal policies and laws, including the interest rate policies of the
Federal Open Market Committee of the Federal Reserve Board.
■ The ability of Plumas Bank to declare and pay dividends to the Company.
■ Changes imposed by regulatory agencies to increase our capital to a level greater than the current level required
for well-capitalized financial institutions (including the implementation of the Basel III standards), the failure to
maintain capital above the level required to be well-capitalized under the regulatory capital adequacy guidelines,
the availability of capital from private or government sources, or the failure to raise additional capital as needed.
■ The effect of changes in accounting policies and practices, as may be adopted by the regulatory agencies, as well as
the Public Company Accounting Oversight Board, the Financial Accounting Standards Board and other accounting
standard setters.
■ The costs and effects of changes in laws and regulations and of other legal and regulatory developments, including,
but not limited to, increases in FDIC insurance premiums, the resolution of legal proceedings or regulatory or other
governmental inquiries, and the results of regulatory examinations, reviews or other inquires.
■ Changes in the interest rate environment and volatility of rate sensitive assets and liabilities.
■ Declines in the health of the economy, nationally or regionally, which could reduce the demand for loans, reduce
the ability of borrowers to repay loans and/or reduce the value of real estate collateral securing most of the
Company’s loans.
■ Credit quality deterioration, which could cause an increase in the provision for loan and lease losses.
■ Devaluation of fixed income securities.
■ Asset/liability matching risks and liquidity risks.
■ Loss of key personnel.
■ Operational interruptions including data processing systems failure and fraud.
■ Our success at managing the risks involved in the foregoing items.
Plumas Bancorp undertakes no obligation to revise or publicly release the results of any revision to these forward-looking
statements.
2
ITEM 1. BUSINESS
References herein to the “Company,” “we,” “us” and “our” refer to Plumas Bancorp and its consolidated subsidiary, unless
the context indicates otherwise. References to the “Bank” refer to Company’s wholly-owned subsidiary, Plumas Bank.
References to “Management” refer to the members of the Company’s management and references to the “Board of
Directors” or the “Board” refer to the Company’s Board of Directors.
General
The Company. Plumas Bancorp is a California corporation registered as a bank holding company under the Bank Holding
Company Act of 1956, as amended, and is headquartered in Quincy, California. The Company was incorporated in January
2002 for the purposes of become Plumas Bank’s holding company and acquired all of the outstanding shares of the Bank in
June 2002. The Company’s principal subsidiary is the Bank, and the Company exists primarily for the purpose of holding
the stock of the Bank and of such other subsidiaries it may acquire or establish. At the present time, the Company’s only
other subsidiaries are Plumas Statutory Trust I and Plumas Statutory Trust II, which were formed in 2002 and 2005 solely to
facilitate the issuance of trust preferred securities.
The Company’s principal source of income is dividends from the Bank, but the Company may explore supplemental sources
of income in the future. The cash outlays of the Company, including (but not limited to) the payment of dividends to
shareholders, if and when declared by the Board of Directors, costs of repurchasing Company common stock and the cost of
servicing debt, will generally be paid from dividends paid to the Company by the Bank.
At December 31, 2018, the Company had consolidated assets of $824.4 million, deposits of $726.6 million, other liabilities
of $30.9 million and shareholders’ equity of $66.9 million. The Company’s other liabilities include $10.3 million in junior
subordinated deferrable interest debentures and $13.1 million in repurchase agreements. These items are described in detail
later in this Form 10-K.
Our operations are conducted at 35 South Lindan Avenue, Quincy, California. Our annual, quarterly and other reports,
required under the Securities Exchange Act of 1934 and filed with the Securities and Exchange Commission, (the “SEC”)
are posted and are available at no cost on the Company’s website, www.plumasbank.com, as soon as reasonably practicable
after the Company files such documents with the SEC. These reports are also available through the SEC’s website at
www.sec.gov.
The Bank. The Bank is a California state-chartered bank that was incorporated in July 1980 and opened for business in
December 1980. The Bank’s deposit accounts are insured by the Federal Deposit Insurance Corporation (the “FDIC”) up to
maximum insurable amounts. The Bank is not a member of the Federal Reserve System. The Bank’s Administrative Office
is located at 35 South Lindan Avenue, Quincy, California. At December 31, 2018 the Bank had approximately $824 million
in assets, $562 million in net loans and $727 million in deposits (including deposits of $0.5 million from the Company). It is
currently the largest independent bank headquartered in Plumas County.
The Bank’s primary service area covers the Northeastern portion of California, with Lake Tahoe to the south and the Oregon
border to the north. The Bank, through its thirteen-branch network, serves Washoe and Carson City counties in Nevada and
the seven contiguous California counties of Plumas, Nevada, Sierra, Placer, Lassen, Modoc and Shasta. The branches are
located in the California communities of Quincy, Portola, Greenville, Truckee, Fall River Mills, Alturas, Susanville, Chester,
Tahoe City, Kings Beach and Redding; in addition, during December 2015 the Bank opened a branch in Reno, Nevada and
effective October 26, 2018 purchased a branch in Carson City, Nevada. The Bank maintains seventeen automated teller
machines (“ATMs”) tied in with major statewide and national networks. In addition to its branch network, the Bank operates
a lending office specializing in government-guaranteed lending in Auburn, California and commercial/agricultural lending
offices located in Chico, California, Red Bluff, California and Klamath Falls, Oregon. The Bank’s primary business is
servicing the banking needs of these communities. Its marketing strategy stresses its local ownership and commitment to
serve the banking needs of individuals living and working in the Bank’s primary service areas.
With a predominant focus on personal service, the Bank has positioned itself as a multi-community independent bank serving
the financial needs of individuals and businesses within the Bank’s geographic footprint. Our principal retail lending services
include consumer, automobile and home equity loans. Our principal commercial lending services include term real estate,
commercial and industrial term loans. In addition, we provide government-guaranteed and agricultural loans as well as credit
lines. We provide land development and construction loans on a limited basis.
3
The Bank’s government-guaranteed lending center headquartered in Auburn, California provides Small Business
Administration (SBA) and USDA Rural Development loans to qualified borrowers throughout Northern California, and
Northern Nevada. During 2007 the Bank was granted nationwide Preferred Lender status with the U.S. Small Business
Administration and we expect government-guaranteed lending to continue to be an important part of our overall lending
operation. During 2018 proceeds from the sale of government-guaranteed loans totaled $41.7 million and we generated a gain
on sale of $1.9 million. During 2017 proceeds from the sale of government-guaranteed loans totaled $36.6 million and we
generated a gain on sale of $2.0 million.
The Agricultural Credit Centers located in Alturas, Chico, Red Bluff and Susanville, California and Klamath Falls, Oregon
provide a complete line of credit services in support of the agricultural activities which are key to the continued economic
development of the communities we serve. “Ag lending” clients include a full range of individual farming customers, small
to medium-sized business farming organizations and corporate farming units.
As of December 31, 2018, the principal areas to which we have directed our lending activities, and the percentage of our total
loan portfolio comprised by each, were as follows: (i) commercial real estate – 48.0%; (ii) consumer loans (including
residential equity lines of credit and automobile loans) – 21.1%; (iii) agricultural loans (including agricultural real estate
loans) – 12.2%; (iv); commercial and industrial loans – 8.8%; (v) construction and land development – 7.1%; and (vi)
residential real estate – 2.8% .
In addition to the lending activities noted above, we offer a wide range of deposit products for the retail and commercial
banking markets including checking, interest-bearing and premium interest-bearing checking, business sweep, public funds
sweep, savings, time deposit and retirement accounts, as well as remote deposit, telephone and mobile banking, including
mobile deposit, and internet banking with bill-pay options. Interest bearing deposits include high yield sweep accounts
designed for our commercial customers and for public entities such as municipalities. As of December 31, 2018, the Bank
had 33,058 deposit accounts with balances totaling approximately $727 million, compared to 31,582 deposit accounts with
balances totaling approximately $663 million at December 31, 2017. We attract deposits through our customer-oriented
product mix, competitive pricing, convenient locations, mobile and internet banking and remote deposit operations, all
provided with a high level of customer service.
Most of our deposits are attracted from individuals, business-related sources and smaller municipal entities. This mix of
deposit customers resulted in a relatively modest average deposit balance of approximately $22 thousand at December 31,
2018. However, it makes us less vulnerable to adverse effects from the loss of depositors who may be seeking higher yields
in other markets or who may otherwise draw down balances for cash needs.
We also offer a variety of other products and services to complement the lending and deposit services previously
reviewed. These include cashier’s checks, bank-by-mail, ATMs, night depository, safe deposit boxes, direct deposit,
electronic funds transfers and other customary banking services.
Through our offering of a Remote Deposit product our business customers are able to make non-cash deposits remotely from
their physical location. With this product, we have extended our service area and can now meet the deposit needs of customers
who may not be located within a convenient distance of one of our branch offices.
The Bank has devoted a substantial amount of time and capital to the improvement of existing Bank services. We added
mobile banking services during the first quarter of 2010. During 2015 we enhanced our mobile banking services and began
offering mobile deposit services. During the first quarter of 2012 we replaced our ATMs with new state of the art machines
that are ADA compliant and capable of accepting check and cash deposits without a deposit envelope. During 2015 we
enhanced our mobile banking services and began offering mobile deposit services and in 2018 we began offering the ability
for our customers to send money to others from their mobile devices through a linked debit card (“P2P” transfers).
The officers and employees of the Bank are continually engaged in marketing activities, including the evaluation and
development of new products and services, to enable the Bank to retain and improve its competitive position in its service
area.
We hold no patents or licenses (other than licenses required by appropriate bank regulatory agencies or local governments),
franchises, or concessions. Our business has a modest seasonal component due to the heavy agricultural and tourism
orientation of some of the communities we serve. We are not dependent on a single customer or group of related customers
for a material portion of our deposits. The Company’s management has established loan concentration guidelines as a
percentage of capital and evaluates loan concentration levels within a single industry or group of related industries on
4
quarterly basis, or more frequently as loan conditions change. There has been no material effect upon our capital expenditures,
earnings, or competitive position as a result of federal, state, or local environmental regulation.
Commitment to our Communities. The Board of Directors and Management believe that the Company plays an important
role in the economic well-being of the communities it serves. Our Bank has a continuing responsibility to provide a wide
range of lending and deposit services to both individuals and businesses. These services are tailored to meet the needs of the
communities served by the Company and the Bank.
We offer various loan products which encourage job growth and support community economic development. Types of loans
offered range from personal and commercial loans to real estate, construction, agricultural, automobile and government-
guaranteed loans. Many banking decisions are made locally with the goal of maintaining customer satisfaction through the
timely delivery of high quality products and services.
Recent Expansion Activities. On July 31, 2015 the Bank completed its acquisition of the Redding, California, branch of
Rabobank N.A. The transaction included the acquisition of approximately $10 million in deposits. The branch, located at
1335 Hilltop Dr. in Redding, now operates as a branch of the Bank. Following the acquisition, the Bank consolidated its
preexisting branch Redding branch on Civic Center Drive branch into this location. The Civic Center Drive facility was sold
to an unrelated third party in December 2015.
In December 2015 the Bank opened a full-service branch located at 5050 Meadowood Mall Circle, Reno, Nevada. This
was the Bank’s first branch location outside of California. On October 26, 2018 we acquired a branch located in Carson City,
Nevada from Mutual of Omaha Bank. This transaction resulted in the acquisition of $45.6 million in deposits and $1.8
million in loans and the recording of $1.1 million in intangible assets.
Dividends. It is the policy of the Company to periodically distribute excess retained earnings to the shareholders through the
payment of cash dividends, subject to the approval of the Board of Directors. On October 20, 2016 the Company announced
that its Board of Directors approved the reinstatement of a semi-annual cash dividend. The dividend in the amount of $0.10
per share was paid on November 21, 2016 to shareholders of record at the close of business day on November 7, 2016. A
semi-annual cash dividend totaling $0.14 per share was paid on May 15, 2017 and November 15, 2017 and a semi-annual
cash dividend totaling $0.18 per share was paid on May 15, 2018 and November 15, 2018.
Trust Preferred Securities. During the third quarter of 2002, the Company formed a wholly owned Connecticut statutory
business trust, Plumas Statutory Trust I (the “Trust I”). On September 26, 2002, the Company issued to the Trust I, Floating
Rate Junior Subordinated Deferrable Interest Debentures due 2032 (the “Debentures”) in the aggregate principal amount of
$6,186,000. In exchange for these debentures the Trust I paid the Company $6,186,000. The Trust I funded its purchase of
debentures by issuing $6,000,000 in floating rate capital securities (“trust preferred securities”), which were sold to a third
party. These trust preferred securities qualify as Tier I capital under current Federal Reserve Board guidelines. The
Debentures are the only asset of the Trust I. The interest rate and terms on both instruments are substantially the same. The
rate is based on the three-month LIBOR (London Interbank Offered Rate) plus 3.40%, not to exceed 11.9%, adjustable
quarterly. The proceeds from the sale of the Debentures were primarily used by the Company to inject capital into the Bank.
During the third quarter of 2005, the Company formed a wholly owned Delaware statutory business trust, Plumas Statutory
Trust II (the “Trust II”). On September 28, 2005, the Company issued to the Trust II, Floating Rate Junior Subordinated
Deferrable Interest Debentures due 2035 (the “Debentures”) in the aggregate principal amount of $4,124,000. In exchange
for these debentures the Trust II paid the Company $4,124,000. The Trust II funded its purchase of debentures by issuing
$4,000,000 in floating rate capital securities (“trust preferred securities”), which were sold to a third party. These trust
preferred securities qualify as Tier I capital under current Federal Reserve Board guidelines. The Debentures are the only
asset of the Trust II. The interest rate and terms on both instruments are substantially the same. The rate is based on the three-
month LIBOR (London Interbank Offered Rate) plus 1.48%, adjustable quarterly. The proceeds from the sale of the
Debentures were primarily used by the Company to inject capital into the Bank.
The trust preferred securities are mandatorily redeemable upon maturity of the Debentures on September 26, 2032 for Trust
I and September 28, 2035 for Trust II, or upon earlier redemption as provided in the indenture.
The Dodd-Frank Wall Street Reform and Consumer Protection Act (the “Dodd-Frank Act”) excludes trust preferred securities
issued after May 19, 2010, from being included in Tier 1 capital, unless the issuing company is a bank holding company with
less than $500 million in total assets. Trust preferred securities issued prior to that date will continue to count as Tier 1 capital
for bank holding companies with less than $15 billion in total assets, such as the Company.
5
Neither Trust I nor Trust II are consolidated into the Company’s consolidated financial statements and, accordingly, both
entities are accounted for under the equity method and the junior subordinated debentures are reflected as debt on the
consolidated balance sheet.
Business Concentrations. No individual or single group of related customer accounts is considered material in relation to
the Bank's assets or deposits, or in relation to our overall business. However, at December 31, 2018 approximately 71% of
the Bank's total loan portfolio consisted of real estate-secured loans, including real estate mortgage loans, real estate
construction loans, consumer equity lines of credit, and agricultural loans secured by real estate. Moreover, our business
activities are currently focused in the California counties of Plumas, Nevada, Placer, Lassen, Modoc, Shasta and Sierra and
Washoe and Carson City Counties in Nevada. Consequently, our results of operations and financial condition are dependent
upon the general trends in these economies and, in particular, the residential and commercial real estate markets. In addition,
the concentration of our operations in these areas of California and Nevada exposes us to greater risk than other banking
companies with a wider geographic base in the event of catastrophes, such as earthquakes, fires, drought and floods in these
regions in California and Nevada.
Competition. The banking business is highly competitive. The business is largely dominated by a relatively small number of
major banks with many offices operating over a wide geographical area. These banks have, among other advantages, the
ability to finance wide-ranging and effective advertising campaigns and to allocate their resources to regions of highest yield
and demand. Many of the major banks operating in the area offer certain services that we do not offer directly but may offer
indirectly through correspondent institutions. By virtue of their greater total capitalization, such banks also have substantially
higher lending limits than we do. For customers whose loan demands exceed our legal lending limit, we attempt to arrange
for such loans on a participation basis with correspondent or other banks.
In addition to other banks, our competitors include savings institutions, credit unions, and numerous non-banking institutions
such as finance companies, leasing companies, insurance companies, brokerage firms, Internet-based lending platforms and
investment banking firms. In recent years, increased competition has also developed from specialized finance and non-
finance companies that offer wholesale finance, credit card, and other consumer finance services, including on-line banking
services and personal financial software. Strong competition for deposit and loan products affects the rates of those products
as well as the terms on which they are offered to customers. Mergers between financial institutions have placed additional
competitive pressure on banks within the industry to streamline their operations, reduce expenses, and increase
revenues. Competition has also intensified due to federal and state interstate banking laws enacted in the mid-1990’s, which
permit banking organizations to expand into other states. The relatively large California market has been particularly attractive
to out-of-state institutions. The Financial Modernization Act, which became effective March 11, 2000, has made it possible
for full affiliations to occur between banks and securities firms, insurance companies, and other financial companies, and has
also intensified competitive conditions.
Currently, within towns in which the Bank has a branch, excluding Carson City, there are 106 banking branch offices of
competing institutions (excluding credit unions, but including savings banks), including 69 branches of 11 banks having
assets more than $10 billion. As of June 30, 2018, the FDIC estimated the Bank’s market share of insured deposits within the
communities it serves to be as follows: Greenville and Portola 100%, Quincy 86%, Chester 66%, Alturas 59%, Fall River
Mills 36%, Kings Beach 32%, Susanville 43%, Truckee 14%, Tahoe City 22%, Redding 1% and Reno less than 1%.
Technological innovations have also resulted in increased competition in financial services markets. Such innovation has,
for example, made it possible for non-depository institutions to offer customers automated transfer payment services that
previously were considered traditional banking products. In addition, many customers now expect a choice of delivery
systems and channels, including home computer, mobile, remote deposit, telephone, ATMs, mail, full-service branches and/or
in-store branches. The sources of competition in such products include traditional banks as well as savings associations,
credit unions, brokerage firms, money market and other mutual funds, asset management groups, finance and insurance
companies, internet-only financial intermediaries, and mortgage banking firms.
For many years we have countered rising competition by providing our own style of community-oriented, personalized
service. We rely on local promotional activity, personal contacts by our officers, directors, employees, and shareholders,
automated 24-hour banking, and the individualized service that we can provide through our flexible policies. This approach
appears to be well-received by our customers who appreciate a more personal and customer-oriented environment in which
to conduct their financial transactions. To meet the needs of customers who prefer to bank electronically, we offer telephone
banking, mobile banking, remote deposit, mobile deposit and internet banking with bill payment capabilities. This high tech
and high touch approach allows the customers to tailor their access to our services based on their particular preference.
6
Employees. At December 31, 2018, the Company and its subsidiary employed 174 persons. On a full-time equivalent basis,
we employed 155 persons. None of the Company’s employees are represented by a labor union, and management considers
its relations with employees to be good.
Code of Ethics. The Board of Directors has adopted a code of business conduct and ethics for directors, officers (including
the Company’s principal executive officer and principal financial officer) and financial personnel, known as the Corporate
Governance Code of Ethics. This Code of Ethics is available on the Company’s website at www.plumasbank.com.
Shareholders may request a free copy of the Code of Ethics Policy from Plumas Bancorp, Ms. Elizabeth Kuipers, Investor
Relations, 35 S. Lindan Avenue, Quincy, California 95971.
Supervision and Regulation
General. As banking institution, we are extensively regulated under federal and state law. These laws and regulations are
generally intended to protect depositors and customers, not our shareholders. To the extent that the following information
describes statutory or regulatory provisions, it is qualified in its entirety by reference to the particular statute or regulation.
Our operations may be affected by legislative changes and by the policies of various regulatory authorities. Any change in
applicable laws or regulations may have a material effect on our business and prospects. We cannot accurately predict the
nature or the extent of the effects on our business and earnings that fiscal or monetary policies, or new federal or state
legislation may have in the future.
Holding Company Regulation. We are a registered bank holding company under the Bank Holding Company Act of 1956,
as amended, and are subject to the supervision of, and regulation by, the Board of Governors of the Federal Reserve System
(the “FRB”). We are required to file reports with the FRB and the FRB periodically examines the Company. A bank holding
company is required to serve as a source of financial and managerial strength to its subsidiary bank and, under appropriate
circumstances, to commit resources to support the subsidiary bank. FRB regulations require the Company to meet or exceed
certain capital requirements and regulate provisions of certain bank holding company debt. The Company is also a bank
holding company within the meaning of Section 3700 of the California Financial Code. Therefore, the Company and any of
its subsidiaries are subject to supervision and examination by, and may be required to file reports with, the California
Department of Business Oversight (“DBO”).
The activities of bank holding companies are generally limited to the business of banking, managing or controlling banks,
and other activities that the FRB has determined to be so closely related to banking or managing or controlling banks as to be
a proper incident thereto. Bank holding companies that qualify and register as “financial holding companies” are also able to
engage in certain additional financial activities, such as merchant banking and securities and insurance underwriting, subject
to limitations set forth in federal law. The Company has not elected to become a financial holding company. As a bank
holding company, the Company must to obtain prior approval of the FRB before taking any action that causes a bank to
become a controlled subsidiary of the bank holding company; acquiring direct or indirect ownership 5% of the outstanding
shares of any class of voting securities another bank or bank holding company, acquiring all or substantially all the assets of
a bank or merging or consolidating with another bank holding company.
Federal and State Bank Regulation. As a California-chartered commercial bank with deposits insured by the FDIC, the
Bank is subject to the supervision and regulation of the DBO and the FDIC, as well as certain of the regulations of the FRB
and the Consumer Financial Protection Bureau (“CFPB”). The DBO and the FDIC regularly examine the Bank and may
prohibit the Bank from engaging in what they believe constitute unsafe or unsound banking practices or violations of law.
Securities Regulation. The Company is subject to the disclosure and regulatory requirements of the Securities Act of 1933,
as amended, and the Securities Exchange Act of 1934, as amended, both as administered by the Securities and Exchange
Commission. As a listed company on NASDAQ, we are subject to NASDAQ rules for listed companies.
Capital Adequacy. The FDIC has risk-based capital adequacy guidelines intended to provide a measure of capital adequacy
that reflects the degree of risk associated with a banking organization’s operations for both transactions reported on the
balance sheet as assets, and transactions, such as letters of credit and recourse arrangements, which are reported as off-
balance-sheet items. Under these guidelines, nominal dollar amounts of assets and credit equivalent amounts of off-balance-
sheet items are multiplied by one of several risk adjustment percentages, which range from 0% for assets with low credit risk,
such as certain U.S. government securities, to 100% for assets with relatively higher credit risk, such as business loans.
7
A banking organization’s risk-based capital ratios are obtained by dividing its qualifying capital by its total risk-adjusted
assets and off-balance-sheet items. The regulators measure risk-adjusted assets and off-balance-sheet items against both total
qualifying capital (the sum of Tier 1 capital and limited amounts of Tier 2 capital) and Tier 1 capital. Tier 1 capital consists
of common stock, retained earnings, noncumulative perpetual preferred stock and minority interests in certain subsidiaries,
less most other intangible assets. Tier 2 capital may consist of a limited amount of the allowance for loan and lease losses and
certain other instruments with some characteristics of equity. The inclusion of elements of Tier 2 capital is subject to certain
other requirements and limitations of the federal banking agencies.
In July, 2013, the federal bank regulatory agencies approved the final rules implementing the Basel Committee on Banking
Supervision’s capital guidelines for U.S. banks, sometimes called “Basel III”. The phase-in period for the final rules began
in 2015, with certain of the rules’ requirements phased in over a multi-year schedule. Under the final rules minimum
requirements increased for both the quantity and quality of capital held by the Company and the Bank. The new capital rules
include a new minimum “common equity Tier 1” ratio of 4.5%, a Tier 1 capital ratio of 6.0% (increased from 4.0%), a total
risk-based capital ratio of 8.0%, and a minimum leverage ratio of 4.0% (calculated as Tier 1 capital to average consolidated
assets). The effective date of these requirements was January 1, 2015. In addition, the new capital rules include a capital
conservation buffer of 2.5% above each of these levels (to be phased in over three years which beginning at 0.625% on
January 1, 2016 and increasing by that amount on each subsequent January 1, until reaching 2.5% on January 1, 2019) will
be required for banking institutions to avoid restrictions on their ability to pay dividends, repurchase stock or pay discretionary
bonuses. When fully phased in and including the capital conservation buffer of 2.5%, the new capital rules would result in
the following minimum ratios for the Bank to be considered well capitalized: (i) a Tier 1 capital ratio of 8.5%, (ii) a common
equity Tier 1 capital ratio of 7.0%, and (iii) a total capital ratio of 10.5%. The new capital rules also implement strict eligibility
criteria for regulatory capital instruments.
Under the new capital rules, the minimum capital ratios as of January 1, 2018 through December 31, 2018 (including the
capital conservation buffer as then phased in) were as follows: a common equity Tier 1 capital ratio of 6.375%; a Tier 1
capital ratio of 7.875%; a total capital risk-based capital ratio of 9.875% and a minimum leverage ratio of 4.0%.
A bank that does not achieve and maintain the required capital levels may be issued a capital directive by the FDIC and/or
the DBO to ensure the maintenance of required capital levels. Federal law requires, among other things, that federal bank
regulators take “prompt corrective action” with respect to depository institutions that do not meet minimum capital
requirements. For this purpose, the law establishes five capital categories: well capitalized, adequately capitalized,
undercapitalized, significantly undercapitalized and critically undercapitalized. At each successive lower capital category, an
insured depository institution is subject to more restrictions and prohibitions, including restrictions on growth, restrictions on
interest rates paid on deposits, restrictions or prohibitions on payment of dividends, and restrictions on the acceptance of
brokered deposits. Furthermore, if an insured depository institution is classified in one of the undercapitalized categories, it
is required to submit a capital restoration plan to the appropriate federal banking agency, and the holding company and any
other company deemed to control the bank must guarantee the performance of that plan. Under current regulations, a
depository institution is deemed to be “well capitalized” if it has a total risk-based capital ratio of 10.0% or greater, a Tier 1
risk-based capital ratio of 8.0% or greater, a leverage ratio of 5.0% or greater and a common equity Tier 1 ratio of 6.5% or
greater. At December 31, 2018, the Bank’s capital ratios exceed the thresholds necessary to be considered “well capitalized.”
Under the FRB’s Small Bank Holding Company Policy Statement (Regulation Y, Appendix C) (the “Policy Statement”),
certain bank holding companies with less than $1 billion in consolidated assets are exempt from the consolidated capital rules.
The Company qualifies for treatment under the Policy Statement and is not currently subject to consolidated capital rules at
the bank holding company level. On May 24, 2018, the Economic Growth, Regulatory Relief and Consumer Protection Act
(the “Relief Act”) was signed into law. The Relief Act included a provision to increase the threshold for qualifying for the
Policy Statement from $1 billion to $3 billion in total assets.
The new capital rules continue to apply to the Bank. Consistent with the Relief Act, however, the federal banking agencies
have proposed a new community bank leverage ratio that is intended to simply the regulatory capital requirements for
qualifying community banking organizations. Under the proposal, a qualifying banking organization that so elects would be
deemed to have met the well-capital capitalized ratio requirements under the prompt corrective action framework and would
be exempt from the generally applicable new capital rules if it maintains a new “community bank leverage ratio” in excess
of 9%. The proposed community bank leverage ratio would be equal to tangible equity (as defined the proposal) divided by
average total consolidated assets. To qualify, a banking organization would have to have less than $10 billion in assets and
limited off balance sheet exposures and other assets. We cannot predict whether or when this proposal will be adopted.
For additional information, see “Item 7. Management’s Discussion and Analysis of Financial Condition and Results of
Operations – Capital Standards.”
8
Dividends. The Company's ability to pay cash dividends is dependent on dividends paid to it by the Bank and limited by
California law. Under California law, the holders of common stock of the Company are entitled to receive dividends when
and as declared by the Board of Directors, out of funds legally available, subject to certain restrictions. The California General
Corporation Law permits a California corporation such as the Company to make a distribution to its shareholders if its retained
earnings equal at least the amount of the proposed distribution or if after giving effect to the distribution, the value of the
corporation’s assets exceed the amount of its liabilities plus the amount of shareholders preferences, if any, and certain other
conditions are met.
It is the Federal Reserve’s policy that bank holding companies should generally pay dividends on common stock only out of
income available over the past year, and only if prospective earnings support the organization’s expected future needs and
financial condition. Further, it is the FRB’s policy that bank holding companies should not maintain dividend levels that
undermine their ability to be a source of strength to its banking subsidiaries. The Federal Reserve also discourages dividend
payment ratios that are at maximum allowable levels unless both asset quality and capital are very strong.
In addition, the Company’s ability to pay dividends is subject to certain covenants contained in the indentures relating to the
trust preferred securities issued by the Company’s business trust subsidiaries.
The Bank is a legal entity that is separate and distinct from its holding company. The Company is dependent on the
performance of the Bank for funds which may be received as dividends from the Bank for use in the operation of the Company
and the ability of the Company to pay dividends to shareholders. Future cash dividends by the Bank will also depend upon
management’s assessment of future capital requirements, contractual restrictions, and other factors.
The California Financial Code restricts the dividends that the Bank may pay to the Company to the lesser of the Bank's
retained earnings or the Bank's net income for the latest three fiscal years, less dividends previously declared during that
period, or, with the approval of the DBO, to the greater of the retained earnings of the Bank, the net income of the Bank for
its last fiscal year, or the net income of the Bank for its current fiscal year. As of December 31, 2018, the maximum amount
available for dividend distribution under this restriction was approximately $21.4 million. In addition, the Bank is subject
to the new capital rules and the capital conservation buffer discussed above.
Loans-to-One Borrower. Under California law, the Bank’s ability to make aggregate secured and unsecured loans-to-one-
borrower is limited to 25% and 15%, respectively, of unimpaired capital and surplus. At December 31, 2018, the Bank’s
limit on aggregate secured loans-to-one-borrower was $20.8 million and unsecured loans-to-one borrower was $12.5
million. The Bank has established internal loan limits that are lower than the legal lending limits for a California bank.
The Community Reinvestment Act. The Community Reinvestment Act (“CRA”) requires that, in connection with
examinations of financial institutions within its jurisdiction, the federal banking regulators evaluate the record of the financial
institutions in meeting the credit needs of their local communities, including low- and moderate-income neighborhoods,
consistent with the safe and sound operation of those institutions. These factors are also considered in evaluating mergers,
acquisitions and applications to open a branch or new facility. A less than “Satisfactory” rating would likely result in the
suspension of any growth of the Bank through acquisitions or opening de novo branches until the rating is improved. As of
the most recent report of examination the Bank’s CRA rating was “Satisfactory.”
Transactions with Affiliates. Banks are also subject to certain restrictions imposed by the Federal Reserve Act on extensions
of credit to executive officers, directors, principal shareholders (including the Company) or any related interest of such
persons. Extensions of credit must be made on substantially the same terms, including interest rates and collateral as, and
follow credit underwriting procedures that are not less stringent than, those prevailing at the time for comparable transactions
with persons not affiliated with the bank, and must not involve more than the normal risk of repayment or present other
unfavorable features. Banks are also subject to certain lending limits and restrictions on overdrafts to such persons. A violation
of these restrictions may result in the assessment of substantial civil monetary penalties on the affected bank or any officer,
director, employee, agent or other person participating in the conduct of the affairs of that bank, the imposition of a cease and
desist order, and other regulatory sanctions.
The Federal Reserve Act and the FRB’s Regulation W limit the amount of certain loan and investment transactions between
the Bank and its affiliates, require certain levels of collateral for such loans, and limit the amount of advances to third parties
that may be collateralized by the securities of the Company or its subsidiaries. Regulation W requires that certain transactions
between the Bank and its affiliates be on terms substantially the same, or at least as favorable to the Bank, as those prevailing
at the time for comparable transactions with or involving nonaffiliated companies or, in the absence of comparable
transactions, on terms and under circumstances, including credit standards, that in good faith would be offered to or would
9
apply to nonaffiliated companies. The Company and its subsidiaries have adopted an Affiliate Transactions Policy and have
entered into various affiliate agreements in compliance with Regulation W.
Safety and Soundness Standards. The FRB and the FDIC have adopted non-capital safety and soundness standards for
institutions. These standards cover internal controls, information and internal audit systems, loan documentation, credit
underwriting, interest rate exposure, asset growth, compensation, fees and benefits, and standards for asset quality, earnings
and stock valuation. An institution that fails to meet these standards must develop a plan acceptable to the agency, specifying
the steps that it will take to meet the standards. Failure to submit or implement such a plan may subject the institution to
regulatory sanctions.
Federal Deposit Insurance. In addition to supervising and regulating state-chartered non-member banks, the FDIC insures
the Bank’s deposits, up to prescribed statutory limits, through the Deposit Insurance Fund (the “DIF”), currently $250,000
per depositor per institution. The DIF is funded primarily by FDIC assessments paid by each DIF member institution. The
amount of FDIC assessments paid by each DIF member institution is based on its relative risk of default as measured by
regulatory capital ratios and other supervisory factors. The Bank’s FDIC insurance expense totaled $216 thousand for 2018.
Additionally, all FDIC-insured institutions are required to pay assessments to the FDIC to fund interest payments on bonds
issued by the Financing Corporation (“FICO”), an agency of the Federal government established to recapitalize the
predecessor to the DIF. The Bank’s FICO assessments totaled $21 thousand for 2018. These assessments will continue until
the FICO bonds mature in 2019.
The FDIC may terminate a depository institution’s deposit insurance upon a finding that the institution’s financial condition
is unsafe or unsound or that the institution has engaged in unsafe or unsound practices that pose a risk to the DIF or that may
prejudice the interest of the bank’s depositors. Under California law, the termination of the Bank’s deposit insurance would
result in a termination of the Bank’s charter.
Interstate Branching. The Dodd-Frank Act authorized national and state banks to establish branches in other states to the
same extent as a bank chartered by that state would be permitted to branch. Previously, banks could only establish branches
in other states if the host state expressly permitted out-of-state banks to establish branches in that state. Accordingly, banks
may now enter new markets more freely.
Consumer Protection Laws and Regulations. The banking regulatory agencies are focusing greater attention on compliance
with consumer protection laws and their implementing regulations. Examination and enforcement have become more intense
in nature, and insured institutions have been advised to monitor carefully compliance with such laws and regulations. The
Company is subject to many federal and state consumer protection and privacy statutes and regulations, including but not
limited to the following:
● The Equal Credit Opportunity Act generally prohibits discrimination in any credit transaction, whether for consumer
or business purposes, on the basis of race, color, religion, national origin, sex, marital status, age (except in limited
circumstances), receipt of income from public assistance programs, or good faith exercise of any rights under the
Consumer Credit Protection Act.
● The Truth in Lending Act (“TILA”) is designed to ensure that credit terms are disclosed in a meaningful way so that
consumers may compare credit terms more readily and knowledgeably. As a result of the TILA, all creditors must
use the same credit terminology to express rates and payments, including the annual percentage rate, the finance
charge, the amount financed, the total of payments and the payment schedule, among other things. As a result of the
Dodd-Frank Act, Regulation Z promulgated under the TILA includes new limits on loan originator compensation
for all closed-end mortgages. These changes include, prohibiting certain payments to a mortgage broker or loan
officer based on the transaction’s terms or conditions, prohibiting dual compensation, and prohibiting a mortgage
broker or loan officer from ‘‘steering’’ consumers to transactions not in their interest, to increase mortgage broker
or loan officer compensation.
● The Fair Housing Act (“FH Act”) regulates many practices, including making it unlawful for any lender to
discriminate in its housing-related lending activities against any person because of race, color, religion, national
origin, sex, handicap or familial status. A number of lending practices have been found by the courts to be, or may
be considered, illegal under the FH Act, including some that are not specifically mentioned in the FH Act itself.
● The Home Mortgage Disclosure Act (“HMDA”), in response to public concern over credit shortages in certain urban
neighborhoods, requires public disclosure of information that shows whether financial institutions are serving the
10
housing credit needs of the neighborhoods and communities in which they are located. The HMDA also includes a
“fair lending” aspect that requires the collection and disclosure of data about applicant and borrower characteristics
as a way of identifying possible discriminatory lending patterns and enforcing anti-discrimination statutes.
● The Right to Financial Privacy Act imposes a new requirement for financial institutions to provide new privacy
protections to consumers. Financial institutions must provide disclosures to consumers of its privacy policy, and
state the rights of consumers to direct their financial institution not to share their nonpublic personal information
with third parties.
● The Real Estate Settlement Procedures Act (“RESPA”) requires lenders to provide noncommercial borrowers with
disclosures regarding the nature and cost of real estate settlements. Also, RESPA prohibits certain abusive practices,
such as kickbacks, and places limitations on the amount of escrow accounts.
Penalties for noncompliance or violations under the above laws may include fines, reimbursement and other penalties. Due
to heightened regulatory expectations related to compliance generally, the Company may incur additional compliance costs.
The Dodd-Frank Act created the CFPB as a new, independent federal agency. The CFPB has broad rulemaking, supervisory
and enforcement powers under various federal consumer financial protection laws. The CFPB has examination and primary
enforcement authority with respect to depository institutions with $10 billion or more in assets. Smaller institutions, including
the Bank, are generally subject to rules promulgated by the CFPB but will continue to be examined and supervised by federal
banking regulators for consumer compliance purposes.
Anti-Money Laundering Laws. A series of banking laws and regulations beginning with the Bank Secrecy Act in 1970
requires banks to prevent, detect, and report illicit or illegal financial activities to the federal government to prevent money
laundering, international drug trafficking, and terrorism. Under the US PATRIOT Act of 2001, financial institutions are
subject to prohibitions against specified financial transactions and account relationships, requirements regarding the Customer
Identification Program, as well as enhanced due diligence and “know your customer” standards in their dealings with high
risk customers, foreign financial institutions, and foreign individuals and entities.
Privacy and Data Security. The Gramm-Leach Bliley Act (“GLBA”) of 1999 imposes requirements on financial institutions
with respect to consumer privacy. The GLBA generally prohibits disclosure of consumer information to non-affiliated third
parties unless the consumer has been given the opportunity to object and has not objected to such disclosure. Financial
institutions are further required to disclose their privacy policies to consumers annually. The GLBA also directs federal
regulators, including the FDIC, to prescribe standards for the security of consumer information. The Bank is subject to such
standards, as well as standards for notifying consumers in the event of a security breach. The Bank is required to have an
information security program to safeguard the confidentiality and security of customer information and to ensure proper
disposal of information that is no longer needed. Customers must be notified when unauthorized disclosure involves sensitive
customer information that may be misused.
Potential Enforcement Actions; Supervisory Agreements. Under federal law, the Company, the Bank and their institution-
affiliated parties may be the subject of potential enforcement actions by the FRB (in the case of the Company) or the FDIC
(in the case of the Bank) for unsafe and unsound practices in conducting their businesses, or for violations of any law, rule or
regulation or provision, any consent order with any agency, any condition imposed in writing by the agency or any written
agreement with the agency. Enforcement actions may include the imposition of a conservator or receiver, cease-and-desist
orders and written agreements, the termination of insurance of deposits, the imposition of civil money penalties, the payment
of restitution and removal and prohibition orders against institution-affiliated parties. The DBO also has authority to bring
similar enforcement actions against the Bank.
Legislation and Proposed Changes. From time to time, legislation is enacted which has the effect of increasing the cost of
doing business, limiting or expanding permissible activities or affecting the competitive balance between banks and other
financial institutions. Proposals to change the laws and regulations governing the operations and taxation of banks, bank
holding companies and other financial institutions are frequently made in Congress, in the California legislature and before
various bank regulatory agencies. Typically, the intent of this type of legislation is to strengthen the banking industry, even
if it may on occasion prove to be a burden on management’s plans. No prediction can be made as to the likelihood of any
major changes or the impact that new laws or regulations might have on us.
Effects of Government Monetary Policy. Our earnings and growth are affected not only by general economic conditions,
but also by the fiscal and monetary policies of the federal government, particularly the FRB. The FRB implements national
monetary policy for such purposes as curbing inflation and combating recession, through its open market operations in U.S.
11
Government securities, control of the discount rate applicable to borrowings from the FRB, and establishment of reserve
requirements against certain deposits. These activities influence growth of bank loans, investments and deposits, and also
affect interest rates charged on loans or paid on deposits. The Company’s profitability, like most financial institutions, is
primarily dependent on interest rate spreads. In general, the difference between the interest rates paid by the Bank on interest-
bearing liabilities, such as deposits and other borrowings, and the interest rates received by the Bank on interest-earning
assets, such as loans extended to customers and securities held in the investment portfolio, will comprise the major portion
of the Company’s earnings. These rates are highly sensitive to many factors that are beyond our control, such as inflation,
recession and unemployment, the monetary and fiscal policies of the federal government and the policies of regulatory
agencies, particularly the FRB and the impact which future changes in domestic and foreign economic conditions might have
on us cannot be predicted. The nature and impact of future changes in monetary policies and their impact on us cannot be
predicted with certainty.
Recent Accounting Pronouncements
See Note 2 – “Summary of Significant Accounting Policies – Adoption of New Accounting Standards” of the Company’s
Consolidated Financial Statements in Item 8 – Financial Statements and Supplementary Data of this Annual Report on Form
10K for information related to recent accounting pronouncements.
ITEM 1A. RISK FACTORS
A deterioration of national or local economic conditions could reduce the Company’s profitability.
The Company’s lending operations and its customers are primarily located in the eastern region of Northern California. A
significant downturn in the national economy or the local economy due to agricultural commodity prices, real estate prices,
public policy decisions, natural disaster, drought or other factors could result in a decline in the local economy in general,
which could in turn negatively impact the Company’s business, financial condition, results of operations and prospects.
The majority of the Company’s assets are loans, which if not repaid would result in losses to the Bank.
The Bank, like other lenders, is subject to credit risk, which is the risk of losing principal or interest due to borrowers’ failure
to repay loans in accordance with their terms. Underwriting and documentation controls cannot mitigate all credit risk.
Accordingly, the Company’s results of operations will be directly affected by the volume and timing of loan losses, which
for a number of reasons can vary from period to period. The risks of loan losses may be exacerbated by a downturn in the
economy or the real estate market in the Company’s market areas or a rapid increase in interest rates, which could have a
negative effect on collateral values and borrowers’ ability to repay. To the extent loans are not paid timely by borrowers, the
loans are placed on non-accrual status, thereby reducing interest income. Further, under these circumstances, an additional
provision for loan and lease losses or unfunded commitments may be required, which could negatively impact the Company’s
income and capital. See Management’s Discussion and Analysis of Financial Condition and Results of Operations – “Analysis
of Asset Quality and Allowance for Loan Losses”.
If the Company’s allowance for loan losses is not sufficient to absorb actual loan losses, the Company’s profitability could
be reduced.
The risk of loan losses is inherent in the lending business. The Company maintains an allowance for loan losses based upon
the Company’s actual losses over a relevant time period and management’s assessment of all relevant qualitative factors that
may cause future loss experience to differ from its historical loss experience. Although the Company maintains a rigorous
process for determining the allowance for loan losses, it can give no assurance that it will be sufficient to cover future loan
losses. If the allowance for loan losses is not adequate to absorb future losses, or if bank regulatory agencies require the
Company to increase its allowance for loan losses, earnings could be significantly and adversely impacted.
A deterioration in the real estate market could have a material adverse effect on the Company’s business, financial
condition and results of operations.
As of December 31, 2018, approximately 71% of the Company’s total loan portfolio is secured by real estate, the majority of
which is commercial real estate. Increases in commercial and consumer delinquency levels or declines in real estate market
values would require increased net charge-offs and increases in the allowance for loan losses, which could have a material
adverse effect on the Company’s business, financial condition and results of operations and prospects.
12
The FASB has recently issued an accounting standard update that will result in a significant change in how we recognize
credit losses and may have a material impact on our results of operations, financial condition or liquidity.
In June 2016, the Financial Accounting Standards Board issued ASU 2016-13, Financial Instruments - Credit Losses (Topic
326): Measurement of Credit Losses on Financial Instruments. ASU 2016-13 requires banking organizations to determine
the adequacy of their allowance for loan losses with an expected loss model, which is referred to as the current expected
credit loss (“CECL”) model. Under the CECL model, banking organizations will be required to present certain financial
assets carried at amortized cost, such as loans held for investment and held-to-maturity debt securities, at the net amount
expected to be collected. The measurement of expected credit losses is to be based on information about past events, including
historical experience, current conditions, and reasonable and supportable forecasts that affect the collectability of the reported
amount. This measurement will take place at the time the financial asset is first added to the balance sheet and periodically
thereafter. This differs significantly from the “incurred loss” model required under current GAAP, which delays recognition
until it is probable a loss has been incurred. ASU 2016-13 is expected to be effective for public business entities for fiscal
years after December 15, 2019. CECL will change the manner in which the Company determines the adequacy of its
allowance for loan losses. The Company is evaluating the impact the CECL model will have on its accounting, but the
Company may recognize a one-time cumulative-effect adjustment to the allowance for loan losses as of the beginning of the
first reporting period in which the new standard is effective. The Company cannot yet determine the magnitude of any such
one-time cumulative adjustment or of the overall impact of the new standard on its financial condition or results of operations.
The federal banking regulators have adopted a rule that gives a banking organization the option to phase in over a three-year
period the day-one adverse effects of CECL on its regulatory capital.
Fluctuations in interest rates could reduce profitability.
The Company’s earnings depend largely upon net interest income, which is the difference between the total interest income
earned on interest earning assets (primarily loans and investment securities) and the total interest expense incurred on interest
bearing liabilities (primarily deposits and borrowed funds). The interest earned on assets and paid on liabilities are affected
principally by direct competition, and general economic conditions at the state and national level and other factors beyond
the Company’s control such as actions of the FRB, the general supply of money in the economy, legislative tax policies,
governmental budgetary matters, and other state and federal economic policies. Although the Company maintains a rigorous
process for managing the impact of possible interest rate fluctuations on earnings, the Company can provide no assurance
that its management efforts will prevent earnings from being significantly and adversely impacted by changes in interest
rates.
The Company could be required to raise additional capital in the future, but that capital may not be available when it is
needed or may not be available on terms that are favorable to the Company.
Federal and state bank regulatory authorities require the Company and the Bank to maintain adequate levels of capital to
support their operations. The Company’s ability to raise additional capital if and as needed depends on conditions in the
capital markets, which are outside the Company’s control, and on the Company’s financial performance. Accordingly, the
Company may not be able to raise additional capital, if needed, on terms that are acceptable to the Company. If the Company
is unable to raise additional capital when needed, it could be required to curtail its growth strategy or reduce the levels of
assets owned. In addition, although the Company and the Bank are currently well-capitalized under applicable regulatory
frameworks, bank regulators are authorized and sometimes required to impose a wide range of requirements, conditions, and
restrictions on banks and bank holding companies that fail to maintain adequate capital levels.
Drought conditions in California could have an adverse impact on the Company’s business.
In recent years, California has experienced a severe drought. However, during 2016 and the first quarter of 2017 much of
California has experienced significant rain. A significant portion of the Company’s borrowers are involved in or are dependent
on the agricultural industry in California, which requires water. As of December 31, 2018, approximately 12% of the
Company’s loans were categorized as agricultural loans. As a result of the drought, there have been governmental proposals
concerning the distribution or rationing of water. If the amount of water available to agriculture becomes scarcer due to
drought or rationing, growers may not be able to continue to produce agricultural products profitably, which could force some
out of business. Although many of the Company’s customers are not directly involved in agriculture, they could be impacted
by difficulties in the agricultural industry because many jobs and businesses in the Company’s market areas are related to the
production of agricultural products. Therefore, the drought could adversely impact the Company’s loan portfolio, business,
financial condition and results of operations.
13
The Company faces substantial competition from larger banks and other financial institutions.
The Company faces substantial competition for deposits and loans. Competition for deposits primarily comes from other
commercial banks, savings institutions, thrift and loan associations, money market and mutual funds and other investment
alternatives. Competition for loans comes from other commercial banks, savings institutions, credit unions, mortgage banking
firms, thrift and loan associations and other financial intermediaries. Larger competitors, by virtue of their larger capital
resources, have substantially greater lending limits and marketing resources than the Company. In addition, they have greater
resources and may be able to offer longer maturities or lower rates. The Company’s competitors may also provide certain
services for their customers, including trust and international banking that the Company is only able to offer indirectly through
correspondent relationships. Ultimately, competition can reduce the Company’s profitability, as well as make it more difficult
to increase the size of its loan portfolio and deposit base.
There are risks associated with the Company’s growth strategy.
During the past three years, the Company has completed the purchase and assumption of a branch office in Redding,
California, completed the purchase and assumption of a branch office in Carson City, Nevada, opened a branch office in
Reno, Nevada and established loan production offices in Red Bluff, California and Klamath Falls, Oregon. The Company
may engage in additional acquisition activity and open additional offices in the future to expand the Company’s markets or
further its growth strategy. Acquiring other banks or branches involves various other risks commonly associated with
acquisitions, including, difficulty in estimating the value of the business to be acquired, integrating the operations and
retaining key employees and customers. There is no assurance that future acquisitions or offices will be successful. Further,
growth may strain the Company’s administrative, managerial, financial and operational resources and increase demands on
its systems and controls. If the Company pursues its growth strategy too aggressively, fails to attract qualified personnel,
control costs or maintain asset quality, or if factors beyond management’s control divert attention away from its business
operations, the Company’s pursuit of its growth strategy could have a material adverse impact on its existing business .
The Company relies on key executives and personnel and the loss of any of them could have a material adverse impact on
the Company’s prospects.
Competition for qualified employees and personnel in the banking industry is intense and there are a limited number of
qualified persons with knowledge of, and experience in, the California community banking industry. The process of recruiting
personnel with the combination of skills and attributes required to carry out the Company’s strategies is often lengthy. The
Company’s success depends to a significant degree upon its ability to attract and retain qualified management, loan
origination, finance, administrative, marketing, compliance and technical personnel and upon the continued contributions of
its management and personnel. In particular, the Company’s success has been and continues to be highly dependent upon the
abilities of key executives and certain other employees.
Security breaches and technological disruptions could damage the Company’s reputation and profitability. The
Company’s business is highly reliant on third party vendors and its ability to manage the operational risks associated with
outsourcing those services.
The Company’s electronic banking activities expose it to possible liability and harm to its reputation should an unauthorized
party gain access to confidential customer information. Despite its considerable efforts and investment to provide the security
and authentication necessary to effect secure transmission of data, the Company cannot fully guarantee that these precautions
will protect its systems from future compromises or breaches of its security measures. Although the Company has developed
systems and processes that are designed to recognize and assist in preventing security breaches (and periodically test its
security), failure to protect against or mitigate breaches of security could adversely affect its ability to offer and grow its
online services, constitute a breach of privacy or other laws, result in costly litigation and loss of customer relationships,
negatively impact the Bank’s reputation, and could have an adverse effect on its business, results of operations and financial
condition. The Company may also incur substantial increases in costs in an effort to minimize or mitigate cyber security risks
and to respond to cyber incidents.
The potential for operational risk exposure exists throughout the Company’s business. Integral to the Company’s performance
is the continued efficacy of the Company’s technology and information systems, operational infrastructure and relationships
with third parties and its colleagues in its day-to-day and ongoing operations. Failure by any or all of these resources subjects
us to risks that may vary in size, scale and scope. This includes, but is not limited to, operational or systems failures, disruption
of client operations and activities, ineffectiveness or exposure due to interruption in third party support as expected, as well
as, the loss of key colleagues or failure on the part of key colleagues to perform properly.
14
Additionally, the Company outsources a large portion of its data processing to third parties which may encounter
technological or other difficulties that may significantly affect the Company’s ability to process and account for customer
transactions. These vendors provide services that support its operations, including the storage and processing of sensitive
consumer and business customer data, as well as its sales efforts. A cyber security breach of a vendor’s system may result in
theft of the Company’s data or disruption of business processes. In most cases, the Company will remain primarily liable to
its customers for losses arising from a breach of a vendor’s data security system. The Company relies on its outsourced service
providers to implement and maintain prudent cyber security controls. The loss of these vendor relationships could disrupt
the services the Company provides to its customers and cause us to incur significant expense in connection with replacing
these services.
The Company may face regulatory enforcement actions, incur fines, penalties and other negative consequences from
regulatory violations, possibly even inadvertent or unintentional violations.
The Company is subject to significant federal and state regulation and supervision. In the past, the Company’s business has
been increasingly affected by these regulations, and this trend is likely to continue into the future. Many of these laws are
subject to interpretation and changing regulatory approaches to supervision and enforcement. The Company maintains
systems and procedures designed to ensure that it complies with applicable laws and regulations, but there can be no assurance
that these will be effective. The Company may face regulatory enforcement actions and incur fines, penalties and other
negative consequences from regulatory violations. The Company may also suffer other negative consequences resulting from
findings of noncompliance with laws and regulations, that may also damage its reputation, and this in turn might materially
affect its business and results of operations. Further, some legal/regulatory frameworks provide for the imposition of fines,
restitution or penalties for noncompliance even though the noncompliance was inadvertent or unintentional and even though
there were in place at the time systems and procedures designed to ensure compliance.
The Company’s disclosure controls and procedures may not prevent or detect all errors or acts of fraud.
The Company’s disclosure controls and procedures are designed to provide reasonable assurance that information required
to be disclosed by us in reports it files under the Exchange Act is accurately accumulated and communicated to management,
and recorded, processed, summarized, and reported within the time periods specified in the SEC’s rules and forms. The
Company believes that any disclosure controls and procedures or internal controls and procedures, no matter how well
conceived and operated, cannot provide absolute assurance that the objectives of the control system are met.
These inherent limitations include the realities that judgments in decision making can be faulty, that alternative reasoned
judgments can be drawn, or that breakdowns can occur because of a simple error or mistake. Additionally, controls can be
circumvented by the individual acts of some persons, by collusion of two or more people or by an unauthorized override of
the controls. Accordingly, because of the inherent limitations in its control system, misstatements due to error or fraud may
occur and not be detected, which could result in a material weakness in its internal controls over financial reporting and the
restatement of previously filed financial statements.
The price of the Company’s common stock may be volatile or may decline.
The trading price of the Company’s common stock may fluctuate as a result of a number of factors, many of which are outside
its control. Among the factors that could affect the Company’s stock price are:
• actual or anticipated quarterly fluctuations in the Company’s operating results and financial condition;
• research reports and recommendations by financial analysts;
• failure to meet analysts’ revenue or earnings estimates;
• speculation in the press or investment community;
• actions by the Company or its competitors, such as acquisitions or restructurings;
• actions by institutional shareholders;
• fluctuations in the stock prices and operating results of its competitors;
15
• general market conditions and, in particular, developments related to market conditions for the financial
services industry;
• proposed or adopted regulatory changes or developments;
• anticipated or pending investigations, proceedings or litigation that involve or affect us;
• domestic and international economic factors unrelated to its performance.
Significant decline in the Company’s stock price could result in substantial losses for individual shareholders and could lead
to costly and disruptive securities litigation.
The trading volume of the Company’s common stock is limited.
Although the Company’s common stock is traded on the Nasdaq Stock Market, trading volume to date has been relatively
modest. The limited trading market for the Company’s common stock may lead to exaggerated fluctuations in market prices
and possible market inefficiencies compared to more actively traded securities. It may also make it more difficult for investors
to sell the Company’s common stock at desired prices, especially for holders seeking to dispose of a large number of shares
of stock.
The Company depends primarily on the operations of the Bank to pay dividends, repurchase shares, repay its indebtedness
and fund its operations. The Bank’s ability to pay dividends to the Company depends on the success of the Bank’s
operations.
The Company is a separate and distinct legal entity from its subsidiary, the Bank, and it receives substantially all of its revenue
from dividends paid by the Bank. There are legal limitations on the extent to which the Bank may extend credit, pay dividends
or otherwise supply funds to, or engage in transactions with, the Company. The Company’s inability to receive dividends
from the Bank could adversely affect its business, financial condition, results of operations and prospects. Even if applicable
laws and regulations would permit the Bank to pay dividends to Company and would permit the Company to pay dividends
to its shareholders, the Board of Directors could determine that it is not in the best interest of the Company’s shareholders to
do so in order to preserve or redeploy our capital resources, for example. For these reasons, the amount and frequency of
dividends that the Company pays to shareholders may vary from time to time.
Reduction in the value, or impairment of our investment securities, can impact our earnings and common shareholders'
equity.
Generally Accepted Accounting Principles (“GAAP”) require the Company to carry its available-for-sale investment
securities at fair value on its balance sheet. Unrealized gains or losses on these securities, reflecting the difference between
the fair market value and the amortized cost, net of its tax effect, are reported as a component of shareholders’ equity. In
certain instances, GAAP requires recognition through earnings of declines in the fair value of securities that are deemed to
be other than temporarily impaired. Changes in the fair value of these securities may result from a number of circumstances
that are beyond the Company’s control, such as changes in interest rates, the financial condition of government sponsored
enterprises or insurers of municipal bonds, changes in demand for these securities as a result of economic conditions, or
reduced market liquidity. There can be no assurance that the declines in market value will not result in other than temporary
impairments of these assets, which would lead to loss recognition that could have a material adverse effect on the Company’s
net income and capital levels.
Damage to the Company’s reputation could significantly harm the Company’s business and prospects.
The Company’s reputation is an important asset. The Company’s relationship with many of its customers is predicated upon
its reputation as a high-quality provider of financial services that adheres to the highest standards of ethics, service quality
and regulatory compliance. The Company’s ability to attract and retain customers, investors and employees depends upon
external perceptions. Damage to its reputation among existing and potential customers, investors and employees could cause
significant harm to the Company’s business and prospects and may arise from numerous sources, including litigation or
regulatory actions, failing to deliver minimum standards of service and quality, lending practices, inadequate protection of
customer information, sales and marketing efforts, compliance failures, unethical behavior and the misconduct of employees.
Adverse developments in the banking industry may also, by association, negatively impact the Company’s reputation or result
in greater regulatory or legislative scrutiny or litigation against us. The Company has policies and procedures in place that
seek to protect its reputation and promote ethical conduct, but these policies and procedures may not be fully effective.
16
Negative publicity regarding the Company’s business, employees, or customers, with or without merit, may result in the loss
of customers, investors, and employees, costly litigation, a decline in revenues and increased governmental regulation.
The markets in which the Company operates are subject to the risk of earthquakes and other natural disasters.
Most of the Company’s offices are located in California. Also, most of the real and personal properties securing the
Company’s loans are located in California. California is prone to earthquakes, brush fires, flooding and other natural disasters.
In addition to possibly sustaining damage to its own properties, if there is a major earthquake, brush fires, flood or other
natural disaster, the Company faces the risk that many of the Company’s borrowers may experience uninsured property losses,
or sustained job interruption and/or loss which may materially impair their ability to meet the terms of their loan obligations.
Therefore, a major earthquake, brush fire, flood or other natural disaster in California could have a material adverse effect on
the Company’s business, financial condition, results of operations and cash flows.
The Company is exposed to risk of environmental liabilities with respect to real properties that is may acquire.
If the Company’s borrowers are unable to meet their loan repayment obligations, it will initiate foreclosure proceedings with
respect to and may take actions to acquire title to the personal and real property that collateralized their loans. As an owner
of such properties, the Company could become subject to environmental liabilities and incur substantial costs for any property
damage, personal injury, investigation and clean-up that may be required due to any environmental contamination that may
be found to exist at any of those properties, even though it did not engage in the activities that led to such contamination. In
addition, if the Company were the owner or former owner of a contaminated site, it could be subject to common law claims
by third parties seeking damages for environmental contamination emanating from the site. If the Company were to become
subject to significant environmental liabilities or costs, its business, financial condition, results of operations and prospects
could be adversely affected.
ITEM 1B. UNRESOLVED STAFF COMMENTS
Not applicable.
17
ITEM 2. PROPERTIES
Of the Company’s thirteen depository branches, ten are owned and three are leased. The Company also leases three lending
offices and owns four administrative facilities.
Owned Properties
35 South Lindan Avenue 32 Central Avenue 80 W. Main St.
Quincy, California (1) Quincy, California (1) Quincy, California (1)
424 N. Mill Creek 336 West Main Street 120 North Pine Street
Quincy, California (1) Quincy, California Portola, California
43163 Highway 299E 121 Crescent Street 255 Main Street
Fall River Mills, California Greenville, California Chester, California
510 North Main Street 3000 Riverside Drive 8475 North Lake Boulevard
Alturas, California Susanville, California Kings Beach, California
11638 Donner Pass Road 5050 Meadowood Mall Circle 215 N. Lake Boulevard
Truckee, California Reno, Nevada Tahoe City, California (4)
Leased Properties
243 North Lake Boulevard 1335 Hilltop Drive 470 Nevada St., Suite 108
Tahoe City, California Redding, California Auburn, California (2)
100 Amber Grove Dr., Suite 105 107 S. 7th St. 2130 Main St., Ste. B
Chico, CA (3) Klamath Falls, OR (3) Red Bluff, California (3)
1101 N. Carson St.
Carson City, Nevada
(1) Non-branch administrative or credit administrative offices. (2) SBA lending office.
(3) Commercial lending office.
(4) Future home of the Bank’s Tahoe City branch.
Total rental expenses under all leases totaled $340,000, $308,000 and $276,000, in 2018, 2017 and 2016 respectively. The
expiration dates of the leases vary, with the first such lease expiring during 2019 and the last such lease expiring during 2022.
Future minimum lease payments for operating leases having initial or remaining noncancelable lease terms in excess of one
year are as follows:
Year Ending December 31,
2019 $ 248,000
2020 163,000
2021 63,000
2022 59,000
2023 -
$ 533,000
The Company maintains insurance coverage on its premises, leaseholds and equipment, including business interruption and
record reconstruction coverage. The branch properties and non-branch offices are adequate, suitable, in good condition and
have adequate parking facilities for customers and employees. The Company and Bank are limited in their investments in
real property under Federal and state banking laws. Generally, investments in real property are either for the Company and
Bank use or are in real property and real property interests in the ordinary course of the Bank’s business.

18
ITEM 3. LEGAL PROCEEDINGS
From time to time, the Company and/or its subsidiary are a party to claims and legal proceedings arising in the ordinary
course of business. In the opinion of the Company's management, the amount of ultimate liability with respect to such
proceedings will not have a material adverse effect on the financial condition or results of operations of the Company taken
as a whole.
ITEM 4. MINE SAFETY DISCLOSURES
Not applicable.
19
PART II
ITEM 5. MARKET FOR REGISTRANT’S COMMON EQUITY, RELATED STOCK- HOLDER MATTERS AND
ISSUER PURCHASES OF EQUITY SECURITIES.
The Company’s common stock is quoted on the NASDAQ Capital Market under the ticker symbol "PLBC". As of
December 31, 2018, there were 5,137,476 shares of the Company’s common stock outstanding held by approximately 1,460
shareholders of record as of the same date. The following table shows the high and low sales prices for the common stock,
for each quarter as reported by Yahoo Finance.
Quarter Common Dividends per share High Low
4th Quarter 2018 $ 0.18 $ 27.90 $ 20.51
3rd Quarter 2018 - $ 28.50 $ 24.11
2nd Quarter 2018 0.18 $ 29.45 $ 23.50
1st Quarter 2018 - $ 25.75 $ 22.70
4th Quarter 2017 $ 0.14 $ 23.35 $ 20.35
3rd Quarter 2017 - $ 21.75 $ 19.10
2nd Quarter 2017 0.14 $ 22.00 $ 17.50
1st Quarter 2017 - $ 19.50 $ 15.85
It is the policy of the Company to periodically distribute excess retained earnings to the shareholders through the payment of
cash dividends. Such dividends help promote shareholder value and capital adequacy by enhancing the marketability of the
Company’s stock. All authority to provide a return to the shareholders in the form of a cash or stock dividend or split rests
with the Board of Directors. The Board will periodically, but on no regular schedule and in accordance with regulatory
restrictions, if any, reviews the appropriateness of a cash dividend payment. A semi-annual cash dividend totaling $0.14 per
share was paid on May 15, 2017 and November 15, 2017 and a semi-annual cash dividend totaling $0.18 per share was paid
on May 15, 2018 and November 15, 2018.
The Company is subject to various restrictions on the payment of dividends. See Note 12 “Shareholders’ Equity – Dividend
Restrictions” of the Company’s Consolidated Financial Statements in Item 8 – Financial Statements and Supplementary Data
of this Annual Report on Form 10K.
Securities Authorized for Issuance under Equity Compensation Plans. The following table sets forth securities authorized
for issuance under equity compensation plans as of December 31, 2018.
Plan Category
Number of securities to be
issued upon exercise of
outstanding options
Weighted-average
exercise price of
outstanding options
Number of securities remaining available for
future issuance under equity compensation
plans (excluding securities reflected in
column (a))
(a) (b) (c)
Equity compensation
plans approved by
security holders 202,693 $ 13.51 236,100
Equity compensation
plans not approved by
security holders None Not Applicable None
Total 202,693 $ 13.51 236,100
For additional information related to the above plans see Note 12 of the Company’s Consolidated Financial Statements in
Item 8 – Financial Statements and Supplementary Data of this Annual Report on Form 10K.
Issuer Purchases of Equity Securities. There were no purchases of Plumas Bancorp common stock by the Company during
2018 or 2017.
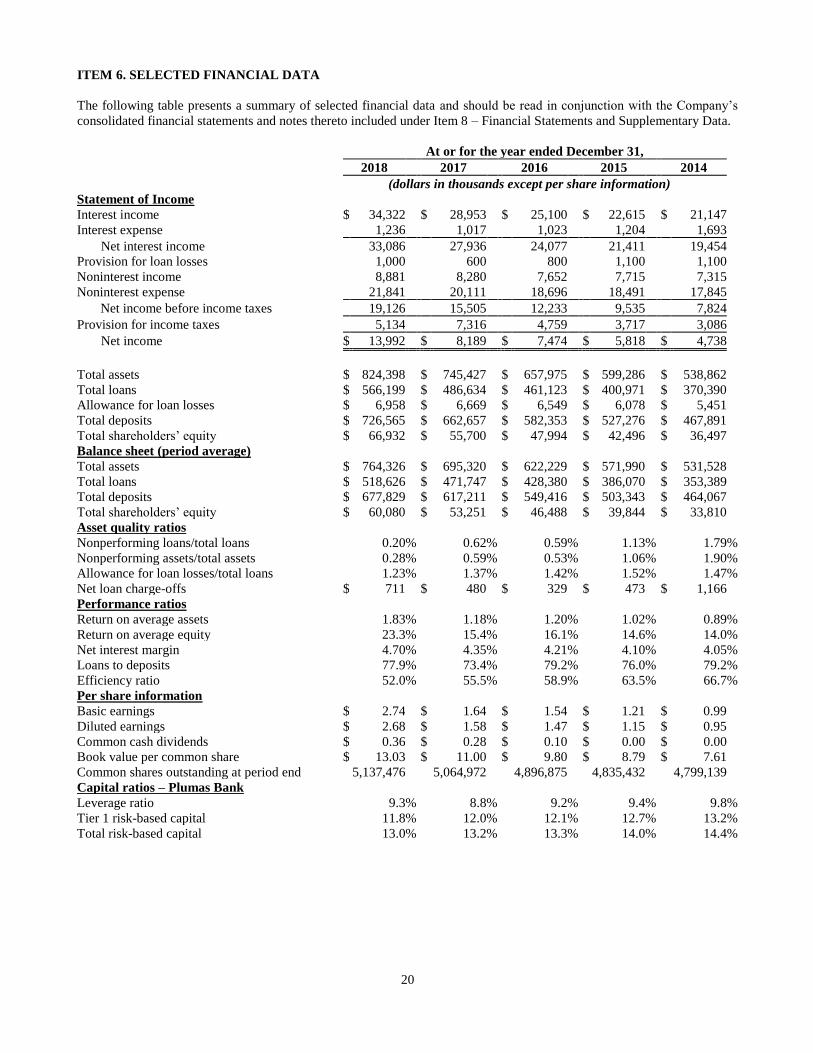
20
ITEM 6. SELECTED FINANCIAL DATA
The following table presents a summary of selected financial data and should be read in conjunction with the Company’s
consolidated financial statements and notes thereto included under Item 8 – Financial Statements and Supplementary Data.
At or for the year ended December 31,
2018 2017 2016 2015 2014
(dollars in thousands except per share information)
Statement of Income
Interest income $ 34,322 $ 28,953 $ 25,100 $ 22,615 $ 21,147
Interest expense 1,236 1,017 1,023 1,204 1,693
Net interest income 33,086 27,936 24,077 21,411 19,454
Provision for loan losses 1,000 600 800 1,100 1,100
Noninterest income 8,881 8,280 7,652 7,715 7,315
Noninterest expense 21,841 20,111 18,696 18,491 17,845
Net income before income taxes 19,126 15,505 12,233 9,535 7,824
Provision for income taxes 5,134 7,316 4,759 3,717 3,086
Net income $ 13,992 $ 8,189 $ 7,474 $ 5,818 $ 4,738
Total assets $ 824,398 $ 745,427 $ 657,975 $ 599,286 $ 538,862
Total loans $ 566,199 $ 486,634 $ 461,123 $ 400,971 $ 370,390
Allowance for loan losses $ 6,958 $ 6,669 $ 6,549 $ 6,078 $ 5,451
Total deposits $ 726,565 $ 662,657 $ 582,353 $ 527,276 $ 467,891
Total shareholders’ equity $ 66,932 $ 55,700 $ 47,994 $ 42,496 $ 36,497
Balance sheet (period average)
Total assets $ 764,326 $ 695,320 $ 622,229 $ 571,990 $ 531,528
Total loans $ 518,626 $ 471,747 $ 428,380 $ 386,070 $ 353,389
Total deposits $ 677,829 $ 617,211 $ 549,416 $ 503,343 $ 464,067
Total shareholders’ equity $ 60,080 $ 53,251 $ 46,488 $ 39,844 $ 33,810
Asset quality ratios
Nonperforming loans/total loans 0.20 % 0.62 % 0.59 % 1.13 % 1.79 %
Nonperforming assets/total assets 0.28 % 0.59 % 0.53 % 1.06 % 1.90 %
Allowance for loan losses/total loans 1.23 % 1.37 % 1.42 % 1.52 % 1.47 %
Net loan charge-offs $ 711 $ 480 $ 329 $ 473 $ 1,166
Performance ratios
Return on average assets 1.83 % 1.18 % 1.20 % 1.02 % 0.89 %
Return on average equity 23.3 % 15.4 % 16.1 % 14.6 % 14.0 %
Net interest margin 4.70 % 4.35 % 4.21 % 4.10 % 4.05 %
Loans to deposits 77.9 % 73.4 % 79.2 % 76.0 % 79.2 %
Efficiency ratio 52.0 % 55.5 % 58.9 % 63.5 % 66.7 %
Per share information
Basic earnings $ 2.74 $ 1.64 $ 1.54 $ 1.21 $ 0.99
Diluted earnings $ 2.68 $ 1.58 $ 1.47 $ 1.15 $ 0.95
Common cash dividends $ 0.36 $ 0.28 $ 0.10 $ 0.00 $ 0.00
Book value per common share $ 13.03 $ 11.00 $ 9.80 $ 8.79 $ 7.61
Common shares outstanding at period end 5,137,476 5,064,972 4,896,875 4,835,432 4,799,139
Capital ratios – Plumas Bank
Leverage ratio 9.3 % 8.8 % 9.2 % 9.4 % 9.8 %
Tier 1 risk-based capital 11.8 % 12.0 % 12.1 % 12.7 % 13.2 %
Total risk-based capital 13.0 % 13.2 % 13.3 % 14.0 % 14.4 %
21
ITEM 7. MANAGEMENT’S DISCUSSION AND ANALYSIS OF FINANCIAL CONDITION AND RESULTS OF
OPERATIONS
General
We are a bank holding company for Plumas Bank, a California state-chartered commercial bank. We derive our income
primarily from interest received on real estate related, commercial, automobile and consumer loans and, to a lesser extent,
interest on investment securities, fees received in connection with servicing deposit and loan customers and gains from the
sale of government guaranteed loans. Our major operating expenses are the interest we pay on deposits and borrowings and
general operating expenses. We rely on locally-generated deposits to provide us with funds for making loans.
We are subject to competition from other financial institutions and our operating results, like those of other financial
institutions operating in California, are significantly influenced by economic conditions in California, including the strength
of the real estate market. In addition, both the fiscal and regulatory policies of the federal and state government and regulatory
authorities that govern financial institutions and market interest rates also impact the Bank’s financial condition, results of
operations and cash flows.
Critical Accounting Policies
Our accounting policies are integral to understanding the financial results reported. Our most complex accounting policies
require management’s judgment to ascertain the valuation of assets, liabilities, commitments and contingencies. We have
established detailed policies and internal control procedures that are intended to ensure valuation methods are applied in an
environment that is designed and operating effectively and applied consistently from period to period. The following is a
brief description of our current accounting policies involving significant management valuation judgments.
Allowance for Loan Losses. The allowance for loan losses is an estimate of credit losses inherent in the Company's loan
portfolio that have been incurred as of the balance-sheet date. The allowance is established through a provision for loan losses
which is charged to expense. Additions to the allowance are expected to maintain the adequacy of the total allowance after
credit losses and loan growth. Credit exposures determined to be uncollectible are charged against the allowance. Cash
received on previously charged off amounts is recorded as a recovery to the allowance. The overall allowance consists of two
primary components, specific reserves related to impaired loans and general reserves for inherent losses related to loans that
are collectively evaluated for impairment.
We evaluate our allowance for loan losses quarterly. We believe that the allowance for loan losses is a “critical accounting
estimate” because it is based upon management’s assessment of various factors affecting the collectability of the loans,
including current economic conditions, past credit experience, delinquency status, the value of the underlying collateral, if
any, and a continuing review of the portfolio of loans.
We cannot provide you with any assurance that economic difficulties or other circumstances which would adversely affect
our borrowers and their ability to repay outstanding loans will not occur which would be reflected in increased losses in our
loan portfolio, which could result in actual losses that exceed reserves previously established.
22
The following discussion is designed to provide a better understanding of significant trends related to the Company's financial
condition, results of operations, liquidity and capital. It pertains to the Company's financial condition, changes in financial
condition and results of operations as of December 31, 2018 and 2017 and for each of the three years in the period ended
December 31, 2018. The discussion should be read in conjunction with the Company's audited consolidated financial
statements and notes thereto and the other financial information appearing elsewhere herein.
Overview
The Company recorded net income of $14.0 million for the year ended December 31, 2018, an increase of $5.8 million or
71% over net income of $8.2 million during the year ended December 31, 2017. Pretax income increased by $3.6 million, or
23%, to $19.1 million in 2018 from $15.5 million during the year ended December 31, 2017. Net income for 2017 was
reduced by $1.4 million, or $0.27 per diluted share, because of a one-time revaluation of the Company’s deferred tax assets.
Net interest income increased by $5.2 million to $33.1 million during 2018 from $27.9 million for the year ended December
31, 2017. This increase in net interest income resulted from an increase in interest income of $5.4 million and an increase in
interest expense of $219 thousand. Interest on loans increased by $4.0 million, interest on investment securities increased by
$1.5 million. Interest on other interest earning assets decreased by $64 thousand. The provision for loan losses was $1.0
million during 2018 up $400 thousand from $600 thousand during 2017.
During the year ended December 31, 2018 non-interest income totaled $8.9 million an increase of $601 thousand from the
$8.3 million earned during 2017. Non-interest expense increased by $1.7 million to $21.8 million during the twelve months
ended December 31, 2018. The largest component of the increase in non-interest expense was an increase in salary and benefit
expense of $633 thousand.
The provision for income taxes decreased by $2.2 million from $7.3 million in 2017 to $5.1 million during the year ended
December 31, 2018.
Total assets at December 31, 2018 were $824 million, an increase of $79 million from $745 million at December 31, 2017.
This increase included increases of $80.3 million in net loans ($79.6 million in gross loans), $34.0 million in investment
securities, $2.9 million in premises and equipment and $2.8 million in other assets. These items were partially offset by a
decrease of $40.8 million in cash and due from banks and $0.2 million in OREO.
Gross loans increased by $79.6 million, or 16%, from $486.6 million at December 31, 2017 to $566.2 million at December
31, 2018. The increase in loan balances includes $31.4 million in commercial real estate loans, $16.7 million in automobile
loans, $15.0 million in construction and land development loans, $10.3 million in agricultural loans and $9.9 million in
commercial loans. These increases were partially offset by declines in other loan categories the largest of which was a
decrease of $3.3 million in equity lines of credit.
Total deposits increased by $63.9 million, or 10%, from $662.7 million at December 31, 2017 to $726.6 million at December
31, 2018. The increase in deposits includes $45 million in deposits at our Carson City, Nevada branch which we purchased
from Mutual of Omaha Bank on October 26, 2018. At December 31, 2018, 42% of the Company’s deposits were in the form
of non-interest-bearing demand deposits. At December 31, 2017, 43% of the Company’s deposits were in the form of non-
interest-bearing demand deposits.
The increase in deposits of $63.9 million includes increases of $22.0 million in money market accounts, $21.8 million in
demand deposits, $10.9 million in time deposits, $5.9 million in interest-bearing demand deposits and $3.3 million in savings
accounts. The increase in time deposits relates to the Carson City branch acquisition as does much of the increase in money
market accounts. The Company has no brokered deposits.
Total shareholders’ equity increased by $11.2 million from $55.7 million at December 31, 2017 to $66.9 million at December
31, 2018. The largest component of the $11.2 million increase was earnings during the twelve-month period totaling $14.0
million. During 2018 the Company paid two 18 cents per share semi-annual cash dividends which had the effect of reducing
shareholders’ equity by $1.8 million.
The return on average assets was 1.83% for 2018, up from 1.18% for 2017. The return on average equity was 23.3% for 2018,
up from 15.4% for 2017.
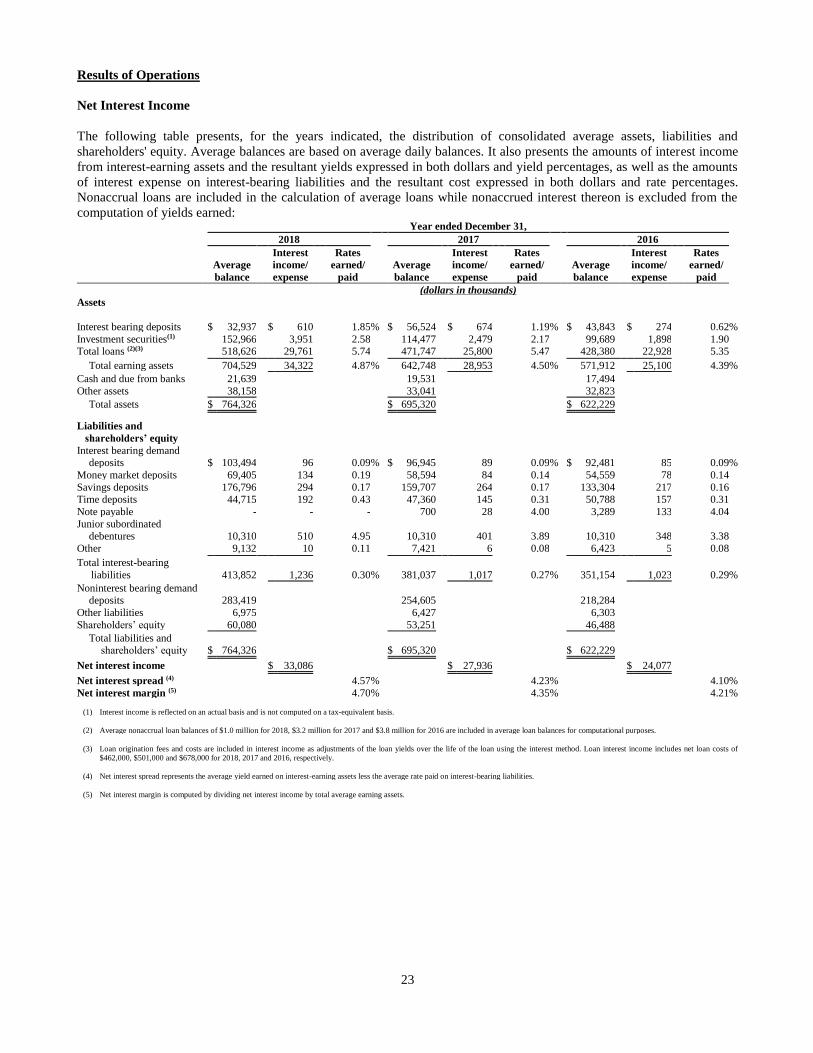
23
Results of Operations
Net Interest Income
The following table presents, for the years indicated, the distribution of consolidated average assets, liabilities and
shareholders' equity. Average balances are based on average daily balances. It also presents the amounts of interest income
from interest-earning assets and the resultant yields expressed in both dollars and yield percentages, as well as the amounts
of interest expense on interest-bearing liabilities and the resultant cost expressed in both dollars and rate percentages.
Nonaccrual loans are included in the calculation of average loans while nonaccrued interest thereon is excluded from the
computation of yields earned: Year ended December 31,
2018 2017 2016
Average
balance
Interest
income/
expense
Rates
earned/
paid
Average
balance
Interest
income/
expense
Rates
earned/
paid
Average
balance
Interest
income/
expense
Rates
earned/
paid
(dollars in thousands)
Assets
Interest bearing deposits $ 32,937 $ 610 1.85 % $ 56,524 $ 674 1.19 % $ 43,843 $ 274 0.62 %
Investment securities(1) 152,966 3,951 2.58 114,477 2,479 2.17 99,689 1,898 1.90 Total loans (2)(3) 518,626 29,761 5.74 471,747 25,800 5.47 428,380 22,928 5.35
Total earning assets 704,529 34,322 4.87 % 642,748 28,953 4.50 % 571,912 25,100 4.39 %
Cash and due from banks 21,639 19,531 17,494
Other assets 38,158 33,041 32,823
Total assets $ 764,326 $ 695,320 $ 622,229
Liabilities and
shareholders’ equity
Interest bearing demand deposits $ 103,494 96 0.09 % $ 96,945 89 0.09 % $ 92,481 85 0.09 %
Money market deposits 69,405 134 0.19 58,594 84 0.14 54,559 78 0.14
Savings deposits 176,796 294 0.17 159,707 264 0.17 133,304 217 0.16 Time deposits 44,715 192 0.43 47,360 145 0.31 50,788 157 0.31
Note payable - - - 700 28 4.00 3,289 133 4.04
Junior subordinated debentures 10,310 510 4.95 10,310 401 3.89 10,310 348 3.38
Other 9,132 10 0.11 7,421 6 0.08 6,423 5 0.08
Total interest-bearing
liabilities 413,852 1,236 0.30 % 381,037 1,017 0.27 % 351,154 1,023 0.29 %
Noninterest bearing demand deposits 283,419 254,605 218,284
Other liabilities 6,975 6,427 6,303
Shareholders’ equity 60,080 53,251 46,488
Total liabilities and shareholders’ equity $ 764,326 $ 695,320 $ 622,229
Net interest income $ 33,086 $ 27,936 $ 24,077
Net interest spread (4) 4.57 % 4.23 % 4.10 %
Net interest margin (5) 4.70 % 4.35 % 4.21 %
(1) Interest income is reflected on an actual basis and is not computed on a tax-equivalent basis.
(2) Average nonaccrual loan balances of $1.0 million for 2018, $3.2 million for 2017 and $3.8 million for 2016 are included in average loan balances for computational purposes.
(3) Loan origination fees and costs are included in interest income as adjustments of the loan yields over the life of the loan using the interest method. Loan interest income includes net loan costs of
$462,000, $501,000 and $678,000 for 2018, 2017 and 2016, respectively.
(4) Net interest spread represents the average yield earned on interest-earning assets less the average rate paid on interest-bearing liabilities.
(5) Net interest margin is computed by dividing net interest income by total average earning assets.
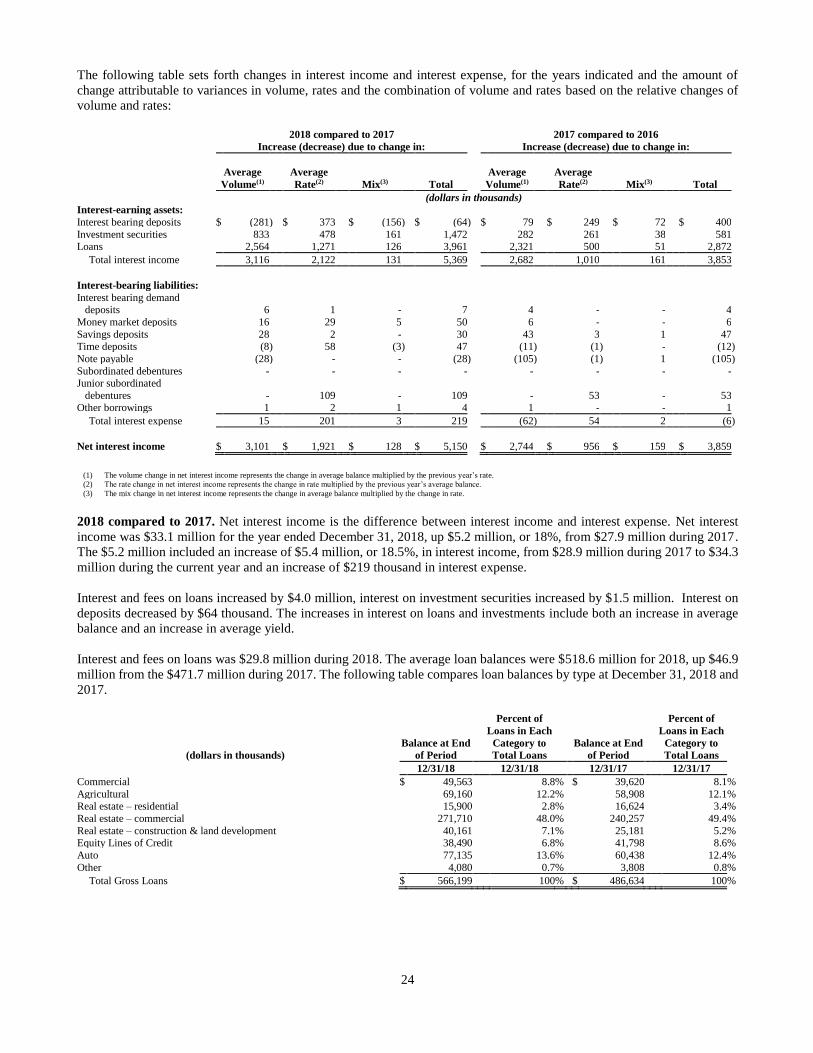
24
The following table sets forth changes in interest income and interest expense, for the years indicated and the amount of
change attributable to variances in volume, rates and the combination of volume and rates based on the relative changes of
volume and rates:
2018 compared to 2017
Increase (decrease) due to change in:
2017 compared to 2016
Increase (decrease) due to change in:
Average Average Average Average
Volume(1) Rate(2) Mix(3) Total Volume(1) Rate(2) Mix(3) Total
(dollars in thousands) Interest-earning assets:
Interest bearing deposits $ (281 ) $ 373 $ (156 ) $ (64 ) $ 79 $ 249 $ 72 $ 400
Investment securities 833 478 161 1,472 282 261 38 581 Loans 2,564 1,271 126 3,961 2,321 500 51 2,872
Total interest income 3,116 2,122 131 5,369 2,682 1,010 161 3,853
Interest-bearing liabilities:
Interest bearing demand deposits 6 1 - 7 4 - - 4
Money market deposits 16 29 5 50 6 - - 6
Savings deposits 28 2 - 30 43 3 1 47
Time deposits (8 ) 58 (3 ) 47 (11 ) (1 ) - (12 )
Note payable (28 ) - - (28 ) (105 ) (1 ) 1 (105 )
Subordinated debentures - - - - - - - - Junior subordinated
debentures - 109 - 109 - 53 - 53 Other borrowings 1 2 1 4 1 - - 1
Total interest expense 15 201 3 219 (62 ) 54 2 (6 )
Net interest income $ 3,101 $ 1,921 $ 128 $ 5,150 $ 2,744 $ 956 $ 159 $ 3,859
(1) The volume change in net interest income represents the change in average balance multiplied by the previous year’s rate.
(2) The rate change in net interest income represents the change in rate multiplied by the previous year’s average balance.
(3) The mix change in net interest income represents the change in average balance multiplied by the change in rate.
2018 compared to 2017. Net interest income is the difference between interest income and interest expense. Net interest
income was $33.1 million for the year ended December 31, 2018, up $5.2 million, or 18%, from $27.9 million during 2017.
The $5.2 million included an increase of $5.4 million, or 18.5%, in interest income, from $28.9 million during 2017 to $34.3
million during the current year and an increase of $219 thousand in interest expense.
Interest and fees on loans increased by $4.0 million, interest on investment securities increased by $1.5 million. Interest on
deposits decreased by $64 thousand. The increases in interest on loans and investments include both an increase in average
balance and an increase in average yield.
Interest and fees on loans was $29.8 million during 2018. The average loan balances were $518.6 million for 2018, up $46.9
million from the $471.7 million during 2017. The following table compares loan balances by type at December 31, 2018 and
2017.
(dollars in thousands)
Balance at End
of Period
Percent of
Loans in Each
Category to
Total Loans
Balance at End
of Period
Percent of
Loans in Each
Category to
Total Loans
12/31/18 12/31/18 12/31/17 12/31/17
Commercial $ 49,563 8.8 % $ 39,620 8.1 %
Agricultural 69,160 12.2 % 58,908 12.1 % Real estate – residential 15,900 2.8 % 16,624 3.4 %
Real estate – commercial 271,710 48.0 % 240,257 49.4 %
Real estate – construction & land development 40,161 7.1 % 25,181 5.2 % Equity Lines of Credit 38,490 6.8 % 41,798 8.6 %
Auto 77,135 13.6 % 60,438 12.4 %
Other 4,080 0.7 % 3,808 0.8 %
Total Gross Loans $ 566,199 100 % $ 486,634 100 %
25
The average yield on loans was 5.74% for 2018 up 27 basis points from 5.47% for 2017. We attribute much of the increase
in yield to an increase in the average prime rate of 81 basis points. At December 31, 2018 approximately 28% of the
Company’s loan portfolio was comprised of loans tied to the prime rate or an equivalent rate.
Interest on investment securities increased by $1.5 million as a result of an increase in yield of 41 basis points from 2.17%
during 2017 to 2.58% during 2018 and an increase in average balance from $114.5 million in 2017 to $153.0 million in 2018.
During the current period yield benefited from market conditions and the maturity, sales and payments on lower earning
securities. Interest income on interest bearing deposits, which totaled $610 thousand in 2018 and $674 thousand in 2017,
primarily relates to interest on cash balances held at the Federal Reserve. The $64 thousand decrease in interest on interest
bearing deposits was related to a decrease in average interest earning deposits of $23.6 million from $56.5 million during
2017 to $32.9 million in 2018. The decrease in average balance was mostly offset by an increase in yield of 66 basis points
from 119 basis points in 2017 to 185 basis points in 2018; consistent with the increase in the average fed funds rate during
these periods.
Interest expense on deposits increased by $134 thousand to $716 thousand for the twelve months ended December 31, 2018,
up from $582 thousand in 2017. Of this increase, $81 thousand relates to interest in our Carson City branch which we acquired
on October 26, 2018. The average rate paid on the Carson City money market and time deposits exceeds that which the Bank
pays in other markets and we would expect some runoff on these accounts as they reprice over time. Interest expense on
NOW accounts increased by $7 thousand. Rates paid on NOW accounts averaged 0.09% during 2018 and 2017. Average
balances increased by $6.6 million to $103.5 million during 2018 from $96.9 million during 2017. Interest expense on money
market accounts increased by $50 thousand to $134 thousand during the year ended December 31, 2018. Rates paid on money
market accounts averaged 0.19% during 2018 and 0.14% in 2017. The increase is primarily related to higher cost money
market accounts at the Carson City branch. Average balances increased by $10.8 million from $58.6 million in 2017 to $69.4
million during the year ended December 31, 2018. Much of this increase is associated with the acquisition of the Carson City
branch. Interest expense on savings accounts increased by $30 thousand as we continued to experience growth in this category
of deposits. Average savings deposits increased by $17.1 million from $159.7 million during 2017 to $176.8 million during
2018. The average rate paid on savings accounts was 17 basis points in 2018 and 2017.
Interest expense on time deposits increased $47 thousand from $145 thousand during 2017 to $192 thousand during 2018
primarily as a result of the acquisition of the Carson City branch Average time deposits declined by $2.7 million from $47.4
million during 2017 to $44.7 million during the year ended December 31, 2018. The average rate paid on time deposits was
0.43% in 2018 and 0.31% during 2017.
Interest expense on other interest-bearing liabilities increased by $85 thousand from $435 thousand during the year ended
December 31, 2017 to $520 thousand during the current twelve-month period. Interest expense on the Company’s note
payable decreased by $28 thousand during the twelve months ended December 31, 2018. This decrease was related to a
decrease in average borrowings on this note from $700 thousand during 2017 to $0 in 2018. The note payable was paid off
in April of 2017. Interest expense on junior subordinated debentures, which increased by $109 thousand to $510 thousand,
fluctuates with changes in the 3-month London Interbank Offered Rate (LIBOR) rate.
Net interest margin is net interest income expressed as a percentage of average interest-earning assets. As a result of the
changes noted above, the net interest margin for 2018 increased to 4.70%, from 4.35% during 2017.
2017 compared to 2016. Net interest income was $27.9 million for the year ended December 31, 2017, up $3.8 million, or
16%, from $24.1 million for 2016. The $3.8 million included an increase of $3.8 million, or 15.4%, in interest income, from
$25.1 million during 2016 to $28.9 million during the current year and a decrease of $6 thousand in interest expense.
Interest and fees on loans increased by $2.9 million, interest on investment securities increased by $581 thousand and interest
on deposits increased by $400 thousand. These increases include both an increase in average balance and an increase in
average yield.
Interest and fees on loans was $25.8 million during 2017. The average loan balances were $471.7 million for 2017, up $43.3
million from the $428.4 million during 2016.
26
The average yield on loans was 5.47% for 2017 up 12 basis points from 5.35% for 2016. We attribute much of the increase
in yield to an increase in the average prime rate of 59 basis points mostly offset to by price competition in our service area.
At December 31, 2017 approximately 30% of the Company’s loan portfolio was comprised of loans tied to the prime rate or
an equivalent rate.
Interest on investment securities increased by $581 thousand as a result of an increase in yield of 27 basis points from 1.90%
during 2016 to 2.17% during 2017 and an increase in average balance from $99.7 million in 2016 to $114.5 million in 2017.
During the current period yield benefited from market conditions and the maturity, sales and payments on lower earning
securities. Interest income on interest bearing deposits, which totaled $674 thousand in 2017 and $274 thousand in 2016,
primarily relates to interest on cash balances held at the Federal Reserve. The $400 thousand increase in interest on interest
bearing deposits was related to an increase in yield of 57 basis points from 62 basis points in 2016 to 119 basis points in 2017;
consistent with the increase in the average fed funds rate during these periods. In addition, average interest earning deposits
increased by $12.7 million from $43.8 million during 2016 to $56.5 million in 2017.
Interest expense on deposits increased by $45 thousand to $582 thousand for the twelve months ended December 31, 2017,
up from $537 thousand in 2016. Interest expense on NOW accounts increased by $4 thousand. Rates paid on NOW accounts
averaged 0.09% during 2017 and 2016. Average balances increased by $4.4 million to $96.9 million during 2017 from $92.5
million during 2016. Interest expense on money market accounts increased by $6 thousand to $84 thousand during the year
ended December 31, 2017. Rates paid on money market accounts averaged 0.14% during 2017 and 2016. Average balances
increased by $4.0 million from $54.6 million in 2016 to $58.6 million during the year ended December 31, 2017. Interest
expense on savings accounts increased by $47 thousand as we continued to experience strong growth in this category of
deposits. Average savings deposits increased by $26.4 million from $133.3 million during 2016 to $159.7 million during
2017. The average rate paid on savings accounts increased slightly from 16 basis points during 2016 to 17 basis points in
2017.
Interest expense on time deposits declined by $12 thousand from $157 thousand during 2016 to $145 thousand during 2017.
Average time deposits declined by $3.4 million from $50.8 million during 2016 to $47.4 million during the year ended
December 31, 2017. We attribute much of this decline to migration into other types of deposits given the low rates and lack
of liquidity associated with time deposits. The average rate paid on time deposits was 0.31% during both 2016 and 2017.
Interest expense on other interest-bearing liabilities decreased by $51 thousand from $486 thousand during the year ended
December 31, 2016 to $435 thousand during the current twelve-month period. Interest expense on the Company’s note
payable decreased by $105 thousand to $28 thousand during the twelve months ended December 31, 2017. This decrease was
related to a decrease in average borrowings on this note from $3.3 million during the 2016 to $700 thousand during 2017.
The note payable was paid off in April of 2017. Interest expense on junior subordinated debentures, which increased by $53
thousand to $401 thousand, fluctuates with changes in the 3-month London Interbank Offered Rate (LIBOR) rate.
As a result of the changes noted above, the net interest margin for 2017 increased to 4.35%, from 4.21% during 2016.
Provision for Loan Losses
During the year ended December 31, 2018 we recorded a provision for loan losses of $1.0 million up $400 thousand from
$600 thousand during the year ended December 31, 2017. See “Analysis of Asset Quality and Allowance for Loan Losses”
for further discussion of loan quality trends and the provision for loan losses.
The allowance for loan losses is maintained at a level that management believes will be appropriate to absorb inherent losses
on existing loans based on an evaluation of the collectability of the loans and prior loan loss experience. The evaluations take
into consideration such factors as changes in the nature and volume of the portfolio, overall portfolio quality, review of
specific problem loans, and current economic conditions that may affect the borrower's ability to repay their loan. The
allowance for loan losses is based on estimates, and ultimate losses may vary from the current estimates.
These estimates are reviewed periodically and, as adjustments become necessary, they are reported in earnings in the periods
in which they become known. Based on information currently available, management believes that the allowance for loan
losses is appropriate to absorb potential risks in the portfolio. However, no assurance can be given that the Company may not
sustain charge-offs which are in excess of the allowance in any given period.
27
Non-Interest Income
The following table sets forth the components of non-interest income for the years ended December 31, 2018, 2017 and 2016.
Years Ended December 31, Change during Year
2018 2017 2016 2018 2017
(dollars in thousands)
Service charges on deposit accounts $ 2,576 $ 2,467 $ 2,291 $ 109 $ 176
Interchange revenue 2,174 1,987 1,740 187 247
Gain on sale of loans, net 1,903 2,039 1,770 (136 ) 269
Loan servicing fees 800 731 642 69 89
Earnings on bank owned life
insurance policies 328 338 341 (10 ) (3 )
Gain on equity securities with no
readily determinable fair value 209 - - 209 -
Loss on sale of investments (8 ) (158 ) (32 ) 150 (126 )
Other income 899 876 900 23 (24 )
Total non-interest income $ 8,881 $ 8,280 $ 7,652 $ 601 $ 628
2018 compared to 2017. During the year ended December 31, 2018, non-interest income totaled $8.9 million, an increase of
$601 thousand from the twelve months ended December 31, 2017. Included in this increase were two items of a non-recurring
nature. A $209 thousand gain was recorded upon the prospective adoption of a newly effective accounting pronouncement
impacting the measurement of equity securities, which in our case consists of stock in our correspondent banks, without a
readily determinable fair market value, and the loss on sale of investment securities declined by $150 thousand to $8 thousand
in 2018. Other significant increases in non-interest income included $109 thousand in service charges on deposit accounts,
$187 thousand in interchange income and $69 thousand in loan service fees. We attribute these increases primarily to growth
in the bank.
The largest decrease in non-interest income was a $136 thousand decline in gains on sale of loans. The decline in gain on sale
relates to a decline in the average premium received on sale. Gains on sale of loans mostly relate to sales of SBA 7(a) loans.
Gains on sale of loans decreased from $2.0 million during 2017 to $1.9 million during the twelve months ended December
31, 2018. Proceeds from SBA loan sales totaled $41.7 million during 2018 and $36.6 million during the twelve months ended
December 31, 2017. Loans originated for sale totaled $38.9 million during the twelve months ended December 31, 2018 and
$31.3 million during 2017. Loan servicing income, which increased by $69 thousand, represents servicing income received
on the guaranteed portion of SBA loans sold into the secondary market. At December 31, 2018 we were servicing $122
million in guaranteed portions of loans, an increase of $9 million from $113 million at December 31, 2017.
2017 compared to 2016. During the year ended December 31, 2017, non-interest income totaled $8.3 million, an increase of
$628 thousand from the twelve months ended December 31, 2016. The largest components of this increase were increases of
$423 thousand in service charge income, $269 thousand gain on sale of loans and $89 thousand in loan servicing income.
The increase in service charge income includes significant increases in interchange income on debit card transactions, an
increase in overdraft income and an increase in service charges on deposit accounts. Interchange income benefited from an
increase in the size of the Bank as well as an increase in marketing efforts directed to this product, while overdraft income
and service charges on deposit accounts benefited both from an increase in the size of the Bank as well as an increase in rates
charged for various services beginning in October of 2016. Gains on sale of loans increased from $1.8 million during 2016
to $2.0 million during the twelve months ended December 31, 2017. Proceeds from SBA loan sales totaled $36.6 million
during 2017 and $30.7 million during the twelve months ended December 31, 2016. Loans originated for sale totaled $31.3
million during the twelve months ended December 31, 2017 and $30.4 million during 2016. Loan servicing income, which
increased by $89 thousand, represents servicing income received on the guaranteed portion of SBA loans sold into the
secondary market. At December 31, 2017 we were servicing $113 million in guaranteed portions of loans, an increase of $16
million from $97 million at December 31, 2016. The largest decrease in non-interest income was a $126 increase in loss on
sale of investment securities from $32 thousand in 2016 to $158 thousand in 2017.
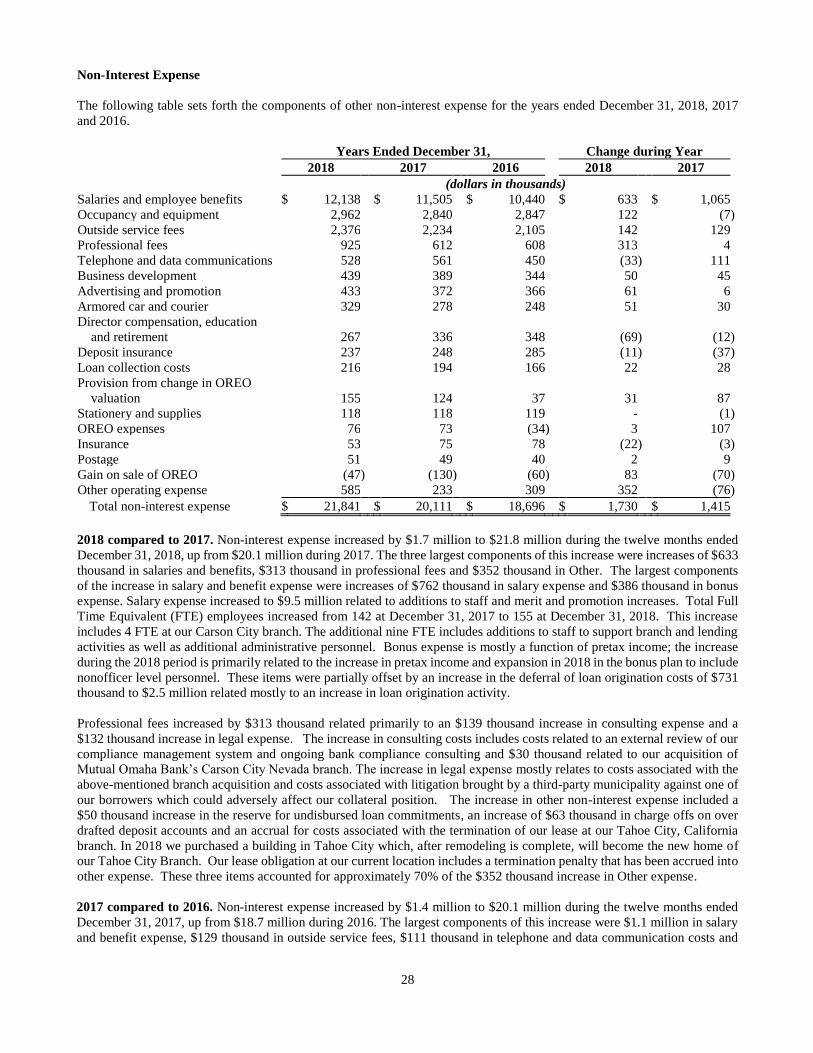
28
Non-Interest Expense
The following table sets forth the components of other non-interest expense for the years ended December 31, 2018, 2017
and 2016.
Years Ended December 31, Change during Year
2018 2017 2016 2018 2017
(dollars in thousands)
Salaries and employee benefits $ 12,138 $ 11,505 $ 10,440 $ 633 $ 1,065
Occupancy and equipment 2,962 2,840 2,847 122 (7 )
Outside service fees 2,376 2,234 2,105 142 129
Professional fees 925 612 608 313 4
Telephone and data communications 528 561 450 (33 ) 111
Business development 439 389 344 50 45
Advertising and promotion 433 372 366 61 6
Armored car and courier 329 278 248 51 30
Director compensation, education
and retirement 267 336 348 (69 ) (12 )
Deposit insurance 237 248 285 (11 ) (37 )
Loan collection costs 216 194 166 22 28
Provision from change in OREO
valuation 155 124 37 31 87
Stationery and supplies 118 118 119 - (1 )
OREO expenses 76 73 (34 ) 3 107
Insurance 53 75 78 (22 ) (3 )
Postage 51 49 40 2 9
Gain on sale of OREO (47 ) (130 ) (60 ) 83 (70 )
Other operating expense 585 233 309 352 (76 )
Total non-interest expense $ 21,841 $ 20,111 $ 18,696 $ 1,730 $ 1,415
2018 compared to 2017. Non-interest expense increased by $1.7 million to $21.8 million during the twelve months ended
December 31, 2018, up from $20.1 million during 2017. The three largest components of this increase were increases of $633
thousand in salaries and benefits, $313 thousand in professional fees and $352 thousand in Other. The largest components
of the increase in salary and benefit expense were increases of $762 thousand in salary expense and $386 thousand in bonus
expense. Salary expense increased to $9.5 million related to additions to staff and merit and promotion increases. Total Full
Time Equivalent (FTE) employees increased from 142 at December 31, 2017 to 155 at December 31, 2018. This increase
includes 4 FTE at our Carson City branch. The additional nine FTE includes additions to staff to support branch and lending
activities as well as additional administrative personnel. Bonus expense is mostly a function of pretax income; the increase
during the 2018 period is primarily related to the increase in pretax income and expansion in 2018 in the bonus plan to include
nonofficer level personnel. These items were partially offset by an increase in the deferral of loan origination costs of $731
thousand to $2.5 million related mostly to an increase in loan origination activity.
Professional fees increased by $313 thousand related primarily to an $139 thousand increase in consulting expense and a
$132 thousand increase in legal expense. The increase in consulting costs includes costs related to an external review of our
compliance management system and ongoing bank compliance consulting and $30 thousand related to our acquisition of
Mutual Omaha Bank’s Carson City Nevada branch. The increase in legal expense mostly relates to costs associated with the
above-mentioned branch acquisition and costs associated with litigation brought by a third-party municipality against one of
our borrowers which could adversely affect our collateral position. The increase in other non-interest expense included a
$50 thousand increase in the reserve for undisbursed loan commitments, an increase of $63 thousand in charge offs on over
drafted deposit accounts and an accrual for costs associated with the termination of our lease at our Tahoe City, California
branch. In 2018 we purchased a building in Tahoe City which, after remodeling is complete, will become the new home of
our Tahoe City Branch. Our lease obligation at our current location includes a termination penalty that has been accrued into
other expense. These three items accounted for approximately 70% of the $352 thousand increase in Other expense.
2017 compared to 2016. Non-interest expense increased by $1.4 million to $20.1 million during the twelve months ended
December 31, 2017, up from $18.7 million during 2016. The largest components of this increase were $1.1 million in salary
and benefit expense, $129 thousand in outside service fees, $111 thousand in telephone and data communication costs and
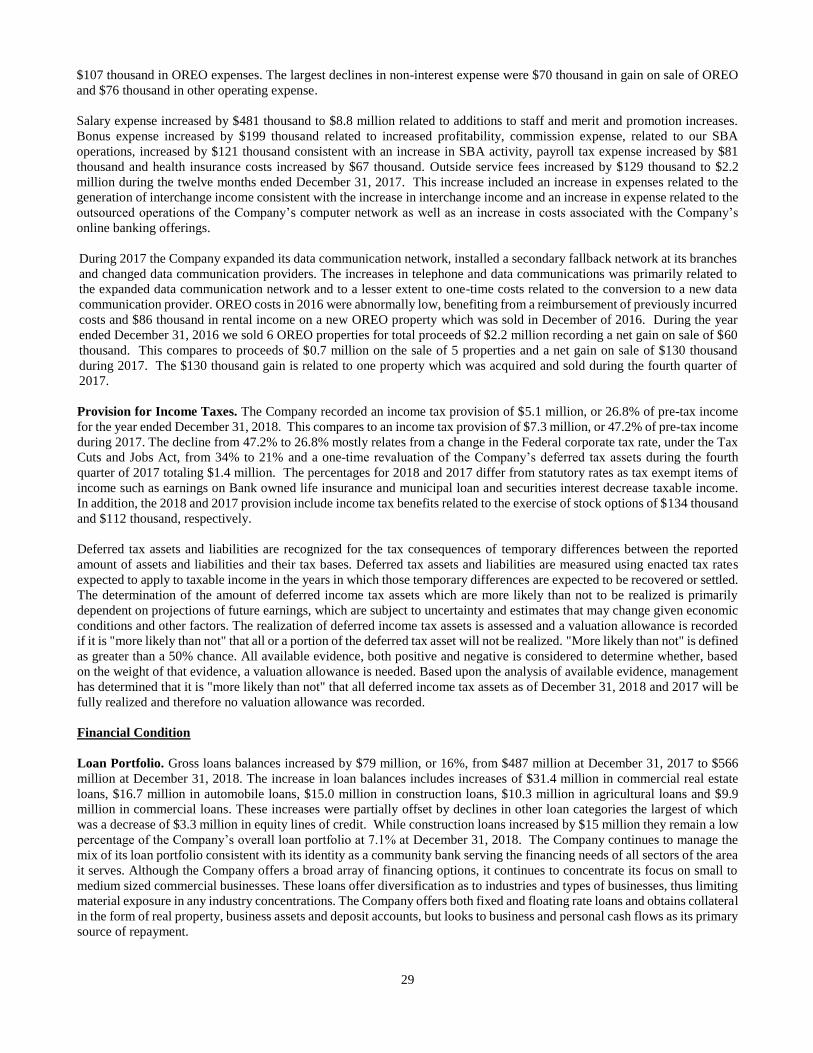
29
$107 thousand in OREO expenses. The largest declines in non-interest expense were $70 thousand in gain on sale of OREO
and $76 thousand in other operating expense.
Salary expense increased by $481 thousand to $8.8 million related to additions to staff and merit and promotion increases.
Bonus expense increased by $199 thousand related to increased profitability, commission expense, related to our SBA
operations, increased by $121 thousand consistent with an increase in SBA activity, payroll tax expense increased by $81
thousand and health insurance costs increased by $67 thousand. Outside service fees increased by $129 thousand to $2.2
million during the twelve months ended December 31, 2017. This increase included an increase in expenses related to the
generation of interchange income consistent with the increase in interchange income and an increase in expense related to the
outsourced operations of the Company’s computer network as well as an increase in costs associated with the Company’s
online banking offerings.
During 2017 the Company expanded its data communication network, installed a secondary fallback network at its branches
and changed data communication providers. The increases in telephone and data communications was primarily related to
the expanded data communication network and to a lesser extent to one-time costs related to the conversion to a new data
communication provider. OREO costs in 2016 were abnormally low, benefiting from a reimbursement of previously incurred
costs and $86 thousand in rental income on a new OREO property which was sold in December of 2016. During the year
ended December 31, 2016 we sold 6 OREO properties for total proceeds of $2.2 million recording a net gain on sale of $60
thousand. This compares to proceeds of $0.7 million on the sale of 5 properties and a net gain on sale of $130 thousand
during 2017. The $130 thousand gain is related to one property which was acquired and sold during the fourth quarter of
2017.
Provision for Income Taxes. The Company recorded an income tax provision of $5.1 million, or 26.8% of pre-tax income
for the year ended December 31, 2018. This compares to an income tax provision of $7.3 million, or 47.2% of pre-tax income
during 2017. The decline from 47.2% to 26.8% mostly relates from a change in the Federal corporate tax rate, under the Tax
Cuts and Jobs Act, from 34% to 21% and a one-time revaluation of the Company’s deferred tax assets during the fourth
quarter of 2017 totaling $1.4 million. The percentages for 2018 and 2017 differ from statutory rates as tax exempt items of
income such as earnings on Bank owned life insurance and municipal loan and securities interest decrease taxable income.
In addition, the 2018 and 2017 provision include income tax benefits related to the exercise of stock options of $134 thousand
and $112 thousand, respectively.
Deferred tax assets and liabilities are recognized for the tax consequences of temporary differences between the reported
amount of assets and liabilities and their tax bases. Deferred tax assets and liabilities are measured using enacted tax rates
expected to apply to taxable income in the years in which those temporary differences are expected to be recovered or settled.
The determination of the amount of deferred income tax assets which are more likely than not to be realized is primarily
dependent on projections of future earnings, which are subject to uncertainty and estimates that may change given economic
conditions and other factors. The realization of deferred income tax assets is assessed and a valuation allowance is recorded
if it is "more likely than not" that all or a portion of the deferred tax asset will not be realized. "More likely than not" is defined
as greater than a 50% chance. All available evidence, both positive and negative is considered to determine whether, based
on the weight of that evidence, a valuation allowance is needed. Based upon the analysis of available evidence, management
has determined that it is "more likely than not" that all deferred income tax assets as of December 31, 2018 and 2017 will be
fully realized and therefore no valuation allowance was recorded.
Financial Condition
Loan Portfolio. Gross loans balances increased by $79 million, or 16%, from $487 million at December 31, 2017 to $566
million at December 31, 2018. The increase in loan balances includes increases of $31.4 million in commercial real estate
loans, $16.7 million in automobile loans, $15.0 million in construction loans, $10.3 million in agricultural loans and $9.9
million in commercial loans. These increases were partially offset by declines in other loan categories the largest of which
was a decrease of $3.3 million in equity lines of credit. While construction loans increased by $15 million they remain a low
percentage of the Company’s overall loan portfolio at 7.1% at December 31, 2018. The Company continues to manage the
mix of its loan portfolio consistent with its identity as a community bank serving the financing needs of all sectors of the area
it serves. Although the Company offers a broad array of financing options, it continues to concentrate its focus on small to
medium sized commercial businesses. These loans offer diversification as to industries and types of businesses, thus limiting
material exposure in any industry concentrations. The Company offers both fixed and floating rate loans and obtains collateral
in the form of real property, business assets and deposit accounts, but looks to business and personal cash flows as its primary
source of repayment.
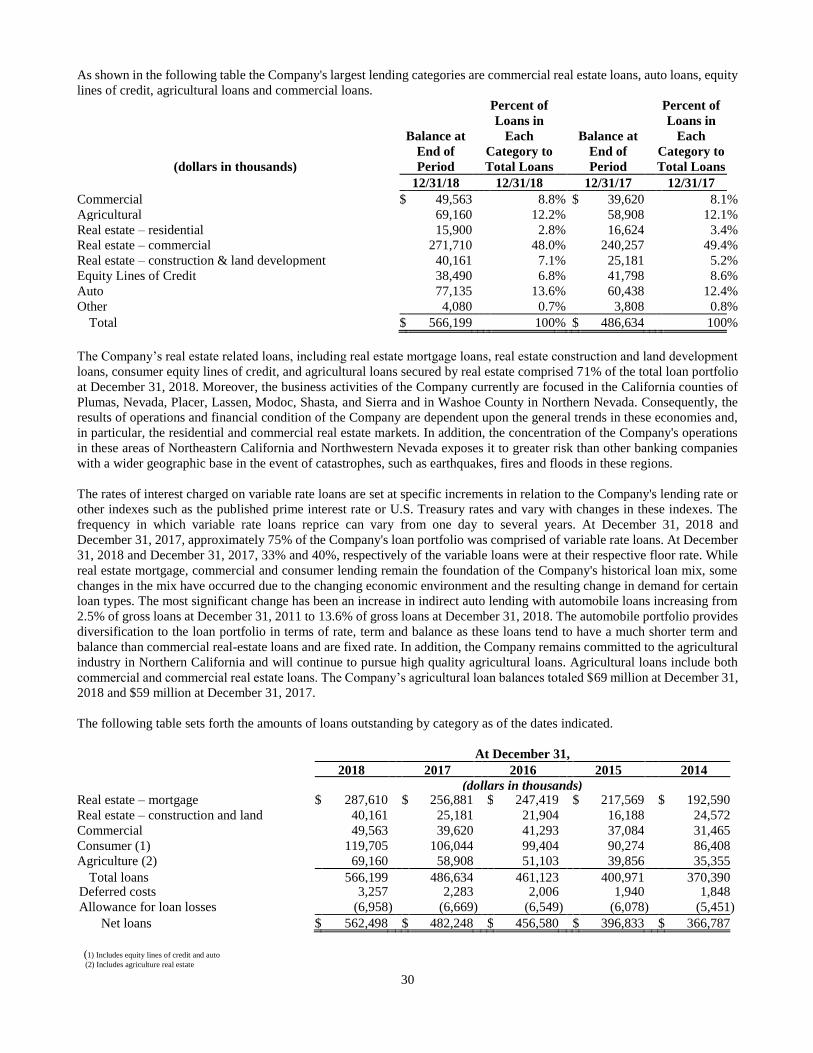
30
As shown in the following table the Company's largest lending categories are commercial real estate loans, auto loans, equity
lines of credit, agricultural loans and commercial loans.
(dollars in thousands)
Balance at
End of
Period
Percent of
Loans in
Each
Category to
Total Loans
Balance at
End of
Period
Percent of
Loans in
Each
Category to
Total Loans
12/31/18 12/31/18 12/31/17 12/31/17
Commercial $ 49,563 8.8 % $ 39,620 8.1 %
Agricultural 69,160 12.2 % 58,908 12.1 %
Real estate – residential 15,900 2.8 % 16,624 3.4 %
Real estate – commercial 271,710 48.0 % 240,257 49.4 %
Real estate – construction & land development 40,161 7.1 % 25,181 5.2 %
Equity Lines of Credit 38,490 6.8 % 41,798 8.6 %
Auto 77,135 13.6 % 60,438 12.4 %
Other 4,080 0.7 % 3,808 0.8 %
Total $ 566,199 100 % $ 486,634 100 %
The Company’s real estate related loans, including real estate mortgage loans, real estate construction and land development
loans, consumer equity lines of credit, and agricultural loans secured by real estate comprised 71% of the total loan portfolio
at December 31, 2018. Moreover, the business activities of the Company currently are focused in the California counties of
Plumas, Nevada, Placer, Lassen, Modoc, Shasta, and Sierra and in Washoe County in Northern Nevada. Consequently, the
results of operations and financial condition of the Company are dependent upon the general trends in these economies and,
in particular, the residential and commercial real estate markets. In addition, the concentration of the Company's operations
in these areas of Northeastern California and Northwestern Nevada exposes it to greater risk than other banking companies
with a wider geographic base in the event of catastrophes, such as earthquakes, fires and floods in these regions.
The rates of interest charged on variable rate loans are set at specific increments in relation to the Company's lending rate or
other indexes such as the published prime interest rate or U.S. Treasury rates and vary with changes in these indexes. The
frequency in which variable rate loans reprice can vary from one day to several years. At December 31, 2018 and
December 31, 2017, approximately 75% of the Company's loan portfolio was comprised of variable rate loans. At December
31, 2018 and December 31, 2017, 33% and 40%, respectively of the variable loans were at their respective floor rate. While
real estate mortgage, commercial and consumer lending remain the foundation of the Company's historical loan mix, some
changes in the mix have occurred due to the changing economic environment and the resulting change in demand for certain
loan types. The most significant change has been an increase in indirect auto lending with automobile loans increasing from
2.5% of gross loans at December 31, 2011 to 13.6% of gross loans at December 31, 2018. The automobile portfolio provides
diversification to the loan portfolio in terms of rate, term and balance as these loans tend to have a much shorter term and
balance than commercial real-estate loans and are fixed rate. In addition, the Company remains committed to the agricultural
industry in Northern California and will continue to pursue high quality agricultural loans. Agricultural loans include both
commercial and commercial real estate loans. The Company’s agricultural loan balances totaled $69 million at December 31,
2018 and $59 million at December 31, 2017.
The following table sets forth the amounts of loans outstanding by category as of the dates indicated.
At December 31,
2018 2017 2016 2015 2014
(dollars in thousands)
Real estate – mortgage $ 287,610 $ 256,881 $ 247,419 $ 217,569 $ 192,590
Real estate – construction and land
development
40,161 25,181 21,904 16,188 24,572
Commercial 49,563 39,620 41,293 37,084 31,465
Consumer (1) 119,705 106,044 99,404 90,274 86,408
Agriculture (2) 69,160 58,908 51,103 39,856 35,355
Total loans 566,199 486,634 461,123 400,971 370,390 Deferred costs 3,257 2,283 2,006 1,940 1,848
Allowance for loan losses (6,958 ) (6,669 ) (6,549 ) (6,078 ) (5,451 )
Net loans $ 562,498 $ 482,248 $ 456,580 $ 396,833 $ 366,787
(1) Includes equity lines of credit and auto
(2) Includes agriculture real estate
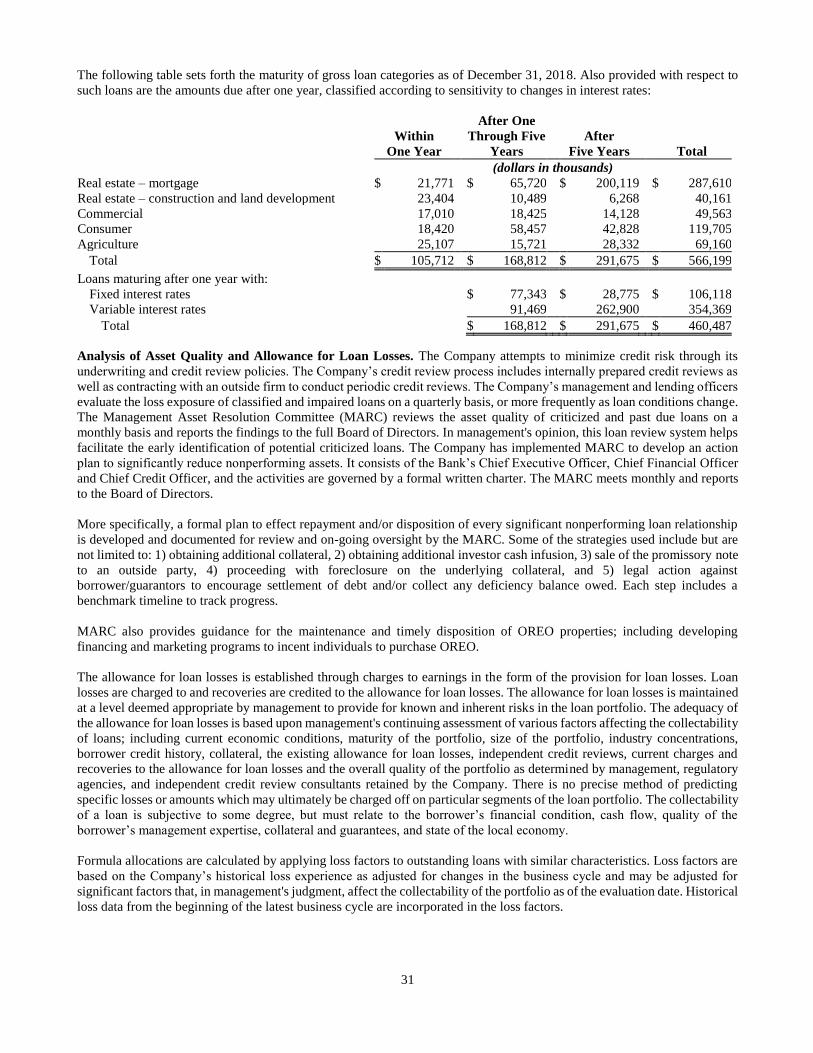
31
The following table sets forth the maturity of gross loan categories as of December 31, 2018. Also provided with respect to
such loans are the amounts due after one year, classified according to sensitivity to changes in interest rates:
Within
One Year
After One
Through Five
Years
After
Five Years
Total
(dollars in thousands)
Real estate – mortgage $ 21,771 $ 65,720 $ 200,119 $ 287,610
Real estate – construction and land development 23,404 10,489 6,268 40,161
Commercial 17,010 18,425 14,128 49,563
Consumer 18,420 58,457 42,828 119,705
Agriculture 25,107 15,721 28,332 69,160
Total $ 105,712 $ 168,812 $ 291,675 $ 566,199
Loans maturing after one year with:
Fixed interest rates $ 77,343 $ 28,775 $ 106,118
Variable interest rates 91,469 262,900 354,369
Total $ 168,812 $ 291,675 $ 460,487
Analysis of Asset Quality and Allowance for Loan Losses. The Company attempts to minimize credit risk through its
underwriting and credit review policies. The Company’s credit review process includes internally prepared credit reviews as
well as contracting with an outside firm to conduct periodic credit reviews. The Company’s management and lending officers
evaluate the loss exposure of classified and impaired loans on a quarterly basis, or more frequently as loan conditions change.
The Management Asset Resolution Committee (MARC) reviews the asset quality of criticized and past due loans on a
monthly basis and reports the findings to the full Board of Directors. In management's opinion, this loan review system helps
facilitate the early identification of potential criticized loans. The Company has implemented MARC to develop an action
plan to significantly reduce nonperforming assets. It consists of the Bank’s Chief Executive Officer, Chief Financial Officer
and Chief Credit Officer, and the activities are governed by a formal written charter. The MARC meets monthly and reports
to the Board of Directors.
More specifically, a formal plan to effect repayment and/or disposition of every significant nonperforming loan relationship
is developed and documented for review and on-going oversight by the MARC. Some of the strategies used include but are
not limited to: 1) obtaining additional collateral, 2) obtaining additional investor cash infusion, 3) sale of the promissory note
to an outside party, 4) proceeding with foreclosure on the underlying collateral, and 5) legal action against
borrower/guarantors to encourage settlement of debt and/or collect any deficiency balance owed. Each step includes a
benchmark timeline to track progress.
MARC also provides guidance for the maintenance and timely disposition of OREO properties; including developing
financing and marketing programs to incent individuals to purchase OREO.
The allowance for loan losses is established through charges to earnings in the form of the provision for loan losses. Loan
losses are charged to and recoveries are credited to the allowance for loan losses. The allowance for loan losses is maintained
at a level deemed appropriate by management to provide for known and inherent risks in the loan portfolio. The adequacy of
the allowance for loan losses is based upon management's continuing assessment of various factors affecting the collectability
of loans; including current economic conditions, maturity of the portfolio, size of the portfolio, industry concentrations,
borrower credit history, collateral, the existing allowance for loan losses, independent credit reviews, current charges and
recoveries to the allowance for loan losses and the overall quality of the portfolio as determined by management, regulatory
agencies, and independent credit review consultants retained by the Company. There is no precise method of predicting
specific losses or amounts which may ultimately be charged off on particular segments of the loan portfolio. The collectability
of a loan is subjective to some degree, but must relate to the borrower’s financial condition, cash flow, quality of the
borrower’s management expertise, collateral and guarantees, and state of the local economy.
Formula allocations are calculated by applying loss factors to outstanding loans with similar characteristics. Loss factors are
based on the Company’s historical loss experience as adjusted for changes in the business cycle and may be adjusted for
significant factors that, in management's judgment, affect the collectability of the portfolio as of the evaluation date. Historical
loss data from the beginning of the latest business cycle are incorporated in the loss factors.
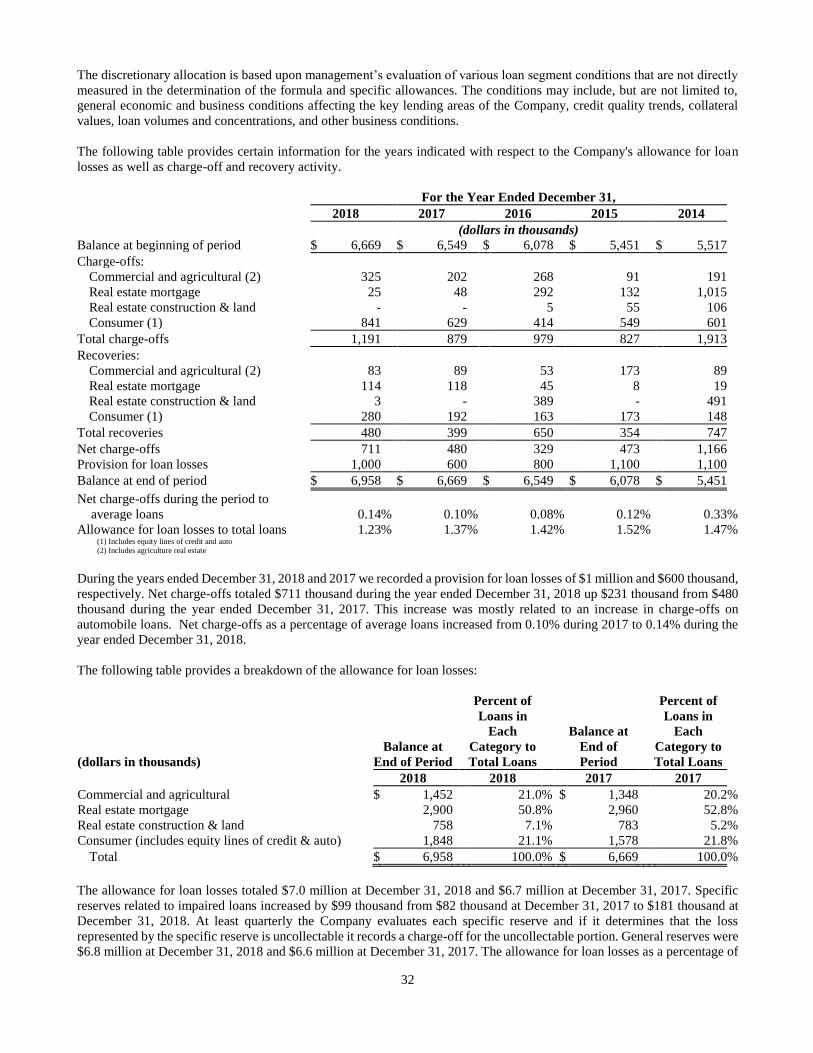
32
The discretionary allocation is based upon management’s evaluation of various loan segment conditions that are not directly
measured in the determination of the formula and specific allowances. The conditions may include, but are not limited to,
general economic and business conditions affecting the key lending areas of the Company, credit quality trends, collateral
values, loan volumes and concentrations, and other business conditions.
The following table provides certain information for the years indicated with respect to the Company's allowance for loan
losses as well as charge-off and recovery activity.
For the Year Ended December 31,
2018 2017 2016 2015 2014
(dollars in thousands)
Balance at beginning of period $ 6,669 $ 6,549 $ 6,078 $ 5,451 $ 5,517
Charge-offs:
Commercial and agricultural (2) 325 202 268 91 191
Real estate mortgage 25 48 292 132 1,015
Real estate construction & land - - 5 55 106
Consumer (1) 841 629 414 549 601
Total charge-offs 1,191 879 979 827 1,913
Recoveries:
Commercial and agricultural (2) 83 89 53 173 89
Real estate mortgage 114 118 45 8 19
Real estate construction & land 3 - 389 - 491
Consumer (1) 280 192 163 173 148
Total recoveries 480 399 650 354 747
Net charge-offs 711 480 329 473 1,166
Provision for loan losses 1,000 600 800 1,100 1,100
Balance at end of period $ 6,958 $ 6,669 $ 6,549 $ 6,078 $ 5,451
Net charge-offs during the period to
average loans 0.14 % 0.10 % 0.08 % 0.12 % 0.33 %
Allowance for loan losses to total loans 1.23 % 1.37 % 1.42 % 1.52 % 1.47 % (1) Includes equity lines of credit and auto
(2) Includes agriculture real estate
During the years ended December 31, 2018 and 2017 we recorded a provision for loan losses of $1 million and $600 thousand,
respectively. Net charge-offs totaled $711 thousand during the year ended December 31, 2018 up $231 thousand from $480
thousand during the year ended December 31, 2017. This increase was mostly related to an increase in charge-offs on
automobile loans. Net charge-offs as a percentage of average loans increased from 0.10% during 2017 to 0.14% during the
year ended December 31, 2018.
The following table provides a breakdown of the allowance for loan losses:
(dollars in thousands)
Balance at
End of Period
Percent of
Loans in
Each
Category to
Total Loans
Balance at
End of
Period
Percent of
Loans in
Each
Category to
Total Loans
2018 2018 2017 2017
Commercial and agricultural $ 1,452 21.0 % $ 1,348 20.2 %
Real estate mortgage 2,900 50.8 % 2,960 52.8 %
Real estate construction & land 758 7.1 % 783 5.2 %
Consumer (includes equity lines of credit & auto) 1,848 21.1 % 1,578 21.8 %
Total $ 6,958 100.0 % $ 6,669 100.0 %
The allowance for loan losses totaled $7.0 million at December 31, 2018 and $6.7 million at December 31, 2017. Specific
reserves related to impaired loans increased by $99 thousand from $82 thousand at December 31, 2017 to $181 thousand at
December 31, 2018. At least quarterly the Company evaluates each specific reserve and if it determines that the loss
represented by the specific reserve is uncollectable it records a charge-off for the uncollectable portion. General reserves were
$6.8 million at December 31, 2018 and $6.6 million at December 31, 2017. The allowance for loan losses as a percentage of
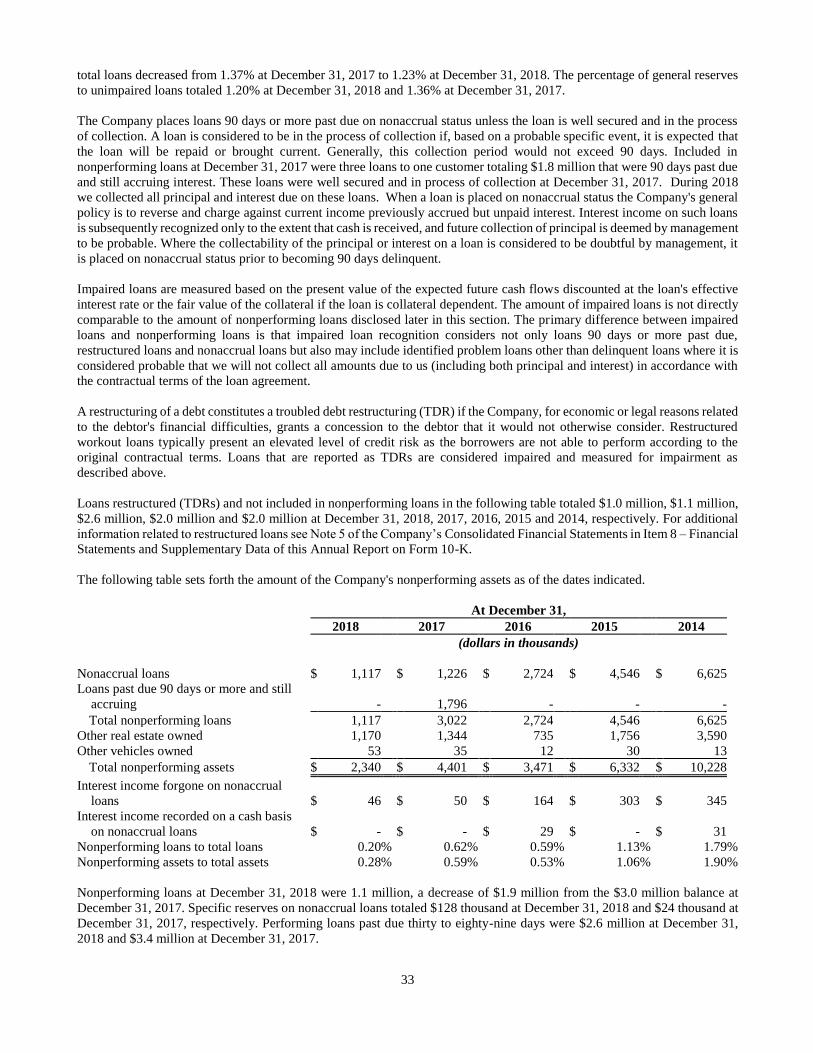
33
total loans decreased from 1.37% at December 31, 2017 to 1.23% at December 31, 2018. The percentage of general reserves
to unimpaired loans totaled 1.20% at December 31, 2018 and 1.36% at December 31, 2017.
The Company places loans 90 days or more past due on nonaccrual status unless the loan is well secured and in the process
of collection. A loan is considered to be in the process of collection if, based on a probable specific event, it is expected that
the loan will be repaid or brought current. Generally, this collection period would not exceed 90 days. Included in
nonperforming loans at December 31, 2017 were three loans to one customer totaling $1.8 million that were 90 days past due
and still accruing interest. These loans were well secured and in process of collection at December 31, 2017. During 2018
we collected all principal and interest due on these loans. When a loan is placed on nonaccrual status the Company's general
policy is to reverse and charge against current income previously accrued but unpaid interest. Interest income on such loans
is subsequently recognized only to the extent that cash is received, and future collection of principal is deemed by management
to be probable. Where the collectability of the principal or interest on a loan is considered to be doubtful by management, it
is placed on nonaccrual status prior to becoming 90 days delinquent.
Impaired loans are measured based on the present value of the expected future cash flows discounted at the loan's effective
interest rate or the fair value of the collateral if the loan is collateral dependent. The amount of impaired loans is not directly
comparable to the amount of nonperforming loans disclosed later in this section. The primary difference between impaired
loans and nonperforming loans is that impaired loan recognition considers not only loans 90 days or more past due,
restructured loans and nonaccrual loans but also may include identified problem loans other than delinquent loans where it is
considered probable that we will not collect all amounts due to us (including both principal and interest) in accordance with
the contractual terms of the loan agreement.
A restructuring of a debt constitutes a troubled debt restructuring (TDR) if the Company, for economic or legal reasons related
to the debtor's financial difficulties, grants a concession to the debtor that it would not otherwise consider. Restructured
workout loans typically present an elevated level of credit risk as the borrowers are not able to perform according to the
original contractual terms. Loans that are reported as TDRs are considered impaired and measured for impairment as
described above.
Loans restructured (TDRs) and not included in nonperforming loans in the following table totaled $1.0 million, $1.1 million,
$2.6 million, $2.0 million and $2.0 million at December 31, 2018, 2017, 2016, 2015 and 2014, respectively. For additional
information related to restructured loans see Note 5 of the Company’s Consolidated Financial Statements in Item 8 – Financial
Statements and Supplementary Data of this Annual Report on Form 10-K.
The following table sets forth the amount of the Company's nonperforming assets as of the dates indicated.
At December 31,
2018 2017 2016 2015 2014
(dollars in thousands)
Nonaccrual loans $ 1,117 $ 1,226 $ 2,724 $ 4,546 $ 6,625
Loans past due 90 days or more and still
accruing - 1,796 - - -
Total nonperforming loans 1,117 3,022 2,724 4,546 6,625
Other real estate owned 1,170 1,344 735 1,756 3,590
Other vehicles owned 53 35 12 30 13
Total nonperforming assets $ 2,340 $ 4,401 $ 3,471 $ 6,332 $ 10,228
Interest income forgone on nonaccrual
loans $ 46 $ 50 $ 164 $ 303 $ 345
Interest income recorded on a cash basis
on nonaccrual loans $ - $ - $ 29 $ - $ 31
Nonperforming loans to total loans 0.20 % 0.62 % 0.59 % 1.13 % 1.79 %
Nonperforming assets to total assets 0.28 % 0.59 % 0.53 % 1.06 % 1.90 %
Nonperforming loans at December 31, 2018 were 1.1 million, a decrease of $1.9 million from the $3.0 million balance at
December 31, 2017. Specific reserves on nonaccrual loans totaled $128 thousand at December 31, 2018 and $24 thousand at
December 31, 2017, respectively. Performing loans past due thirty to eighty-nine days were $2.6 million at December 31,
2018 and $3.4 million at December 31, 2017.
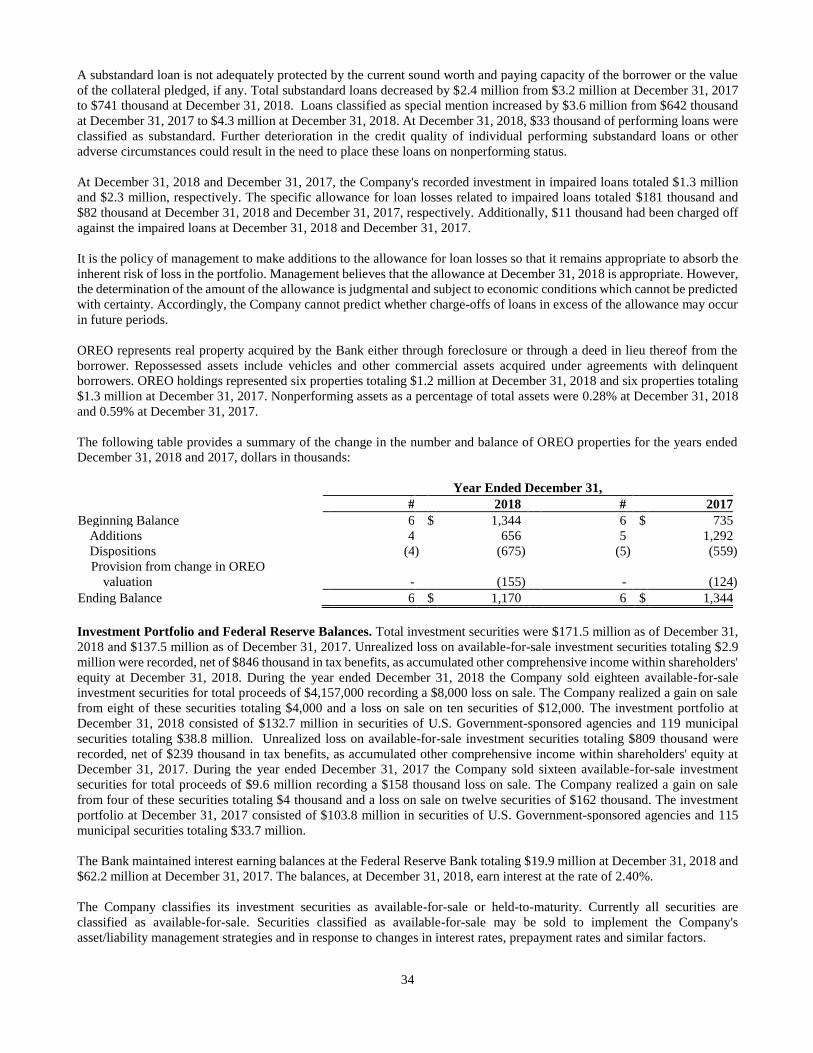
34
A substandard loan is not adequately protected by the current sound worth and paying capacity of the borrower or the value
of the collateral pledged, if any. Total substandard loans decreased by $2.4 million from $3.2 million at December 31, 2017
to $741 thousand at December 31, 2018. Loans classified as special mention increased by $3.6 million from $642 thousand
at December 31, 2017 to $4.3 million at December 31, 2018. At December 31, 2018, $33 thousand of performing loans were
classified as substandard. Further deterioration in the credit quality of individual performing substandard loans or other
adverse circumstances could result in the need to place these loans on nonperforming status.
At December 31, 2018 and December 31, 2017, the Company's recorded investment in impaired loans totaled $1.3 million
and $2.3 million, respectively. The specific allowance for loan losses related to impaired loans totaled $181 thousand and
$82 thousand at December 31, 2018 and December 31, 2017, respectively. Additionally, $11 thousand had been charged off
against the impaired loans at December 31, 2018 and December 31, 2017.
It is the policy of management to make additions to the allowance for loan losses so that it remains appropriate to absorb the
inherent risk of loss in the portfolio. Management believes that the allowance at December 31, 2018 is appropriate. However,
the determination of the amount of the allowance is judgmental and subject to economic conditions which cannot be predicted
with certainty. Accordingly, the Company cannot predict whether charge-offs of loans in excess of the allowance may occur
in future periods.
OREO represents real property acquired by the Bank either through foreclosure or through a deed in lieu thereof from the
borrower. Repossessed assets include vehicles and other commercial assets acquired under agreements with delinquent
borrowers. OREO holdings represented six properties totaling $1.2 million at December 31, 2018 and six properties totaling
$1.3 million at December 31, 2017. Nonperforming assets as a percentage of total assets were 0.28% at December 31, 2018
and 0.59% at December 31, 2017.
The following table provides a summary of the change in the number and balance of OREO properties for the years ended
December 31, 2018 and 2017, dollars in thousands:
Year Ended December 31,
# 2018 # 2017
Beginning Balance 6 $ 1,344 6 $ 735
Additions 4 656 5 1,292
Dispositions (4 ) (675 ) (5 ) (559 )
Provision from change in OREO
valuation - (155 ) - (124 )
Ending Balance 6 $ 1,170 6 $ 1,344
Investment Portfolio and Federal Reserve Balances. Total investment securities were $171.5 million as of December 31,
2018 and $137.5 million as of December 31, 2017. Unrealized loss on available-for-sale investment securities totaling $2.9
million were recorded, net of $846 thousand in tax benefits, as accumulated other comprehensive income within shareholders'
equity at December 31, 2018. During the year ended December 31, 2018 the Company sold eighteen available-for-sale
investment securities for total proceeds of $4,157,000 recording a $8,000 loss on sale. The Company realized a gain on sale
from eight of these securities totaling $4,000 and a loss on sale on ten securities of $12,000. The investment portfolio at
December 31, 2018 consisted of $132.7 million in securities of U.S. Government-sponsored agencies and 119 municipal
securities totaling $38.8 million. Unrealized loss on available-for-sale investment securities totaling $809 thousand were
recorded, net of $239 thousand in tax benefits, as accumulated other comprehensive income within shareholders' equity at
December 31, 2017. During the year ended December 31, 2017 the Company sold sixteen available-for-sale investment
securities for total proceeds of $9.6 million recording a $158 thousand loss on sale. The Company realized a gain on sale
from four of these securities totaling $4 thousand and a loss on sale on twelve securities of $162 thousand. The investment
portfolio at December 31, 2017 consisted of $103.8 million in securities of U.S. Government-sponsored agencies and 115
municipal securities totaling $33.7 million.
The Bank maintained interest earning balances at the Federal Reserve Bank totaling $19.9 million at December 31, 2018 and
$62.2 million at December 31, 2017. The balances, at December 31, 2018, earn interest at the rate of 2.40%.
The Company classifies its investment securities as available-for-sale or held-to-maturity. Currently all securities are
classified as available-for-sale. Securities classified as available-for-sale may be sold to implement the Company's
asset/liability management strategies and in response to changes in interest rates, prepayment rates and similar factors.
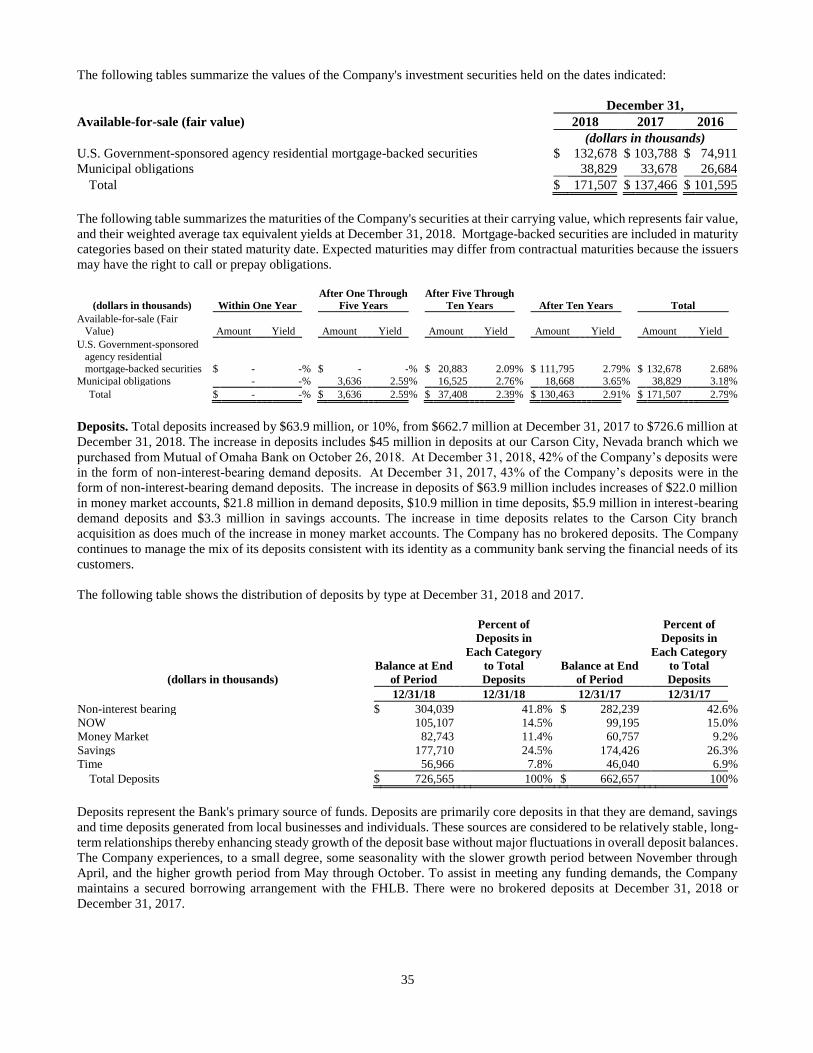
35
The following tables summarize the values of the Company's investment securities held on the dates indicated:
December 31,
Available-for-sale (fair value) 2018 2017 2016
(dollars in thousands)
U.S. Government-sponsored agency residential mortgage-backed securities $ 132,678 $ 103,788 $ 74,911
Municipal obligations 38,829 33,678 26,684
Total $ 171,507 $ 137,466 $ 101,595
The following table summarizes the maturities of the Company's securities at their carrying value, which represents fair value,
and their weighted average tax equivalent yields at December 31, 2018. Mortgage-backed securities are included in maturity
categories based on their stated maturity date. Expected maturities may differ from contractual maturities because the issuers
may have the right to call or prepay obligations.
(dollars in thousands) Within One Year
After One Through
Five Years
After Five Through
Ten Years After Ten Years Total
Available-for-sale (Fair
Value) Amount Yield Amount Yield Amount Yield Amount Yield Amount Yield
U.S. Government-sponsored
agency residential mortgage-backed securities $ - - % $ - - % $ 20,883 2.09 % $ 111,795 2.79 % $ 132,678 2.68 %
Municipal obligations - - % 3,636 2.59 % 16,525 2.76 % 18,668 3.65 % 38,829 3.18 %
Total $ - - % $ 3,636 2.59 % $ 37,408 2.39 % $ 130,463 2.91 % $ 171,507 2.79 %
Deposits. Total deposits increased by $63.9 million, or 10%, from $662.7 million at December 31, 2017 to $726.6 million at
December 31, 2018. The increase in deposits includes $45 million in deposits at our Carson City, Nevada branch which we
purchased from Mutual of Omaha Bank on October 26, 2018. At December 31, 2018, 42% of the Company’s deposits were
in the form of non-interest-bearing demand deposits. At December 31, 2017, 43% of the Company’s deposits were in the
form of non-interest-bearing demand deposits. The increase in deposits of $63.9 million includes increases of $22.0 million
in money market accounts, $21.8 million in demand deposits, $10.9 million in time deposits, $5.9 million in interest-bearing
demand deposits and $3.3 million in savings accounts. The increase in time deposits relates to the Carson City branch
acquisition as does much of the increase in money market accounts. The Company has no brokered deposits. The Company
continues to manage the mix of its deposits consistent with its identity as a community bank serving the financial needs of its
customers.
The following table shows the distribution of deposits by type at December 31, 2018 and 2017.
(dollars in thousands)
Balance at End
of Period
Percent of
Deposits in
Each Category
to Total
Deposits
Balance at End
of Period
Percent of
Deposits in
Each Category
to Total
Deposits
12/31/18 12/31/18 12/31/17 12/31/17
Non-interest bearing $ 304,039 41.8 % $ 282,239 42.6 %
NOW 105,107 14.5 % 99,195 15.0 %
Money Market 82,743 11.4 % 60,757 9.2 %
Savings 177,710 24.5 % 174,426 26.3 %
Time 56,966 7.8 % 46,040 6.9 %
Total Deposits $ 726,565 100 % $ 662,657 100 %
Deposits represent the Bank's primary source of funds. Deposits are primarily core deposits in that they are demand, savings
and time deposits generated from local businesses and individuals. These sources are considered to be relatively stable, long-
term relationships thereby enhancing steady growth of the deposit base without major fluctuations in overall deposit balances.
The Company experiences, to a small degree, some seasonality with the slower growth period between November through
April, and the higher growth period from May through October. To assist in meeting any funding demands, the Company
maintains a secured borrowing arrangement with the FHLB. There were no brokered deposits at December 31, 2018 or
December 31, 2017.
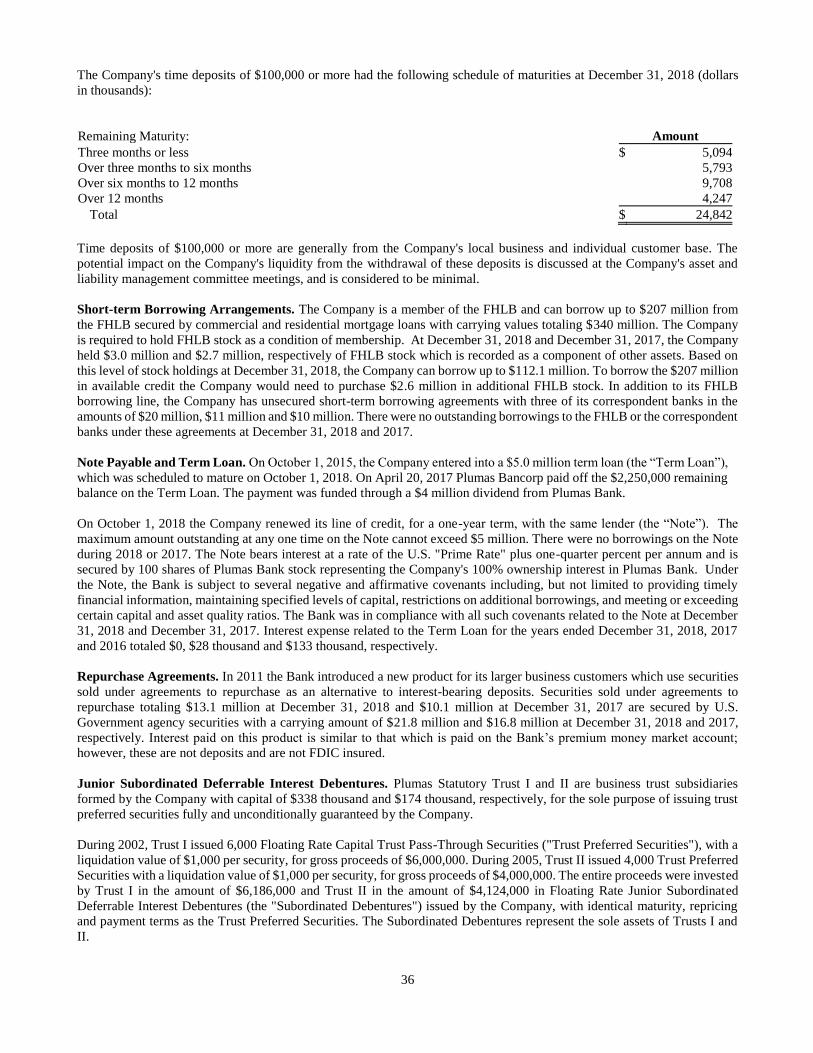
36
The Company's time deposits of $100,000 or more had the following schedule of maturities at December 31, 2018 (dollars
in thousands):
Remaining Maturity: Amount
Three months or less $ 5,094
Over three months to six months 5,793
Over six months to 12 months 9,708
Over 12 months 4,247
Total $ 24,842
Time deposits of $100,000 or more are generally from the Company's local business and individual customer base. The
potential impact on the Company's liquidity from the withdrawal of these deposits is discussed at the Company's asset and
liability management committee meetings, and is considered to be minimal.
Short-term Borrowing Arrangements. The Company is a member of the FHLB and can borrow up to $207 million from
the FHLB secured by commercial and residential mortgage loans with carrying values totaling $340 million. The Company
is required to hold FHLB stock as a condition of membership. At December 31, 2018 and December 31, 2017, the Company
held $3.0 million and $2.7 million, respectively of FHLB stock which is recorded as a component of other assets. Based on
this level of stock holdings at December 31, 2018, the Company can borrow up to $112.1 million. To borrow the $207 million
in available credit the Company would need to purchase $2.6 million in additional FHLB stock. In addition to its FHLB
borrowing line, the Company has unsecured short-term borrowing agreements with three of its correspondent banks in the
amounts of $20 million, $11 million and $10 million. There were no outstanding borrowings to the FHLB or the correspondent
banks under these agreements at December 31, 2018 and 2017.
Note Payable and Term Loan. On October 1, 2015, the Company entered into a $5.0 million term loan (the “Term Loan”),
which was scheduled to mature on October 1, 2018. On April 20, 2017 Plumas Bancorp paid off the $2,250,000 remaining
balance on the Term Loan. The payment was funded through a $4 million dividend from Plumas Bank.
On October 1, 2018 the Company renewed its line of credit, for a one-year term, with the same lender (the “Note”). The
maximum amount outstanding at any one time on the Note cannot exceed $5 million. There were no borrowings on the Note
during 2018 or 2017. The Note bears interest at a rate of the U.S. "Prime Rate" plus one-quarter percent per annum and is
secured by 100 shares of Plumas Bank stock representing the Company's 100% ownership interest in Plumas Bank. Under
the Note, the Bank is subject to several negative and affirmative covenants including, but not limited to providing timely
financial information, maintaining specified levels of capital, restrictions on additional borrowings, and meeting or exceeding
certain capital and asset quality ratios. The Bank was in compliance with all such covenants related to the Note at December
31, 2018 and December 31, 2017. Interest expense related to the Term Loan for the years ended December 31, 2018, 2017
and 2016 totaled $0, $28 thousand and $133 thousand, respectively.
Repurchase Agreements. In 2011 the Bank introduced a new product for its larger business customers which use securities
sold under agreements to repurchase as an alternative to interest-bearing deposits. Securities sold under agreements to
repurchase totaling $13.1 million at December 31, 2018 and $10.1 million at December 31, 2017 are secured by U.S.
Government agency securities with a carrying amount of $21.8 million and $16.8 million at December 31, 2018 and 2017,
respectively. Interest paid on this product is similar to that which is paid on the Bank’s premium money market account;
however, these are not deposits and are not FDIC insured.
Junior Subordinated Deferrable Interest Debentures. Plumas Statutory Trust I and II are business trust subsidiaries
formed by the Company with capital of $338 thousand and $174 thousand, respectively, for the sole purpose of issuing trust
preferred securities fully and unconditionally guaranteed by the Company.
During 2002, Trust I issued 6,000 Floating Rate Capital Trust Pass-Through Securities ("Trust Preferred Securities"), with a
liquidation value of $1,000 per security, for gross proceeds of $6,000,000. During 2005, Trust II issued 4,000 Trust Preferred
Securities with a liquidation value of $1,000 per security, for gross proceeds of $4,000,000. The entire proceeds were invested
by Trust I in the amount of $6,186,000 and Trust II in the amount of $4,124,000 in Floating Rate Junior Subordinated
Deferrable Interest Debentures (the "Subordinated Debentures") issued by the Company, with identical maturity, repricing
and payment terms as the Trust Preferred Securities. The Subordinated Debentures represent the sole assets of Trusts I and
II.
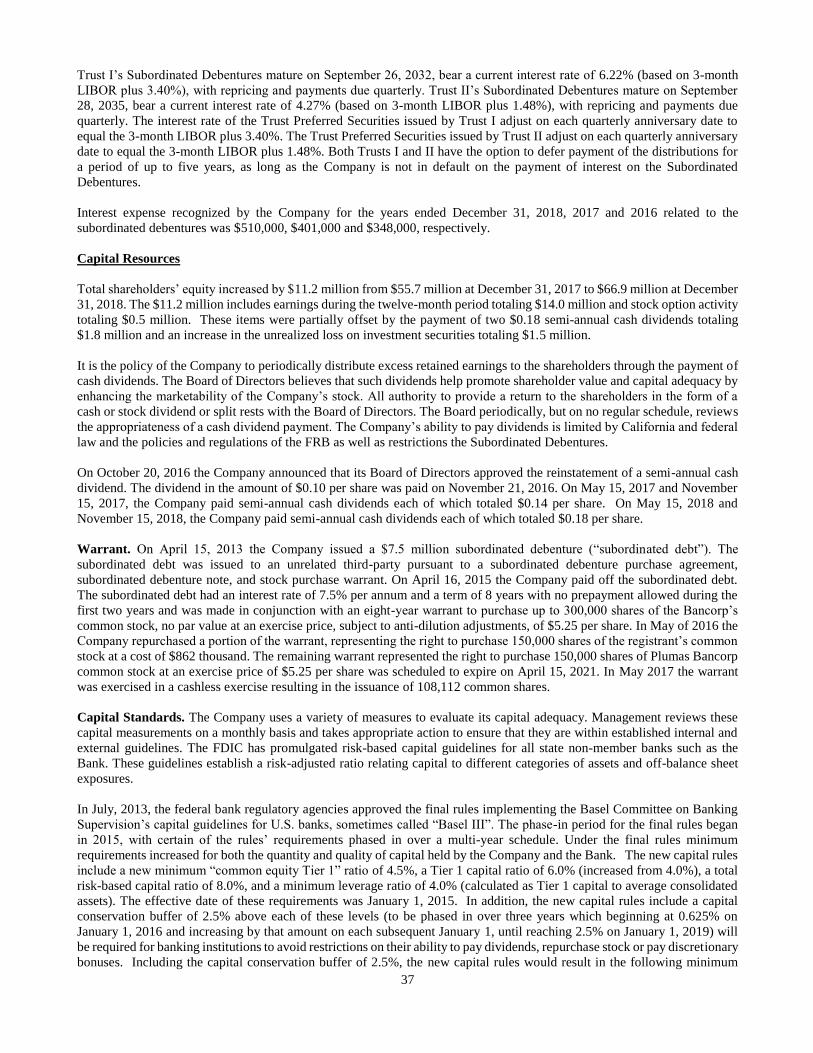
37
Trust I’s Subordinated Debentures mature on September 26, 2032, bear a current interest rate of 6.22% (based on 3-month
LIBOR plus 3.40%), with repricing and payments due quarterly. Trust II’s Subordinated Debentures mature on September
28, 2035, bear a current interest rate of 4.27% (based on 3-month LIBOR plus 1.48%), with repricing and payments due
quarterly. The interest rate of the Trust Preferred Securities issued by Trust I adjust on each quarterly anniversary date to
equal the 3-month LIBOR plus 3.40%. The Trust Preferred Securities issued by Trust II adjust on each quarterly anniversary
date to equal the 3-month LIBOR plus 1.48%. Both Trusts I and II have the option to defer payment of the distributions for
a period of up to five years, as long as the Company is not in default on the payment of interest on the Subordinated
Debentures.
Interest expense recognized by the Company for the years ended December 31, 2018, 2017 and 2016 related to the
subordinated debentures was $510,000, $401,000 and $348,000, respectively.
Capital Resources
Total shareholders’ equity increased by $11.2 million from $55.7 million at December 31, 2017 to $66.9 million at December
31, 2018. The $11.2 million includes earnings during the twelve-month period totaling $14.0 million and stock option activity
totaling $0.5 million. These items were partially offset by the payment of two $0.18 semi-annual cash dividends totaling
$1.8 million and an increase in the unrealized loss on investment securities totaling $1.5 million.
It is the policy of the Company to periodically distribute excess retained earnings to the shareholders through the payment of
cash dividends. The Board of Directors believes that such dividends help promote shareholder value and capital adequacy by
enhancing the marketability of the Company’s stock. All authority to provide a return to the shareholders in the form of a
cash or stock dividend or split rests with the Board of Directors. The Board periodically, but on no regular schedule, reviews
the appropriateness of a cash dividend payment. The Company’s ability to pay dividends is limited by California and federal
law and the policies and regulations of the FRB as well as restrictions the Subordinated Debentures.
On October 20, 2016 the Company announced that its Board of Directors approved the reinstatement of a semi-annual cash
dividend. The dividend in the amount of $0.10 per share was paid on November 21, 2016. On May 15, 2017 and November
15, 2017, the Company paid semi-annual cash dividends each of which totaled $0.14 per share. On May 15, 2018 and
November 15, 2018, the Company paid semi-annual cash dividends each of which totaled $0.18 per share.
Warrant. On April 15, 2013 the Company issued a $7.5 million subordinated debenture (“subordinated debt”). The
subordinated debt was issued to an unrelated third-party pursuant to a subordinated debenture purchase agreement,
subordinated debenture note, and stock purchase warrant. On April 16, 2015 the Company paid off the subordinated debt.
The subordinated debt had an interest rate of 7.5% per annum and a term of 8 years with no prepayment allowed during the
first two years and was made in conjunction with an eight-year warrant to purchase up to 300,000 shares of the Bancorp’s
common stock, no par value at an exercise price, subject to anti-dilution adjustments, of $5.25 per share. In May of 2016 the
Company repurchased a portion of the warrant, representing the right to purchase 150,000 shares of the registrant’s common
stock at a cost of $862 thousand. The remaining warrant represented the right to purchase 150,000 shares of Plumas Bancorp
common stock at an exercise price of $5.25 per share was scheduled to expire on April 15, 2021. In May 2017 the warrant
was exercised in a cashless exercise resulting in the issuance of 108,112 common shares.
Capital Standards. The Company uses a variety of measures to evaluate its capital adequacy. Management reviews these
capital measurements on a monthly basis and takes appropriate action to ensure that they are within established internal and
external guidelines. The FDIC has promulgated risk-based capital guidelines for all state non-member banks such as the
Bank. These guidelines establish a risk-adjusted ratio relating capital to different categories of assets and off-balance sheet
exposures.
In July, 2013, the federal bank regulatory agencies approved the final rules implementing the Basel Committee on Banking
Supervision’s capital guidelines for U.S. banks, sometimes called “Basel III”. The phase-in period for the final rules began
in 2015, with certain of the rules’ requirements phased in over a multi-year schedule. Under the final rules minimum
requirements increased for both the quantity and quality of capital held by the Company and the Bank. The new capital rules
include a new minimum “common equity Tier 1” ratio of 4.5%, a Tier 1 capital ratio of 6.0% (increased from 4.0%), a total
risk-based capital ratio of 8.0%, and a minimum leverage ratio of 4.0% (calculated as Tier 1 capital to average consolidated
assets). The effective date of these requirements was January 1, 2015. In addition, the new capital rules include a capital
conservation buffer of 2.5% above each of these levels (to be phased in over three years which beginning at 0.625% on
January 1, 2016 and increasing by that amount on each subsequent January 1, until reaching 2.5% on January 1, 2019) will
be required for banking institutions to avoid restrictions on their ability to pay dividends, repurchase stock or pay discretionary
bonuses. Including the capital conservation buffer of 2.5%, the new capital rules would result in the following minimum
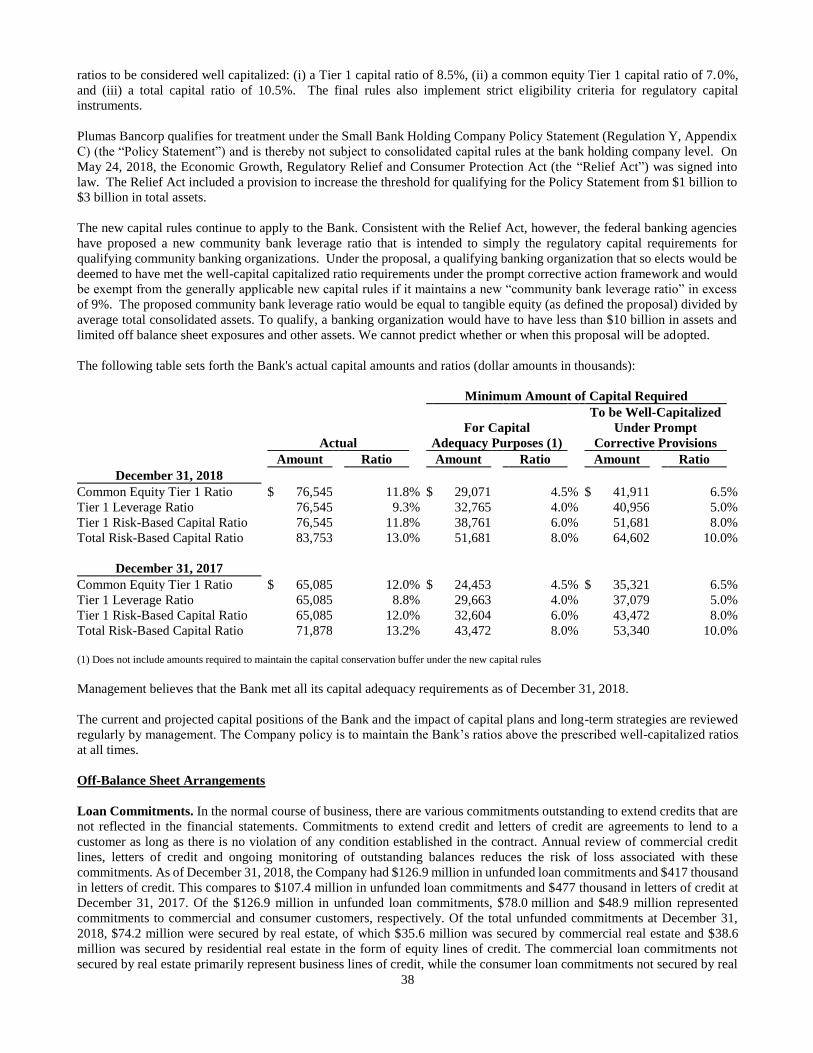
38
ratios to be considered well capitalized: (i) a Tier 1 capital ratio of 8.5%, (ii) a common equity Tier 1 capital ratio of 7.0%,
and (iii) a total capital ratio of 10.5%. The final rules also implement strict eligibility criteria for regulatory capital
instruments.
Plumas Bancorp qualifies for treatment under the Small Bank Holding Company Policy Statement (Regulation Y, Appendix
C) (the “Policy Statement”) and is thereby not subject to consolidated capital rules at the bank holding company level. On
May 24, 2018, the Economic Growth, Regulatory Relief and Consumer Protection Act (the “Relief Act”) was signed into
law. The Relief Act included a provision to increase the threshold for qualifying for the Policy Statement from $1 billion to
$3 billion in total assets.
The new capital rules continue to apply to the Bank. Consistent with the Relief Act, however, the federal banking agencies
have proposed a new community bank leverage ratio that is intended to simply the regulatory capital requirements for
qualifying community banking organizations. Under the proposal, a qualifying banking organization that so elects would be
deemed to have met the well-capital capitalized ratio requirements under the prompt corrective action framework and would
be exempt from the generally applicable new capital rules if it maintains a new “community bank leverage ratio” in excess
of 9%. The proposed community bank leverage ratio would be equal to tangible equity (as defined the proposal) divided by
average total consolidated assets. To qualify, a banking organization would have to have less than $10 billion in assets and
limited off balance sheet exposures and other assets. We cannot predict whether or when this proposal will be adopted.
The following table sets forth the Bank's actual capital amounts and ratios (dollar amounts in thousands):
Minimum Amount of Capital Required
To be Well-Capitalized
For Capital Under Prompt
Actual Adequacy Purposes (1) Corrective Provisions
Amount Ratio Amount Ratio Amount Ratio
December 31, 2018
Common Equity Tier 1 Ratio $ 76,545 11.8 % $ 29,071 4.5 % $ 41,911 6.5 %
Tier 1 Leverage Ratio 76,545 9.3 % 32,765 4.0 % 40,956 5.0 %
Tier 1 Risk-Based Capital Ratio 76,545 11.8 % 38,761 6.0 % 51,681 8.0 %
Total Risk-Based Capital Ratio 83,753 13.0 % 51,681 8.0 % 64,602 10.0 %
December 31, 2017
Common Equity Tier 1 Ratio $ 65,085 12.0 % $ 24,453 4.5 % $ 35,321 6.5 %
Tier 1 Leverage Ratio 65,085 8.8 % 29,663 4.0 % 37,079 5.0 %
Tier 1 Risk-Based Capital Ratio 65,085 12.0 % 32,604 6.0 % 43,472 8.0 %
Total Risk-Based Capital Ratio 71,878 13.2 % 43,472 8.0 % 53,340 10.0 %
(1) Does not include amounts required to maintain the capital conservation buffer under the new capital rules
Management believes that the Bank met all its capital adequacy requirements as of December 31, 2018.
The current and projected capital positions of the Bank and the impact of capital plans and long-term strategies are reviewed
regularly by management. The Company policy is to maintain the Bank’s ratios above the prescribed well-capitalized ratios
at all times.
Off-Balance Sheet Arrangements
Loan Commitments. In the normal course of business, there are various commitments outstanding to extend credits that are
not reflected in the financial statements. Commitments to extend credit and letters of credit are agreements to lend to a
customer as long as there is no violation of any condition established in the contract. Annual review of commercial credit
lines, letters of credit and ongoing monitoring of outstanding balances reduces the risk of loss associated with these
commitments. As of December 31, 2018, the Company had $126.9 million in unfunded loan commitments and $417 thousand
in letters of credit. This compares to $107.4 million in unfunded loan commitments and $477 thousand in letters of credit at
December 31, 2017. Of the $126.9 million in unfunded loan commitments, $78.0 million and $48.9 million represented
commitments to commercial and consumer customers, respectively. Of the total unfunded commitments at December 31,
2018, $74.2 million were secured by real estate, of which $35.6 million was secured by commercial real estate and $38.6
million was secured by residential real estate in the form of equity lines of credit. The commercial loan commitments not
secured by real estate primarily represent business lines of credit, while the consumer loan commitments not secured by real
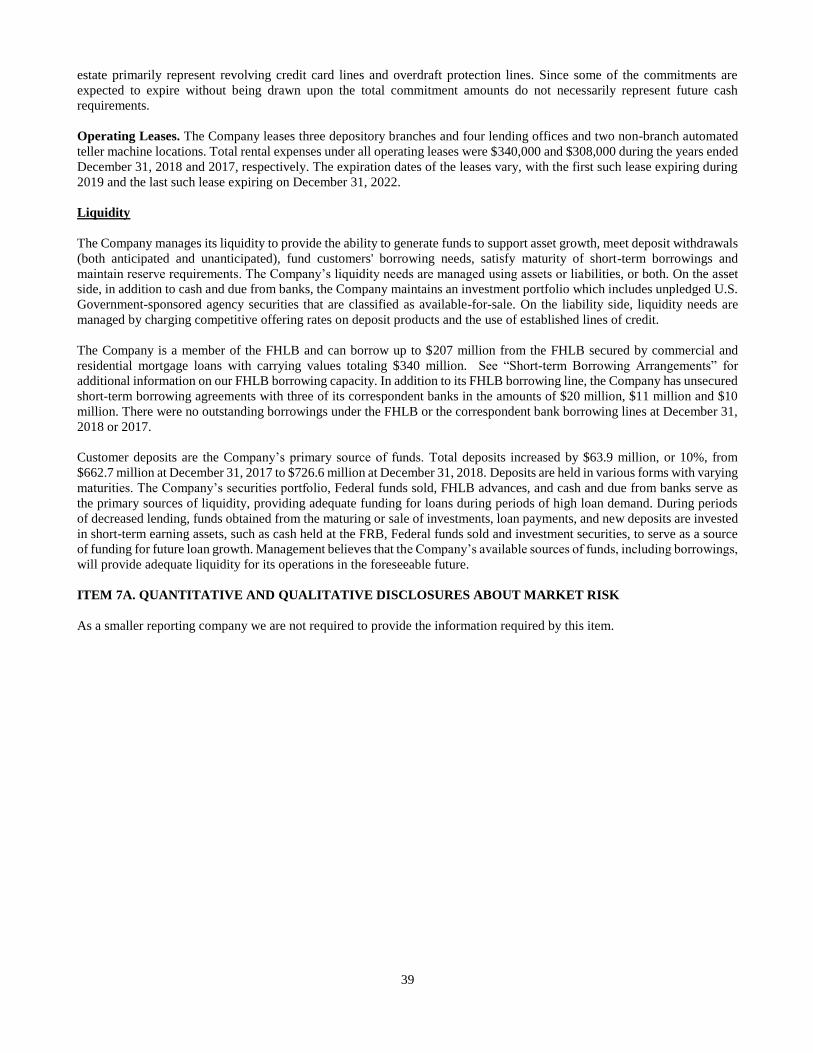
39
estate primarily represent revolving credit card lines and overdraft protection lines. Since some of the commitments are
expected to expire without being drawn upon the total commitment amounts do not necessarily represent future cash
requirements.
Operating Leases. The Company leases three depository branches and four lending offices and two non-branch automated
teller machine locations. Total rental expenses under all operating leases were $340,000 and $308,000 during the years ended
December 31, 2018 and 2017, respectively. The expiration dates of the leases vary, with the first such lease expiring during
2019 and the last such lease expiring on December 31, 2022.
Liquidity
The Company manages its liquidity to provide the ability to generate funds to support asset growth, meet deposit withdrawals
(both anticipated and unanticipated), fund customers' borrowing needs, satisfy maturity of short-term borrowings and
maintain reserve requirements. The Company’s liquidity needs are managed using assets or liabilities, or both. On the asset
side, in addition to cash and due from banks, the Company maintains an investment portfolio which includes unpledged U.S.
Government-sponsored agency securities that are classified as available-for-sale. On the liability side, liquidity needs are
managed by charging competitive offering rates on deposit products and the use of established lines of credit.
The Company is a member of the FHLB and can borrow up to $207 million from the FHLB secured by commercial and
residential mortgage loans with carrying values totaling $340 million. See “Short-term Borrowing Arrangements” for
additional information on our FHLB borrowing capacity. In addition to its FHLB borrowing line, the Company has unsecured
short-term borrowing agreements with three of its correspondent banks in the amounts of $20 million, $11 million and $10
million. There were no outstanding borrowings under the FHLB or the correspondent bank borrowing lines at December 31,
2018 or 2017.
Customer deposits are the Company’s primary source of funds. Total deposits increased by $63.9 million, or 10%, from
$662.7 million at December 31, 2017 to $726.6 million at December 31, 2018. Deposits are held in various forms with varying
maturities. The Company’s securities portfolio, Federal funds sold, FHLB advances, and cash and due from banks serve as
the primary sources of liquidity, providing adequate funding for loans during periods of high loan demand. During periods
of decreased lending, funds obtained from the maturing or sale of investments, loan payments, and new deposits are invested
in short-term earning assets, such as cash held at the FRB, Federal funds sold and investment securities, to serve as a source
of funding for future loan growth. Management believes that the Company’s available sources of funds, including borrowings,
will provide adequate liquidity for its operations in the foreseeable future.
ITEM 7A. QUANTITATIVE AND QUALITATIVE DISCLOSURES ABOUT MARKET RISK
As a smaller reporting company we are not required to provide the information required by this item.
40
ITEM 8. FINANCIAL STATEMENTS AND SUPPLEMENTARY DATA
The following consolidated financial statements of Plumas Bancorp and subsidiary, and report of the independent registered
public accounting firm are included in the Annual Report of Plumas Bancorp to its shareholders for the years ended
December 31, 2018, 2017 and 2016.
Page
Management’s Report on Internal Control Over Financial Reporting F-1
Report of Independent Registered Public Accounting Firm F-2
Consolidated Balance Sheets as of December 31, 2018 and 2017 F-4
Consolidated Statements of Income for the years ended December 31, 2018, 2017 and 2016 F-5
Consolidated Statements of Comprehensive Income for the years ended December 31, 2018, 2017 and 2016 F-7
Consolidated Statements of Changes in Shareholders' Equity for the years ended December 31, 2018, 2017 and 2016 F-8
Consolidated Statements of Cash Flows for the years ended December 31, 2018, 2017 and 2016 F-9
Notes to Consolidated Financial Statements F-12
F-1
MANAGEMENT’S REPORT ON INTERNAL CONTROL OVER FINANCIAL REPORTING
Management of Plumas Bancorp and subsidiary (the “Company”), is responsible for establishing and maintaining adequate
internal control over financial reporting. The Company’s internal control over financial reporting is a process designed under the
supervision of the Company’s Chief Executive Officer and Chief Financial Officer to provide reasonable assurance regarding the
reliability of financial reporting and the preparation of the Company’s financial statements for external reporting purposes in
accordance with accounting principles generally accepted in the United States of America.
As of December 31, 2018, management assessed the effectiveness of the Company’s internal control over financial reporting
based on the framework established in the 2013 Internal Control — Integrated Framework issued by the Committee of
Sponsoring Organizations of the Treadway Commission (COSO). Based on this assessment, management has determined that
the Company’s internal control over financial reporting as of December 31, 2018, is effective.
Vavrinek, Trine, Day & Co., LLP, the independent registered public accounting firm that audited the 2018 consolidated financial
statements included in this annual report on Form 10-K, has issued an audit report on the effectiveness of the Company’s internal
control over financial reporting as of December 31, 2018, which is included herein.
F-2
REPORT OF INDEPENDENT REGISTERED PUBLIC ACCOUNTING FIRM
To the Board of Directors and Shareholders
Plumas Bancorp and Subsidiary
Quincy, California
Opinions on the Consolidated Financial Statements and Internal Control over Financial Reporting
We have audited the accompanying consolidated balance sheets of Plumas Bancorp and Subsidiary (the "Company") as of
December 31, 2018 and 2017, and the related consolidated statements of income and comprehensive income, changes in
shareholders' equity, and cash flows for each of the years in the three year period ended December 31, 2018, and the related notes
(collectively referred to as the "financial statements").
We also have audited the Company's internal control over financial reporting as of December 31, 2018, based on criteria
established in Internal Control - Integrated Framework: (2013) issued by the Committee of Sponsoring Organizations of the
Treadway Commission (COSO).
In our opinion, the financial statements referred to above present fairly, in all material respects, the financial position of the
Company as of December 31, 2018 and 2017, and the results of its operations and its cash flows for each of the years in the three
year period ended December 31, 2018 in conformity with accounting principles generally accepted in the United States of
America. Also in our opinion, the Company maintained, in all material respects, effective internal control over financial reporting
as of December 31, 2018, based on criteria established in Internal Control - Integrated Framework: (2013) issued by the
Committee of Sponsoring Organizations of the Treadway Commission (COSO).
Basis for Opinions
The Company's management is responsible for these financial statements, for maintaining effective internal control over financial
reporting, and for its assessment of the effectiveness of internal control over financial reporting, included in the accompanying
Management’s Annual Report on Internal Control over Financial Reporting. Our responsibility is to express an opinion on the
Company's financial statements and an opinion on the Company's internal control over financial reporting based on our audits.
We are a public accounting firm registered with the Public Company Accounting Oversight Board (United States) ("PCAOB")
and are required to be independent with respect to the Company in accordance with the U.S. federal securities laws and the
applicable rules and regulations of the Securities and Exchange Commission and the PCAOB.
We conducted our audits in accordance with the standards of the PCAOB. Those standards require that we plan and perform the
audits to obtain reasonable assurance about whether the financial statements are free of material misstatement, whether due to
error or fraud, and whether effective internal control over financial reporting was maintained in all material respects.
Our audits of the financial statements included performing procedures to assess the risks of material misstatement of the financial
statements, whether due to error or fraud, and performing procedures that respond to those risks. Such procedures included
examining, on a test basis, evidence regarding the amounts and disclosures in the financial statements. Our audits also included
evaluating the accounting principles used and significant estimates made by management, and as well as evaluating the overall
presentation of the financial statements. Our audit of internal control over financial reporting included obtaining an understanding
of internal control over financial reporting, assessing the risk that a material weakness exists, and testing and evaluating the
design and operating effectiveness of internal control based on the assessed risk. Our audits also included performing such other
procedures as we considered necessary in the circumstances. We believe that our audits provide a reasonable basis for our
opinions.
F-3
REPORT OF INDEPENDENT REGISTERED PUBLIC ACCOUNTING FIRM
(Continued)
Definition and Limitations of Internal Control Over Financial Reporting
A company's internal control over financial reporting is a process designed to provide reasonable assurance regarding the
reliability of financial reporting and the preparation of financial statements for external purposes in accordance with generally
accepted accounting principles. A company's internal control over financial reporting includes those policies and procedures that
(1) pertain to the maintenance of records that, in reasonable detail, accurately and fairly reflect the transactions and dispositions
of the assets of the company; (2) provide reasonable assurance that transactions are recorded as necessary to permit preparation
of financial statements in accordance with generally accepted accounting principles, and that receipts and expenditures of the
company are being made only in accordance with authorizations of management and directors of the company; and (3) provide
reasonable assurance regarding prevention or timely detection of unauthorized acquisition, use, or disposition of the company's
assets that could have a material effect on the financial statements.
Because of its inherent limitations, internal control over financial reporting may not prevent or detect misstatements. Also,
projections of any evaluation of effectiveness to future periods are subject to the risk that controls may become inadequate
because of changes in conditions, or that the degree of compliance with the policies or procedures may deteriorate.
/s/ Vavrinek, Trine, Day & Co., LLP
We have served as the Company's auditor since 2013.
Laguna Hills, California
March 7, 2019
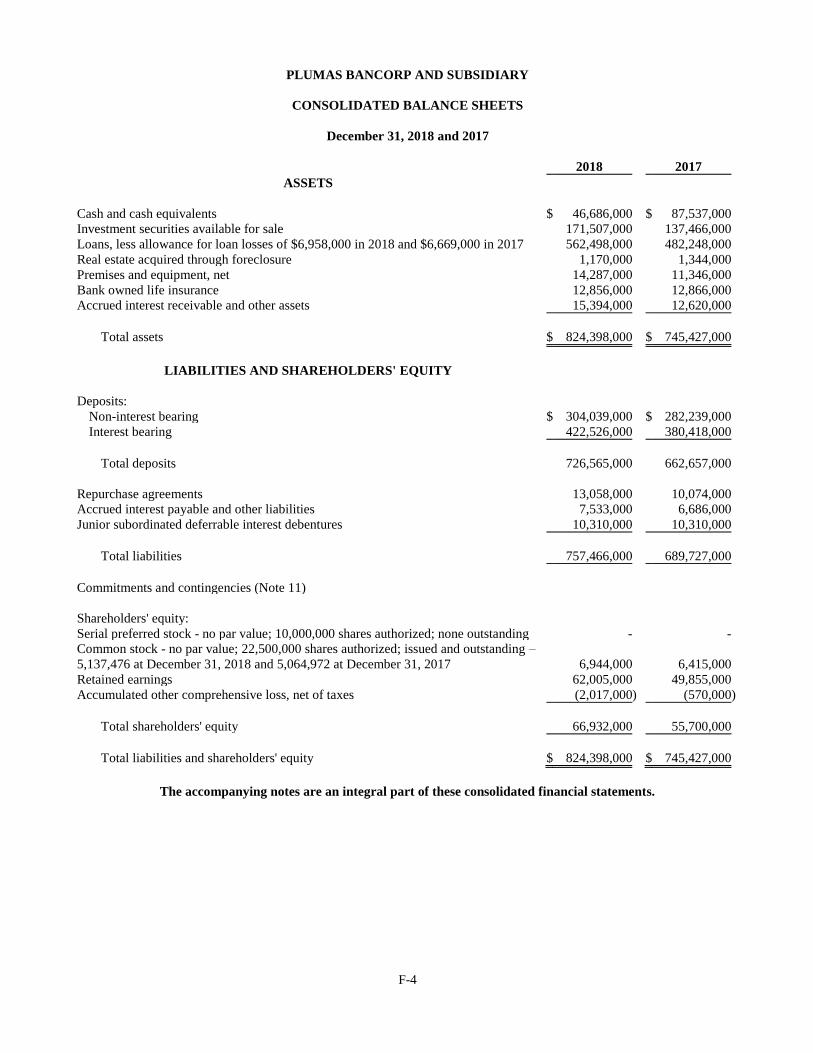
F-4
PLUMAS BANCORP AND SUBSIDIARY
CONSOLIDATED BALANCE SHEETS
December 31, 2018 and 2017
2018 2017
ASSETS
Cash and cash equivalents $ 46,686,000 $ 87,537,000
Investment securities available for sale 171,507,000 137,466,000
Loans, less allowance for loan losses of $6,958,000 in 2018 and $6,669,000 in 2017 562,498,000 482,248,000
Real estate acquired through foreclosure 1,170,000 1,344,000
Premises and equipment, net 14,287,000 11,346,000
Bank owned life insurance 12,856,000 12,866,000
Accrued interest receivable and other assets 15,394,000 12,620,000
Total assets $ 824,398,000 $ 745,427,000
LIABILITIES AND SHAREHOLDERS' EQUITY
Deposits:
Non-interest bearing $ 304,039,000 $ 282,239,000
Interest bearing 422,526,000 380,418,000
Total deposits 726,565,000 662,657,000
Repurchase agreements 13,058,000 10,074,000
Accrued interest payable and other liabilities 7,533,000 6,686,000
Junior subordinated deferrable interest debentures 10,310,000 10,310,000
Total liabilities 757,466,000 689,727,000
Commitments and contingencies (Note 11)
Shareholders' equity:
Serial preferred stock - no par value; 10,000,000 shares authorized; none outstanding - -
Common stock - no par value; 22,500,000 shares authorized; issued and outstanding –
5,137,476 at December 31, 2018 and 5,064,972 at December 31, 2017 6,944,000 6,415,000
Retained earnings 62,005,000 49,855,000
Accumulated other comprehensive loss, net of taxes (2,017,000 ) (570,000 )
Total shareholders' equity 66,932,000 55,700,000
Total liabilities and shareholders' equity $ 824,398,000 $ 745,427,000
The accompanying notes are an integral part of these consolidated financial statements.
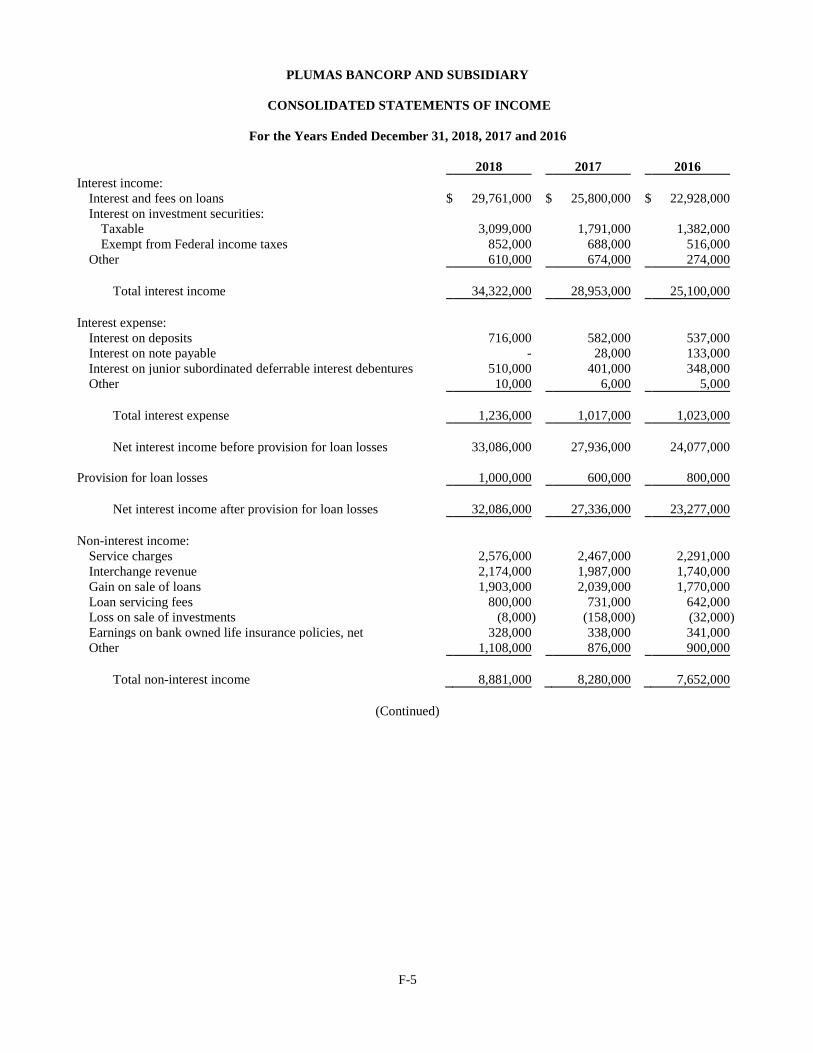
F-5
PLUMAS BANCORP AND SUBSIDIARY
CONSOLIDATED STATEMENTS OF INCOME
For the Years Ended December 31, 2018, 2017 and 2016
2018 2017 2016
Interest income:
Interest and fees on loans $ 29,761,000 $ 25,800,000 $ 22,928,000
Interest on investment securities:
Taxable 3,099,000 1,791,000 1,382,000
Exempt from Federal income taxes 852,000 688,000 516,000
Other 610,000 674,000 274,000
Total interest income 34,322,000 28,953,000 25,100,000
Interest expense:
Interest on deposits 716,000 582,000 537,000
Interest on note payable - 28,000 133,000
Interest on junior subordinated deferrable interest debentures 510,000 401,000 348,000
Other 10,000 6,000 5,000
Total interest expense 1,236,000 1,017,000 1,023,000
Net interest income before provision for loan losses 33,086,000 27,936,000 24,077,000
Provision for loan losses 1,000,000 600,000 800,000
Net interest income after provision for loan losses 32,086,000 27,336,000 23,277,000
Non-interest income:
Service charges 2,576,000 2,467,000 2,291,000
Interchange revenue 2,174,000 1,987,000 1,740,000
Gain on sale of loans 1,903,000 2,039,000 1,770,000
Loan servicing fees 800,000 731,000 642,000
Loss on sale of investments (8,000 ) (158,000 ) (32,000 )
Earnings on bank owned life insurance policies, net 328,000 338,000 341,000
Other 1,108,000 876,000 900,000
Total non-interest income 8,881,000 8,280,000 7,652,000
(Continued)
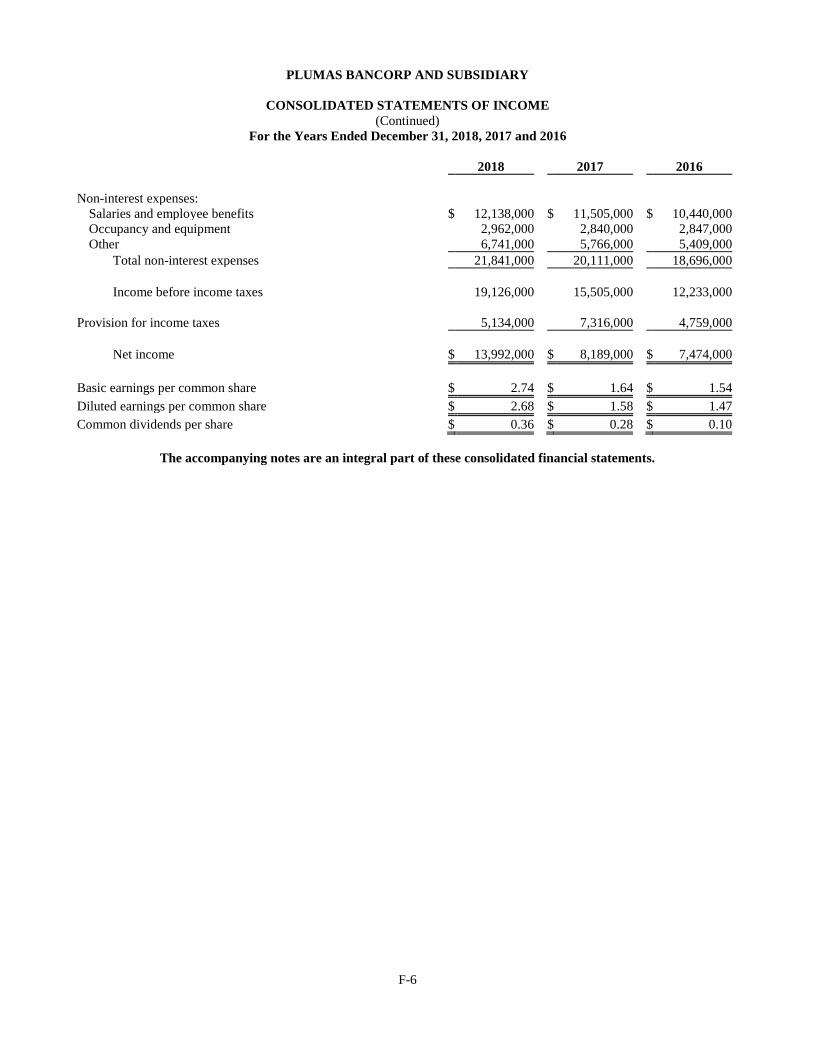
F-6
PLUMAS BANCORP AND SUBSIDIARY
CONSOLIDATED STATEMENTS OF INCOME
(Continued)
For the Years Ended December 31, 2018, 2017 and 2016
2018 2017 2016
Non-interest expenses:
Salaries and employee benefits $ 12,138,000 $ 11,505,000 $ 10,440,000
Occupancy and equipment 2,962,000 2,840,000 2,847,000
Other 6,741,000 5,766,000 5,409,000
Total non-interest expenses 21,841,000 20,111,000 18,696,000
Income before income taxes 19,126,000 15,505,000 12,233,000
Provision for income taxes 5,134,000 7,316,000 4,759,000
Net income $ 13,992,000 $ 8,189,000 $ 7,474,000
Basic earnings per common share $ 2.74 $ 1.64 $ 1.54
Diluted earnings per common share $ 2.68 $ 1.58 $ 1.47
Common dividends per share $ 0.36 $ 0.28 $ 0.10
The accompanying notes are an integral part of these consolidated financial statements.
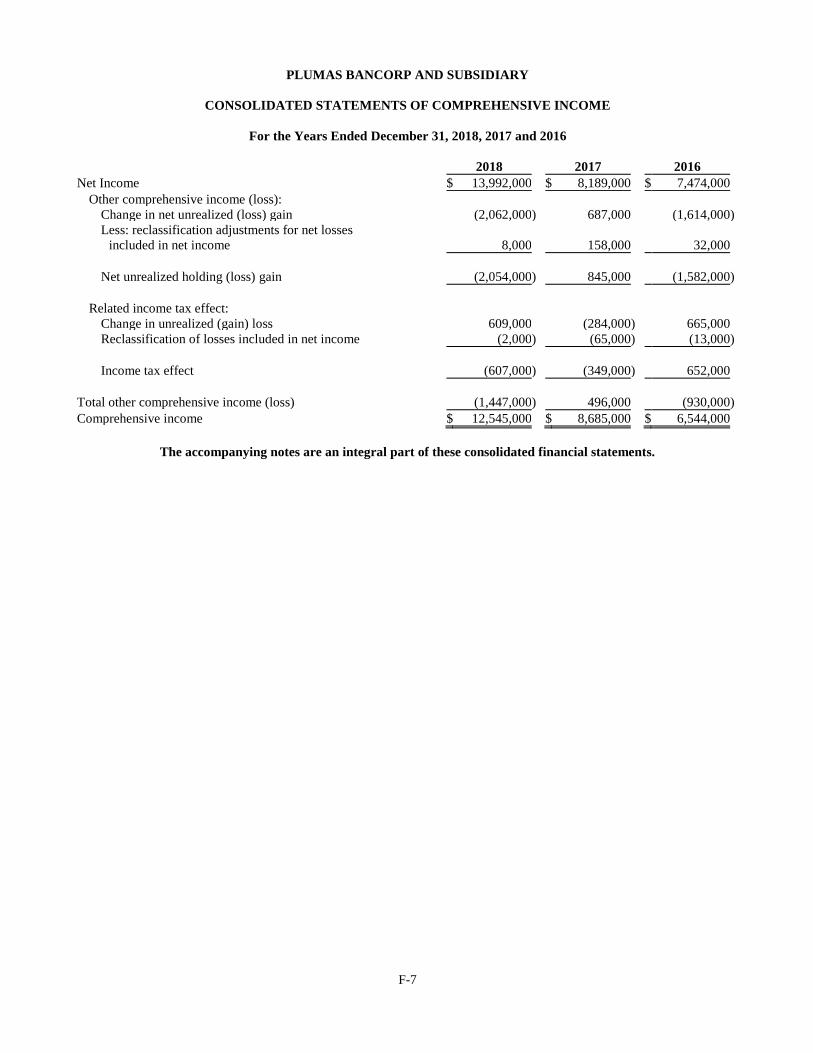
F-7
PLUMAS BANCORP AND SUBSIDIARY
CONSOLIDATED STATEMENTS OF COMPREHENSIVE INCOME
For the Years Ended December 31, 2018, 2017 and 2016
2018 2017 2016
Net Income $ 13,992,000 $ 8,189,000 $ 7,474,000
Other comprehensive income (loss):
Change in net unrealized (loss) gain (2,062,000 ) 687,000 (1,614,000 )
Less: reclassification adjustments for net losses
included in net income 8,000 158,000 32,000
Net unrealized holding (loss) gain (2,054,000 ) 845,000 (1,582,000 )
Related income tax effect:
Change in unrealized (gain) loss 609,000 (284,000 ) 665,000 Reclassification of losses included in net income (2,000 ) (65,000 ) (13,000 )
Income tax effect (607,000 ) (349,000 ) 652,000
Total other comprehensive income (loss) (1,447,000 ) 496,000 (930,000 )
Comprehensive income $ 12,545,000 $ 8,685,000 $ 6,544,000
The accompanying notes are an integral part of these consolidated financial statements.
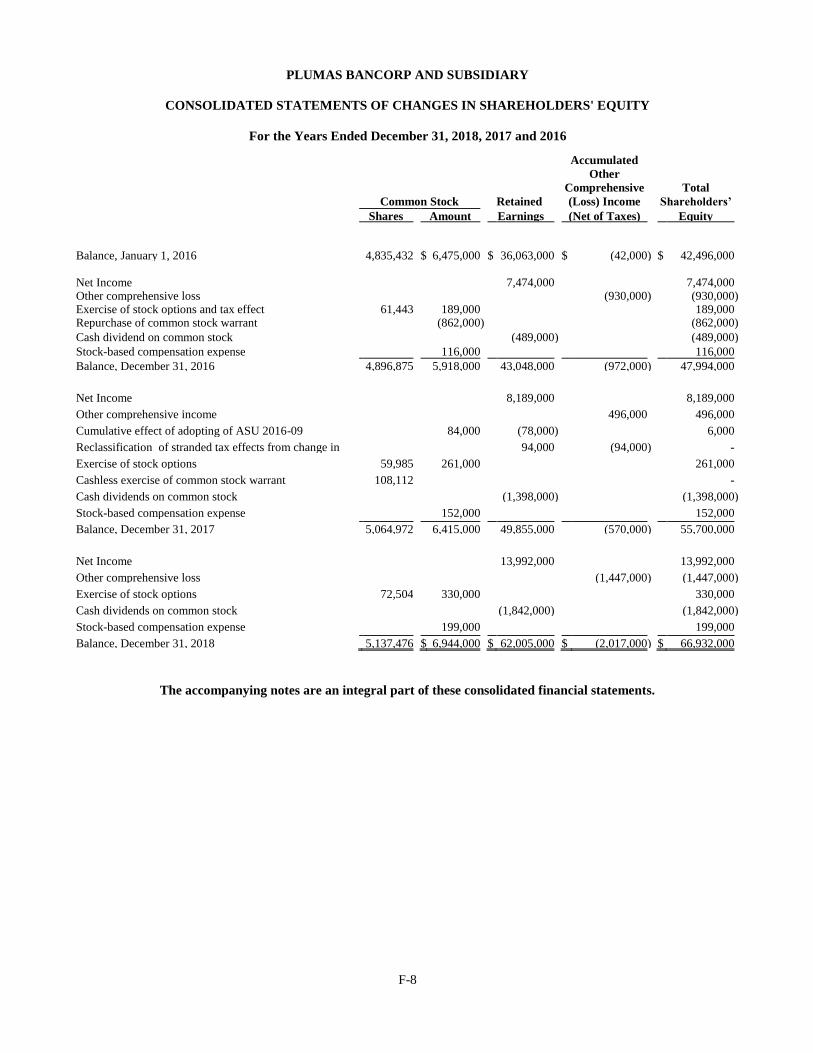
F-8
PLUMAS BANCORP AND SUBSIDIARY
CONSOLIDATED STATEMENTS OF CHANGES IN SHAREHOLDERS' EQUITY
For the Years Ended December 31, 2018, 2017 and 2016
The accompanying notes are an integral part of these consolidated financial statements.
Common Stock
Retained
Accumulated
Other
Comprehensive
(Loss) Income
Total
Shareholders’
Shares Amount Earnings (Net of Taxes) Equity Balance, January 1, 2016 4,835,432 $ 6,475,000 $ 36,063,000 $ (42,000 ) $ 42,496,000 Net Income 7,474,000 7,474,000 Other comprehensive loss (930,000 ) (930,000 ) Exercise of stock options and tax effect 61,443 189,000 189,000 Repurchase of common stock warrant (862,000 ) (862,000 )
Cash dividend on common stock (489,000 ) (489,000 )
Stock-based compensation expense 116,000 116,000 Balance, December 31, 2016 4,896,875 5,918,000 43,048,000 (972,000 ) 47,994,000
Net Income 8,189,000 8,189,000
Other comprehensive income 496,000 496,000
Cumulative effect of adopting of ASU 2016-09 84,000 (78,000 ) 6,000
Reclassification of stranded tax effects from change in
tax rate
94,000 (94,000 ) -
Exercise of stock options 59,985 261,000 261,000
Cashless exercise of common stock warrant 108,112 -
Cash dividends on common stock (1,398,000 ) (1,398,000 )
Stock-based compensation expense 152,000 152,000
Balance, December 31, 2017 5,064,972 6,415,000 49,855,000 (570,000 ) 55,700,000
Net Income 13,992,000 13,992,000
Other comprehensive loss (1,447,000 ) (1,447,000 )
Exercise of stock options 72,504 330,000 330,000
Cash dividends on common stock (1,842,000) (1,842,000 )
Stock-based compensation expense 199,000 199,000
Balance, December 31, 2018 5,137,476 $ 6,944,000 $ 62,005,000 $ (2,017,000 ) $ 66,932,000
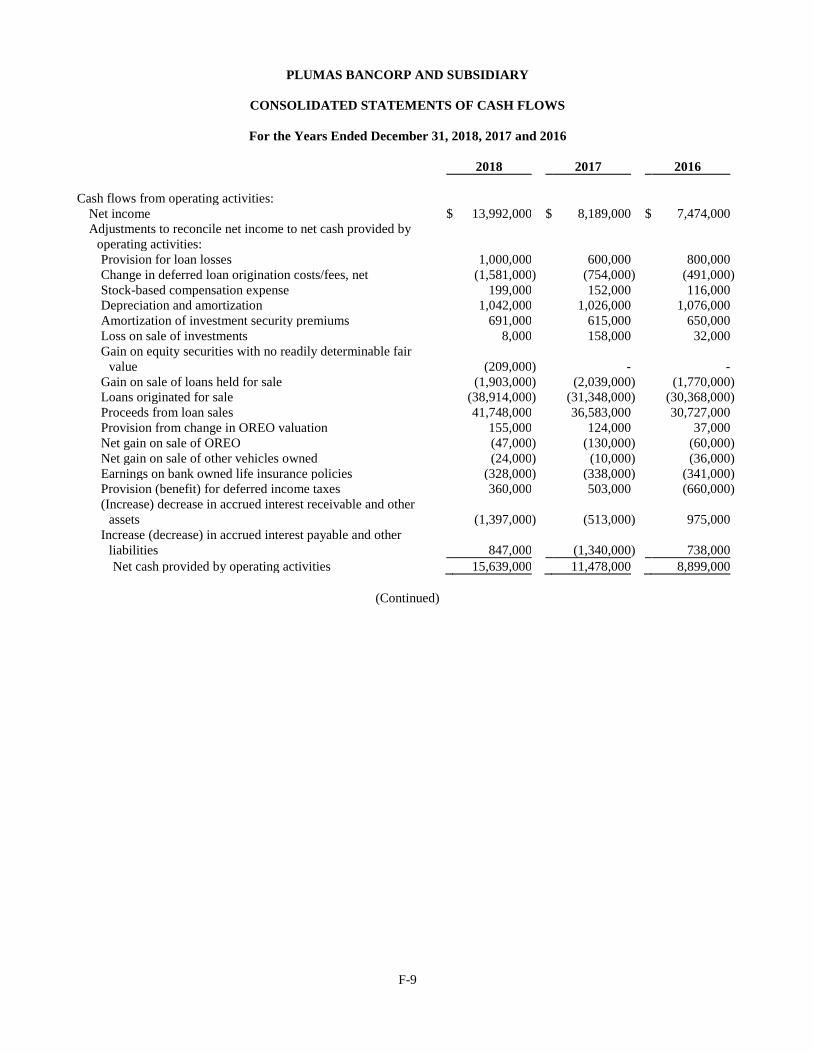
F-9
PLUMAS BANCORP AND SUBSIDIARY
CONSOLIDATED STATEMENTS OF CASH FLOWS
For the Years Ended December 31, 2018, 2017 and 2016
2018 2017 2016
Cash flows from operating activities:
Net income $ 13,992,000 $ 8,189,000 $ 7,474,000
Adjustments to reconcile net income to net cash provided by
operating activities:
Provision for loan losses 1,000,000 600,000 800,000
Change in deferred loan origination costs/fees, net (1,581,000 ) (754,000 ) (491,000 )
Stock-based compensation expense 199,000 152,000 116,000
Depreciation and amortization 1,042,000 1,026,000 1,076,000
Amortization of investment security premiums 691,000 615,000 650,000
Loss on sale of investments 8,000 158,000 32,000 Gain on equity securities with no readily determinable fair
value (209,000 ) - -
Gain on sale of loans held for sale (1,903,000 ) (2,039,000 ) (1,770,000 )
Loans originated for sale (38,914,000 ) (31,348,000 ) (30,368,000 )
Proceeds from loan sales 41,748,000 36,583,000 30,727,000
Provision from change in OREO valuation 155,000 124,000 37,000
Net gain on sale of OREO (47,000 ) (130,000 ) (60,000 )
Net gain on sale of other vehicles owned (24,000 ) (10,000 ) (36,000 )
Earnings on bank owned life insurance policies (328,000 ) (338,000 ) (341,000 )
Provision (benefit) for deferred income taxes 360,000 503,000 (660,000 )
(Increase) decrease in accrued interest receivable and other
assets (1,397,000 ) (513,000 ) 975,000 Increase (decrease) in accrued interest payable and other
liabilities 847,000 (1,340,000 ) 738,000
Net cash provided by operating activities 15,639,000 11,478,000 8,899,000
(Continued)
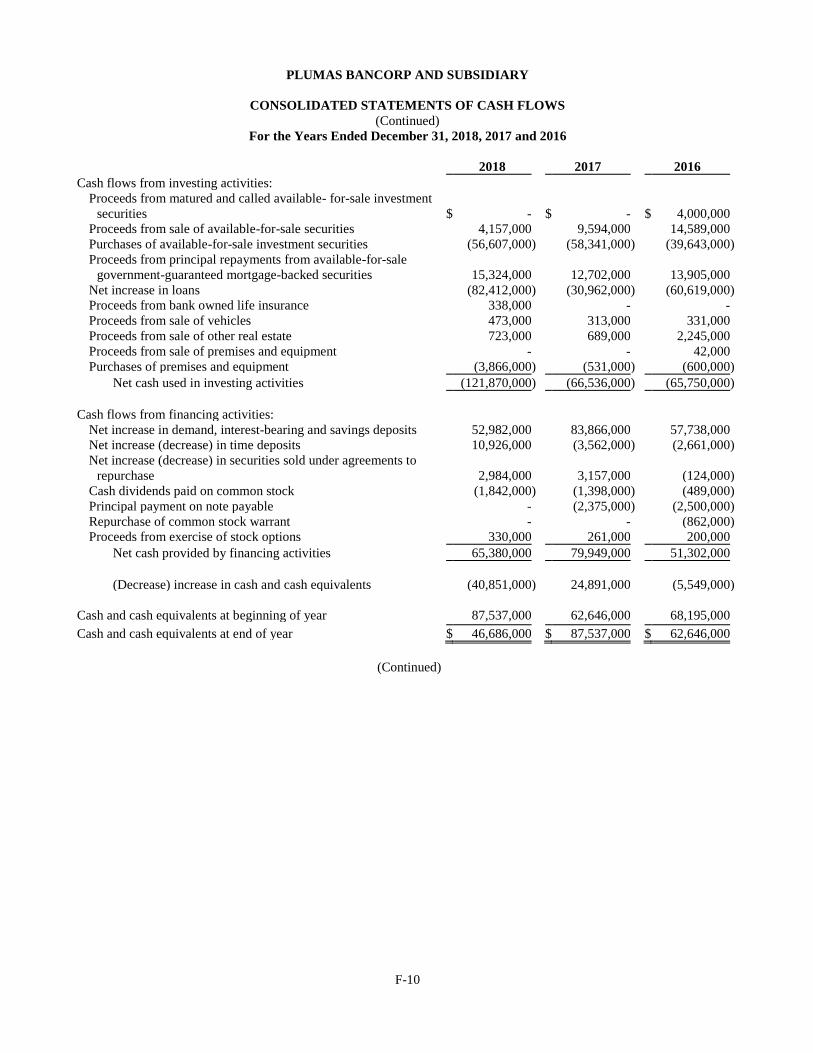
F-10
PLUMAS BANCORP AND SUBSIDIARY
CONSOLIDATED STATEMENTS OF CASH FLOWS
(Continued)
For the Years Ended December 31, 2018, 2017 and 2016
2018 2017 2016
Cash flows from investing activities:
Proceeds from matured and called available- for-sale investment
securities $ -
$ -
$ 4,000,000
Proceeds from sale of available-for-sale securities 4,157,000 9,594,000 14,589,000
Purchases of available-for-sale investment securities (56,607,000 ) (58,341,000 ) (39,643,000 )
Proceeds from principal repayments from available-for-sale
government-guaranteed mortgage-backed securities 15,324,000 12,702,000 13,905,000
Net increase in loans (82,412,000 ) (30,962,000 ) (60,619,000 )
Proceeds from bank owned life insurance 338,000 - -
Proceeds from sale of vehicles 473,000 313,000 331,000
Proceeds from sale of other real estate 723,000 689,000 2,245,000
Proceeds from sale of premises and equipment - - 42,000
Purchases of premises and equipment (3,866,000 ) (531,000 ) (600,000 )
Net cash used in investing activities (121,870,000 ) (66,536,000 ) (65,750,000 )
Cash flows from financing activities:
Net increase in demand, interest-bearing and savings deposits 52,982,000 83,866,000 57,738,000
Net increase (decrease) in time deposits 10,926,000 (3,562,000 ) (2,661,000 )
Net increase (decrease) in securities sold under agreements to
repurchase 2,984,000 3,157,000 (124,000 )
Cash dividends paid on common stock (1,842,000 ) (1,398,000 ) (489,000 )
Principal payment on note payable - (2,375,000 ) (2,500,000 )
Repurchase of common stock warrant - - (862,000 )
Proceeds from exercise of stock options 330,000 261,000 200,000
Net cash provided by financing activities 65,380,000 79,949,000 51,302,000
(Decrease) increase in cash and cash equivalents (40,851,000 ) 24,891,000 (5,549,000 )
Cash and cash equivalents at beginning of year 87,537,000 62,646,000 68,195,000
Cash and cash equivalents at end of year $ 46,686,000 $ 87,537,000 $ 62,646,000
(Continued)
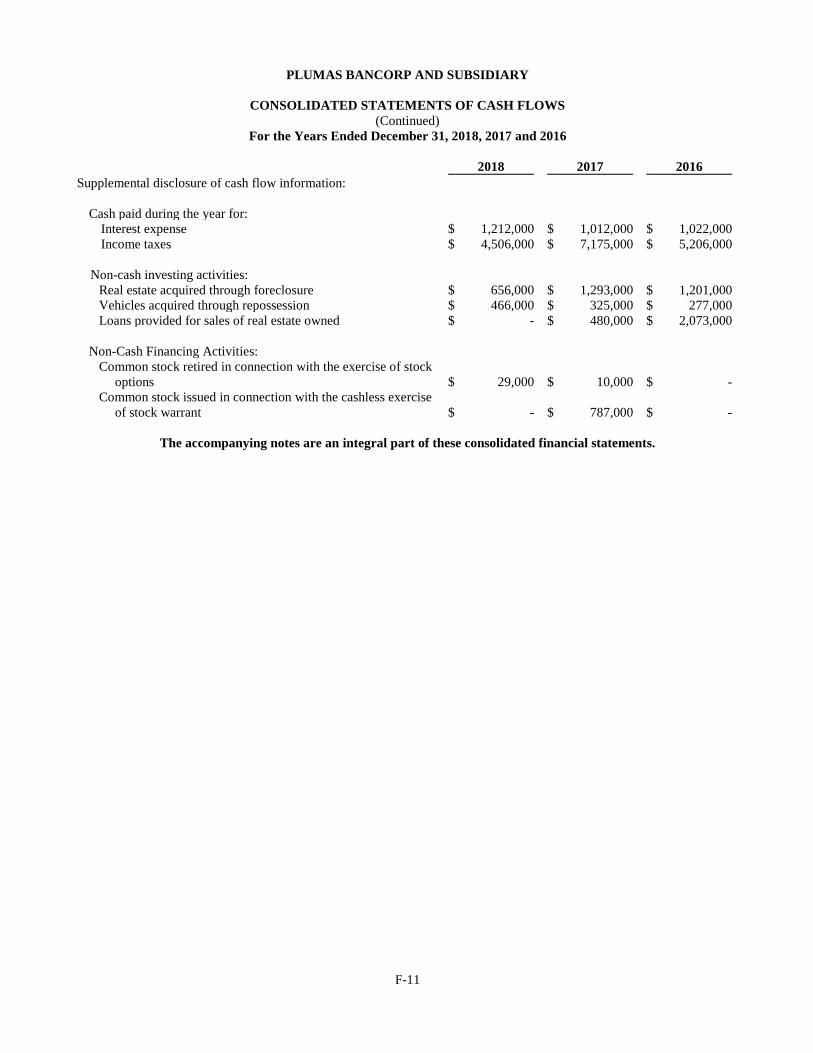
F-11
PLUMAS BANCORP AND SUBSIDIARY
CONSOLIDATED STATEMENTS OF CASH FLOWS
(Continued)
For the Years Ended December 31, 2018, 2017 and 2016
2018 2017 2016
Supplemental disclosure of cash flow information:
Cash paid during the year for:
Interest expense $ 1,212,000 $ 1,012,000 $ 1,022,000
Income taxes $ 4,506,000 $ 7,175,000 $ 5,206,000
Non-cash investing activities:
Real estate acquired through foreclosure $ 656,000 $ 1,293,000 $ 1,201,000
Vehicles acquired through repossession $ 466,000 $ 325,000 $ 277,000
Loans provided for sales of real estate owned $ - $ 480,000 $ 2,073,000
Non-Cash Financing Activities:
Common stock retired in connection with the exercise of stock
options $ 29,000 $ 10,000 $ -
Common stock issued in connection with the cashless exercise
of stock warrant $ - $ 787,000 $ -
The accompanying notes are an integral part of these consolidated financial statements.
F-12
PLUMAS BANCORP AND SUBSIDIARY
NOTES TO CONSOLIDATED FINANCIAL STATEMENTS
1. THE BUSINESS OF PLUMAS BANCORP
During 2002, Plumas Bancorp (the "Company") was incorporated as a bank holding company for the purpose of
acquiring Plumas Bank (the "Bank") in a one bank holding company reorganization. This corporate structure gives
the Company and the Bank greater flexibility in terms of operation, expansion and diversification. The Company
formed Plumas Statutory Trust I ("Trust I") for the sole purpose of issuing trust preferred securities on September
26, 2002. The Company formed Plumas Statutory Trust II ("Trust II") for the sole purpose of issuing trust preferred
securities on September 28, 2005.
The Bank operates eleven branches in California, including branches in Alturas, Chester, Fall River Mills,
Greenville, Kings Beach, Portola, Quincy, Redding, Susanville, Tahoe City, and Truckee. In December, 2015 the
Bank opened a branch in Reno, Nevada; its first branch outside of California and in 2018 the Bank purchased a
branch located in Carson City, Nevada. The Bank’s administrative headquarters is in Quincy, California. In addition,
the Bank operates a lending office specializing in government-guaranteed lending in Auburn, California, and
commercial/agricultural lending offices in Chico and Red Bluff, California and Klamath Falls, Oregon. The Bank's
primary source of revenue is generated from providing loans to customers who are predominately small and middle
market businesses and individuals residing in the surrounding areas.
2. SUMMARY OF SIGNIFICANT ACCOUNTING POLICIES
Consolidation and Basis of Presentation
The consolidated financial statements include the accounts of the Company and the consolidated accounts of its
wholly-owned subsidiary, Plumas Bank. All significant intercompany balances and transactions have been
eliminated.
Plumas Statutory Trust I and Trust II are not consolidated into the Company's consolidated financial statements and,
accordingly, are accounted for under the equity method. The Company's investment in Trust I of $338,000 and Trust
II of $174,000 are included in accrued interest receivable and other assets on the consolidated balance sheet. The
junior subordinated deferrable interest debentures issued and guaranteed by the Company and held by Trust I and
Trust II are reflected as debt on the consolidated balance sheet.
The accounting and reporting policies of Plumas Bancorp and subsidiary conform with accounting principles
generally accepted in the United States of America and prevailing practices within the banking industry.
Reclassifications
Certain reclassifications have been made to prior years’ balances to conform to the classifications used in 2018.
These reclassifications had no impact on the Company’s consolidated financial position, results of operations or net
change in cash and cash equivalents.
Segment Information
Management has determined that since all of the banking products and services offered by the Company are available
in each branch of the Bank, all branches are located within the same economic environment and management does
not allocate resources based on the performance of different lending or transaction activities, it is appropriate to
aggregate the Bank branches and report them as a single operating segment. No customer accounts for more than 10
percent of revenues for the Company or the Bank.
F-13
PLUMAS BANCORP AND SUBSIDIARY
NOTES TO CONSOLIDATED FINANCIAL STATEMENTS
(Continued)
2. SUMMARY OF SIGNIFICANT ACCOUNTING POLICIES (Continued)
Use of Estimates
To prepare financial statements in conformity with accounting principles generally accepted in the United States of
America management makes estimates and assumptions based on available information. These estimates and
assumptions affect the amounts reported in the financial statements and the disclosures provided, and actual results
could differ. The allowance for loan losses, loan servicing rights, deferred tax assets, and fair values of financial
instruments are particularly subject to change.
Cash and Cash Equivalents
For the purpose of the statement of cash flows, cash and due from banks and Federal funds sold are considered to
be cash equivalents. Generally, Federal funds are sold for one day periods. Cash held with other federally insured
institutions in excess of FDIC limits as of December 31, 2018 was $10.1 million. Net cash flows are reported for
customer loans and deposit transactions and repurchase agreements.
Investment Securities
Investments are classified into one of the following categories:
● Available-for-sale securities reported at fair value, with unrealized gains and losses excluded from earnings
and reported, net of taxes, as accumulated other comprehensive income (loss) within shareholders' equity.
● Held-to-maturity securities, which management has the positive intent and ability to hold, reported at
amortized cost, adjusted for the accretion of discounts and amortization of premiums. As of December 31,
2018 and 2017 the Company did not have any investment securities classified as held-to-maturity.
Management determines the appropriate classification of its investments at the time of purchase and may only change
the classification in certain limited circumstances.
As of December 31, 2018, and 2017 the Company did not have any investment securities classified as trading and
gains or losses on the sale of securities are computed on the specific identification method. Interest earned on
investment securities is reported in interest income, net of applicable adjustments for accretion of discounts and
amortization of premiums accounted for by the level yield method with no pre-payment anticipated.
An investment security is impaired when its carrying value is greater than its fair value. Investment securities that
are impaired are evaluated on at least a quarterly basis and more frequently when economic or market conditions
warrant such an evaluation to determine whether such a decline in their fair value is other than temporary.
Management utilizes criteria such as the magnitude and duration of the decline and the intent and ability of the
Company to retain its investment in the securities for a period of time sufficient to allow for an anticipated recovery
in fair value, in addition to the reasons underlying the decline, to determine whether the loss in value is other than
temporary. The term "other than temporary" is not intended to indicate that the decline is permanent, but indicates
that the prospects for a near-term recovery of value is not necessarily favorable, or that there is a lack of evidence to
support a realizable value equal to or greater than the carrying value of the investment. Once a decline in value is
determined to be other than temporary, and management does not intend to sell the security or it is more likely than
not that the Company will not be required to sell the security before recovery, only the portion of the impairment
loss representing credit exposure is recognized as a charge to earnings, with the balance recognized as a charge to
other comprehensive income. If management intends to sell the security or it is more likely than not that the Company
will be required to sell the security before recovering its forecasted cost, the entire impairment loss is recognized as
a charge to earnings.
F-14
PLUMAS BANCORP AND SUBSIDIARY
NOTES TO CONSOLIDATED FINANCIAL STATEMENTS
(Continued)
2. SUMMARY OF SIGNIFICANT ACCOUNTING POLICIES (Continued)
Investment in Federal Home Loan Bank Stock
As a member of the Federal Home Loan Bank (FHLB) System, the Bank is required to maintain an investment in
the capital stock of the FHLB. The investment is carried at cost classified as a restricted security, and periodically
evaluated for impairment based on ultimate recovery of par value. At December 31, 2018 and December 31, 2017,
the Company held $3,027,000 and $2,685,000, respectively of FHLB stock. On the consolidated balance sheet,
FHLB stock is included in accrued interest receivable and other assets.
Loans Held for Sale, Loan Sales and Servicing
Included in the loan portfolio are loans which are 75% to 85% guaranteed by the Small Business Administration
(SBA), US Department of Agriculture Rural Business Cooperative Service (RBS) and Farm Services Agency (FSA).
The guaranteed portion of these loans may be sold to a third party, with the Bank retaining the unguaranteed portion.
The Company can receive a premium in excess of the adjusted carrying value of the loan at the time of sale.
As of December 31, 2018, and 2017 the Company had $1.3 million and $614 thousand, respectively in government
guaranteed loans held for sale. Loans held for sale are recorded at the lower of cost or fair value and therefore may
be reported at fair value on a non-recurring basis. The fair values for loans held for sale are based on either observable
transactions of similar instruments or formally committed loan sale prices.
Government guaranteed loans with unpaid balances of $122,379,000 and $112,781,000 were being serviced for
others at December 31, 2018 and 2017, respectively.
The Company accounts for the transfer and servicing of financial assets based on the fair value of financial and
servicing assets it controls and liabilities it has assumed, derecognizes financial assets when control has been
surrendered, and derecognizes liabilities when extinguished.
Servicing rights acquired through 1) a purchase or 2) the origination of loans which are sold or securitized with
servicing rights retained are recognized as separate assets or liabilities. Servicing assets or liabilities are recorded at
fair value and are subsequently amortized in proportion to and over the period of the related net servicing income or
expense. Servicing rights are evaluated for impairment based upon the fair value of the rights as compared to carrying
amount. Impairment is determined by stratifying rights into groupings based on predominant risk characteristics,
such as interest rate, loan type and investor type. Impairment is recognized through a valuation allowance for an
individual grouping, to the extent that fair value is less than the carrying amount. If the Company later determines
that all or a portion of the impairment no longer exists for a particular grouping, a reduction of the allowance may
be recorded as an increase to income. Changes in valuation allowances are reported with non-interest income on the
statement of income. The fair values of servicing rights are subject to significant fluctuations as a result of changes
in estimated and actual prepayment speeds and default rates and losses.
The Company's investment in the loan is allocated between the retained portion of the loan and the sold portion of
the loan based on their fair values on the date the loan is sold. The gain on the sold portion of the loan is recognized
as income at the time of sale.
The carrying value of the retained portion of the loan is discounted based on the estimated value of a comparable
non-guaranteed loan.
F-15
PLUMAS BANCORP AND SUBSIDIARY
NOTES TO CONSOLIDATED FINANCIAL STATEMENTS
(Continued)
2. SUMMARY OF SIGNIFICANT ACCOUNTING POLICIES (Continued)
Loans
Loans that management has the intent and ability to hold for foreseeable future or until maturity or payoff are
reported at the principal balance outstanding, net of purchase premiums or discounts, deferred loan fees and costs,
and an allowance for loan losses. Loans, if any, that are transferred from loans held for sale are carried at the lower
of principal balance or market value at the date of transfer, adjusted for accretion of discounts. Interest is accrued
daily based upon outstanding loan balances. However, when, in the opinion of management, loans are considered to
be impaired and the future collectability of interest and principal is in serious doubt, loans are placed on nonaccrual
status and the accrual of interest income is suspended. Any interest accrued but unpaid is charged against income.
Payments received are applied to reduce principal to the extent necessary to ensure collection. A loan is moved to
non-accrual status in accordance with the Company’s policy, typically after 90 days of non-payment unless well
secured and in the process of collection. Past due status is based on the contractual terms of the loan. Subsequent
payments on these loans, or payments received on nonaccrual loans for which the ultimate collectability of principal
is not in doubt, are applied first to earned but unpaid interest and then to principal. Loans are returned to accrual
status when all the principal and interest amounts contractually due are brought current and future payments are
reasonably assured.
Loan origination fees, commitment fees, direct loan origination costs and purchased premiums and discounts on
loans are deferred and recognized as an adjustment of yield, to be amortized to interest income over the contractual
term of the loan. The unamortized balance of deferred fees and costs is reported as a component of net loans.
The Company may acquire loans through a business combination or a purchase for which differences may exist
between the contractual cash flows and the cash flows expected to be collected due, at least in part, to credit quality.
When the Company acquires such loans, the yield that may be accreted (accretable yield) is limited to the excess of
the Company's estimate of undiscounted cash flows expected to be collected over the Company's initial investment
in the loan. The excess of contractual cash flows over cash flows expected to be collected may not be recognized as
an adjustment to yield, loss, or a valuation allowance.
Subsequent increases in cash flows expected to be collected generally should be recognized prospectively through
adjustment of the loan's yield over its remaining life. Decreases in cash flows expected to be collected should be
recognized as an impairment.
The Company may not "carry over" or create a valuation allowance in the initial accounting for loans acquired under
these circumstances. At December 31, 2018 and 2017, there were no such loans being accounted for under this
policy.
F-16
PLUMAS BANCORP AND SUBSIDIARY
NOTES TO CONSOLIDATED FINANCIAL STATEMENTS
(Continued)
2. SUMMARY OF SIGNIFICANT ACCOUNTING POLICIES (Continued)
Allowance for Loan Losses
The allowance for loan losses is an estimate of probable incurred credit losses inherent in the Company's loan
portfolio that have been incurred as of the balance-sheet date. The allowance is established through a provision for
loan losses which is charged to expense. Additions to the allowance are expected to maintain the adequacy of the
total allowance after credit losses and loan growth. Loan losses are charged against the allowance when management
believes the uncollectibility of a loan balance is confirmed. Subsequent recoveries, if any, are credited to the
allowance. The overall allowance consists of two primary components, specific reserves related to impaired loans
and general reserves for inherent losses related to loans that are not impaired but collectively evaluated for
impairment.
A loan is considered impaired when, based on current information and events, it is probable that the Company will
be unable to collect all amounts due, including principal and interest, according to the contractual terms of the
original agreement. Loans determined to be impaired are individually evaluated for impairment. When a loan is
impaired, the Company measures impairment based on the present value of expected future cash flows discounted
at the loan's effective interest rate, except that as a practical expedient, it may measure impairment based on a loan's
observable market price, or the fair value of the collateral if the loan is collateral dependent. A loan is collateral
dependent if the repayment of the loan is expected to be provided solely by the underlying collateral.
A restructuring of a debt constitutes a troubled debt restructuring (TDR) if the Company, for economic or legal
reasons related to the debtor's financial difficulties, grants a concession to the debtor that it would not otherwise
consider. Restructured workout loans typically present an elevated level of credit risk as the borrowers are not able
to perform according to the original contractual terms. Loans that are reported as TDRs are considered impaired and
measured for impairment as described above.
The determination of the general reserve for loans that are not impaired is based on estimates made by management,
to include, but not limited to, consideration of historical losses by portfolio segment from January 1, 2008 (the
beginning of the latest business cycle as determined by management) to the most current balance sheet date, internal
asset classifications, and qualitative factors to include economic trends in the Company’s service areas, industry
experience and trends, geographic concentrations, estimated collateral values, the Company’s underwriting policies,
the character of the loan portfolio, and probable incurred losses inherent in the portfolio taken as a whole.
The Company maintains a separate allowance for each portfolio segment (loan type). These portfolio segments
include commercial, agricultural, real estate construction (including land and development loans), commercial real
estate mortgage, residential mortgage, home equity loans, automobile loans and other loans primarily consisting of
consumer installment loans. The allowance for loan losses attributable to each portfolio segment, which includes
both impaired loans and loans that are not impaired, is combined to determine the Company’s overall allowance,
and is included as a component of loans on the consolidated balance sheet.
The Company assigns a risk rating to all loans and periodically, but not less than annually, performs detailed reviews
of all criticized and classified loans over $100,000 to identify credit risks and to assess the overall collectability of
the portfolio. These risk ratings are also subject to examination by independent specialists engaged by the Company
and the Company’s regulators. During these internal reviews, management monitors and analyzes the financial
condition of borrowers and guarantors, trends in the industries in which borrowers operate and the fair values of
collateral securing these loans. These credit quality indicators are used to assign a risk rating to each individual loan.
F-17
PLUMAS BANCORP AND SUBSIDIARY
NOTES TO CONSOLIDATED FINANCIAL STATEMENTS
(Continued)
2. SUMMARY OF SIGNIFICANT ACCOUNTING POLICIES (Continued)
Allowance for Loan Losses (continued)
The risk ratings can be grouped into three major categories, defined as follows:
Special Mention – Loans classified as special mention have a potential weakness that deserves
management’s close attention. If left uncorrected, these potential weaknesses my result in deterioration of
the repayment prospects for the loan or of the institution’s credit position at some future date.
Substandard – A substandard loan is not adequately protected by the current sound worth and paying
capacity of the borrower or the value of the collateral pledged, if any. Loans classified as substandard have
a well-defined weakness or weaknesses that jeopardize the liquidation of the debt. Well defined weaknesses
include a project's lack of marketability, inadequate cash flow or collateral support, failure to complete
construction on time or the project's failure to fulfill economic expectations. They are characterized by the
distinct possibility that the Company will sustain some loss if the deficiencies are not corrected.
Doubtful – Loans classified doubtful have all the weaknesses inherent in those classified as substandard
with the added characteristic that the weaknesses make collection or liquidation in full, on the basis of
currently known facts, conditions and values, highly questionable and improbable.
Loans not meeting the criteria above that are analyzed individually as part of the above described process are
considered to be pass-rated loans.
The general reserve component of the allowance for loan losses associated with loans collectively evaluated for
impairment also consists of reserve factors that are based on management's assessment of the following for each
portfolio segment: (1) historical losses and (2) other qualitative factors, including inherent credit risk. These reserve
factors are inherently subjective and are driven by the repayment risk associated with each portfolio segment
described below.
Commercial – Commercial loans are generally underwritten to existing cash flows of operating businesses.
Debt coverage is provided by business cash flows and economic trends influenced by unemployment rates
and other key economic indicators are closely correlated to the credit quality of these loans.
Agricultural – Loans secured by crop production and livestock are especially vulnerable to two risk factors
that are largely outside the control of Company and borrowers: commodity prices and weather conditions.
Real estate – Residential and Home Equity Lines of Credit – The degree of risk in residential real estate
lending depends primarily on the loan amount in relation to collateral value, the interest rate and the
borrower's ability to repay in an orderly fashion. These loans generally possess a lower inherent risk of loss
than other real estate portfolio segments. Economic trends determined by unemployment rates and other
key economic indicators are closely correlated to the credit quality of these loans. Weak economic trends
indicate that the borrowers' capacity to repay their obligations may be deteriorating.
F-18
PLUMAS BANCORP AND SUBSIDIARY
NOTES TO CONSOLIDATED FINANCIAL STATEMENTS
(Continued)
2. SUMMARY OF SIGNIFICANT ACCOUNTING POLICIES (Continued)
Allowance for Loan Losses (continued)
Real estate – Commercial – Commercial real estate mortgage loans generally possess a higher inherent
risk of loss than other real estate portfolio segments, except land and construction loans. Adverse economic
developments or an overbuilt market impact commercial real estate projects and may result in troubled
loans. Trends in vacancy rates of commercial properties impact the credit quality of these loans. High
vacancy rates reduce operating revenues and the ability for properties to produce sufficient cash flow to
service debt obligations.
Real estate – Construction and Land Development – Construction and land development loans generally
possess a higher inherent risk of loss than other real estate portfolio segments. A major risk arises from the
necessity to complete projects within specified cost and time lines. Trends in the construction industry
significantly impact the credit quality of these loans, as demand drives construction activity. In addition,
trends in real estate values significantly impact the credit quality of these loans, as property values
determine the economic viability of construction projects.
Automobile – An automobile loan portfolio is usually comprised of a large number of smaller loans
scheduled to be amortized over a specific period. Most automobile loans are made directly for consumer
purchases, but business vehicles may also be included. Economic trends determined by unemployment rates
and other key economic indicators are closely correlated to the credit quality of these loans. Weak economic
trends indicate that the borrowers' capacity to repay their obligations may be deteriorating.
Other – Other loans primarily consist of consumer loans and are similar in nature to automobile loans.
Although management believes the allowance to be adequate, ultimate losses may vary from its estimates. At least
quarterly, the Board of Directors and management review the adequacy of the allowance, including consideration of
the relative risks in the portfolio, current economic conditions and other factors. If the Board of Directors and
management determine that changes are warranted based on those reviews, the allowance is adjusted. In addition,
the Company's primary regulators, the FDIC and the California Department of Business Oversight (the “DBO”), as
an integral part of their examination process, review the adequacy of the allowance. These regulatory agencies may
require additions to the allowance based on their judgment about information available at the time of their
examinations.
The Company also maintains a separate allowance for off-balance-sheet commitments. Management estimates
anticipated losses using historical data and utilization assumptions. The allowance for these commitments totaled
$250,000 and $200,000 at December 31, 2018 and 2017, respectively and is included in accrued interest payable
and other liabilities in the consolidated balance sheet.
F-19
PLUMAS BANCORP AND SUBSIDIARY
NOTES TO CONSOLIDATED FINANCIAL STATEMENTS
(Continued)
2. SUMMARY OF SIGNIFICANT ACCOUNTING POLICIES (Continued)
Other Real Estate
Other real estate owned relates to real estate acquired in full or partial settlement of loan obligations, which was
$1,170,000 ($2,451,000 less a valuation allowance of $1,281,000) at December 31, 2018 and $1,344,000
($2,642,000 less a valuation allowance of $1,298,000) at December 31, 2017. Of these amounts $368,000 at
December 31, 2018 and $110,000 at December 31, 2017 represent foreclosed residential real estate property. There
was one consumer mortgage loans with a balance of $90,000 secured by a residential real estate property for which
formal foreclosure proceedings were in process at December 31, 2018. No consumer mortgage loans secured by
residential real estate properties were in the process of foreclosure at December 31, 2017. Proceeds from sales of
other real estate owned totaled $722,000, $689,000 and $2,245,000 for the years ended December 31, 2018, 2017
and 2016, respectively. For the years ended December 31, 2018, 2017 and 2016 the Company recorded gains on sale
of other real estate owned of $47,000, $130,000 and $60,000, respectively. Other real estate owned is initially
recorded at fair value less cost to sell when acquired, any excess of the Bank's recorded investment in the loan
balance and accrued interest income over the estimated fair value of the property less costs to sell is charged against
the allowance for loan losses. A valuation allowance for losses on other real estate is maintained to provide for
temporary declines in value. The allowance is established through a provision for losses on other real estate which
is included in other expenses. Subsequent gains or losses on sales or write-downs resulting from permanent
impairment are also recorded in other expenses as incurred.
The following table provides a summary of the change in the OREO balance for the years ended December 31, 2018
and 2017:
Year Ended December 31,
2018 2017
Beginning balance $ 1,344,000 $ 735,000
Additions 656,000 1,292,000
Dispositions (675,000 ) (559,000 )
Write-downs (155,000 ) (124,000 )
Ending balance $ 1,170,000 $ 1,344,000
Intangible Assets
Intangible assets consist of core deposit intangibles related to branch acquisitions and are amortized on an accelerated
basis method over ten years. The Company evaluates the recoverability and remaining useful life annually to
determine whether events or circumstances warrant a revision to the intangible asset or the remaining period of
amortization. There were no such events or circumstances during the periods presented.
Aggregate amortization expense was $27,000, $6,000, and $6,000 for 2018, 2017 and 2016.
The gross carrying amount of intangible assets and accumulated amortization was:
2018 2017
Gross Carrying Accumulated Gross Carrying Accumulated
Amount Amortization Amount Amortization
Core deposit intangibles $ 1,226,000 $ 42,000 $ 96,000 $ 15,000
The increase in intangible assets in 2018 relates to the purchase of the Bank’s Carson City branch in October 2018.
Estimated amortization expense for each of the next five years is $263,000, $198,000, $161,000, $132,000 and
$108,000.
F-20
PLUMAS BANCORP AND SUBSIDIARY
NOTES TO CONSOLIDATED FINANCIAL STATEMENTS
(Continued)
2. SUMMARY OF SIGNIFICANT ACCOUNTING POLICIES (Continued)
Premises and Equipment
Land is carried at cost. Premises and equipment are stated at cost less accumulated depreciation. Depreciation is
determined using the straight-line method over the estimated useful lives of the related assets. The useful lives of
premises are estimated to be twenty to thirty years. The useful lives of furniture, fixtures and equipment are estimated
to be two to ten years. Leasehold improvements are amortized over the life of the asset or the life of the related lease,
whichever is shorter. When assets are sold or otherwise disposed of, the cost and related accumulated depreciation
or amortization are removed from the accounts, and any resulting gain or loss is recognized in income for the period.
The cost of maintenance and repairs is charged to expense as incurred. The Company evaluates premises and
equipment for financial impairment as events or changes in circumstances indicate that the carrying amount of such
assets may not be fully recoverable.
Bank Owned Life Insurance
The Company has purchased life insurance policies on certain key executives. Bank owned life insurance is recorded
at the amount that can be realized under the insurance contract at the balance sheet date, which is the cash surrender
value adjusted for other charges or other amounts due that are probable at settlement.
Revenue from Contracts with Customers
The Company records revenue from contracts with customers in accordance with Accounting Standards Codification
Topic 606, “Revenue from Contracts with Customers” (“Topic 606”). Under Topic 606, the Company must identify
the contract with a customer, identify the performance obligations in the contract, determine the transaction price,
allocate the transaction price to the performance obligations in the contract, and recognize revenue when (or as) the
Company satisfies a performance obligation. Significant revenue has not been recognized in the current reporting
period that results from performance obligations satisfied in previous periods.
Most of our revenue-generating transactions are not subject to ASC 606, including revenue generated from financial
instruments, such as our loans and investment securities. The Company has evaluated the nature of its contracts
with customers and determined that further disaggregation of revenue from contracts with customers into more
granular categories beyond what is presented in the Condensed Consolidated Statements of Income was not
necessary. The Company generally fully satisfies its performance obligations on its contracts with customers as
services are rendered and the transaction prices are typically fixed; charged either on a periodic basis or based on
activity. Because performance obligations are satisfied as services are rendered and the transaction prices are fixed,
there is little judgment involved in applying Topic 606 that significantly affects the determination of the amount and
timing of revenue from contracts with customers.
Income Taxes
The Company files its income taxes on a consolidated basis with its subsidiary. Income tax expense is the total of
current year income tax due or refundable and the change in deferred tax assets and liabilities.
Deferred tax assets and liabilities are recognized for the tax consequences of temporary differences between the
reported amount of assets and liabilities and their tax bases. Deferred tax assets and liabilities are adjusted for the
effects of changes in tax laws and rates on the date of enactment. A valuation allowance is recognized if, based on
the weight of available evidence management believes it is more likely than not that some portion or all of the
deferred tax assets will not be realized. On the consolidated balance sheet, net deferred tax assets are included in
accrued interest receivable and other assets.
F-21
PLUMAS BANCORP AND SUBSIDIARY
NOTES TO CONSOLIDATED FINANCIAL STATEMENTS
(Continued)
2. SUMMARY OF SIGNIFICANT ACCOUNTING POLICIES (Continued)
Accounting for Uncertainty in Income Taxes
When tax returns are filed, it is highly certain that some positions taken would be sustained upon examination by
the taxing authorities, while others are subject to uncertainty about the merits of the position taken or the amount
of the position that would be ultimately sustained. The benefit of a tax position is recognized in the financial
statements in the period during which, based on all available evidence, management believes it is more likely than
not that the position will be sustained upon examination, including the resolution of appeals or litigation processes,
if any. Tax positions taken are not offset or aggregated with other positions. Tax positions that meet the more-likely-
than-not recognition threshold are measured as the largest amount of tax benefit that is more than 50 percent likely
of being realized upon settlement with the applicable taxing authority. The portion of the benefits associated with
tax positions taken that exceeds the amount measured as described above is reflected as a liability for unrecognized
tax benefits in the accompanying balance sheet along with any associated interest and penalties that would be payable
to the taxing authorities upon examination.
Interest expense and penalties associated with unrecognized tax benefits, if any, are classified as income tax expense
in the consolidated income statement. There have been no significant changes to unrecognized tax benefits or
accrued interest and penalties for the years ended December 31, 2018 and 2017.
Earnings Per Share
Basic earnings per share (EPS), which excludes dilution, is computed by dividing income available to common
stockholders (net income plus discount on redemption of preferred stock less preferred dividends and accretion) by
the weighted-average number of common shares outstanding for the period. Diluted EPS reflects the potential
dilution that could occur if securities or other contracts to issue common stock, such as stock options, result in the
issuance of common stock which shares in the earnings of the Company. The treasury stock method has been applied
to determine the dilutive effect of stock options in computing diluted EPS.
Comprehensive Income
Comprehensive income consists of net income and other comprehensive income. Other comprehensive income
includes unrealized gains and losses on securities available for sale which are also recognized as separate
components of equity. The amount reclassified out of other accumulated comprehensive income relating to realized
losses on securities available for sale was $8,000, $158,000 and $32,000 for 2018, 2017 and 2016, with the related
tax effect of $2,000, $65,000 and $13,000, respectively.
In February 2018, the FASB issued ASU 2018-02, Reclassification of Certain Tax Effects from Accumulated Other
Comprehensive Income (“AOCI”). The Company early adopted this new standard in the current year. ASU 2018-
02 allows entities to elect to reclassify stranded tax effects on items within AOCI, resulting from the new tax bill
signed into law on December 22, 2017, to retained earnings. The Company elected to early adopt this new standard
in 2017 and recorded a reclassification from AOCI to retained earnings in the amount of $94,000
Dividend Restrictions
Banking regulations require maintaining certain capital levels and may limit the dividend paid by the bank to the
holding company or by the holding company to shareholders.
Fair Value of Financial Instruments
Fair values of financial instruments are estimated using relevant market information and other assumptions, as more
fully disclosed in a separate note. Fair value estimates involve uncertainties and matters of significant judgment
regarding interest rates, credit risk, prepayments, and other factors, especially in the absence of broad markets for
particular items. Changes in assumptions or in market conditions could significantly affect these estimates.
F-22
PLUMAS BANCORP AND SUBSIDIARY
NOTES TO CONSOLIDATED FINANCIAL STATEMENTS
(Continued)
2. SUMMARY OF SIGNIFICANT ACCOUNTING POLICIES (Continued)
Stock-Based Compensation
Compensation expense related to the Company’s Stock Option Plans, net of related tax benefit, recorded in 2018,
2017 and 2016 totaled $185,000, $141,000 and $103,000 or $0.04, $0.03 and $0.02 per diluted share, respectively.
Compensation expense is recognized over the vesting period on a straight-line accounting basis.
The Company determines the fair value of options on the date of grant using a Black-Scholes-Merton option pricing
model that uses assumptions based on expected option life, expected stock volatility and the risk-free interest rate.
The expected volatility assumptions used by the Company are based on the historical volatility of the Company’s
common stock over the most recent period commensurate with the estimated expected life of the Company’s stock
options. The Company bases its expected life assumption on its historical experience and on the terms and conditions
of the stock options it grants to employees. The risk-free rate is based on the U.S. Treasury yield curve for the
periods within the contractual life of the options in effect at the time of the grant.
During 2018 and 2016 the Company granted options to purchase 76,000 and 108,000 shares of common stock,
respectively. The fair value of each option was estimated on the date of grant using the following assumptions.
2018 2016
Expected life of stock options (in years) 5.1 5.1
Risk free interest rate 2.38% 1.52%
Volatility 30.4% 53.6%
Dividend yields 1.39% 2.00%
Weighted-average fair value of options granted during the year $6.54 $3.55
No options were granted during the year ended December 31, 2017.
Recently Adopted Accounting Pronouncements
In February 2018, the FASB issued ASU No. 2018-02, Reclassification of Certain Tax Effects from Accumulated
Other Comprehensive Income (“AOCI”). ASU No. 2018-02 allows entities to elect to reclassify stranded tax effects
on items within AOCI, resulting from the new tax bill signed into law on December 22, 2017, to retained earnings.
The Company elected to early adopt this new standard in 2017 and recorded a reclassification from AOCI to retained
earnings in the amount of $94,000.
In May 2014, the FASB issued ASU No. 2014-09 Revenue from Contracts with Customers (“ASU 2014-09”), which
requires an entity to recognize the amount of revenue to which it expects to be entitled for the transfer of promised
goods or services to customers. The ASU replaces most existing revenue recognition guidance in GAAP. The new
standard was effective for the Company on January 1, 2018. Adoption of ASU 2014-09 did not have a material
impact on the Company’s consolidated financial statements and related disclosures as the Company’s primary
sources of revenues are derived from interest and dividends earned on loans, investment securities, and other
financial instruments that are not within the scope of ASU 2014-09. The Company’s revenue recognition pattern for
revenue streams within the scope of ASU 2014-09, including but not limited to service charges on deposit accounts
and gains/losses on the sale of loans, did not change significantly from current practice. The standard permits the
use of either the full retrospective or modified retrospective transition method. The Company elected to use the
modified retrospective transition method which requires application of ASU 2014-09 to uncompleted contracts at
the date of adoption however, periods prior to the date of adoption will not be retrospectively revised as the impact
of the ASU on uncompleted contracts at the date of adoption was not material.
F-23
PLUMAS BANCORP AND SUBSIDIARY
NOTES TO CONSOLIDATED FINANCIAL STATEMENTS
(Continued)
2. SUMMARY OF SIGNIFICANT ACCOUNTING POLICIES (Continued)
Recently Adopted Accounting Pronouncements (continued)
On January 5, 2016, the FASB issued ASU No. 2016-01, Financial Instruments–Overall: Recognition and
Measurement of Financial Assets and Financial Liabilities. Changes made to the current measurement model
primarily affect the accounting for equity securities with readily determinable fair values, where changes in fair
value will impact earnings instead of other comprehensive income. The accounting for other financial instruments,
such as loans, investments in debt securities, and financial liabilities is largely unchanged. The Update also changes
the presentation and disclosure requirements for financial instruments including a requirement that public business
entities use exit price when measuring the fair value of financial instruments measured at amortized cost for
disclosure purposes. This Update is generally effective for public business entities in fiscal years beginning after
December 15, 2017, including interim periods within those fiscal years. The Company adopted ASU No. 2016-01
on January 1, 2018 and recorded a $209,000 gain related to adjusting the carrying value of equity securities without
a readily determinable fair market to $662,000 in accordance with this standard. Additionally, we refined the
calculation used to determine the disclosed fair value of our loans held for investment as part of adopting this
standard. The refined calculation did not have a significant impact on our fair value disclosures.
Pending Accounting Pronouncements
On February 25, 2016, the FASB issued ASU 2016-02, Leases. The most significant change for lessees is the
requirement under the new guidance to recognize right-of-use assets and lease liabilities for all leases not considered
short-term leases, which is generally defined as a lease term of less than 12 months. This change will result in
lessees recognizing right-of-use assets and lease liabilities for most leases currently accounted for as operating leases
under current lease accounting guidance. ASU 2016-02 is effective for interim and annual periods beginning after
December 15, 2018. The Company has several lease agreements, including two branch locations, which are
currently considered operating leases, and therefore, not recognized on the Company’s consolidated statements of
condition. The Company expects the new guidance will require some of these lease agreements to now be recognized
on the consolidated statements of condition as a right-of-use asset and a corresponding lease liability. The Company
has performed a preliminary evaluation of the provisions of ASU No. 2016-02. Based on this evaluation, the
Company has determined that under the provisions of ASU No. 2016-02 we will recognize right-of-use assets and
lease liabilities of approximately $565,000 on January 1, 2019.
In June 2016, the FASB issued ASU No. 2016-13, Measurement of Credit Losses on Financial Instruments. ASU
No. 2016-13 significantly changes how entities will measure credit losses for most financial assets and certain other
instruments that aren’t measured at fair value through net income. The standard will replace today’s “incurred loss”
approach with an “expected loss” model. The new model, referred to as the current expected credit loss (“CECL”)
model, will apply to: (1) financial assets subject to credit losses and measured at amortized cost, and (2) certain off-
balance sheet credit exposures. This includes, but is not limited to, loans, leases, held-to-maturity securities, loan
commitments, and financial guarantees. The CECL model does not apply to available-for-sale (“AFS”) debt
securities. For AFS debt securities with unrealized losses, entities will measure credit losses in a manner similar to
what they do today, except that the losses will be recognized as allowances rather than reductions in the amortized
cost of the securities. The ASU also simplifies the accounting model for purchased credit-impaired debt securities
and loans. ASU No. 2016-13 also expands the disclosure requirements regarding an entity’s assumptions, models,
and methods for estimating the allowance for loan and lease losses. ASU No. 2016-13 is effective for interim and
annual reporting periods beginning after December 15, 2019; early adoption is permitted for interim and annual
reporting periods beginning after December 15, 2018. Entities will apply the standard’s provisions as a cumulative-
effect adjustment to retained earnings as of the beginning of the first reporting period in which the guidance is
effective (i.e., modified retrospective approach). The Company has begun its implementation efforts by establishing
an implementation team chaired by the Company’s Chief Lending Officer and composed of members of the
Company’s credit administration and accounting departments. We have purchased software to support the CECL
calculation of the allowance for loan losses under ASU No 2016-13 and have engaged the software vendor to assist
in the transition to the CECL model. We expect to produce an initial CECL allowance calculation prior to June 30,
2019. The Company’s preliminary evaluation indicates the provisions of ASU No. 2016-13 are expected to impact
the Company’s Consolidated Financial Statements, in particular the level of the reserve for credit losses. However,
the Company continues to evaluate the extent of the potential impact.
F-24
PLUMAS BANCORP AND SUBSIDIARY
NOTES TO CONSOLIDATED FINANCIAL STATEMENTS
(Continued)
2. SUMMARY OF SIGNIFICANT ACCOUNTING POLICIES (Continued)
Pending Accounting Pronouncements (continued)
On March 30, 2017, the FASB issued ASU 2017-08, Receivables – Non-Refundable Fees and Other Costs: Premium
Amortization on Purchased Callable Debt Securities. This ASU amends the amortization period for certain
purchased callable debt securities held at a premium, shortening such period to the earliest call date. The
amendments do not require an accounting change for securities held at a discount; the discount continues to be
amortized to maturity. ASU 2017-08 is effective for public business entities for fiscal years, and interim periods
within those fiscal years, beginning after December 15, 2018. Entities will apply the standard’s provisions as a
cumulative-effect adjustment to retained earnings as of the beginning of the first reporting period in which the
guidance is effective (i.e., modified retrospective approach). The Company has performed a preliminary evaluation
of the provisions of ASU No. 2017-08. Based on this evaluation, the Company has determined that ASU No. 2017-
08 is not expected to have a material impact on the Company’s Consolidated Financial Statements.
In July 2018, the FASB issued ASU No. 2018-11, Leases - Targeted Improvements. ASU No. 2018-11 provides
entities with relief from the costs of implementing certain aspects of the new leasing standard, ASU No. 2016-02.
Specifically, under the amendments in ASU 2018-11: (1) entities may elect not to recast the comparative periods
presented when transitioning to the new leasing standard, and (2) lessors may elect not to separate lease and non-
lease components when certain conditions are met. The amendments have the same effective date as ASU 2016-02
(January 1, 2019 for the Company). The Company expects to elect both transition options. ASU 2018-11 is not
expected to have a material impact on the Company’s Consolidated Financial Statements.
In August 2018, the FASB issued ASU No. 2018-13, Fair Value Measurement, Disclosure Framework – Changes
to the Disclosure Requirements for Fair Value Measurement. The amendments in this update modify the disclosure
requirements for fair value measurements by removing, modifying, or adding certain disclosures. The update is
effective for interim and annual periods in fiscal years beginning after December 15, 2019, with early adoption
permitted. Entities are also allowed to elect early adoption of the eliminated or modified disclosure requirements
and delay adoption of the new disclosure requirements until their effective date. As ASU No. 2018-13 only revises
disclosure requirements, it will not have a material impact on the Company’s Consolidated Financial Statements.
F-25
PLUMAS BANCORP AND SUBSIDIARY
NOTES TO CONSOLIDATED FINANCIAL STATEMENTS
(Continued)
3. FAIR VALUE MEASUREMENTS
The Company measures fair value under the fair value hierarchy described below.
Level 1: Quoted prices for identical instruments traded in active exchange markets.
Level 2: Quoted prices (unadjusted) for similar instruments in active markets, quoted prices for identical or
similar instruments in markets that are not active and model-based valuation techniques for which all significant
assumptions are observable or can be corroborated by observable market data.
Level 3: Model based techniques that use one significant assumption not observable in the market. These
unobservable assumptions reflect the Company’s estimates of assumptions that market participants would use
on pricing the asset or liability. Valuation techniques include management judgment and estimation which may
be significant.
In certain cases, the inputs used to measure fair value may fall into different levels of the fair value hierarchy. In
such cases, the level in the fair value hierarchy within which the fair value measurement in its entirety falls has been
determined based on the lowest level input that is significant to the fair value measurement in its entirety. The
Company’s assessment of the significance of a particular input to the fair value measurement in its entirety requires
judgment and considers factors specific to the asset or liability.
Management monitors the availability of observable market data to assess the appropriate classification of financial
instruments within the fair value hierarchy. Changes in economic conditions or model-based valuation techniques
may require the transfer of financial instruments from one fair value level to another. In such instances, the transfer
is reported at the beginning of the reporting period.
Management evaluates the significance of transfers between levels based upon the nature of the financial instrument
and size of the transfer relative to total assets, total liabilities or total earnings.
The methods of determining the fair value of assets and liabilities presented in this note as of December 31, 2018
are consistent with the methods used as of December 31, 2017 except for the valuation of loans held for investment
at December 31, 2018. We refined the calculation used to determine the disclosed fair value of our loans held for
investment to estimate the fair value of our loan portfolio based on an exit price concept as part of adopting ASU
2016-01.
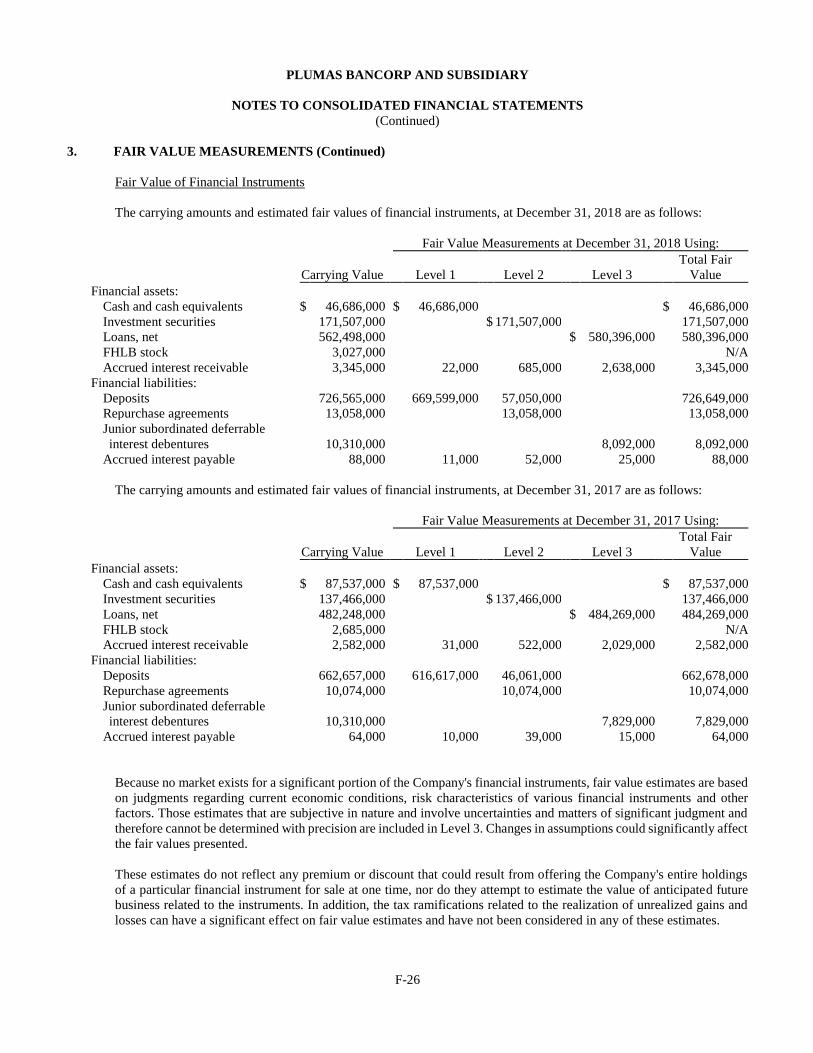
F-26
PLUMAS BANCORP AND SUBSIDIARY
NOTES TO CONSOLIDATED FINANCIAL STATEMENTS
(Continued)
3. FAIR VALUE MEASUREMENTS (Continued)
Fair Value of Financial Instruments
The carrying amounts and estimated fair values of financial instruments, at December 31, 2018 are as follows:
Fair Value Measurements at December 31, 2018 Using:
Carrying Value Level 1 Level 2 Level 3
Total Fair
Value
Financial assets:
Cash and cash equivalents $ 46,686,000 $ 46,686,000 $ 46,686,000
Investment securities 171,507,000 $ 171,507,000 171,507,000
Loans, net 562,498,000 $ 580,396,000 580,396,000
FHLB stock 3,027,000 N/A
Accrued interest receivable 3,345,000 22,000 685,000 2,638,000 3,345,000
Financial liabilities:
Deposits 726,565,000 669,599,000 57,050,000 726,649,000
Repurchase agreements 13,058,000 13,058,000 13,058,000
Junior subordinated deferrable
interest debentures 10,310,000 8,092,000 8,092,000
Accrued interest payable 88,000 11,000 52,000 25,000 88,000
The carrying amounts and estimated fair values of financial instruments, at December 31, 2017 are as follows:
Fair Value Measurements at December 31, 2017 Using:
Carrying Value Level 1 Level 2 Level 3
Total Fair
Value
Financial assets:
Cash and cash equivalents $ 87,537,000 $ 87,537,000 $ 87,537,000
Investment securities 137,466,000 $ 137,466,000 137,466,000
Loans, net 482,248,000 $ 484,269,000 484,269,000
FHLB stock 2,685,000 N/A
Accrued interest receivable 2,582,000 31,000 522,000 2,029,000 2,582,000
Financial liabilities:
Deposits 662,657,000 616,617,000 46,061,000 662,678,000
Repurchase agreements 10,074,000 10,074,000 10,074,000
Junior subordinated deferrable
interest debentures 10,310,000 7,829,000 7,829,000
Accrued interest payable 64,000 10,000 39,000 15,000 64,000
Because no market exists for a significant portion of the Company's financial instruments, fair value estimates are based
on judgments regarding current economic conditions, risk characteristics of various financial instruments and other
factors. Those estimates that are subjective in nature and involve uncertainties and matters of significant judgment and
therefore cannot be determined with precision are included in Level 3. Changes in assumptions could significantly affect
the fair values presented.
These estimates do not reflect any premium or discount that could result from offering the Company's entire holdings
of a particular financial instrument for sale at one time, nor do they attempt to estimate the value of anticipated future
business related to the instruments. In addition, the tax ramifications related to the realization of unrealized gains and
losses can have a significant effect on fair value estimates and have not been considered in any of these estimates.
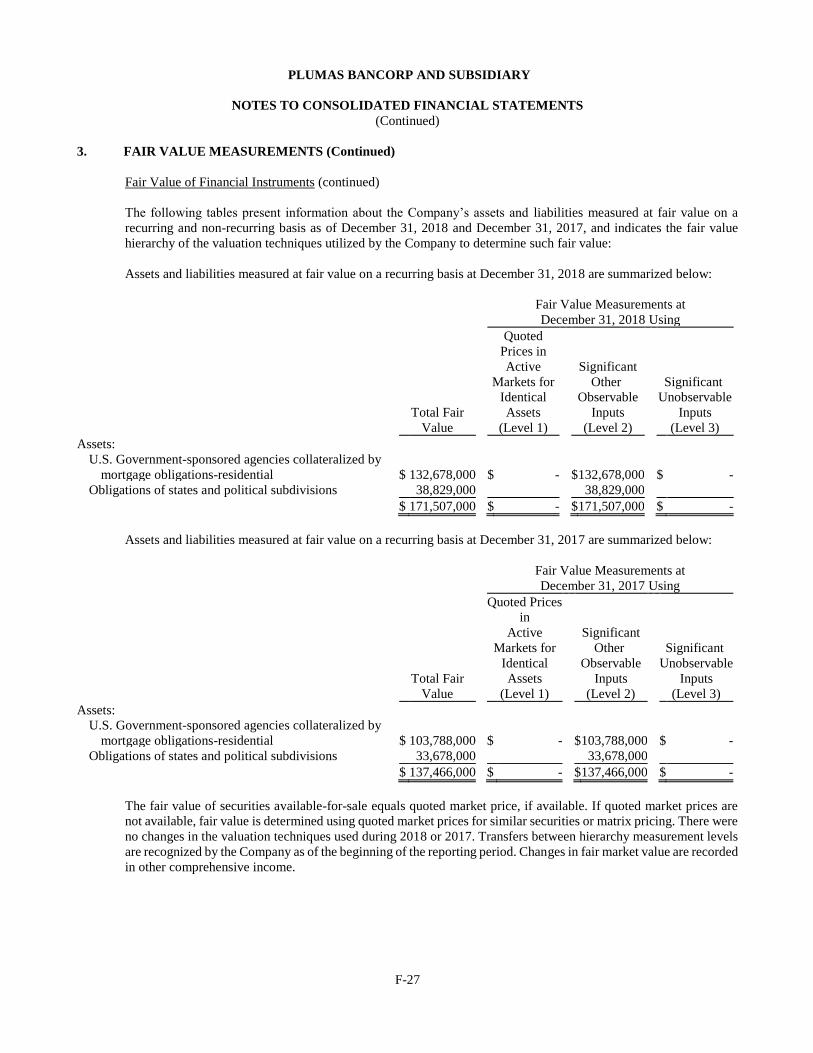
F-27
PLUMAS BANCORP AND SUBSIDIARY
NOTES TO CONSOLIDATED FINANCIAL STATEMENTS
(Continued)
3. FAIR VALUE MEASUREMENTS (Continued)
Fair Value of Financial Instruments (continued)
The following tables present information about the Company’s assets and liabilities measured at fair value on a
recurring and non-recurring basis as of December 31, 2018 and December 31, 2017, and indicates the fair value
hierarchy of the valuation techniques utilized by the Company to determine such fair value:
Assets and liabilities measured at fair value on a recurring basis at December 31, 2018 are summarized below:
Fair Value Measurements at
December 31, 2018 Using
Total Fair
Value
Quoted
Prices in
Active
Markets for
Identical
Assets
(Level 1)
Significant
Other
Observable
Inputs
(Level 2)
Significant
Unobservable
Inputs
(Level 3)
Assets:
U.S. Government-sponsored agencies collateralized by
mortgage obligations-residential $ 132,678,000 $ - $ 132,678,000 $ -
Obligations of states and political subdivisions 38,829,000 38,829,000
$ 171,507,000 $ - $ 171,507,000 $ -
Assets and liabilities measured at fair value on a recurring basis at December 31, 2017 are summarized below:
Fair Value Measurements at
December 31, 2017 Using
Total Fair
Value
Quoted Prices
in
Active
Markets for
Identical
Assets
(Level 1)
Significant
Other
Observable
Inputs
(Level 2)
Significant
Unobservable
Inputs
(Level 3)
Assets:
U.S. Government-sponsored agencies collateralized by
mortgage obligations-residential $ 103,788,000 $ - $ 103,788,000 $ -
Obligations of states and political subdivisions 33,678,000 33,678,000
$ 137,466,000 $ - $ 137,466,000 $ -
The fair value of securities available-for-sale equals quoted market price, if available. If quoted market prices are
not available, fair value is determined using quoted market prices for similar securities or matrix pricing. There were
no changes in the valuation techniques used during 2018 or 2017. Transfers between hierarchy measurement levels
are recognized by the Company as of the beginning of the reporting period. Changes in fair market value are recorded
in other comprehensive income.
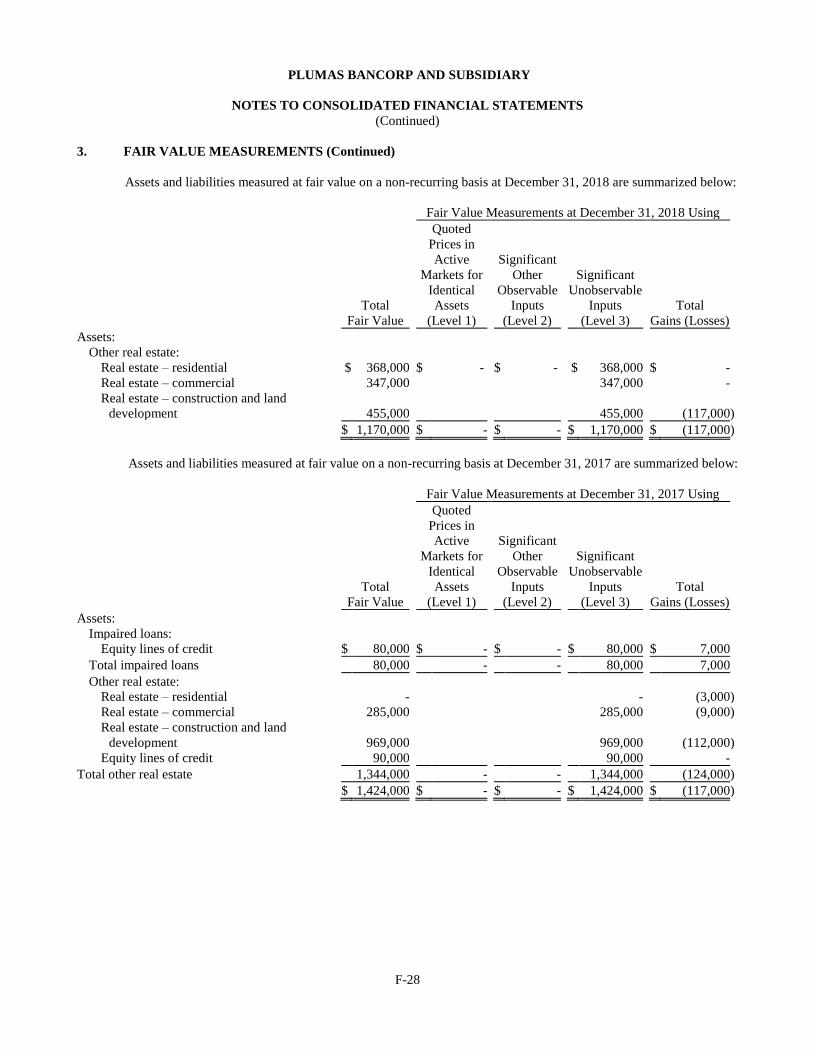
F-28
PLUMAS BANCORP AND SUBSIDIARY
NOTES TO CONSOLIDATED FINANCIAL STATEMENTS
(Continued)
3. FAIR VALUE MEASUREMENTS (Continued)
Assets and liabilities measured at fair value on a non-recurring basis at December 31, 2018 are summarized below:
Fair Value Measurements at December 31, 2018 Using
Total
Fair Value
Quoted
Prices in
Active
Markets for
Identical
Assets
(Level 1)
Significant
Other
Observable
Inputs
(Level 2)
Significant
Unobservable
Inputs
(Level 3)
Total
Gains (Losses)
Assets:
Other real estate:
Real estate – residential $ 368,000 $ - $ - $ 368,000 $ -
Real estate – commercial 347,000 347,000 - Real estate – construction and land
development 455,000 455,000 (117,000 )
$ 1,170,000 $ - $ - $ 1,170,000 $ (117,000 )
Assets and liabilities measured at fair value on a non-recurring basis at December 31, 2017 are summarized below:
Fair Value Measurements at December 31, 2017 Using
Total
Fair Value
Quoted
Prices in
Active
Markets for
Identical
Assets
(Level 1)
Significant
Other
Observable
Inputs
(Level 2)
Significant
Unobservable
Inputs
(Level 3)
Total
Gains (Losses)
Assets:
Impaired loans:
Equity lines of credit $ 80,000 $ - $ - $ 80,000 $ 7,000
Total impaired loans 80,000 - - 80,000 7,000 Other real estate:
Real estate – residential - - (3,000 )
Real estate – commercial 285,000 285,000 (9,000 )
Real estate – construction and land
development 969,000 969,000 (112,000 )
Equity lines of credit 90,000 90,000 -
Total other real estate 1,344,000 - - 1,344,000 (124,000 )
$ 1,424,000 $ - $ - $ 1,424,000 $ (117,000 )
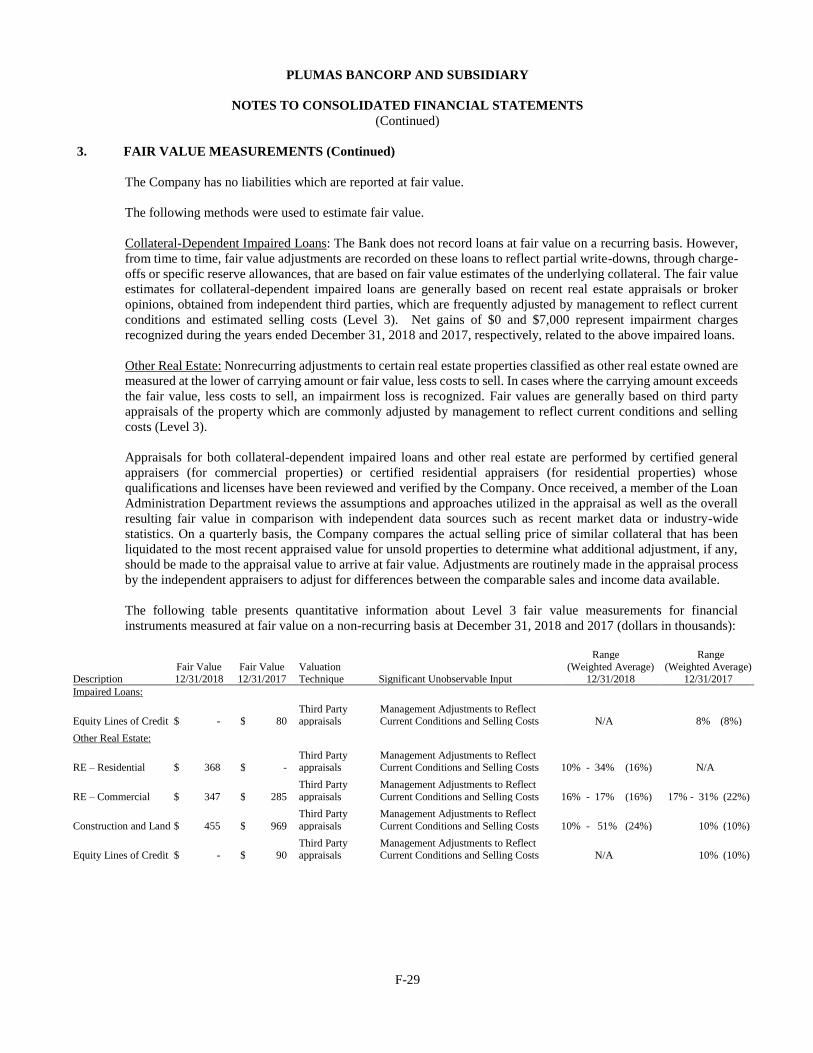
F-29
PLUMAS BANCORP AND SUBSIDIARY
NOTES TO CONSOLIDATED FINANCIAL STATEMENTS
(Continued)
3. FAIR VALUE MEASUREMENTS (Continued)
The Company has no liabilities which are reported at fair value.
The following methods were used to estimate fair value.
Collateral-Dependent Impaired Loans: The Bank does not record loans at fair value on a recurring basis. However,
from time to time, fair value adjustments are recorded on these loans to reflect partial write-downs, through charge-
offs or specific reserve allowances, that are based on fair value estimates of the underlying collateral. The fair value
estimates for collateral-dependent impaired loans are generally based on recent real estate appraisals or broker
opinions, obtained from independent third parties, which are frequently adjusted by management to reflect current
conditions and estimated selling costs (Level 3). Net gains of $0 and $7,000 represent impairment charges
recognized during the years ended December 31, 2018 and 2017, respectively, related to the above impaired loans.
Other Real Estate: Nonrecurring adjustments to certain real estate properties classified as other real estate owned are
measured at the lower of carrying amount or fair value, less costs to sell. In cases where the carrying amount exceeds
the fair value, less costs to sell, an impairment loss is recognized. Fair values are generally based on third party
appraisals of the property which are commonly adjusted by management to reflect current conditions and selling
costs (Level 3).
Appraisals for both collateral-dependent impaired loans and other real estate are performed by certified general
appraisers (for commercial properties) or certified residential appraisers (for residential properties) whose
qualifications and licenses have been reviewed and verified by the Company. Once received, a member of the Loan
Administration Department reviews the assumptions and approaches utilized in the appraisal as well as the overall
resulting fair value in comparison with independent data sources such as recent market data or industry-wide
statistics. On a quarterly basis, the Company compares the actual selling price of similar collateral that has been
liquidated to the most recent appraised value for unsold properties to determine what additional adjustment, if any,
should be made to the appraisal value to arrive at fair value. Adjustments are routinely made in the appraisal process
by the independent appraisers to adjust for differences between the comparable sales and income data available.
The following table presents quantitative information about Level 3 fair value measurements for financial
instruments measured at fair value on a non-recurring basis at December 31, 2018 and 2017 (dollars in thousands):
Range Range
Description Fair Value 12/31/2018
Fair Value 12/31/2017
Valuation Technique Significant Unobservable Input
(Weighted Average) 12/31/2018
(Weighted Average) 12/31/2017
Impaired Loans:
Equity Lines of Credit $ - $ 80 Third Party appraisals
Management Adjustments to Reflect Current Conditions and Selling Costs N/A 8% (8%)
Other Real Estate:
RE – Residential $ 368 $ - Third Party appraisals
Management Adjustments to Reflect Current Conditions and Selling Costs 10% - 34% (16%) N/A
RE – Commercial $ 347 $ 285
Third Party
appraisals
Management Adjustments to Reflect
Current Conditions and Selling Costs 16% - 17% (16%) 17% - 31% (22%)
Construction and Land $ 455 $ 969
Third Party
appraisals
Management Adjustments to Reflect
Current Conditions and Selling Costs 10% - 51% (24%) 10% (10%)
Equity Lines of Credit $ - $ 90 Third Party appraisals
Management Adjustments to Reflect Current Conditions and Selling Costs N/A 10% (10%)
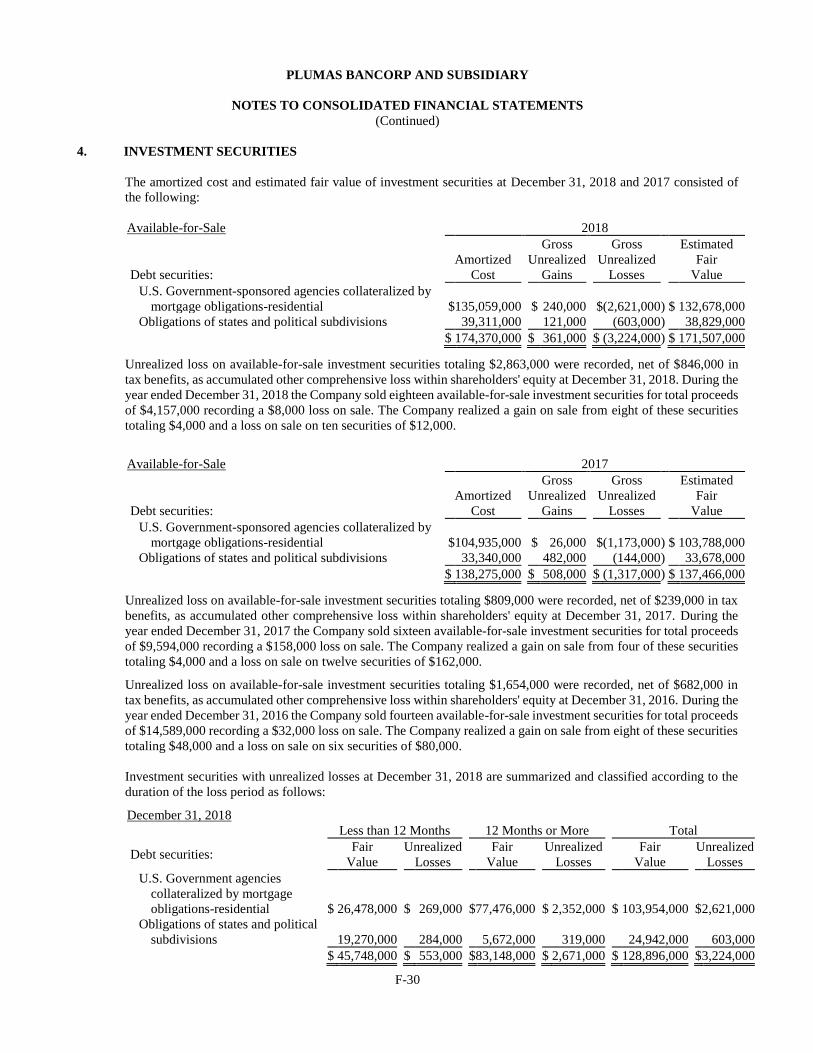
F-30
PLUMAS BANCORP AND SUBSIDIARY
NOTES TO CONSOLIDATED FINANCIAL STATEMENTS
(Continued)
4. INVESTMENT SECURITIES
The amortized cost and estimated fair value of investment securities at December 31, 2018 and 2017 consisted of
the following:
Available-for-Sale 2018
Gross Gross Estimated
Amortized Unrealized Unrealized Fair
Debt securities: Cost Gains Losses Value
U.S. Government-sponsored agencies collateralized by
mortgage obligations-residential $ 135,059,000 $ 240,000 $ (2,621,000 ) $ 132,678,000
Obligations of states and political subdivisions 39,311,000 121,000 (603,000 ) 38,829,000
$ 174,370,000 $ 361,000 $ (3,224,000 ) $ 171,507,000
Unrealized loss on available-for-sale investment securities totaling $2,863,000 were recorded, net of $846,000 in
tax benefits, as accumulated other comprehensive loss within shareholders' equity at December 31, 2018. During the
year ended December 31, 2018 the Company sold eighteen available-for-sale investment securities for total proceeds
of $4,157,000 recording a $8,000 loss on sale. The Company realized a gain on sale from eight of these securities
totaling $4,000 and a loss on sale on ten securities of $12,000.
Available-for-Sale 2017
Gross Gross Estimated
Amortized Unrealized Unrealized Fair
Debt securities: Cost Gains Losses Value
U.S. Government-sponsored agencies collateralized by
mortgage obligations-residential $ 104,935,000 $ 26,000 $ (1,173,000 ) $ 103,788,000
Obligations of states and political subdivisions 33,340,000 482,000 (144,000 ) 33,678,000
$ 138,275,000 $ 508,000 $ (1,317,000 ) $ 137,466,000
Unrealized loss on available-for-sale investment securities totaling $809,000 were recorded, net of $239,000 in tax
benefits, as accumulated other comprehensive loss within shareholders' equity at December 31, 2017. During the
year ended December 31, 2017 the Company sold sixteen available-for-sale investment securities for total proceeds
of $9,594,000 recording a $158,000 loss on sale. The Company realized a gain on sale from four of these securities
totaling $4,000 and a loss on sale on twelve securities of $162,000.
Unrealized loss on available-for-sale investment securities totaling $1,654,000 were recorded, net of $682,000 in
tax benefits, as accumulated other comprehensive loss within shareholders' equity at December 31, 2016. During the
year ended December 31, 2016 the Company sold fourteen available-for-sale investment securities for total proceeds
of $14,589,000 recording a $32,000 loss on sale. The Company realized a gain on sale from eight of these securities
totaling $48,000 and a loss on sale on six securities of $80,000.
Investment securities with unrealized losses at December 31, 2018 are summarized and classified according to the
duration of the loss period as follows:
December 31, 2018
Less than 12 Months 12 Months or More Total
Debt securities: Fair
Value
Unrealized
Losses
Fair
Value
Unrealized
Losses
Fair
Value
Unrealized
Losses
U.S. Government agencies
collateralized by mortgage
obligations-residential $ 26,478,000 $ 269,000 $ 77,476,000 $ 2,352,000 $ 103,954,000 $ 2,621,000
Obligations of states and political
subdivisions 19,270,000 284,000 5,672,000 319,000 24,942,000 603,000
$ 45,748,000 $ 553,000 $ 83,148,000 $ 2,671,000 $ 128,896,000 $ 3,224,000
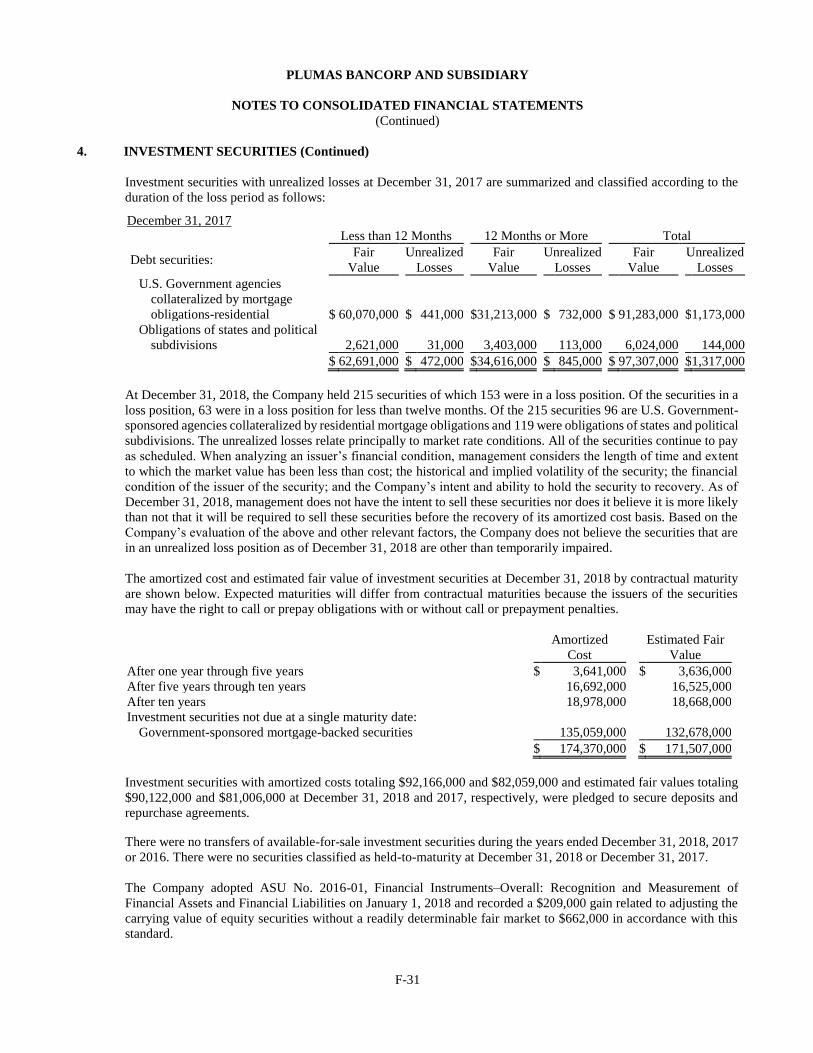
F-31
PLUMAS BANCORP AND SUBSIDIARY
NOTES TO CONSOLIDATED FINANCIAL STATEMENTS
(Continued)
4. INVESTMENT SECURITIES (Continued)
Investment securities with unrealized losses at December 31, 2017 are summarized and classified according to the
duration of the loss period as follows:
December 31, 2017
Less than 12 Months 12 Months or More Total
Debt securities: Fair
Value
Unrealized
Losses
Fair
Value
Unrealized
Losses
Fair
Value
Unrealized
Losses
U.S. Government agencies
collateralized by mortgage
obligations-residential $ 60,070,000 $ 441,000 $ 31,213,000 $ 732,000 $ 91,283,000 $ 1,173,000
Obligations of states and political
subdivisions 2,621,000 31,000 3,403,000 113,000 6,024,000 144,000
$ 62,691,000 $ 472,000 $ 34,616,000 $ 845,000 $ 97,307,000 $ 1,317,000
At December 31, 2018, the Company held 215 securities of which 153 were in a loss position. Of the securities in a
loss position, 63 were in a loss position for less than twelve months. Of the 215 securities 96 are U.S. Government-
sponsored agencies collateralized by residential mortgage obligations and 119 were obligations of states and political
subdivisions. The unrealized losses relate principally to market rate conditions. All of the securities continue to pay
as scheduled. When analyzing an issuer’s financial condition, management considers the length of time and extent
to which the market value has been less than cost; the historical and implied volatility of the security; the financial
condition of the issuer of the security; and the Company’s intent and ability to hold the security to recovery. As of
December 31, 2018, management does not have the intent to sell these securities nor does it believe it is more likely
than not that it will be required to sell these securities before the recovery of its amortized cost basis. Based on the
Company’s evaluation of the above and other relevant factors, the Company does not believe the securities that are
in an unrealized loss position as of December 31, 2018 are other than temporarily impaired.
The amortized cost and estimated fair value of investment securities at December 31, 2018 by contractual maturity
are shown below. Expected maturities will differ from contractual maturities because the issuers of the securities
may have the right to call or prepay obligations with or without call or prepayment penalties.
Amortized
Cost
Estimated Fair
Value
After one year through five years $ 3,641,000 $ 3,636,000
After five years through ten years 16,692,000 16,525,000
After ten years 18,978,000 18,668,000
Investment securities not due at a single maturity date:
Government-sponsored mortgage-backed securities 135,059,000 132,678,000
$ 174,370,000 $ 171,507,000
Investment securities with amortized costs totaling $92,166,000 and $82,059,000 and estimated fair values totaling
$90,122,000 and $81,006,000 at December 31, 2018 and 2017, respectively, were pledged to secure deposits and
repurchase agreements.
There were no transfers of available-for-sale investment securities during the years ended December 31, 2018, 2017
or 2016. There were no securities classified as held-to-maturity at December 31, 2018 or December 31, 2017.
The Company adopted ASU No. 2016-01, Financial Instruments–Overall: Recognition and Measurement of
Financial Assets and Financial Liabilities on January 1, 2018 and recorded a $209,000 gain related to adjusting the
carrying value of equity securities without a readily determinable fair market to $662,000 in accordance with this
standard.
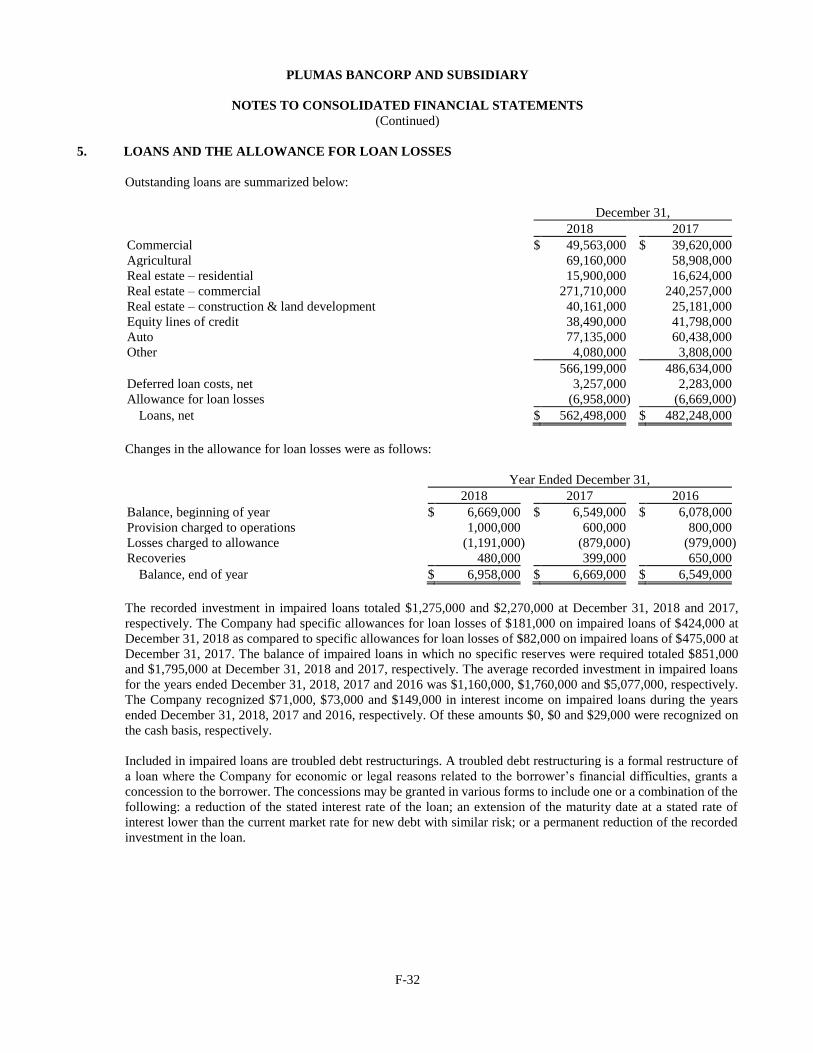
F-32
PLUMAS BANCORP AND SUBSIDIARY
NOTES TO CONSOLIDATED FINANCIAL STATEMENTS
(Continued)
5. LOANS AND THE ALLOWANCE FOR LOAN LOSSES
Outstanding loans are summarized below:
December 31,
2018 2017
Commercial $ 49,563,000 $ 39,620,000
Agricultural 69,160,000 58,908,000
Real estate – residential 15,900,000 16,624,000
Real estate – commercial 271,710,000 240,257,000
Real estate – construction & land development 40,161,000 25,181,000
Equity lines of credit 38,490,000 41,798,000
Auto 77,135,000 60,438,000
Other 4,080,000 3,808,000
566,199,000 486,634,000
Deferred loan costs, net 3,257,000 2,283,000
Allowance for loan losses (6,958,000 ) (6,669,000 )
Loans, net $ 562,498,000 $ 482,248,000
Changes in the allowance for loan losses were as follows:
Year Ended December 31,
2018 2017 2016
Balance, beginning of year $ 6,669,000 $ 6,549,000 $ 6,078,000
Provision charged to operations 1,000,000 600,000 800,000
Losses charged to allowance (1,191,000 ) (879,000 ) (979,000 )
Recoveries 480,000 399,000 650,000
Balance, end of year $ 6,958,000 $ 6,669,000 $ 6,549,000
The recorded investment in impaired loans totaled $1,275,000 and $2,270,000 at December 31, 2018 and 2017,
respectively. The Company had specific allowances for loan losses of $181,000 on impaired loans of $424,000 at
December 31, 2018 as compared to specific allowances for loan losses of $82,000 on impaired loans of $475,000 at
December 31, 2017. The balance of impaired loans in which no specific reserves were required totaled $851,000
and $1,795,000 at December 31, 2018 and 2017, respectively. The average recorded investment in impaired loans
for the years ended December 31, 2018, 2017 and 2016 was $1,160,000, $1,760,000 and $5,077,000, respectively.
The Company recognized $71,000, $73,000 and $149,000 in interest income on impaired loans during the years
ended December 31, 2018, 2017 and 2016, respectively. Of these amounts $0, $0 and $29,000 were recognized on
the cash basis, respectively.
Included in impaired loans are troubled debt restructurings. A troubled debt restructuring is a formal restructure of
a loan where the Company for economic or legal reasons related to the borrower’s financial difficulties, grants a
concession to the borrower. The concessions may be granted in various forms to include one or a combination of the
following: a reduction of the stated interest rate of the loan; an extension of the maturity date at a stated rate of
interest lower than the current market rate for new debt with similar risk; or a permanent reduction of the recorded
investment in the loan.
F-33
PLUMAS BANCORP AND SUBSIDIARY
NOTES TO CONSOLIDATED FINANCIAL STATEMENTS
(Continued)
5. LOANS AND THE ALLOWANCE FOR LOAN LOSSES (Continued)
In order to determine whether a borrower is experiencing financial difficulty, an evaluation is performed of the
probability that the borrower will be in payment default on any of its debt in the foreseeable future without the
modification. This evaluation is performed under the Company’s internal underwriting policy.
The carrying value of troubled debt restructurings at December 31, 2018 and December 31, 2017 was $1,080,000
and $1,111,000, respectively. The Company has allocated $53,000 and $63,000 of specific reserves on loans to
customers whose loan terms have been modified in troubled debt restructurings as of December 31, 2018 and
December 31, 2017, respectively. The Company has not committed to lend additional amounts on loans classified
as troubled debt restructurings at December 31, 2018 and December 31, 2017.
There were no new troubled debt restructurings during the twelve months ending December 31, 2018 and 2017.
There were no troubled debt restructurings for which there was a payment default within twelve months following
the modification during the twelve months ended December 31, 2018 and 2017.
At December 31, 2018 and 2017, nonaccrual loans totaled $1,117,000 and $1,226,000, respectively. Interest
foregone on nonaccrual loans totaled $46,000, $50,000 and $164,000 for the twelve months ended December 31,
2018, 2017 and 2016, respectively. The Company recognized $0, $0 and $29,000 in interest income on nonaccrual
loans during the years ended December 31, 2018, 2017 and 2016, respectively. At December 31, 2017 there were
three loans to one customer totaling $1.8 million that were 90 days past due and still accruing interest. These loans
were well secured and in process of collection at December 31, 2017. There were no loans past due 90 days or more
and on accrual status at December 31, 2018 and December 31, 2016.
Salaries and employee benefits totaling $2,520,000, $1,789,000 and $1,882,000 have been deferred as loan
origination costs during the years ended December 31, 2018, 2017 and 2016, respectively.
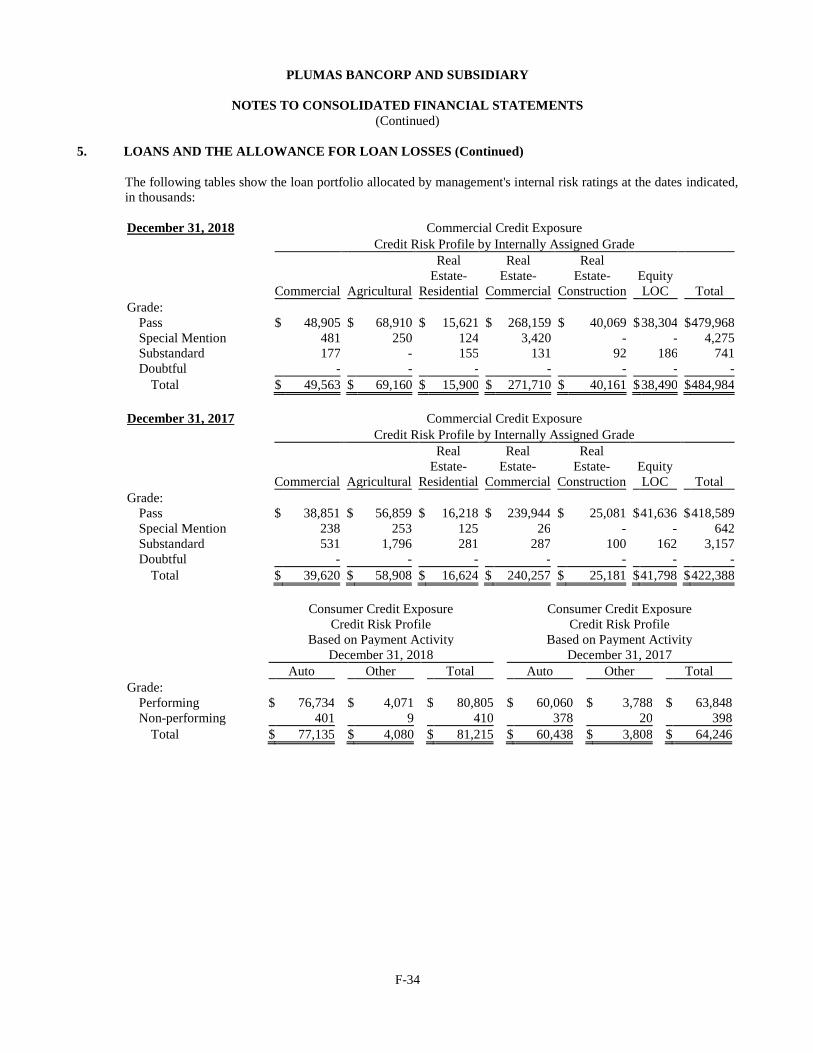
F-34
PLUMAS BANCORP AND SUBSIDIARY
NOTES TO CONSOLIDATED FINANCIAL STATEMENTS
(Continued)
5. LOANS AND THE ALLOWANCE FOR LOAN LOSSES (Continued)
The following tables show the loan portfolio allocated by management's internal risk ratings at the dates indicated,
in thousands:
December 31, 2018 Commercial Credit Exposure
Credit Risk Profile by Internally Assigned Grade
Commercial Agricultural
Real
Estate-
Residential
Real
Estate-
Commercial
Real
Estate-
Construction
Equity
LOC Total
Grade:
Pass $ 48,905 $ 68,910 $ 15,621 $ 268,159 $ 40,069 $ 38,304 $ 479,968
Special Mention 481 250 124 3,420 - - 4,275
Substandard 177 - 155 131 92 186 741
Doubtful - - - - - - -
Total $ 49,563 $ 69,160 $ 15,900 $ 271,710 $ 40,161 $ 38,490 $ 484,984
December 31, 2017 Commercial Credit Exposure
Credit Risk Profile by Internally Assigned Grade
Commercial Agricultural
Real
Estate-
Residential
Real
Estate-
Commercial
Real
Estate-
Construction
Equity
LOC Total
Grade:
Pass $ 38,851 $ 56,859 $ 16,218 $ 239,944 $ 25,081 $ 41,636 $ 418,589
Special Mention 238 253 125 26 - - 642
Substandard 531 1,796 281 287 100 162 3,157
Doubtful - - - - - - -
Total $ 39,620 $ 58,908 $ 16,624 $ 240,257 $ 25,181 $ 41,798 $ 422,388
Consumer Credit Exposure Consumer Credit Exposure
Credit Risk Profile
Based on Payment Activity
Credit Risk Profile
Based on Payment Activity
December 31, 2018 December 31, 2017
Auto Other Total Auto Other Total
Grade:
Performing $ 76,734 $ 4,071 $ 80,805 $ 60,060 $ 3,788 $ 63,848
Non-performing 401 9 410 378 20 398
Total $ 77,135 $ 4,080 $ 81,215 $ 60,438 $ 3,808 $ 64,246
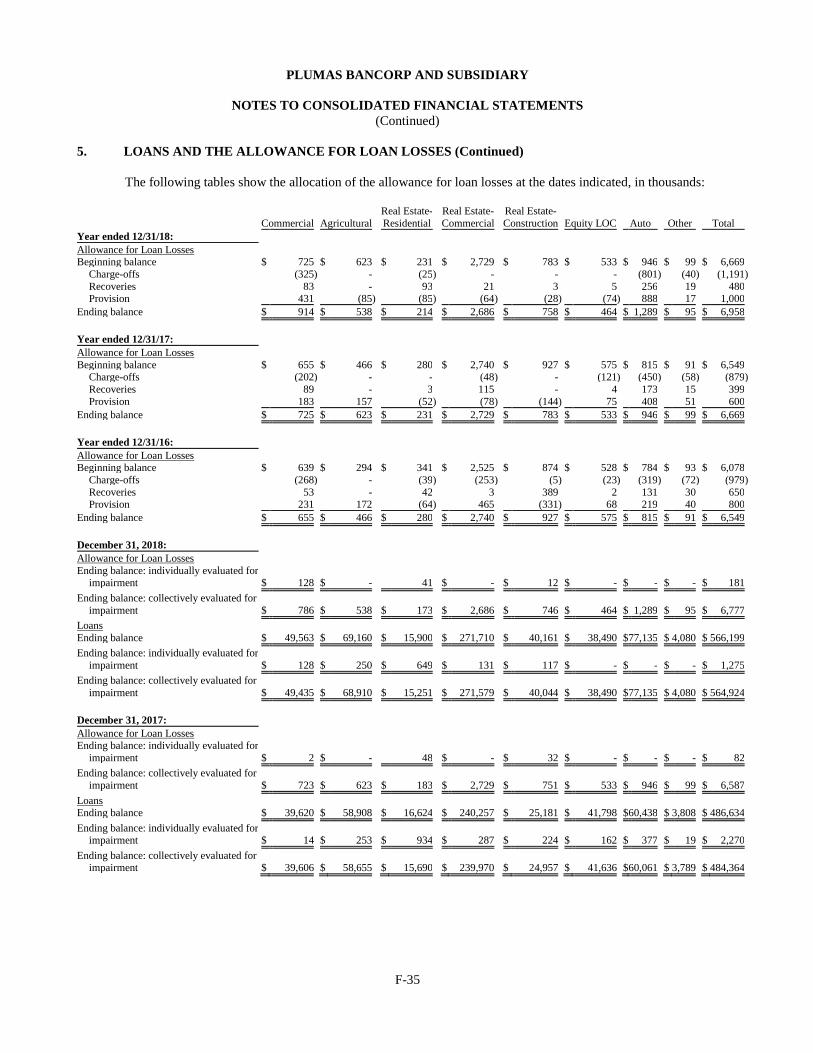
F-35
PLUMAS BANCORP AND SUBSIDIARY
NOTES TO CONSOLIDATED FINANCIAL STATEMENTS
(Continued)
5. LOANS AND THE ALLOWANCE FOR LOAN LOSSES (Continued)
The following tables show the allocation of the allowance for loan losses at the dates indicated, in thousands:
Real Estate- Real Estate- Real Estate-
Commercial Agricultural Residential Commercial Construction Equity LOC Auto Other Total
Year ended 12/31/18:
Allowance for Loan Losses Beginning balance $ 725 $ 623 $ 231 $ 2,729 $ 783 $ 533 $ 946 $ 99 $ 6,669
Charge-offs (325 ) - (25 ) - - - (801 ) (40 ) (1,191 )
Recoveries 83 - 93 21 3 5 256 19 480 Provision 431 (85 ) (85 ) (64 ) (28 ) (74 ) 888 17 1,000
Ending balance $ 914 $ 538 $ 214 $ 2,686 $ 758 $ 464 $ 1,289 $ 95 $ 6,958
Year ended 12/31/17:
Allowance for Loan Losses
Beginning balance $ 655 $ 466 $ 280 $ 2,740 $ 927 $ 575 $ 815 $ 91 $ 6,549 Charge-offs (202 ) - - (48 ) - (121 ) (450 ) (58 ) (879 )
Recoveries 89 - 3 115 - 4 173 15 399
Provision 183 157 (52 ) (78 ) (144 ) 75 408 51 600
Ending balance $ 725 $ 623 $ 231 $ 2,729 $ 783 $ 533 $ 946 $ 99 $ 6,669
Year ended 12/31/16:
Allowance for Loan Losses Beginning balance $ 639 $ 294 $ 341 $ 2,525 $ 874 $ 528 $ 784 $ 93 $ 6,078
Charge-offs (268 ) - (39 ) (253 ) (5 ) (23 ) (319 ) (72 ) (979 )
Recoveries 53 - 42 3 389 2 131 30 650 Provision 231 172 (64 ) 465 (331 ) 68 219 40 800
Ending balance $ 655 $ 466 $ 280 $ 2,740 $ 927 $ 575 $ 815 $ 91 $ 6,549
December 31, 2018:
Allowance for Loan Losses
Ending balance: individually evaluated for impairment $ 128 $ - 41 $ - $ 12 $ - $ - $ - $ 181
Ending balance: collectively evaluated for
impairment $ 786 $ 538 $ 173 $ 2,686 $ 746 $ 464 $ 1,289 $ 95 $ 6,777
Loans
Ending balance $ 49,563 $ 69,160 $ 15,900 $ 271,710 $ 40,161 $ 38,490 $ 77,135 $ 4,080 $ 566,199
Ending balance: individually evaluated for
impairment $ 128 $ 250 $ 649 $ 131 $ 117 $ - $ - $ - $ 1,275
Ending balance: collectively evaluated for
impairment $ 49,435 $ 68,910 $ 15,251 $ 271,579 $ 40,044 $ 38,490 $ 77,135 $ 4,080 $ 564,924
December 31, 2017:
Allowance for Loan Losses Ending balance: individually evaluated for
impairment $ 2 $ - 48 $ - $ 32 $ - $ - $ - $ 82
Ending balance: collectively evaluated for
impairment $ 723 $ 623 $ 183 $ 2,729 $ 751 $ 533 $ 946 $ 99 $ 6,587
Loans Ending balance $ 39,620 $ 58,908 $ 16,624 $ 240,257 $ 25,181 $ 41,798 $ 60,438 $ 3,808 $ 486,634
Ending balance: individually evaluated for impairment $ 14 $ 253 $ 934 $ 287 $ 224 $ 162 $ 377 $ 19 $ 2,270
Ending balance: collectively evaluated for impairment $ 39,606 $ 58,655 $ 15,690 $ 239,970 $ 24,957 $ 41,636 $ 60,061 $ 3,789 $ 484,364
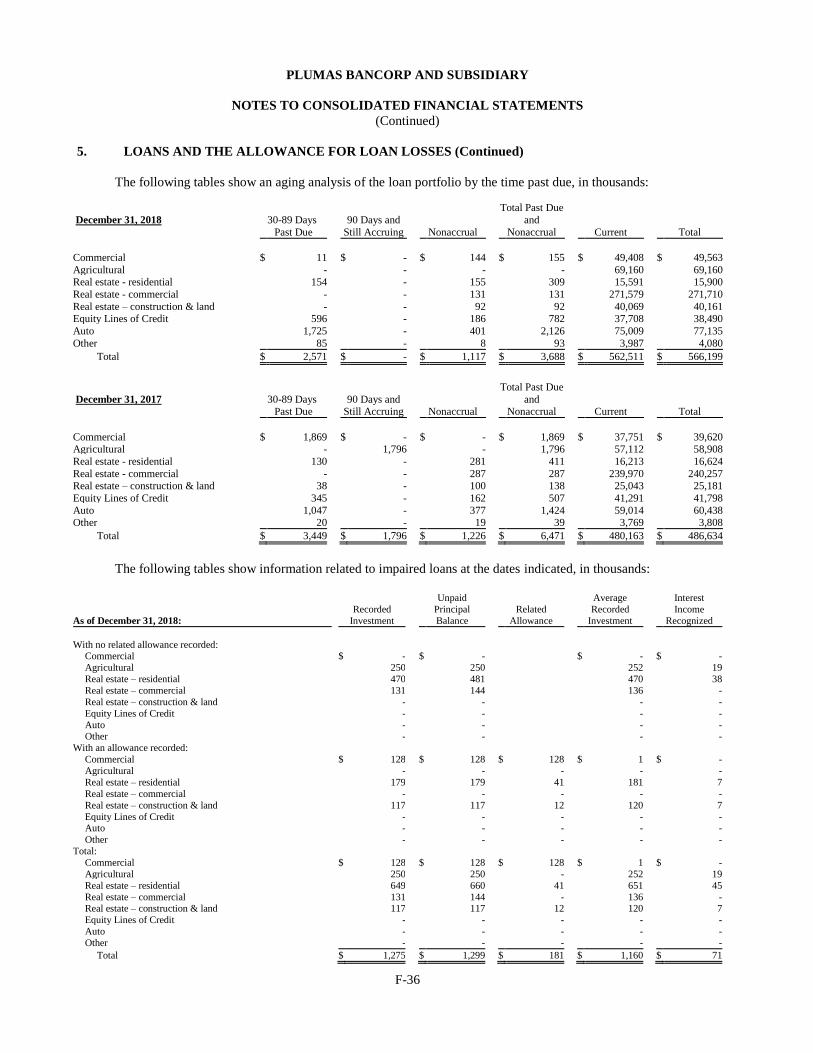
F-36
PLUMAS BANCORP AND SUBSIDIARY
NOTES TO CONSOLIDATED FINANCIAL STATEMENTS
(Continued)
5. LOANS AND THE ALLOWANCE FOR LOAN LOSSES (Continued)
The following tables show an aging analysis of the loan portfolio by the time past due, in thousands:
December 31, 2018
30-89 Days
Past Due
90 Days and
Still Accruing
Nonaccrual
Total Past Due
and
Nonaccrual
Current
Total
Commercial $ 11 $ - $ 144 $ 155 $ 49,408 $ 49,563
Agricultural - - - - 69,160 69,160 Real estate - residential 154 - 155 309 15,591 15,900
Real estate - commercial - - 131 131 271,579 271,710
Real estate – construction & land - - 92 92 40,069 40,161 Equity Lines of Credit 596 - 186 782 37,708 38,490
Auto 1,725 - 401 2,126 75,009 77,135
Other 85 - 8 93 3,987 4,080
Total $ 2,571 $ - $ 1,117 $ 3,688 $ 562,511 $ 566,199
December 31, 2017
30-89 Days Past Due
90 Days and Still Accruing
Nonaccrual
Total Past Due
and Nonaccrual
Current
Total
Commercial $ 1,869 $ - $ - $ 1,869 $ 37,751 $ 39,620 Agricultural - 1,796 - 1,796 57,112 58,908
Real estate - residential 130 - 281 411 16,213 16,624
Real estate - commercial - - 287 287 239,970 240,257 Real estate – construction & land 38 - 100 138 25,043 25,181
Equity Lines of Credit 345 - 162 507 41,291 41,798
Auto 1,047 - 377 1,424 59,014 60,438 Other 20 - 19 39 3,769 3,808
Total $ 3,449 $ 1,796 $ 1,226 $ 6,471 $ 480,163 $ 486,634
The following tables show information related to impaired loans at the dates indicated, in thousands:
As of December 31, 2018:
Recorded
Investment
Unpaid
Principal
Balance
Related
Allowance
Average
Recorded
Investment
Interest
Income
Recognized
With no related allowance recorded: Commercial $ - $ - $ - $ -
Agricultural 250 250 252 19
Real estate – residential 470 481 470 38
Real estate – commercial 131 144 136 -
Real estate – construction & land - - - -
Equity Lines of Credit - - - -
Auto - - - - Other - - - -
With an allowance recorded:
Commercial $ 128 $ 128 $ 128 $ 1 $ -
Agricultural - - - - -
Real estate – residential 179 179 41 181 7
Real estate – commercial - - - - -
Real estate – construction & land 117 117 12 120 7
Equity Lines of Credit - - - - - Auto - - - - -
Other - - - - -
Total:
Commercial $ 128 $ 128 $ 128 $ 1 $ -
Agricultural 250 250 - 252 19
Real estate – residential 649 660 41 651 45
Real estate – commercial 131 144 - 136 - Real estate – construction & land 117 117 12 120 7
Equity Lines of Credit - - - - -
Auto - - - - -
Other - - - - -
Total $ 1,275 $ 1,299 $ 181 $ 1,160 $ 71
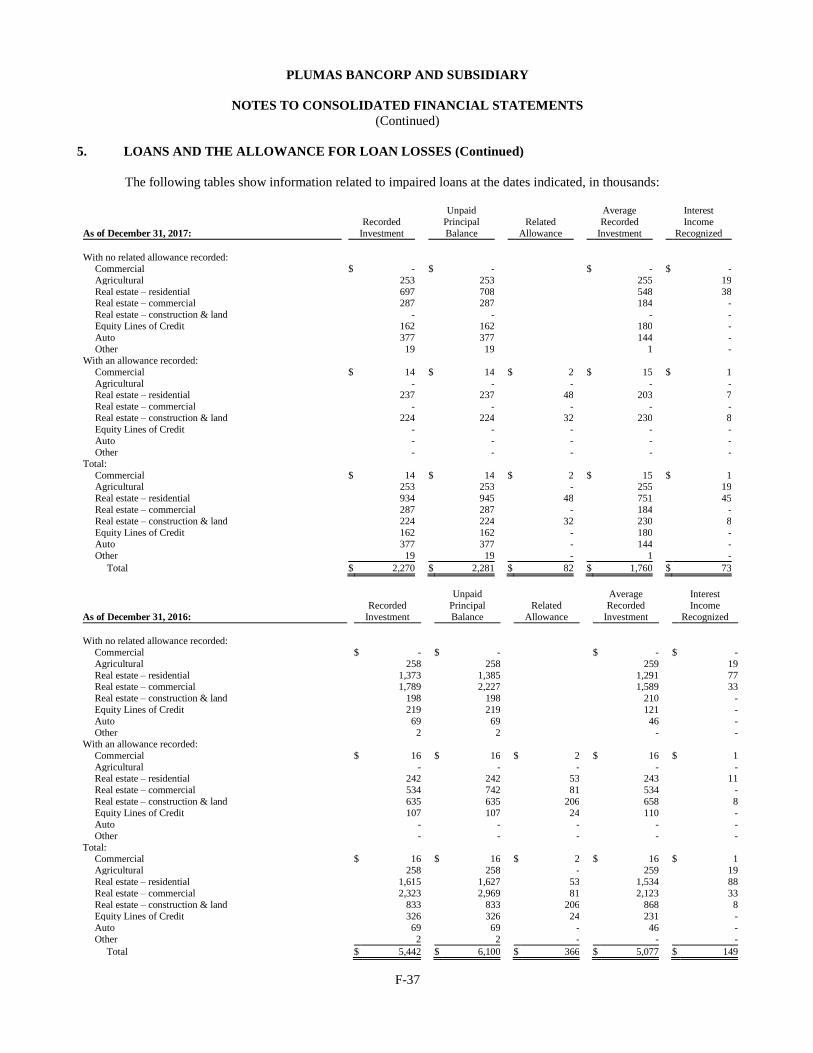
F-37
PLUMAS BANCORP AND SUBSIDIARY
NOTES TO CONSOLIDATED FINANCIAL STATEMENTS
(Continued)
5. LOANS AND THE ALLOWANCE FOR LOAN LOSSES (Continued)
The following tables show information related to impaired loans at the dates indicated, in thousands:
As of December 31, 2017:
Recorded
Investment
Unpaid
Principal
Balance
Related
Allowance
Average
Recorded
Investment
Interest
Income
Recognized
With no related allowance recorded:
Commercial $ - $ - $ - $ -
Agricultural 253 253 255 19
Real estate – residential 697 708 548 38 Real estate – commercial 287 287 184 -
Real estate – construction & land - - - -
Equity Lines of Credit 162 162 180 -
Auto 377 377 144 -
Other 19 19 1 -
With an allowance recorded:
Commercial $ 14 $ 14 $ 2 $ 15 $ 1
Agricultural - - - - - Real estate – residential 237 237 48 203 7
Real estate – commercial - - - - -
Real estate – construction & land 224 224 32 230 8
Equity Lines of Credit - - - - -
Auto - - - - -
Other - - - - -
Total:
Commercial $ 14 $ 14 $ 2 $ 15 $ 1 Agricultural 253 253 - 255 19
Real estate – residential 934 945 48 751 45
Real estate – commercial 287 287 - 184 -
Real estate – construction & land 224 224 32 230 8
Equity Lines of Credit 162 162 - 180 -
Auto 377 377 - 144 -
Other 19 19 - 1 -
Total $ 2,270 $ 2,281 $ 82 $ 1,760 $ 73
As of December 31, 2016:
Recorded
Investment
Unpaid
Principal
Balance
Related
Allowance
Average
Recorded
Investment
Interest
Income
Recognized
With no related allowance recorded:
Commercial $ - $ - $ - $ -
Agricultural 258 258 259 19
Real estate – residential 1,373 1,385 1,291 77 Real estate – commercial 1,789 2,227 1,589 33
Real estate – construction & land 198 198 210 -
Equity Lines of Credit 219 219 121 -
Auto 69 69 46 -
Other 2 2 - -
With an allowance recorded:
Commercial $ 16 $ 16 $ 2 $ 16 $ 1
Agricultural - - - - - Real estate – residential 242 242 53 243 11
Real estate – commercial 534 742 81 534 -
Real estate – construction & land 635 635 206 658 8
Equity Lines of Credit 107 107 24 110 -
Auto - - - - -
Other - - - - -
Total: Commercial $ 16 $ 16 $ 2 $ 16 $ 1
Agricultural 258 258 - 259 19
Real estate – residential 1,615 1,627 53 1,534 88
Real estate – commercial 2,323 2,969 81 2,123 33
Real estate – construction & land 833 833 206 868 8
Equity Lines of Credit 326 326 24 231 -
Auto 69 69 - 46 -
Other 2 2 - - -
Total $ 5,442 $ 6,100 $ 366 $ 5,077 $ 149
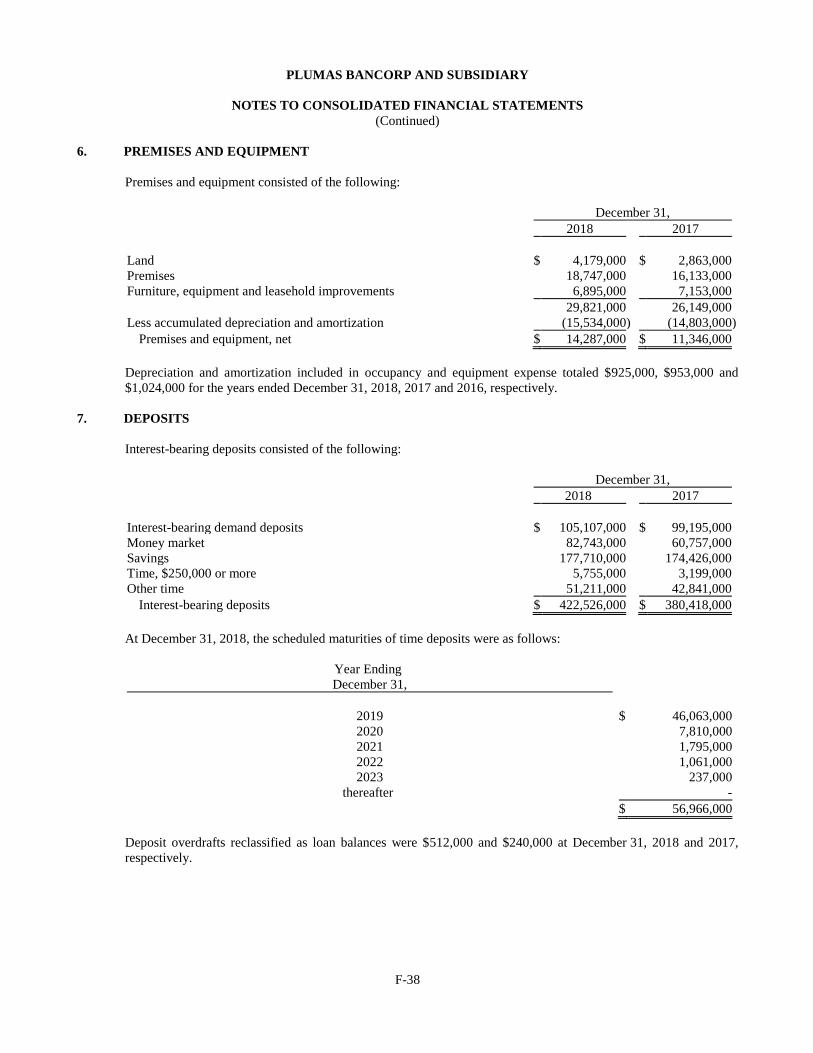
F-38
PLUMAS BANCORP AND SUBSIDIARY
NOTES TO CONSOLIDATED FINANCIAL STATEMENTS
(Continued)
6. PREMISES AND EQUIPMENT
Premises and equipment consisted of the following:
December 31,
2018 2017
Land $ 4,179,000 $ 2,863,000
Premises 18,747,000 16,133,000
Furniture, equipment and leasehold improvements 6,895,000 7,153,000
29,821,000 26,149,000
Less accumulated depreciation and amortization (15,534,000 ) (14,803,000 )
Premises and equipment, net $ 14,287,000 $ 11,346,000
Depreciation and amortization included in occupancy and equipment expense totaled $925,000, $953,000 and
$1,024,000 for the years ended December 31, 2018, 2017 and 2016, respectively.
7. DEPOSITS
Interest-bearing deposits consisted of the following:
December 31,
2018 2017
Interest-bearing demand deposits $ 105,107,000 $ 99,195,000
Money market 82,743,000 60,757,000
Savings 177,710,000 174,426,000
Time, $250,000 or more 5,755,000 3,199,000
Other time 51,211,000 42,841,000
Interest-bearing deposits $ 422,526,000 $ 380,418,000
At December 31, 2018, the scheduled maturities of time deposits were as follows:
Year Ending
December 31,
2019 $ 46,063,000
2020 7,810,000
2021 1,795,000
2022 1,061,000
2023 237,000
thereafter -
$ 56,966,000
Deposit overdrafts reclassified as loan balances were $512,000 and $240,000 at December 31, 2018 and 2017,
respectively.
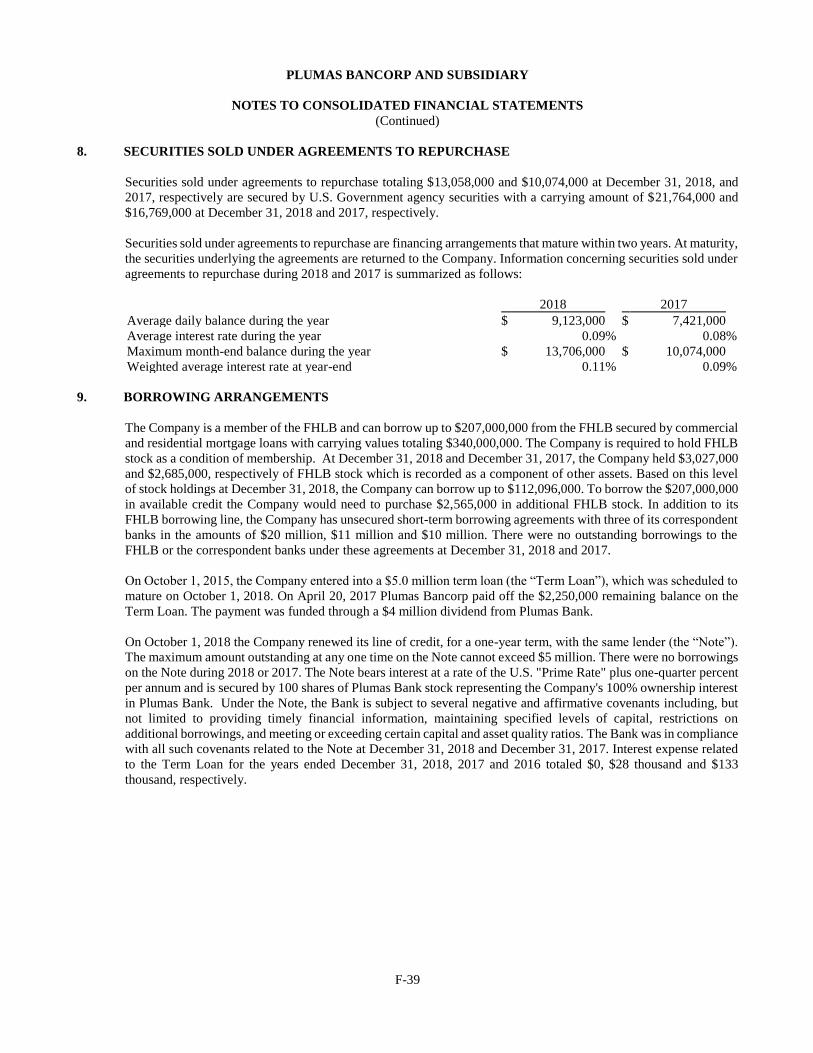
F-39
PLUMAS BANCORP AND SUBSIDIARY
NOTES TO CONSOLIDATED FINANCIAL STATEMENTS
(Continued)
8. SECURITIES SOLD UNDER AGREEMENTS TO REPURCHASE
Securities sold under agreements to repurchase totaling $13,058,000 and $10,074,000 at December 31, 2018, and
2017, respectively are secured by U.S. Government agency securities with a carrying amount of $21,764,000 and
$16,769,000 at December 31, 2018 and 2017, respectively.
Securities sold under agreements to repurchase are financing arrangements that mature within two years. At maturity,
the securities underlying the agreements are returned to the Company. Information concerning securities sold under
agreements to repurchase during 2018 and 2017 is summarized as follows:
2018 2017
Average daily balance during the year $ 9,123,000 $ 7,421,000
Average interest rate during the year 0.09 % 0.08 %
Maximum month-end balance during the year $ 13,706,000 $ 10,074,000
Weighted average interest rate at year-end 0.11 % 0.09 %
9. BORROWING ARRANGEMENTS
The Company is a member of the FHLB and can borrow up to $207,000,000 from the FHLB secured by commercial
and residential mortgage loans with carrying values totaling $340,000,000. The Company is required to hold FHLB
stock as a condition of membership. At December 31, 2018 and December 31, 2017, the Company held $3,027,000
and $2,685,000, respectively of FHLB stock which is recorded as a component of other assets. Based on this level
of stock holdings at December 31, 2018, the Company can borrow up to $112,096,000. To borrow the $207,000,000
in available credit the Company would need to purchase $2,565,000 in additional FHLB stock. In addition to its
FHLB borrowing line, the Company has unsecured short-term borrowing agreements with three of its correspondent
banks in the amounts of $20 million, $11 million and $10 million. There were no outstanding borrowings to the
FHLB or the correspondent banks under these agreements at December 31, 2018 and 2017.
On October 1, 2015, the Company entered into a $5.0 million term loan (the “Term Loan”), which was scheduled to
mature on October 1, 2018. On April 20, 2017 Plumas Bancorp paid off the $2,250,000 remaining balance on the
Term Loan. The payment was funded through a $4 million dividend from Plumas Bank.
On October 1, 2018 the Company renewed its line of credit, for a one-year term, with the same lender (the “Note”).
The maximum amount outstanding at any one time on the Note cannot exceed $5 million. There were no borrowings
on the Note during 2018 or 2017. The Note bears interest at a rate of the U.S. "Prime Rate" plus one-quarter percent
per annum and is secured by 100 shares of Plumas Bank stock representing the Company's 100% ownership interest
in Plumas Bank. Under the Note, the Bank is subject to several negative and affirmative covenants including, but
not limited to providing timely financial information, maintaining specified levels of capital, restrictions on
additional borrowings, and meeting or exceeding certain capital and asset quality ratios. The Bank was in compliance
with all such covenants related to the Note at December 31, 2018 and December 31, 2017. Interest expense related
to the Term Loan for the years ended December 31, 2018, 2017 and 2016 totaled $0, $28 thousand and $133
thousand, respectively.
F-40
PLUMAS BANCORP AND SUBSIDIARY
NOTES TO CONSOLIDATED FINANCIAL STATEMENTS
(Continued)
10. JUNIOR SUBORDINATED DEFERRABLE INTEREST DEBENTURES
Plumas Statutory Trust I and II are business trusts formed by the Company with capital of $338,000 and $174,000,
respectively, for the sole purpose of issuing trust preferred securities fully and unconditionally guaranteed by the
Company.
During 2002, Plumas Statutory Trust I issued 6,000 Floating Rate Capital Trust Pass-Through Securities ("Trust
Preferred Securities"), with a liquidation value of $1,000 per security, for gross proceeds of $6,000,000. During
2005, Plumas Statutory Trust II issued 4,000 Trust Preferred Securities with a liquidation value of $1,000 per
security, for gross proceeds of $4,000,000. The entire proceeds were invested by Trust I in the amount of $6,186,000
and Trust II in the amount of $4,124,000 in Floating Rate Junior Subordinated Deferrable Interest Debentures (the
"Subordinated Debentures") issued by the Company, with identical maturity, repricing and payment terms as the
Trust Preferred Securities. The Subordinated Debentures represent the sole assets of Trusts I and II.
Trust I’s Subordinated Debentures mature on September 26, 2032, bear a current interest rate of 6.22% (based on 3-
month LIBOR plus 3.40%), with repricing and payments due quarterly. Trust II’s Subordinated Debentures mature
on September 28, 2035, bear a current interest rate of 4.27% (based on 3-month LIBOR plus 1.48%), with repricing
and payments due quarterly. The Subordinated Debentures are redeemable by the Company, subject to receipt by
the Company of prior approval from the Federal Reserve Board of Governors, on any quarterly anniversary date on
or after the 5-year anniversary date of the issuance. The redemption price is par plus accrued and unpaid interest,
except in the case of redemption under a special event which is defined in the debenture. The Trust Preferred
Securities are subject to mandatory redemption to the extent of any early redemption of the Subordinated Debentures
and upon maturity of the Subordinated Debentures on September 26, 2032 for Trust I and September 28, 2035 for
Trust II.
Holders of the Trust Preferred Securities are entitled to a cumulative cash distribution on the liquidation amount of
$1,000 per security. The interest rate of the Trust Preferred Securities issued by Trust I adjust on each quarterly
anniversary date to equal the 3-month LIBOR plus 3.40%. The Trust Preferred Securities issued by Trust II adjust
on each quarterly anniversary date to equal the 3-month LIBOR plus 1.48%. Both Trusts I and II have the option to
defer payment of the distributions for a period of up to five years, as long as the Company is not in default on the
payment of interest on the Subordinated Debentures.
The Trust Preferred Securities were sold and issued in private transactions pursuant to an exemption from registration
under the Securities Act of 1933, as amended. The Company has guaranteed, on a subordinated basis, distributions
and other payments due on the Trust Preferred Securities.
Interest expense recognized by the Company for the years ended December 31, 2018, 2017 and 2016 related to the
subordinated debentures was $510,000, $401,000 and $348,000, respectively.
F-41
PLUMAS BANCORP AND SUBSIDIARY
NOTES TO CONSOLIDATED FINANCIAL STATEMENTS
(Continued)
11. COMMITMENTS AND CONTINGENCIES
Leases
The Company has commitments for leasing premises under the terms of noncancelable operating leases expiring
from 2019 to 2022. Future minimum lease payments for operating leases having initial or remining noncancelable
lease terms in excess of one year are as follows:
Year Ending December 31,
2019 $ 248,000
2020 163,000
2021 63,000
2022 59,000
2023 -
$ 533,000
Rental expense included in occupancy and equipment expense totaled $340,000, $308,000 and $276,000 for the
years ended December 31, 2018, 2017 and 2016, respectively.
Financial Instruments With Off-Balance-Sheet Risk
The Company is a party to financial instruments with off-balance-sheet risk in the normal course of business in order
to meet the financing needs of its customers. These financial instruments include commitments to extend credit and
letters of credit. These instruments involve, to varying degrees, elements of credit and interest rate risk in excess of
the amount recognized on the consolidated balance sheet.
The Company's exposure to credit loss in the event of nonperformance by the other party for commitments to extend
credit and letters of credit is represented by the contractual amount of those instruments. The Company uses the
same credit policies in making commitments and letters of credit as it does for loans included on the consolidated
balance sheet.
The following financial instruments represent off-balance-sheet credit risk:
December 31,
2018 2017
Commitments to extend credit $ 126,885,000 $ 107,366,000
Letters of credit $ 417,000 $ 477,000
Commitments to extend credit are agreements to lend to a customer as long as there is no violation of any condition
established in the contract. Commitments generally have fixed expiration dates or other termination clauses and may
require payment of a fee. Since some of the commitments are expected to expire without being drawn upon, the total
commitment amounts do not necessarily represent future cash requirements. The Company evaluates each
customer's creditworthiness on a case-by-case basis. The amount of collateral obtained, if deemed necessary by the
Company upon extension of credit, is based on management's credit evaluation of the borrower. Collateral held
varies, but may include accounts receivable, crops, inventory, equipment, income-producing commercial properties,
farm land and residential properties.
Letters of credit are conditional commitments issued by the Company to guarantee the performance of a customer
to a third party. The credit risk involved in issuing letters of credit is essentially the same as that involved in extending
loans to customers. The fair value of the liability related to these letters of credit, which represents the fees received
for issuing the guarantees, was not significant at December 31, 2018 and 2017. The Company recognizes these fees
as revenues over the term of the commitment or when the commitment is used.
F-42
PLUMAS BANCORP AND SUBSIDIARY
NOTES TO CONSOLIDATED FINANCIAL STATEMENTS
(Continued)
11. COMMITMENTS AND CONTINGENCIES (Continued)
At December 31, 2018, consumer loan commitments represent approximately 8% of total commitments and are
generally unsecured. Commercial and agricultural loan commitments represent approximately 34% of total
commitments and are generally secured by various assets of the borrower. Real estate loan commitments, including
consumer home equity lines of credit, represent the remaining 58% of total commitments and are generally secured
by property with a loan-to-value ratio not to exceed 80%. In addition, the majority of the Company’s commitments
have variable interest rates.
Concentrations of Credit Risk
The Company grants real estate mortgage, real estate construction, commercial, agricultural and consumer loans to
customers throughout Plumas, Nevada, Placer, Lassen, Sierra, Shasta and Modoc counties in California and Washoe
county in Northern Nevada.
Although the Company has a diversified loan portfolio, a substantial portion of its portfolio is secured by commercial
and residential real estate. A continued substantial decline in the economy in general, or a continued decline in real
estate values in the Company’s primary market areas in particular, could have an adverse impact on the collectability
of these loans. However, personal and business income represents the primary source of repayment for a majority
of these loans.
Contingencies
The Company is subject to legal proceedings and claims which arise in the ordinary course of business. In the opinion
of management, the amount of ultimate liability with respect to such actions will not materially affect the financial
position or results of operations of the Company.
12. SHAREHOLDERS' EQUITY
Dividend Restrictions
The Company's ability to pay cash dividends is dependent on dividends paid to it by the Bank and limited by
California corporation law. Under California law, the holders of common stock of the Company are entitled to
receive dividends when and as declared by the Board of Directors, out of funds legally available, subject to certain
restrictions. The California General Corporation Law permits a California corporation such as the Company to make
a distribution to its shareholders if its retained earnings equal at least the amount of the proposed distribution or if
after giving effect to the distribution, the value of the corporation’s assets exceed the amount of its liabilities plus
the amount of shareholders preferences, if any, and certain other conditions are met.
Dividends from the Bank to the Company are restricted under California law to the lesser of the Bank's retained
earnings or the Bank's net income for the latest three fiscal years, less dividends previously declared during that
period, or, with the approval of the DBO, to the greater of the retained earnings of the Bank, the net income of the
Bank for its last fiscal year, or the net income of the Bank for its current fiscal year. As of December 31, 2018, the
maximum amount available for dividend distribution under this restriction was approximately $21,407,000. In
addition, the Company’s ability to pay dividends is subject to certain covenants contained in the indentures relating
to the Trust Preferred Securities issued by the business trusts (see Note 10 for additional information related to the
Trust Preferred Securities).
On October 20, 2016 the Company announced that its Board of Directors approved the reinstatement of a semi-
annual cash dividend. The dividend in the amount of $0.10 per share was paid on November 21, 2016. On May 15,
2017 and November 15, 2017, the Company paid semi-annual cash dividends each of which totaled $0.14 per share.
On May 15, 2018 and November 15, 2018, the Company paid semi-annual cash dividends each of which totaled
$0.18 per share.
F-43
PLUMAS BANCORP AND SUBSIDIARY
NOTES TO CONSOLIDATED FINANCIAL STATEMENTS
(Continued)
12. SHAREHOLDERS' EQUITY (Continued)
Earnings Per Share
Basic earnings per share is computed by dividing income available to common shareholders by the weighted average
number of common shares outstanding for the period. Diluted earnings per share reflects the potential dilution that
could occur if securities or other contracts to issue common stock, such as stock options, result in the issuance of
common stock which shares in the earnings of the Company. The treasury stock method has been applied to
determine the dilutive effect of stock options in computing diluted earnings per share.
For the Year Ended December 31,
(In thousands, except per share data) 2018 2017 2016
Net Income:
Net income $ 13,992 $ 8,189 $ 7,474
Earnings Per Share:
Basic earnings per share $ 2.74 $ 1.64 $ 1.54
Diluted earnings per share $ 2.68 $ 1.58 $ 1.47
Weighted Average Number of Shares Outstanding:
Basic shares 5,108 5,005 4,864
Diluted shares 5,219 5,185 5,098
Shares of common stock issuable under stock options and warrants for which the exercise prices were greater than
the average market prices were not included in the computation of diluted earnings per share due to their antidilutive
effect. Stock options and warrants not included in the computation of diluted earnings per share, due to shares not
being in the-money and having an antidilutive effect, were 71,100, 0 and 63,000 for the years ended December 31,
2018, 2017 and 2016, respectively. At December 31, 2016 one stock warrant was outstanding to purchase up to
150,000 shares of the Bancorp’s common stock at an exercise price, subject to anti-dilution adjustments, of $5.25
per share.
Warrant
On April 15, 2013 the Company issued a $7.5 million subordinated debenture (“subordinated debt”). The
subordinated debt was issued to an unrelated third-party pursuant to a subordinated debenture purchase agreement,
subordinated debenture note, and stock purchase warrant. On April 16, 2015 the Company paid off the subordinated
debt. The subordinated debt had an interest rate of 7.5% per annum and a term of 8 years with no prepayment
allowed during the first two years and was made in conjunction with an eight-year warrant to purchase up to 300,000
shares of the Bancorp’s common stock, no par value at an exercise price, subject to anti-dilution adjustments, of
$5.25 per share. In May of 2016 the Company repurchased a portion of the warrant, representing the right to purchase
150,000 shares of the registrant’s common stock at a cost of $862 thousand. The remaining warrant represented the
right to purchase 150,000 shares of Plumas Bancorp common stock at an exercise price of $5.25 per share was
scheduled to expire on April 15, 2021. In May 2017 the warrant was exercised in a cashless exercise resulting in the
issuance of 108,112 common shares.
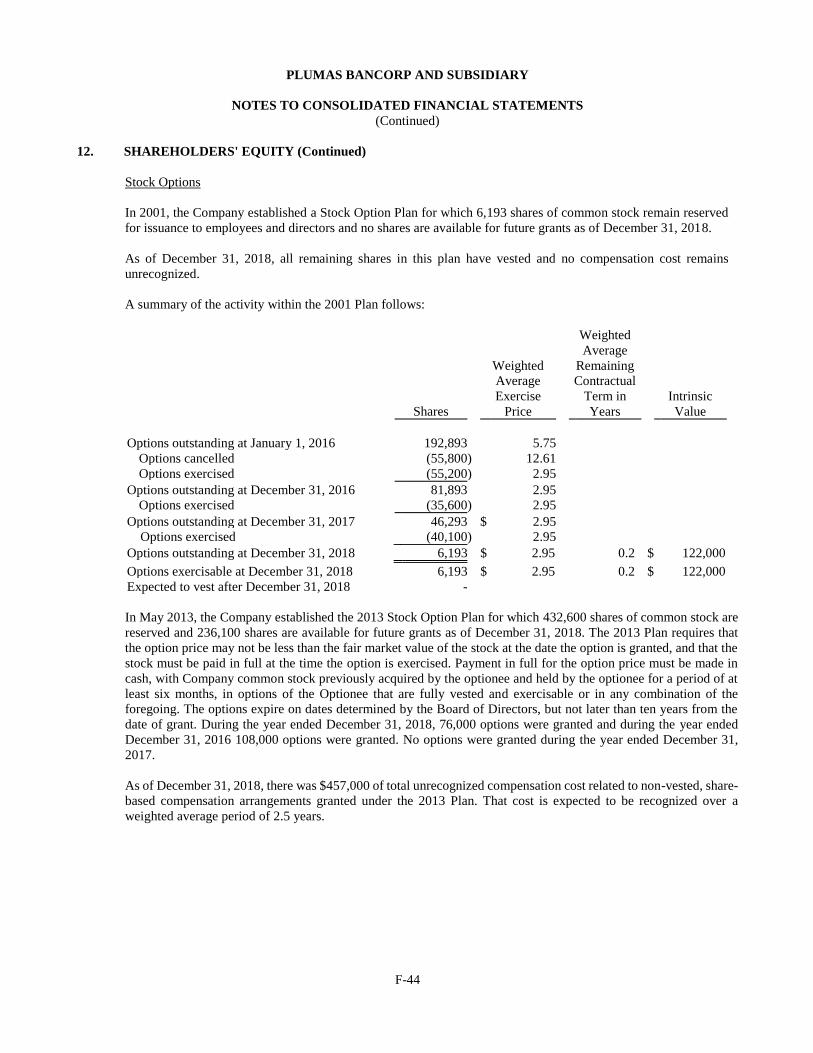
F-44
PLUMAS BANCORP AND SUBSIDIARY
NOTES TO CONSOLIDATED FINANCIAL STATEMENTS
(Continued)
12. SHAREHOLDERS' EQUITY (Continued)
Stock Options
In 2001, the Company established a Stock Option Plan for which 6,193 shares of common stock remain reserved
for issuance to employees and directors and no shares are available for future grants as of December 31, 2018.
As of December 31, 2018, all remaining shares in this plan have vested and no compensation cost remains
unrecognized.
A summary of the activity within the 2001 Plan follows:
Shares
Weighted
Average
Exercise
Price
Weighted
Average
Remaining
Contractual
Term in
Years
Intrinsic
Value
Options outstanding at January 1, 2016 192,893 5.75
Options cancelled (55,800 ) 12.61
Options exercised (55,200 ) 2.95
Options outstanding at December 31, 2016 81,893 2.95
Options exercised (35,600 ) 2.95
Options outstanding at December 31, 2017 46,293 $ 2.95
Options exercised (40,100 ) 2.95
Options outstanding at December 31, 2018 6,193 $ 2.95 0.2 $ 122,000
Options exercisable at December 31, 2018 6,193 $ 2.95 0.2 $ 122,000
Expected to vest after December 31, 2018 -
In May 2013, the Company established the 2013 Stock Option Plan for which 432,600 shares of common stock are
reserved and 236,100 shares are available for future grants as of December 31, 2018. The 2013 Plan requires that
the option price may not be less than the fair market value of the stock at the date the option is granted, and that the
stock must be paid in full at the time the option is exercised. Payment in full for the option price must be made in
cash, with Company common stock previously acquired by the optionee and held by the optionee for a period of at
least six months, in options of the Optionee that are fully vested and exercisable or in any combination of the
foregoing. The options expire on dates determined by the Board of Directors, but not later than ten years from the
date of grant. During the year ended December 31, 2018, 76,000 options were granted and during the year ended
December 31, 2016 108,000 options were granted. No options were granted during the year ended December 31,
2017.
As of December 31, 2018, there was $457,000 of total unrecognized compensation cost related to non-vested, share-
based compensation arrangements granted under the 2013 Plan. That cost is expected to be recognized over a
weighted average period of 2.5 years.
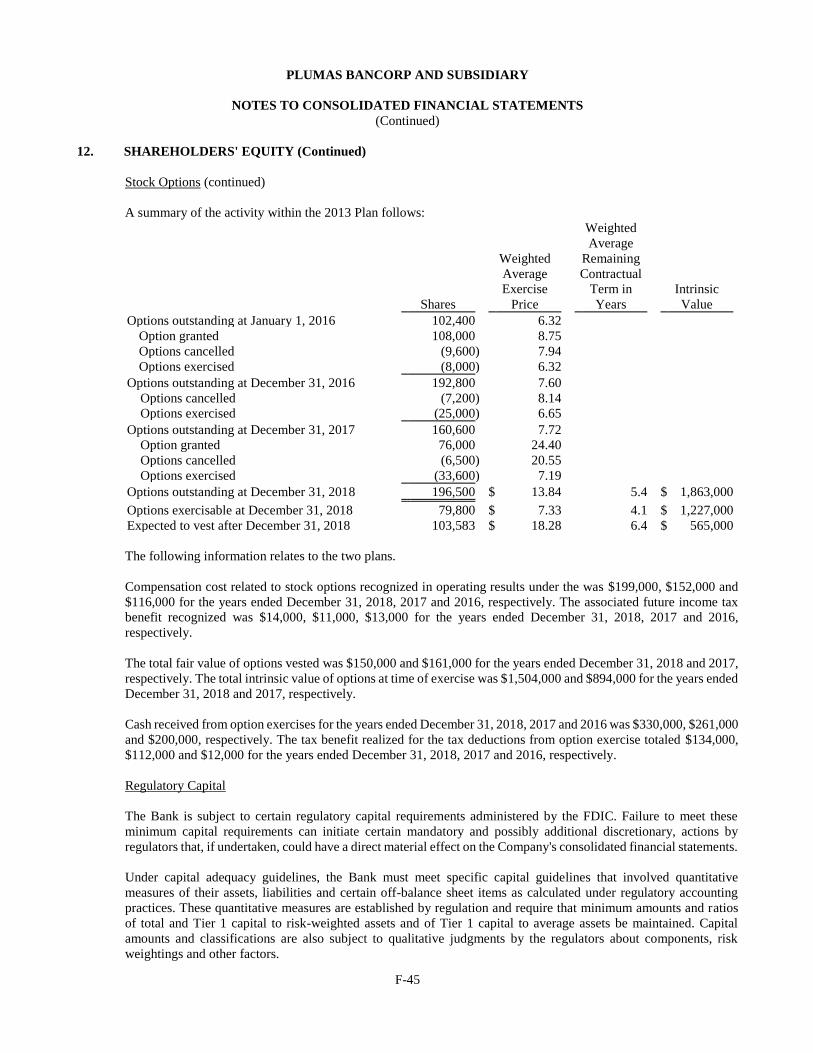
F-45
PLUMAS BANCORP AND SUBSIDIARY
NOTES TO CONSOLIDATED FINANCIAL STATEMENTS
(Continued)
12. SHAREHOLDERS' EQUITY (Continued)
Stock Options (continued)
A summary of the activity within the 2013 Plan follows:
Shares
Weighted
Average
Exercise
Price
Weighted
Average
Remaining
Contractual
Term in
Years
Intrinsic
Value
Options outstanding at January 1, 2016 102,400 6.32
Option granted 108,000 8.75
Options cancelled (9,600 ) 7.94
Options exercised (8,000 ) 6.32
Options outstanding at December 31, 2016 192,800 7.60
Options cancelled (7,200 ) 8.14
Options exercised (25,000 ) 6.65
Options outstanding at December 31, 2017 160,600 7.72
Option granted 76,000 24.40
Options cancelled (6,500 ) 20.55
Options exercised (33,600 ) 7.19
Options outstanding at December 31, 2018 196,500 $ 13.84 5.4 $ 1,863,000
Options exercisable at December 31, 2018 79,800 $ 7.33 4.1 $ 1,227,000
Expected to vest after December 31, 2018 103,583 $ 18.28 6.4 $ 565,000
The following information relates to the two plans.
Compensation cost related to stock options recognized in operating results under the was $199,000, $152,000 and
$116,000 for the years ended December 31, 2018, 2017 and 2016, respectively. The associated future income tax
benefit recognized was $14,000, $11,000, $13,000 for the years ended December 31, 2018, 2017 and 2016,
respectively.
The total fair value of options vested was $150,000 and $161,000 for the years ended December 31, 2018 and 2017,
respectively. The total intrinsic value of options at time of exercise was $1,504,000 and $894,000 for the years ended
December 31, 2018 and 2017, respectively.
Cash received from option exercises for the years ended December 31, 2018, 2017 and 2016 was $330,000, $261,000
and $200,000, respectively. The tax benefit realized for the tax deductions from option exercise totaled $134,000,
$112,000 and $12,000 for the years ended December 31, 2018, 2017 and 2016, respectively.
Regulatory Capital
The Bank is subject to certain regulatory capital requirements administered by the FDIC. Failure to meet these
minimum capital requirements can initiate certain mandatory and possibly additional discretionary, actions by
regulators that, if undertaken, could have a direct material effect on the Company's consolidated financial statements.
Under capital adequacy guidelines, the Bank must meet specific capital guidelines that involved quantitative
measures of their assets, liabilities and certain off-balance sheet items as calculated under regulatory accounting
practices. These quantitative measures are established by regulation and require that minimum amounts and ratios
of total and Tier 1 capital to risk-weighted assets and of Tier 1 capital to average assets be maintained. Capital
amounts and classifications are also subject to qualitative judgments by the regulators about components, risk
weightings and other factors.
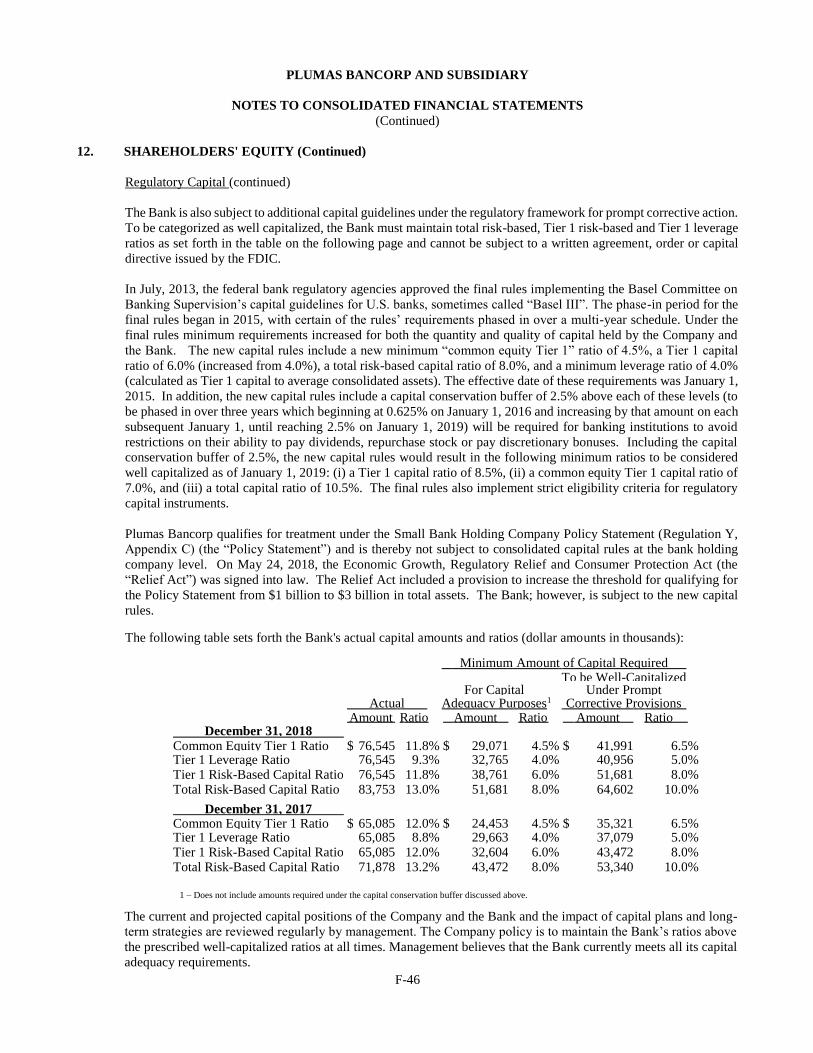
F-46
PLUMAS BANCORP AND SUBSIDIARY
NOTES TO CONSOLIDATED FINANCIAL STATEMENTS
(Continued)
12. SHAREHOLDERS' EQUITY (Continued)
Regulatory Capital (continued)
The Bank is also subject to additional capital guidelines under the regulatory framework for prompt corrective action.
To be categorized as well capitalized, the Bank must maintain total risk-based, Tier 1 risk-based and Tier 1 leverage
ratios as set forth in the table on the following page and cannot be subject to a written agreement, order or capital
directive issued by the FDIC.
In July, 2013, the federal bank regulatory agencies approved the final rules implementing the Basel Committee on
Banking Supervision’s capital guidelines for U.S. banks, sometimes called “Basel III”. The phase-in period for the
final rules began in 2015, with certain of the rules’ requirements phased in over a multi-year schedule. Under the
final rules minimum requirements increased for both the quantity and quality of capital held by the Company and
the Bank. The new capital rules include a new minimum “common equity Tier 1” ratio of 4.5%, a Tier 1 capital
ratio of 6.0% (increased from 4.0%), a total risk-based capital ratio of 8.0%, and a minimum leverage ratio of 4.0%
(calculated as Tier 1 capital to average consolidated assets). The effective date of these requirements was January 1,
2015. In addition, the new capital rules include a capital conservation buffer of 2.5% above each of these levels (to
be phased in over three years which beginning at 0.625% on January 1, 2016 and increasing by that amount on each
subsequent January 1, until reaching 2.5% on January 1, 2019) will be required for banking institutions to avoid
restrictions on their ability to pay dividends, repurchase stock or pay discretionary bonuses. Including the capital
conservation buffer of 2.5%, the new capital rules would result in the following minimum ratios to be considered
well capitalized as of January 1, 2019: (i) a Tier 1 capital ratio of 8.5%, (ii) a common equity Tier 1 capital ratio of
7.0%, and (iii) a total capital ratio of 10.5%. The final rules also implement strict eligibility criteria for regulatory
capital instruments.
Plumas Bancorp qualifies for treatment under the Small Bank Holding Company Policy Statement (Regulation Y,
Appendix C) (the “Policy Statement”) and is thereby not subject to consolidated capital rules at the bank holding
company level. On May 24, 2018, the Economic Growth, Regulatory Relief and Consumer Protection Act (the
“Relief Act”) was signed into law. The Relief Act included a provision to increase the threshold for qualifying for
the Policy Statement from $1 billion to $3 billion in total assets. The Bank; however, is subject to the new capital
rules.
The following table sets forth the Bank's actual capital amounts and ratios (dollar amounts in thousands):
1 – Does not include amounts required under the capital conservation buffer discussed above.
The current and projected capital positions of the Company and the Bank and the impact of capital plans and long-
term strategies are reviewed regularly by management. The Company policy is to maintain the Bank’s ratios above
the prescribed well-capitalized ratios at all times. Management believes that the Bank currently meets all its capital
adequacy requirements.
Minimum Amount of Capital Required To be Well-Capitalized For Capital Under Prompt Actual Adequacy Purposes 1 Corrective Provisions Amount Ratio Amount Ratio Amount Ratio
December 31, 2018 Common Equity Tier 1 Ratio $ 76,545 11.8 % $ 29,071 4.5 % $ 41,991 6.5 % Tier 1 Leverage Ratio 76,545 9.3 % 32,765 4.0 % 40,956 5.0 % Tier 1 Risk-Based Capital Ratio 76,545 11.8 % 38,761 6.0 % 51,681 8.0 % Total Risk-Based Capital Ratio 83,753 13.0 % 51,681 8.0 % 64,602 10.0 % December 31, 2017 Common Equity Tier 1 Ratio $ 65,085 12.0 % $ 24,453 4.5 % $ 35,321 6.5 % Tier 1 Leverage Ratio 65,085 8.8 % 29,663 4.0 % 37,079 5.0 % Tier 1 Risk-Based Capital Ratio 65,085 12.0 % 32,604 6.0 % 43,472 8.0 % Total Risk-Based Capital Ratio 71,878 13.2 % 43,472 8.0 % 53,340 10.0 %
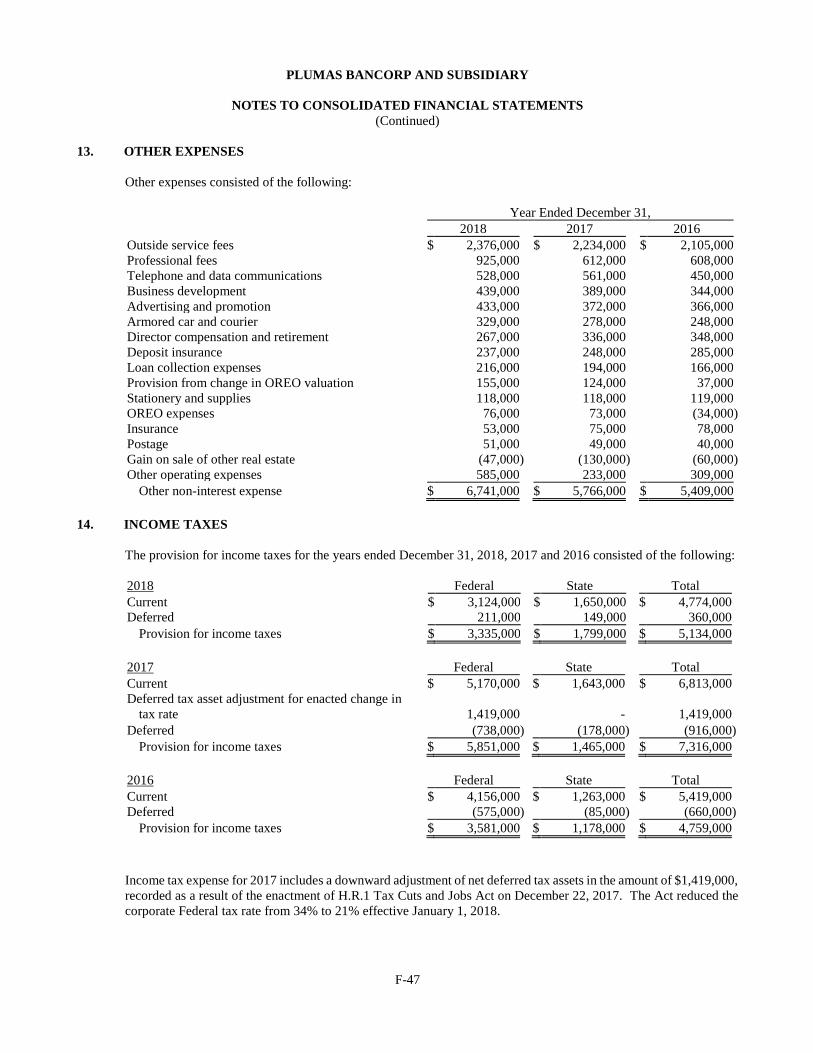
F-47
PLUMAS BANCORP AND SUBSIDIARY
NOTES TO CONSOLIDATED FINANCIAL STATEMENTS
(Continued)
13. OTHER EXPENSES
Other expenses consisted of the following:
Year Ended December 31,
2018 2017 2016
Outside service fees $ 2,376,000 $ 2,234,000 $ 2,105,000
Professional fees 925,000 612,000 608,000
Telephone and data communications 528,000 561,000 450,000
Business development 439,000 389,000 344,000
Advertising and promotion 433,000 372,000 366,000
Armored car and courier 329,000 278,000 248,000
Director compensation and retirement 267,000 336,000 348,000
Deposit insurance 237,000 248,000 285,000
Loan collection expenses 216,000 194,000 166,000
Provision from change in OREO valuation 155,000 124,000 37,000
Stationery and supplies 118,000 118,000 119,000
OREO expenses 76,000 73,000 (34,000 )
Insurance 53,000 75,000 78,000
Postage 51,000 49,000 40,000
Gain on sale of other real estate (47,000 ) (130,000 ) (60,000 )
Other operating expenses 585,000 233,000 309,000
Other non-interest expense $ 6,741,000 $ 5,766,000 $ 5,409,000
14. INCOME TAXES
The provision for income taxes for the years ended December 31, 2018, 2017 and 2016 consisted of the following:
2018 Federal State Total
Current $ 3,124,000 $ 1,650,000 $ 4,774,000
Deferred 211,000 149,000 360,000 Provision for income taxes $ 3,335,000 $ 1,799,000 $ 5,134,000
2017 Federal State Total
Current $ 5,170,000 $ 1,643,000 $ 6,813,000
Deferred tax asset adjustment for enacted change in
tax rate 1,419,000 - 1,419,000
Deferred (738,000 ) (178,000 ) (916,000 )
Provision for income taxes $ 5,851,000 $ 1,465,000 $ 7,316,000
2016 Federal State Total
Current $ 4,156,000 $ 1,263,000 $ 5,419,000
Deferred (575,000 ) (85,000 ) (660,000 )
Provision for income taxes $ 3,581,000 $ 1,178,000 $ 4,759,000
Income tax expense for 2017 includes a downward adjustment of net deferred tax assets in the amount of $1,419,000,
recorded as a result of the enactment of H.R.1 Tax Cuts and Jobs Act on December 22, 2017. The Act reduced the
corporate Federal tax rate from 34% to 21% effective January 1, 2018.
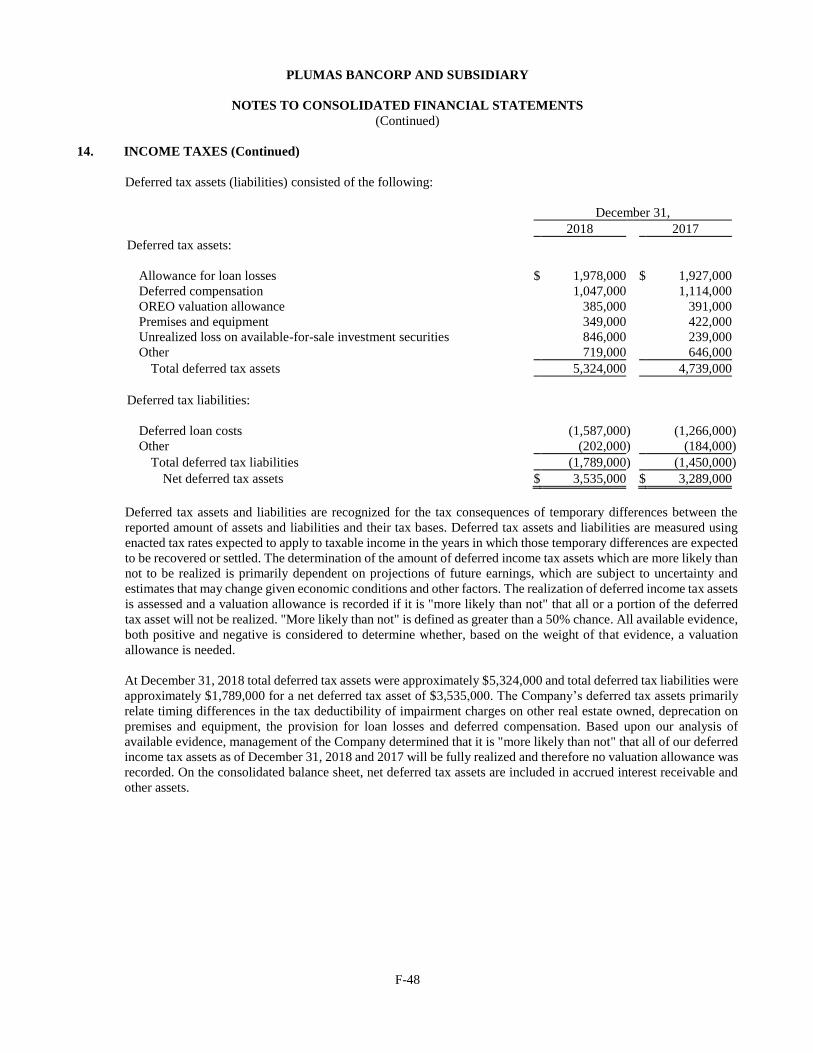
F-48
PLUMAS BANCORP AND SUBSIDIARY
NOTES TO CONSOLIDATED FINANCIAL STATEMENTS
(Continued)
14. INCOME TAXES (Continued)
Deferred tax assets (liabilities) consisted of the following:
December 31,
2018 2017
Deferred tax assets:
Allowance for loan losses $ 1,978,000 $ 1,927,000
Deferred compensation 1,047,000 1,114,000
OREO valuation allowance 385,000 391,000
Premises and equipment 349,000 422,000
Unrealized loss on available-for-sale investment securities 846,000 239,000
Other 719,000 646,000
Total deferred tax assets 5,324,000 4,739,000
Deferred tax liabilities:
Deferred loan costs (1,587,000 ) (1,266,000 )
Other (202,000 ) (184,000 )
Total deferred tax liabilities (1,789,000 ) (1,450,000 )
Net deferred tax assets $ 3,535,000 $ 3,289,000
Deferred tax assets and liabilities are recognized for the tax consequences of temporary differences between the
reported amount of assets and liabilities and their tax bases. Deferred tax assets and liabilities are measured using
enacted tax rates expected to apply to taxable income in the years in which those temporary differences are expected
to be recovered or settled. The determination of the amount of deferred income tax assets which are more likely than
not to be realized is primarily dependent on projections of future earnings, which are subject to uncertainty and
estimates that may change given economic conditions and other factors. The realization of deferred income tax assets
is assessed and a valuation allowance is recorded if it is "more likely than not" that all or a portion of the deferred
tax asset will not be realized. "More likely than not" is defined as greater than a 50% chance. All available evidence,
both positive and negative is considered to determine whether, based on the weight of that evidence, a valuation
allowance is needed.
At December 31, 2018 total deferred tax assets were approximately $5,324,000 and total deferred tax liabilities were
approximately $1,789,000 for a net deferred tax asset of $3,535,000. The Company’s deferred tax assets primarily
relate timing differences in the tax deductibility of impairment charges on other real estate owned, deprecation on
premises and equipment, the provision for loan losses and deferred compensation. Based upon our analysis of
available evidence, management of the Company determined that it is "more likely than not" that all of our deferred
income tax assets as of December 31, 2018 and 2017 will be fully realized and therefore no valuation allowance was
recorded. On the consolidated balance sheet, net deferred tax assets are included in accrued interest receivable and
other assets.
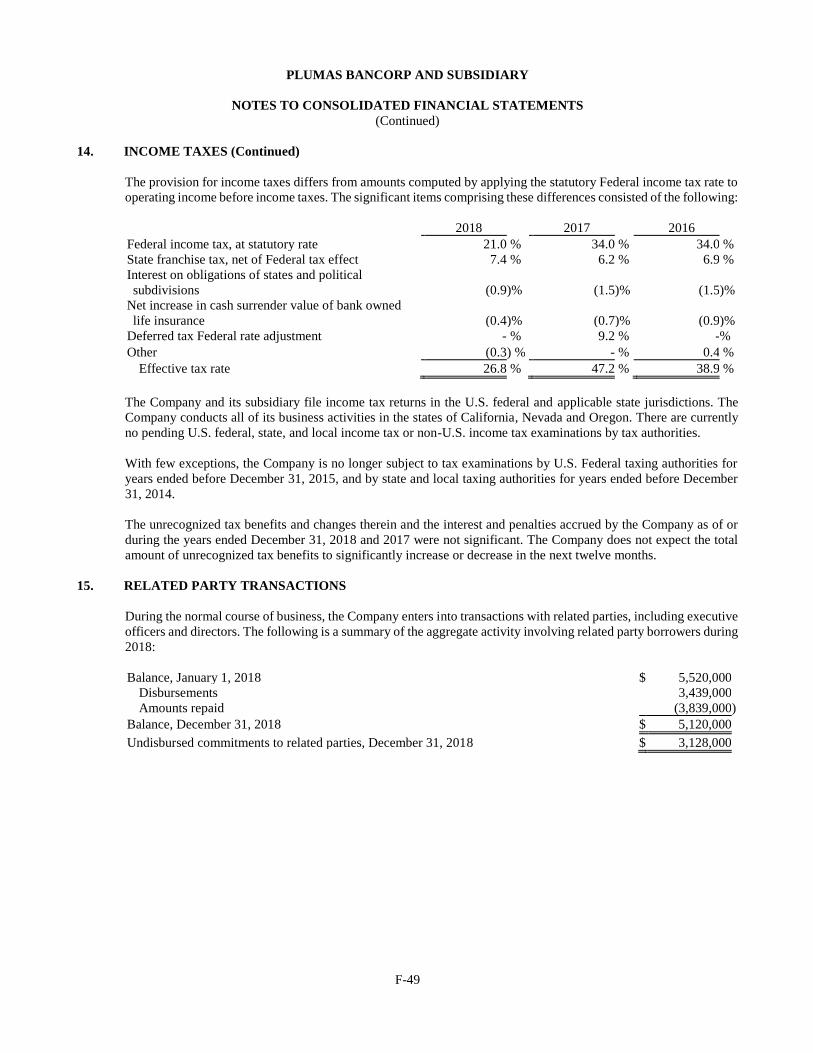
F-49
PLUMAS BANCORP AND SUBSIDIARY
NOTES TO CONSOLIDATED FINANCIAL STATEMENTS
(Continued)
14. INCOME TAXES (Continued)
The provision for income taxes differs from amounts computed by applying the statutory Federal income tax rate to
operating income before income taxes. The significant items comprising these differences consisted of the following:
2018 2017 2016
Federal income tax, at statutory rate 21.0 % 34.0 % 34.0 %
State franchise tax, net of Federal tax effect 7.4 % 6.2 % 6.9 %
Interest on obligations of states and political
subdivisions (0.9 )% (1.5 )% (1.5 )%
Net increase in cash surrender value of bank owned
life insurance (0.4 )% (0.7 )% (0.9 )%
Deferred tax Federal rate adjustment - % 9.2 % - %
Other (0.3 ) % - % 0.4 %
Effective tax rate 26.8 % 47.2 % 38.9 %
The Company and its subsidiary file income tax returns in the U.S. federal and applicable state jurisdictions. The
Company conducts all of its business activities in the states of California, Nevada and Oregon. There are currently
no pending U.S. federal, state, and local income tax or non-U.S. income tax examinations by tax authorities.
With few exceptions, the Company is no longer subject to tax examinations by U.S. Federal taxing authorities for
years ended before December 31, 2015, and by state and local taxing authorities for years ended before December
31, 2014.
The unrecognized tax benefits and changes therein and the interest and penalties accrued by the Company as of or
during the years ended December 31, 2018 and 2017 were not significant. The Company does not expect the total
amount of unrecognized tax benefits to significantly increase or decrease in the next twelve months.
15. RELATED PARTY TRANSACTIONS
During the normal course of business, the Company enters into transactions with related parties, including executive
officers and directors. The following is a summary of the aggregate activity involving related party borrowers during
2018:
Balance, January 1, 2018 $ 5,520,000
Disbursements 3,439,000
Amounts repaid (3,839,000 )
Balance, December 31, 2018 $ 5,120,000
Undisbursed commitments to related parties, December 31, 2018 $ 3,128,000
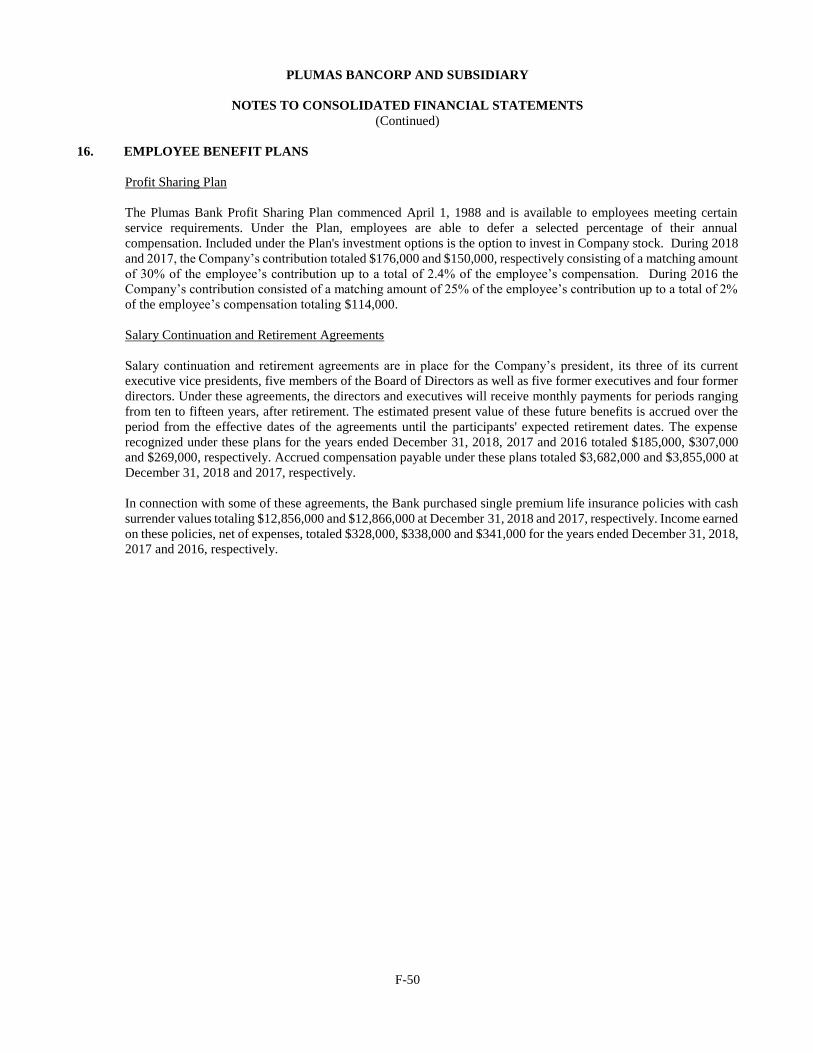
F-50
PLUMAS BANCORP AND SUBSIDIARY
NOTES TO CONSOLIDATED FINANCIAL STATEMENTS
(Continued)
16. EMPLOYEE BENEFIT PLANS
Profit Sharing Plan
The Plumas Bank Profit Sharing Plan commenced April 1, 1988 and is available to employees meeting certain
service requirements. Under the Plan, employees are able to defer a selected percentage of their annual
compensation. Included under the Plan's investment options is the option to invest in Company stock. During 2018
and 2017, the Company’s contribution totaled $176,000 and $150,000, respectively consisting of a matching amount
of 30% of the employee’s contribution up to a total of 2.4% of the employee’s compensation. During 2016 the
Company’s contribution consisted of a matching amount of 25% of the employee’s contribution up to a total of 2%
of the employee’s compensation totaling $114,000.
Salary Continuation and Retirement Agreements
Salary continuation and retirement agreements are in place for the Company’s president, its three of its current
executive vice presidents, five members of the Board of Directors as well as five former executives and four former
directors. Under these agreements, the directors and executives will receive monthly payments for periods ranging
from ten to fifteen years, after retirement. The estimated present value of these future benefits is accrued over the
period from the effective dates of the agreements until the participants' expected retirement dates. The expense
recognized under these plans for the years ended December 31, 2018, 2017 and 2016 totaled $185,000, $307,000
and $269,000, respectively. Accrued compensation payable under these plans totaled $3,682,000 and $3,855,000 at
December 31, 2018 and 2017, respectively.
In connection with some of these agreements, the Bank purchased single premium life insurance policies with cash
surrender values totaling $12,856,000 and $12,866,000 at December 31, 2018 and 2017, respectively. Income earned
on these policies, net of expenses, totaled $328,000, $338,000 and $341,000 for the years ended December 31, 2018,
2017 and 2016, respectively.
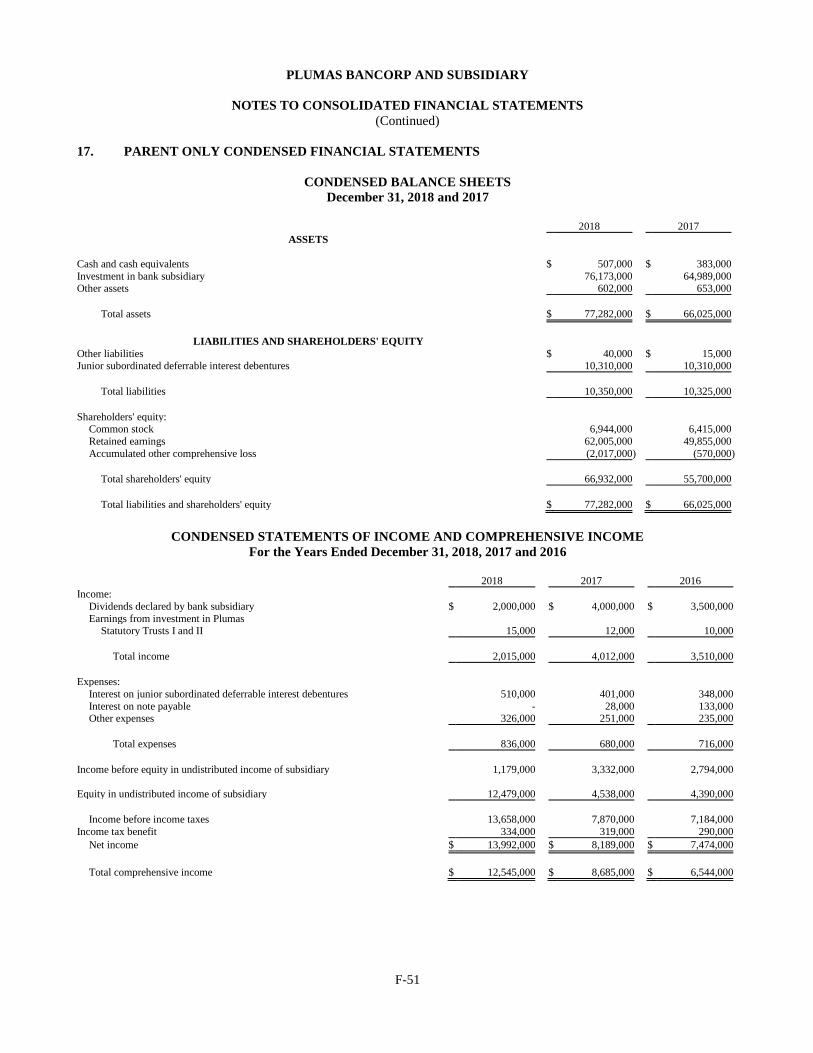
F-51
PLUMAS BANCORP AND SUBSIDIARY
NOTES TO CONSOLIDATED FINANCIAL STATEMENTS
(Continued)
17. PARENT ONLY CONDENSED FINANCIAL STATEMENTS
CONDENSED BALANCE SHEETS
December 31, 2018 and 2017
2018 2017
ASSETS
Cash and cash equivalents $ 507,000 $ 383,000
Investment in bank subsidiary 76,173,000 64,989,000 Other assets 602,000 653,000
Total assets $ 77,282,000 $ 66,025,000
LIABILITIES AND SHAREHOLDERS' EQUITY
Other liabilities $ 40,000 $ 15,000 Junior subordinated deferrable interest debentures 10,310,000 10,310,000
Total liabilities 10,350,000 10,325,000
Shareholders' equity: Common stock 6,944,000 6,415,000
Retained earnings 62,005,000 49,855,000
Accumulated other comprehensive loss (2,017,000 ) (570,000 )
Total shareholders' equity 66,932,000 55,700,000
Total liabilities and shareholders' equity $ 77,282,000 $ 66,025,000
CONDENSED STATEMENTS OF INCOME AND COMPREHENSIVE INCOME
For the Years Ended December 31, 2018, 2017 and 2016
2018 2017 2016
Income:
Dividends declared by bank subsidiary $ 2,000,000 $ 4,000,000 $ 3,500,000
Earnings from investment in Plumas Statutory Trusts I and II 15,000 12,000 10,000
Total income 2,015,000 4,012,000 3,510,000
Expenses:
Interest on junior subordinated deferrable interest debentures 510,000 401,000 348,000
Interest on note payable - 28,000 133,000 Other expenses 326,000 251,000 235,000
Total expenses 836,000 680,000 716,000
Income before equity in undistributed income of subsidiary 1,179,000 3,332,000 2,794,000
Equity in undistributed income of subsidiary 12,479,000 4,538,000 4,390,000
Income before income taxes 13,658,000 7,870,000 7,184,000
Income tax benefit 334,000 319,000 290,000
Net income $ 13,992,000 $ 8,189,000 $ 7,474,000
Total comprehensive income $ 12,545,000 $ 8,685,000 $ 6,544,000
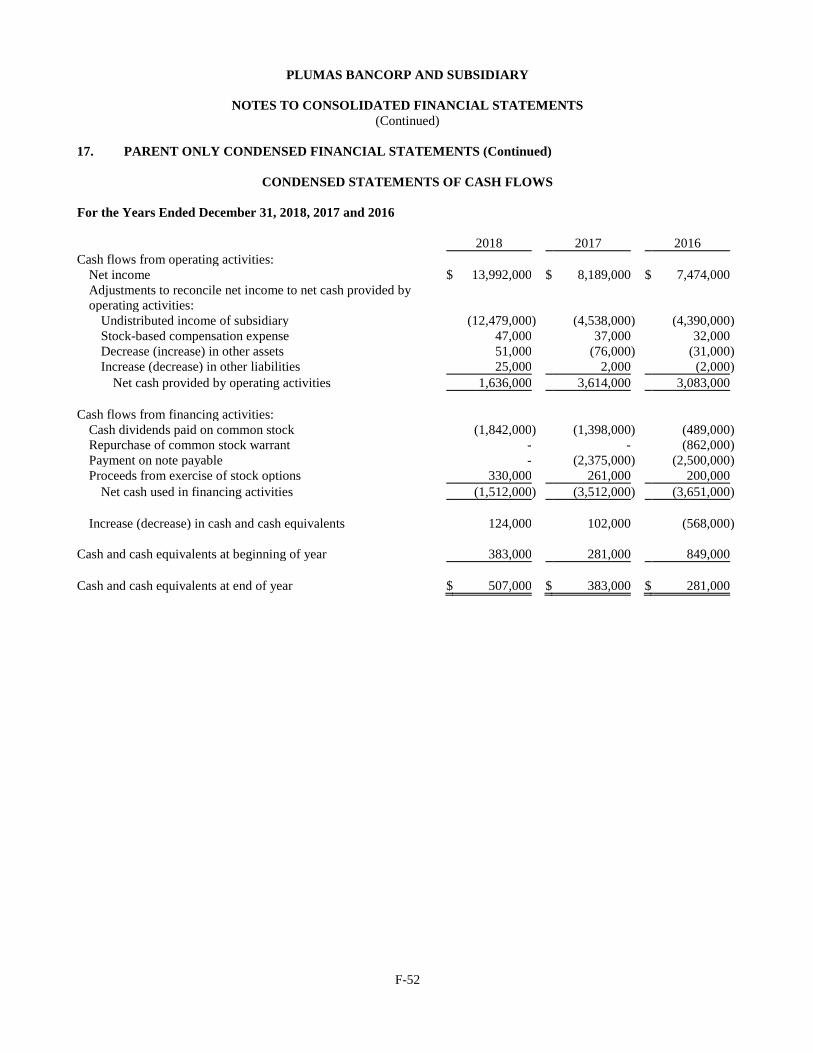
F-52
PLUMAS BANCORP AND SUBSIDIARY
NOTES TO CONSOLIDATED FINANCIAL STATEMENTS
(Continued)
17. PARENT ONLY CONDENSED FINANCIAL STATEMENTS (Continued)
CONDENSED STATEMENTS OF CASH FLOWS
For the Years Ended December 31, 2018, 2017 and 2016
2018 2017 2016
Cash flows from operating activities:
Net income $ 13,992,000 $ 8,189,000 $ 7,474,000
Adjustments to reconcile net income to net cash provided by
operating activities:
Undistributed income of subsidiary (12,479,000 ) (4,538,000 ) (4,390,000 )
Stock-based compensation expense 47,000 37,000 32,000
Decrease (increase) in other assets 51,000 (76,000 ) (31,000 )
Increase (decrease) in other liabilities 25,000 2,000 (2,000 )
Net cash provided by operating activities 1,636,000 3,614,000 3,083,000
Cash flows from financing activities:
Cash dividends paid on common stock (1,842,000 ) (1,398,000 ) (489,000 )
Repurchase of common stock warrant - - (862,000 )
Payment on note payable - (2,375,000 ) (2,500,000 )
Proceeds from exercise of stock options 330,000 261,000 200,000
Net cash used in financing activities (1,512,000 ) (3,512,000 ) (3,651,000 )
Increase (decrease) in cash and cash equivalents 124,000 102,000 (568,000 )
Cash and cash equivalents at beginning of year 383,000 281,000 849,000
Cash and cash equivalents at end of year $ 507,000 $ 383,000 $ 281,000
41
ITEM 9. CHANGES IN AND DISAGREEMENTS WITH ACCOUNTANTS ON ACCOUNTING AND
FINANCIAL DISCLOSURE
None.
ITEM 9A. CONTROLS AND PROCEDURES
Disclosure Controls and Procedures. The Company carried out an evaluation, under the supervision and with the
participation of the Company’s management, including the Company’s CEO and the Company’s CFO, of the effectiveness
of the design and operation of the Company’s disclosure controls and procedures at the end of the period covered by this
report pursuant to Exchange Act Rule 13a-15. Based upon that evaluation, the Company’s CEO and CFO concluded the
Company’s disclosure controls and procedures are effective in ensuring that information relating to the Company, including
its consolidated subsidiaries, required to be disclosed in reports that it files under the Exchange Act is (1) recorded, processed,
summarized and reported within the time periods specified in the SEC’s rules and forms; and (2) accumulated and
communicated to our management, including our CEO and CFO, as appropriate to allow timely decisions regarding required
disclosure.
Changes in Internal Control over Financial Reporting. During the fourth quarter of 2018, no change in the Company’s
internal control over financial reporting was identified in connection with this evaluation that has materially affected or is
reasonably likely to materially affect internal control over financial reporting.
Management’s Report on Internal Control over Financial Reporting and the Report of Independent Registered Public
Accounting Firm are set forth in our consolidated financial statements and the reports thereon beginning at page F-1.
ITEM 9B. OTHER INFORMATION
None.
PART III
ITEM 10. DIRECTORS, EXECUTIVE OFFICERS AND CORPORATE GOVERNANCE
The information required by Item 10 can be found in Plumas Bancorp’s Definitive Proxy Statement pursuant to
Regulation 14A under the Securities Exchange Act of 1934, and is by this reference incorporated herein.
ITEM 11. EXECUTIVE COMPENSATION
The information required by Item 11 can be found in Plumas Bancorp’s Definitive Proxy Statement pursuant to
Regulation 14A under the Securities Exchange Act of 1934, and is by this reference incorporated herein.
ITEM 12. SECURITY OWNERSHIP OF CERTAIN BENEFICIAL OWNERS AND MANAGEMENT AND
RELATED STOCKHOLDER MATTERS
The information required by Item 12 can be found in Plumas Bancorp’s Definitive Proxy Statement pursuant to
Regulation 14A under the Securities Exchange Act of 1934, and is by this reference incorporated herein.
ITEM 13. CERTAIN RELATIONSHIPS AND RELATED TRANSACTIONS, AND DIRECTOR
INDEPENDENCE
The information required by Item 13 can be found in Plumas Bancorp’s Definitive Proxy Statement pursuant to
Regulation 14A under the Securities Exchange Act of 1934, and is by this reference incorporated herein.
ITEM 14. PRINCIPAL ACCOUNTANT FEES AND SERVICES
The information required by Item 14 can be found in Plumas Bancorp’s Definitive Proxy Statement pursuant to
Regulation 14A under the Securities Exchange Act of 1934, and is by this reference incorporated herein.
42
PART IV
ITEM 15. EXHIBITS AND FINANCIAL STATEMENT SCHEDULES
(a) Exhibits
The following documents are included or incorporated by reference in this Annual Report on Form 10K:
3.1
Articles of Incorporation as amended of Registrant included as exhibit 3.1 to the Registrant’s Form S-4, File
No. 333-84534, which is incorporated by reference herein.
3.2
Bylaws of Registrant as amended on March 16, 2011 included as exhibit 3.2 to the Registrant’s Form 10-K for
December 31, 2010, which is incorporated by this reference herein.
3.3
Amendment of the Articles of Incorporation of Registrant dated November 1, 2002, is included as exhibit 3.3
to the Registrant’s 10-Q for September 30, 2005, which is incorporated by this reference herein.
3.4
Amendment of the Articles of Incorporation of Registrant dated August 17, 2005, is included as exhibit 3.4 to
the Registrant’s 10-Q for September 30, 2005, which is incorporated by this reference herein.
4
Specimen form of certificate for Plumas Bancorp included as exhibit 4 to the Registrant’s Form S-4, File
No. 333-84534, which is incorporated by reference herein.
10.1
Executive Salary Continuation Agreement of Andrew J. Ryback dated December 17, 2008, is included as
exhibit 10.1 to the Registrant’s 10-K for December 31, 2008, which is incorporated by this reference herein.
10.2
Split Dollar Agreement of Andrew J. Ryback dated August 23, 2005, is included as Exhibit 10.2 to the
Registrant’s 8-K filed on October 17, 2005, which is incorporated by this reference herein.
10.4
Stock Purchase Warrant dated April 15, 2013, is included as Exhibit 10.4 to the Registrant’s 10-Q filed on May
10, 2013, which is incorporated by this reference herein.
10.6
Promissory Note Dated October 24, 2013, is included as Exhibit 10.6 to the Registrant’s 10-Q filed on
November 7, 2013, which is incorporated by this reference herein.
10.8
Director Retirement Agreement of John Flournoy dated March 21, 2007, is included as Exhibit 10.8 to
Registrant’s 10-Q for March 31, 2007, which is incorporated by this reference herein.
10.9
Amendment to Salary Continuation Agreement of Andrew J. Ryback dated April 1, 2016, is included as
Exhibit 10.1 to the Registrant’s 8-K filed on April 4, 2016, which is incorporated by this reference herein.
10.10
Salary Continuation Agreement of Richard L. Belstock dated April 1, 2016, is included as Exhibit 10.2 to the
Registrant’s 8-K filed on April 4, 2016, which is incorporated by this reference herein.
10.11
Salary Continuation Agreement of Kerry D. Wilson dated April 1, 2016, is included as Exhibit 10.3 to the
Registrant’s 8-K filed on April 4, 2016, which is incorporated by this reference herein.
10.12
Salary Continuation Agreement of BJ North dated April 1, 2016, is included as Exhibit 10.4 to the Registrant’s
8-K filed on April 4, 2016, which is incorporated by this reference herein.
10.13 Director Retirement Agreement of Steven M. Coldani dated December 21, 2016, is included as Exhibit 10.13
to the Registrant’s 10-K filed on March 17, 2017, which is incorporated by this reference herein.
10.18
Amended and Restated Director Retirement Agreement of Daniel E. West dated May 10, 2000, is included as
Exhibit 10.18 to the Registrant’s 10-QSB for June 30, 2002, which is incorporated by this reference herein.
10.19
Consulting Agreement of Daniel E. West dated May 10, 2000, is included as Exhibit 10.19 to the Registrant’s
10-QSB for June 30, 2002, which is incorporated by this reference herein.
43
10.24
Amended and Restated Director Retirement Agreement of Gerald W. Fletcher dated May 10, 2000, is included
as Exhibit 10.24 to the Registrant’s 10-QSB for June 30, 2002, which is incorporated by this reference herein.
10.25
Consulting Agreement of Gerald W. Fletcher dated May 10, 2000, is included as Exhibit 10.25 to the
Registrant’s 10-QSB for June 30, 2002, which is incorporated by this reference herein.
10.33
Amended and Restated Director Retirement Agreement of Terrance J. Reeson dated April 19, 2000, is included
as Exhibit 10.33 to the Registrant’s 10-QSB for June 30, 2002, which is incorporated by this reference herein.
10.34
Consulting Agreement of Terrance J. Reeson dated May 10, 2000, is included as Exhibit 10.34 to the
Registrant’s 10-QSB for June 30, 2002, which is incorporated by this reference herein.
10.41
Form of Indemnification Agreement (Plumas Bancorp) is included as Exhibit 10.41 to the Registrant’s 10-Q
for March 31, 2009, which is incorporated by this reference herein.
10.42
Form of Indemnification Agreement (Plumas Bank) is included as Exhibit 10.42 to the Registrant’s 10-Q for
March 31, 2009, which is incorporated by this reference herein.
10.47
2013 Stock Option Plan is included as exhibit 99.1 of the Form S-8 filed September 12, 2013, which is
incorporated by this reference herein.
10.48
Specimen Form of Incentive Stock Option Agreement under the 2013 Stock Option Plan is included as exhibit
99.2 of the Form S-8 filed September 12, 2013, which is incorporated by this reference herein.
10.49
Specimen Form of Nonqualified Stock Option Agreement under the 2013 Stock Option Plan is included as
exhibit 99.3 of the Form S-8 filed September 12, 2013, which is incorporated by this reference herein.
10.51
First Amendment to Split Dollar Agreement of Andrew J. Ryback, is included as exhibit 10.51 to the
Registrant’s 10-K for December 31, 2008, which is incorporated by this reference herein.
10.66
Director Retirement Agreement of Robert McClintock, is included as Exhibit 10.66 to the Registrant’s 10-K
filed on March 23, 2012, which is incorporated by this reference herein.
10.67
First Amendment to the Plumas Bank Amended and Restated Director Retirement Agreement for Terrance J.
Reeson adopted on September 19, 2007, is included as Exhibit 10.67 to the Registrant’s 8-K filed on
September 25, 2007, which is incorporated by this reference herein.
10.69
First Amendment to the Plumas Bank Amended and Restated Director Retirement Agreement for Daniel E.
West adopted on September 19, 2007, is included as Exhibit 10.69 to the Registrant’s 8-K filed on September
25, 2007, which is incorporated by this reference herein.
10.70
First Amendment to the Plumas Bank Amended and Restated Director Retirement Agreement for Gerald W.
Fletcher adopted on October 9, 2007, is included as Exhibit 10.70 to the Registrant’s 10-Q for September 30,
2007, which is incorporated by this reference herein.
11
Computation of per share earnings appears in the attached 10-K under Item 8 Financial Statements Plumas
Bancorp and Subsidiary Notes to Consolidated Financial Statements as Footnote 12 – Shareholders’ Equity.
21.01 Plumas Bank – California.
21.02 Plumas Statutory Trust I – Connecticut.
21.03 Plumas Statutory Trust II – Delaware.
23.01* Independent Registered Public Accountant’s Consent dated March 7, 2019.
31.1* Rule 13a-14(a) [Section 302] Certification of Principal Financial Officer dated March 7, 2019.
31.2* Rule 13a-14(a) [Section 302] Certification of Principal Executive Officer dated March 7, 2019.
44
32.1*
Certification of Principal Financial Officer pursuant to 18 U.S.C. Section 1350, As Adopted Pursuant to Section
906 of the Sarbanes-Oxley Act of 2002 dated March 7, 2019.
32.2*
Certification of Principal Executive Officer pursuant to 18 U.S.C. Section 1350, As Adopted Pursuant to Section
906 of the Sarbanes-Oxley Act of 2002 dated March 7, 2019.
101.INS* XBRL Instance Document.
101.SCH* XBRL Taxonomy Schema.
101.CAL* XBRL Taxonomy Calculation Linkbase.
101.DEF* XBRL Taxonomy Definition Linkbase.
101.LAB* XBRL Taxonomy Label Linkbase.
101.PRE* XBRL Taxonomy Presentation Linkbase.
* Filed herewith
45
SIGNATURES
Pursuant to the requirements of Section 13 or 15(d) of the Securities Exchange Act of 1934, the Registrant has duly caused
this report to be signed on its behalf by the undersigned, thereunto duly authorized.
PLUMAS BANCORP
(Registrant)
Date: March 7, 2019
/s/ ANDREW J. RYBACK
Andrew J. Ryback,
President, Chief Executive Officer and Director
Pursuant to the requirements of the Securities Exchange Act of 1934, this report has been signed below by the following
persons on behalf of the registrant and in the capacities and on the date indicated.
/s/ ANDREW J. RYBACK Dated: March 7, 2019
Andrew J. Ryback,
President, Chief Executive Officer and Director
/s/ RICHARD L. BELSTOCK Dated: March 7, 2019
Richard L. Belstock,
Executive Vice President and Chief Financial Officer
/s/ DANIEL E. WEST Dated: March 7, 2019
Daniel E. West, Director and Chairman of the Board
/s/ TERRANCE J. REESON Dated: March 7, 2019
Terrance J. Reeson, Director and Vice Chairman of the Board
Michonne R. Ascuaga, Director
/s/ STEVEN M. COLDANI Dated: March 7, 2019
Steven M. Coldani, Director
/s/ W. E. ELLIOTT Dated: March 7, 2019
William E. Elliott, Director
Gerald W. Fletcher, Director
/s/ RICHARD F. KENNY Dated: March 7, 2019
Richard F. Kenny, Director
/s/ ROBERT J. MCCLINTOCK Dated: March 7, 2019
Robert J. McClintock, Director


23
You may request an additional copy of the proxy statement, 10-K, 2018 annual report to shareholders, and form of proxy as to this Meeting or all future shareholder meetings by calling us at 1.888.375.8627, by writing to us at Plumas Bancorp, 35 S. Lindan Avenue, Quincy, California 95971, Attn: Ms. Elizabeth Kuipers, Vice President and Investor Relations Officer, or by email at [email protected].
Year Ended December 31, 2018
Dear shareholder,
I am thrilled to report that Plumas Bancorp delivered another year of record earningsperformance, exceeding previous records for all four quarters in 2018. This accomplishment hasresulted in Plumas Bank being selected by Raymond James as the second top performingcommunity bank in the country! The Raymond James 2018 Community Banker’s Cup wasawarded for exceptional performance and to reward our Company for building long termshareholder value. Moreover, S&P Global Market Intelligence named Plumas Bank one of theBest performing Community Banks of 2018! Our performance was driven by strong loan anddeposit growth. We also maintained excellent asset quality metrics and continued our focus onimproving overall efficiency.
Enhancing Shareholder ValueThese operating results enhanced shareholder value by increasing tangible book value andproviding a return on average equity significantly higher than peer institutions. Our strongearnings enabled us to pay a $0.36 per share cash dividend which exceeded the dividend paid inthe prior year by 28%.
Investing in our TeamAll of this was accomplished while we continued to invest in our team members. We believestrongly that our ability to attract and retain the highest quality staff is an important part of ourcapacity for achieving success. Because of that, we increased the Company’s minimum wage to$15 per hour to help in our effort of recruiting and retaining the most talented and hardworkingstaff at all levels.
We are also very focused on the health and well being of our employees so for the past threeyears, Plumas Bank has offered a robust corporate wellness plan that provides incentives for ourteam members to live more active, healthy lives. And in addition to investing in their physicalwellness, Plumas Bank is investing in the financial wellness of our team by expanding our bonusplan beyond corporate officers to include all employees. What’s more, we increased our 401(k)match to help our employees better prepare for their retirement.
Taking Care of our CommunitiesFinally, for our communities, we have been focused on engagement by reaching out inmeaningful ways to the communities that we serve. In fact, we are proud to share that in thepast year, Plumas Bank has provided over $100 thousand in cash contributions to communityfund raising activities and our employees have spent more than 1,660 volunteer hours reaching

out to over 50 organizations within our communities. In September, we were able todemonstrate our commitment to community by donating $25,000 to aid the victims of thedevastating fires in Shasta County. Additionally, our Redding team embraced our motto, ‘HERE.For Good.’ and volunteered over 130 hours working at various shelters, food banks, and otherlocal fire relief organizations to help those in need. The government shutdown provided yetanother opportunity for our Company to demonstrate that we are fully invested in the welfareof our local communities. During the shutdown, Plumas Bank allowed depositors, directlyaffected by the shutdown, to overdraw direct deposit accounts by up to 80 percent of theirmonthly paycheck for up to three months.
Also, during 2018, we successfully executed on our strategic priorities, most notably ourtechnology initiatives and our expansion into Carson City, Nevada and the Sierra region.Additionally, we hired two experienced commercial/agricultural lending professionals who willbe tremendous assets to our clients. One loan officer will serve the Carson City/ Sierra regionarea and the other will serve the Red Bluff/Tehama County area.
In closing, with our solid level of capital and our robust earnings momentum, we believe thatPlumas Bancorp is well positioned to continue its strong growth and high returns in 2019. Wecontinue to monitor the competitive landscape and make strategic investments in our businessthat are well aligned with the interests of our shareholders, employees, clients and communities.As we move forward, we will continue to look for novel and inspiring ways to demonstrate to allour stakeholders that Plumas Bank is HERE. For Good.
Andrew J. Ryback Daniel E. West Director, President & Director, Chairman Chief Executive Officer of the Board
Dear Shareholder:
You are cordially invited to attend the annual meeting of shareholders of Plumas Bancorp (the “Company”), which will be held at the Plumas Bank Credit Administration Building located at 32 Central Avenue, Quincy, California, on Wednesday, May 15, 2019 at 9:30 a.m. At this annual meeting, shareholders will be asked to (i) elect nine directors for the next year, (ii) approve the Company’s executive compensation on an advisory (non-binding) basis, (iii) vote on the frequency of future advisory votes on executive compensation on an advisory (non-binding basis) and (iv) ratify the appointment of Vavrinek, Trine, Day & Company, LLP as our independent auditors for the fiscal year ending December 31, 2019.
The Company is requesting your proxy to vote at the annual meeting. The Board of Directors of the Company recommends that you vote “FOR” the election of each of the nominees for director and “FOR” proposals Two and Four and vote for a frequency of every three (3) years on proposal Three. The proxy statement contains information about each of the nominees for directors, the Company’s executive compensation, and each of the other proposals for shareholder vote.
To ensure that your vote is represented at this important meeting, please sign, date and return the proxy card in the enclosed envelope as promptly as possible. As an alternative to using your paper proxy card to vote, you may also vote by telephone or over the internet by following the instructions on your proxy card.
Sincerely,
Andrew J. Ryback President and Chief Executive Officer The date of this proxy statement is March 29, 2019.
ii
TABLE OF CONTENTS
PageNotice of Annual Meeting iii General Information 1 Revocability of Proxies and Proxy Voting 2 Persons Making the Solicitation 2 Voting Securities 3 Shareholdings of Certain Beneficial Owners and Management 4 Section 16(a) Beneficial Ownership Compliance 5 Proposal No. 1—Election of Directors 6
Board of Directors 6 Director Experience and Qualifications 7
Board Matters 9 The Board of Directors and Committees 9 Shareholder Communication with the Board of Directors 9 Board Role in Risk Oversight 10 Leadership Structure of Board 11 Code of Ethics 11 Director Independence 11 Audit Committee 11 Audit Committee Report 12 Corporate Governance Committee 12
Proposal No. 2 - Non-Binding Advisory Vote on Executive Compensation 14 Proposal No. 3 - Approve a Non-Binding Advisory Vote on The Frequency of The Advisory Vote
on The Compensation of Our Named Executive Officers 14 Executive Officers 15 Executive Compensation 16
Summary Compensation Table 16 Non-Equity Incentive Plan 16 Stock Option Awards 17 Post-Employment Benefits and Potential Payments Upon Termination or Change of Control 18 Perquisites 19 Outstanding Equity Awards at December 31, 2018 19
Compensation of Directors 20 Director Compensation Table 20 Director Retirement Agreements 20 Post-Retirement Consulting Agreements 21
Proposal No. 4 - Ratification of Appointment of Independent Auditors 21 Fees Paid to Independent Auditors 21
Shareholder Proposals 22 Nomination of Director Candidates 22 Copy of Bylaw Provisions 22
Certain Transactions 22 Other Matters 22 Available Information 22
iii
Notice of Annual Meeting of Shareholders Plumas Bancorp
To: The Shareholders of Plumas Bancorp
Notice is hereby given of the Annual Meeting of Shareholders of Plumas Bancorp. The meeting will be held at the Plumas Bank Credit Administration Building located at 32 Central Avenue, Quincy, California, on Wednesday, May 15, 2019 at 9:30 a.m., for the purpose of considering and voting upon the following matters: 1. Election of Directors. To elect nine persons to serve as directors of Plumas Bancorp until their
successors are duly elected and qualified.
Michonne R. Ascuaga Robert J. McClintock Steven M. Coldani Terrance J. Reeson William E. Elliott Andrew J. Ryback Gerald W. Fletcher Daniel E. West Richard F. Kenny
2. Advisory Vote on Executive Compensation. To approve the Company’s executive compensationon an advisory (non-binding) basis.
3. Advisory Vote on Frequency of Vote on Executive Compensation. To vote on the frequency of future advisory votes on the Company’s executive compensation program on an advisory (non-binding) basis.
4. Ratification of the Appointment of Independent Auditors. To vote on the ratification of the appointment of Vavrinek, Trine, Day & Company, LLP as our independent auditors for the fiscal year ending December 31, 2019.
5. Transaction of Other Business. To transact such other business as may properly come before themeeting and any adjournment or adjournments thereof.
The Board of Directors has fixed the close of business on March 29, 2019 as the record date for determining shareholders entitled to notice of, and the right to vote at, the meeting. This matters and other matters relating to Annual Meeting are described in the attached proxy statement. You are urged to vote in favor of the election of all of the nominees for directors, to vote “FOR” approval of the Company’s executive compensation on an advisory (non-binding) basis, for a future advisory votes on Company’s executive compensation to be held every THREE years, and “FOR” the ratification of the appointment of Vavrinek, Trine, Day & Company, LLP as our independent auditors for the fiscal year ending December 31, 2019, by signing and returning the enclosed proxy as promptly as possible, whether or not you plan to attend the meeting in person. As an alternative to using your paper proxy card to vote, you may also vote by telephone or over the internet by following the instructions on your proxy card. If you do attend the meeting, you may then withdraw your proxy. The proxy may be revoked at any time prior to its exercise.
By Order of the Board of Directors,
Dated: March 29, 2019 Terrance J. Reeson, Vice Chairman and Secretary

[THIS PAGE INTENTIONALLY LEFT BLANK]
1
Plumas Bancorp Proxy Statement
Annual Meeting of Shareholders May 15, 2019
Plumas Bancorp (the “Company”) is providing this proxy statement to its shareholders in connection with the annual meeting of shareholders to be held at the Plumas Bank Credit Administration Building located at 32 Central Avenue, Quincy, California, on Wednesday, May 15, 2019 at 9:30 a.m. and at any and all adjournments or postponements thereof (the “Meeting”).
It is expected that the Company will mail this proxy statement and accompanying notice and form of proxy to shareholders on or about April 4, 2019.
Shareholders may also view this proxy statement and the 2018 Annual Report to Shareholders on the internet at http://materials.proxyvote.com/729273.
General Information Voting By Proxy. Whether or not you plan to attend the Meeting, you may submit a proxy to vote the shares registered in your name via internet, telephone or mail as more fully described below:
By Internet: Go to http://www.proxyvote.com and follow the instructions. You will need information from your proxy card or electronic delivery notice to submit your proxy.
By Telephone: Call 1.800.690.6903 and follow the voice prompts. You will need
information from your proxy card or electronic delivery notice to submit your proxy. By Mail: Mark your vote, sign your name exactly as it appears on your proxy card, date
your proxy card and return it in the envelope provided.
If a bank, broker or other nominee holds your shares, you will receive voting instructions directly from the holder of record. All shares represented by valid proxies that we receive through this solicitation, and that are not revoked, will be voted in accordance with your instructions on the proxy card or as instructed via internet or telephone. If you properly submit a proxy without giving specific voting instructions, your shares will be voted in accordance with the Board’s recommendations “FOR”:
Proposal 1: Election to the Board of all the nine director nominees named in this proxy statement;
Proposal 2: Approval of the Company’s executive compensation on an advisory (non-binding) basis;
Proposal 3: Future advisory votes on the Company’s executive compensation program to
be held everything THREE years;
Proposal 4: Ratification of the appointment of Vavrinek, Trine, Day & Company, LLP as our independent auditors for the fiscal year ending December 31, 2019.
If other matters properly come before the Meeting, the persons appointed to vote the proxies will
vote on such matters in accordance with their best judgment. Such persons also have discretionary authority to vote to adjourn the Meeting, including for soliciting proxies to vote in accordance with the recommendations of the Board of Directors (the “Board”) on any of the above items.
2
Revocability of Proxies and Proxy Voting You may revoke your proxy at any time before it is exercised by:
written notice of revocation delivered to Terrance J. Reeson, Corporate Secretary of Plumas Bancorp, at 35 S. Lindan Avenue, Quincy, California 95971;
a properly executed proxy of a later date mailed to the Company; casting a new vote by telephone or internet; or voting in person at the Meeting if you are the record holder.
If you are a street name shareholder and you voted by proxy, you may revoke your proxy by informing the holder of record in accordance with that entity’s procedures. In addition, the powers of the proxy holders will be revoked if the person executing the proxy is present at the Meeting and elects to vote in person. Subject to such revocation or suspension, the proxy holders will vote all shares represented by a properly executed proxy received in time for the Meeting in accordance with the instructions on the proxy.
If no instruction is specified by the shareholder with regard to the matter on the proxy to be acted upon, the proxy holders will vote the shares represented by the proxy “FOR” each of the nominees for directors, “FOR” approval of the Company’s executive compensation program on advisory (non-binding) basis, for future advisory votes on our executive compensation program to be held every THREE years and “FOR” the ratification of the appointment of Vavrinek, Trine, Day & Company, LLP as our independent auditors for the fiscal year ending December 31, 2019. If any other matter is presented at the meeting, the proxy holders will vote in accordance with the recommendations of management.
Persons Making the Solicitation
The Board of Directors of the Company is soliciting proxies. The Company will bear the expense of preparing, assembling, printing and mailing this proxy statement and the material used in the solicitation of proxies for the Meeting. The Company contemplates that proxies will be solicited principally using the mail, but officers, directors and employees of the Company may solicit proxies personally or by telephone, without receiving special compensation for the solicitation. Although there is no formal agreement to do so, the Company will reimburse banks, brokerage houses and other custodians, nominees and fiduciaries for their reasonable expenses in forwarding these proxy materials to their principals. In addition, the Company may utilize the services of individuals or entities not regularly employed by the Company in connection with the solicitation of proxies, if management of the Company determines that this is advisable.
3
Voting Securities
The Board of Directors of the Company has fixed March 29, 2019 as the record date for purposes of determining the shareholders entitled to notice of, and to vote at, the Meeting. On March 29, 2019, there were 5,150,876 shares of the Company’s common stock issued and outstanding. Each holder of the Company’s common stock will be entitled to one vote for each share of the Company’s common stock held of record on the Company’s books as of the record date. In connection with the election of directors, shares may be voted cumulatively if a shareholder present at the Meeting gives notice at the Meeting, prior to the voting for election of directors, of his or her intention to vote cumulatively. If any shareholder of the Company gives that notice, then all shareholders eligible to vote will be entitled to cumulate their shares in voting for election of directors. Cumulative voting allows a shareholder to cast a number of votes equal to the number of shares held in his or her name as of the record date, multiplied by the number of directors to be elected. These votes may be cast for any one nominee, or may be distributed among as many nominees as the shareholder sees fit. This proxy statements seeks discretionary authority to cumulate votes. If cumulative voting is declared at the Meeting, votes represented by proxies delivered pursuant to this proxy statement may be cumulated and allocated at the discretion of the proxy holders, in accordance with management’s recommendation.
The nine nominees for director receiving the most votes will be elected. Therefore, shares voted “withhold” and broker non-votes will have no impact on the outcome of the election of directors. Proposal 2, the advisory vote on the Company’s executive compensation program, requires the approval of a majority of the shares represented and voting at the Meeting, with affirmative votes constituting at least a majority of the required quorum. With respect to proposal 3, the advisory proposal concerning the frequency of future advisory votes on the Company’s executive compensation program, the Board will consider the alternative (one, two or three years) receiving the most vote to be the preference of the shareholders. Proposal 4 regarding the ratification of the appointment of the Company’s auditors requires the approval of a majority of the shares represented and voting at the Meeting, with affirmative votes constituting at least a majority of the required quorum. Therefore, shares voted “withhold” and broker non-votes will have no impact on the outcome of Proposals 2 or 4 assuming that the affirmative votes constitute at least a majority of the required quorum and will have no impact on Proposal 3.
4
Shareholdings of Certain Beneficial Owners and Management
Management of the Company knows of no person who owns, beneficially or of record, either individually or together with associates, five percent or more of the outstanding shares of the Company’s common stock, except as set forth in the table below. The following table sets forth, as of March 15, 2019, the number and percentage of shares of the Company’s outstanding common stock beneficially owned, directly or indirectly, by (1) shareholders know by the Company to beneficially own 5% or more of the outstanding shares of the Company’s common stock, (2) by each of the Company’s directors and the executive officers named in the Summary Compensation Table contained in this proxy statement (an “NEO”) and (3) by all of the Company’s the directors and executive officers as a group. The shares “beneficially owned” are determined under the Securities and Exchange Commission (“SEC”) Rules, and do not necessarily indicate ownership for any other purpose. In general, beneficial ownership includes shares over which a person has sole or shared voting or investment power and shares for such person has the right to acquire such beneficial ownership within 60 days of March 15, 2019. Unless otherwise indicated, the persons listed below have sole voting and investment powers of the shares beneficially owned or acquirable by exercise of stock options. Management is not aware of any arrangements that may result in a change of control of the Company.
Amount and Nature of
Beneficial Owner Beneficial Ownership (1) Percent of Class (1)Principal Shareholders that own 5% or more: Cortopassi Partners, L.P. 476,967 (2) 9.3Siena Capital Partners GP, LLC. 347,747 (3) 6.8Directors and Named Executive Officers: Andrew J. Ryback, President, CEO and Director 68,082 (4) 1.3 Richard L. Belstock, EVP and CFO 55,971 (5) 1.1 BJ North, EVP and Chief Banking Officer (CBO) of
Plumas Bank 23,200 (6) * Daniel E. West, Director and Chairman of the Board 58,663 (7) 1.1 Terrance J. Reeson, Director, Vice Chairman and Secretary
of the Board 89,056 (8) 1.7 Michonne R. Ascuaga, Director 0 (9) * Steven M. Coldani, Director 19,644 (10) * William E. Elliott, Director 79,425 (11) 1.5 Gerald W. Fletcher, Director 38,483 (12) * Richard F. Kenny, Director 4,937 (13) * Robert J. McClintock, Director 102,747 (14) 2.0 All 13 Directors and Executive Officers as a Group 546,408 10.4 * Less than one percent (1) Includes 79,375 shares subject to options held by the directors and executive officers that were exercisable within 60 days of March 15, 2019.
In accordance with SEC rules, these are treated as issued and outstanding for the purpose of computing the percentage of each director, named executive officer, and the directors and executive officers as a group, but not for the purpose of computing the percentage of class owned by any other person, including principal shareholders.
(2) Based solely on information provided by the beneficial owners in a Schedule 13G filed with the SEC on January 25, 2017 by Cortopassi Partners, L.P., Dean A. Cortopassi is President of San Tomo, Inc., the general partner of Cortopassi Partners, L.P. Mr. Cortopassi disclaims beneficial ownership of the shares held by Cortopassi Partners, L.P. except to the extent of his partnership interests therein. The address of the Cortopassi Partners, L.P. is 11292 North Alpine Road, Stockton, California 95212.
(3) Based solely on information provided by the beneficial owners in a Schedule 13G/A filed with the SEC on February 6, 2019. Siena Capital
Partners GP, LLC. is the general partner of each of Siena Capital Partners I, L.P. and Siena Capital Partners Accredited, L.P. Siena Capital Partners I, L.P. may be deemed to beneficially own 338,820 shares of common stock of the Company, Siena Capital Partners Accredited, L.P. may be deemed to own 8,927 shares of common stock of the Company, and Siena Capital Partners GP, LLC. may be deemed to own 347,747 shares of common stock of the Company. The address of the Siena entities is 100 North Riverside Plaza, Suite 1630 Chicago, Illinois 60606.
5
(4) Mr. Ryback has shared voting and investment powers as to 28,200 of these shares. Includes 12,800 shares that Mr. Ryback has the right to acquire upon the exercise of stock options within 60 days of March 15, 2019.
(5) Includes 16,800 shares that Mr. Belstock has the right to acquire upon the exercise of stock options within 60 days of March 15, 2019. (6) Includes 16,800 shares that Ms. North has the right to acquire upon the exercise of stock options within 60 days of March 15, 2019. (7) Mr. West has shared voting and investment powers as to 26,862 of these shares and sole voting powers but shared investment powers as to
16,794 of these shares. Includes 6,225 shares that he has the right to acquire upon the exercise of stock options within 60 days of March 15, 2019.
(8) Includes 6,225 shares that Mr. Reeson has the right to acquire upon the exercise of stock options within 60 days of March 15, 2019. (9) Ms. Ascuaga, as a newly appointed Director, is required to purchase $150,000 of Plumas Bancorp stock within three years of her
appointment. (10) Mr. Coldani has shared voting and investment powers as to 10,936 of these shares. Includes 3,825 shares that he has the right to acquire
upon the exercise of stock options within 60 days of March 15, 2019. (11) Mr. Elliott has shared voting and investment powers as to 73,200 of these shares. Includes 6,225 shares that he has the right to acquire upon
the exercise of stock options within 60 days of March 15, 2019. (12) Mr. Fletcher has shared voting and investment powers as to 36,213 of these shares. Includes 2,225 shares that he has the right to acquire
upon the exercise of stock options within 60 days of March 15, 2019. (13) Mr. Kenny has shared voting and investment powers as to these shares. Includes 625 shares that he has the right to acquire upon the exercise
of stock options within 60 days of March 15, 2019. (14) Mr. McClintock has shared voting and investment powers as to 58,699 of these shares. Includes 1,425 shares that he has the right to acquire
upon the exercise of stock options within 60 days of March 15, 2019. Section 16(a) Beneficial Ownership Compliance Section 16(a) of the Securities Exchange Act of 1934 requires the Company’s directors and certain executive officers and persons who own more than ten percent (10%) of a registered class of the Company’s equity securities (collectively, the “Reporting Persons”), to file reports of ownership and changes in ownership with the SEC. The Reporting Persons are required by SEC regulation to furnish the Company with copies of all Section 16(a) forms they file. Based solely upon a review of Forms 3, 4 and 5 and amendments thereto furnished to the Company during and with respect to its 2018 fiscal year, no director, executive officer or beneficial owner of 10% or more of the Company’s common stock failed to file, on a timely basis, reports required during or with respect to 2018 by Section 16(a) of the Securities Exchange Act of 1934, as amended, except for Mr. McClintock who inadvertently failed to timely file one report on Form 4 with respect to one transaction.
6
PROPOSAL 1 ELECTION OF DIRECTORS
The Company’s Board of Directors (the “Board”) has nominated each of the persons listed below for election as directors at the Meeting to serve until the 2020 Annual Meeting of Shareholders and until their successors are elected and have qualified. Votes of the proxy holders will be cast in such a manner as to affect the election of all nine nominees, as appropriate, or as many as possible under the rules of cumulative voting. The nine nominees for directors receiving the most votes will be elected directors. In the event that any of the nominees should be unable to serve as a director, it is intended that the proxy will be voted for the election of such substitute nominee, if any, as shall be designated by the Board. The Board has no reason to believe that any of the nominees named below will be unable to serve if elected. Additional nominations for directors may only be made by complying with the nomination procedures set forth in the Company’s Bylaws. See “Shareholder Proposals - Nomination of Director Candidates.”
The following table sets forth the names of, and certain information concerning, the persons to be nominated by the Board for election as directors of the Company. Each of the nominees is currently a director of the Company and the Company’s subsidiary, Plumas Bank (the “Bank”).
Year First Name and Title Appointed
Other than Director Age Director Principal Occupation During the Past Five Years
Daniel E. West Chairman of the Board
65
1997
President, Graeagle Land & Water Co., a land management company. President, Graeagle Water Co, a private water utility, Graeagle, CA.
Terrance J. Reeson 74 1984 Retired. Vice Chairman and
Secretary of the Board
Michonne R. Ascuaga 57 2019 Retired. Steven M. Coldani
65
2013
President, Owner/Broker, Coldani Realty Inc. and co-owner of Graeagle Associates Realtors; a managing member of Coldani Farming, LLC, a diversified farming company, Lodi, CA.
William E. Elliott 78 1987 Retired. Gerald W. Fletcher 76 1988 Forest Products Wholesaler, Susanville, CA. Richard F. Kenny 70 2017 Retired. Robert J. McClintock 61 2008 Certified Public Accountant, co-owner of McClintock Accountancy Corporation, Tahoe City, CA. Andrew J. Ryback 53 2016 President and CEO of Plumas Bancorp and Plumas Bank.
7
Experience and Qualifications
The following is a brief description of the experience and qualifications of each nominee that the Corporate Governance Committee considered, in light of the Company’s business and structure, in nominating them for service as Directors:
Daniel E. West Chairman of the Board Director since 1997
Mr. Daniel E. West has lived in Graeagle, California since 1958. He is president of Graeagle Land and Water Company, a land management company, and Graeagle Water Company, a private water utility. Mr. West is a managing member of Graeagle Timber Company, LLC. He also serves as a director on the boards of Graeagle Fire Protection District and California Water Association. Mr. West graduated from the University of the Pacific, Stockton, California where he received a Bachelor of Science degree in Business Administration. Mr. West’s valuable business acumen, his extensive experience on various and diverse boards, and his deep ties to his community highly qualify him for service as a member of the Board and Chairman.
Terrance J. Reeson Vice Chairman Director since 1984
Mr. Terrance J. Reeson has lived in Quincy, California for over 50 years. He is a retired U.S. Forest Service Aviation Officer for the Plumas National Forest. Mr. Reeson is active in his community and is a former executive director of the Quincy Chamber of Commerce. Mr. Reeson’s relevant experience qualifying him for service as a director includes extensive government service, leadership experience, and widespread civic and community involvement. Michonne R. Ascuaga Director Director since 2019
Ms. Michonne R. Ascuaga is a native northern Nevadan and has 30 years of experience working at John Ascuaga’s Nugget, serving as its CEO for the last 16 years until its sale in 2013. Having served on numerous boards over the years, Ms. Ascuaga currently sits on the boards of Northern Nevada Medical Center, Bishop Manogue Catholic High School, and the Institutional Advisory Council of Truckee Meadows Community College. She received her Bachelor of Science degree in Mathematics from Santa Clara University and her Master of Business Administration from Stanford University. Ms. Ascuaga’s extensive management experience, leadership skills and her knowledge of and involvement in the community well qualifies her for service as a director of the Company.
Steven M. Coldani Director Director since 2013
Mr. Steven M. Coldani was born and raised in Lodi, California. He is a licensed real estate broker and the president and owner of Coldani Realty Inc. in Lodi, California; he is also co-owner of Graeagle Associates Realtors in Graeagle, California since 1992. In addition, Mr. Coldani is a managing member of Coldani Farming, LLC, a diversified farming company producing various row crops such as olives and grapes, hay and livestock. Mr. Coldani graduated from the University of the Pacific, Stockton, California where he received a Bachelor of Science degree in Business and Public Administration. Mr. Coldani’s relevant experience qualifying him for service as a member of the Board includes his familiarity with the real estate markets in which we operate, a broad range of management and community service experience
8
including his service on the board of Community Business Bank, and his membership in the Lodi District Chamber of Commerce, the California Farm Bureau, the Lodi Association of Realtors and the Plumas Association of Realtors. He is also a past director of the California Association of Realtors.
William E. Elliott Director Director since 1987
Mr. William E. Elliott joined Plumas Bank in 1987 as President and Chief Executive Officer and retired in 2005. He has been in the banking industry for over 50 years holding various management and board positions; this experience highly qualifies him for service as a board director. Mr. Elliott graduated from California State University, Sacramento where he received a Bachelor of Science degree in Accounting and a Master’s in Business Administration. He also graduated from the Pacific School of Banking at the University of Washington. Mr. Elliott is very active in his community; he is a director and former chairman of the Feather River Community College Board, and he is a former chairman and director on the Plumas District Hospital Board, both in Quincy, California. He has been a member of the Rotary Club for over 40 years. Our Board of Directors benefits from Mr. Elliot’s in-depth knowledge of the Company gained through his position as our former President and Chief Executive Officer, including with respect to its operations, strategy, financial condition, and competitive position. Gerald W. Fletcher Director Director since 1988
Mr. Gerald W. Fletcher has lived in Susanville, California since 1956 and is a retired rancher, realtor, and insurance agent. He is a former director of Sierra Security Bank. Mr. Fletcher owns and operates Fletcher Christmas Trees. He was also a reforeststation contractor and has planted millions of trees throughout Northern California. He is a member and past president of Lassen County Cattleman’s Association and a member of the Lassen County Farm Bureau. Mr. Fletcher’s relevant experience qualifying him for service as a member of the Board is comprised of a broad range of management and community service including his past service as Lieutenant in the Susanville Volunteer Fire Department, a past 4-H Leader, and previous experience as bank director. Richard F. Kenny Director Director since 2017
Richard F. Kenny resides in Reno, Nevada and has over 40 years of management experience in Operations, Information systems, Strategic planning and Credit Risk Management. Before retiring in 2010, he was the founding President and CEO of Charles Schwab Bank, a subsidiary of the Charles Schwab brokerage corporation. Prior to that, he served in a variety of management roles with Citibank, both domestic and international. He is actively involved with KNPB public television and the Food Bank of Northern Nevada in the Reno community. He graduated from Northwestern University in Evanston, Illinois with a Bachelor of Science degree in Business Administration and Marketing and received his MBA in Finance from the University of Chicago. Robert J. McClintock Director Director since 2008 Mr. Robert J. McClintock has lived in Tahoe City, California for over 30 years. He is a Certified Public Accountant and is a shareholder of McClintock Accountancy Corporation headquartered in Tahoe City, California. As a CPA, Mr. McClintock brings strong accounting and financial skills important to the oversight of the Company’s financial reporting, enterprise and operational risk management. Mr.
9
McClintock is Troop Committee Chairman for Scouts BSA Troop 266. He is also a board member and Treasurer of the Kiwanis Club of North Lake Tahoe and has served previously as President. He is a member of the advisory board for the Tahoe Truckee Excellence in Education Foundation and has served previously as Treasurer. Mr. McClintock attended Michigan Tech University where he received his Bachelor of Science degree in Business Administration. Andrew J. Ryback Director, President and CEO Director since 2016 Mr. Andrew J. Ryback joined Plumas Bank in 2001. In 2005 he was appointed Executive Vice President and Chief Financial Officer of the Company and the Bank. In 2010 he was appointed interim President and Chief Executive Officer and in 2011 that position became permanent. Mr. Ryback received his Bachelor of Science degree in Business Administration from California State University, Northridge. He is a Certified Public Accountant and a graduate of Pacific Coast Banking School. Mr. Ryback actively serves in a variety of international, regional and local organizations. He is a member of Rotary International and is currently an assistant governor and has also served as a past president of the Quincy club. He is on the board of the California Community Banking Network (CCBN), an affiliate of the Independent Community Bankers of America (ICBA) and is active with ICBA serving on their Bank Education Committee. He is also on the Federal Reserve Bank of San Francisco’s Community Depository Institutions Advisory Council. Locally, Mr. Ryback serves on the Board of Directors of Plumas Hospital District. Additionally, Mr. Ryback serves as Commissioner and Treasurer for the Quincy Fire Protection District and previously served as a volunteer firefighter. All nominees will continue to serve if elected at the Meeting until the 2020 annual meeting of shareholders and until their successors are elected and have been qualified. None of the directors were selected pursuant to any arrangement or understanding other than with the directors and executive officers of the Company acting within their capacities as such. There are no family relationships between any of the directors of the Company. No director of the Company serves as a director of any company that has a class of securities registered under, or which is subject to the periodic reporting requirements of, the Securities Exchange Act of 1934, or of any company registered as an investment company under the Investment Company Act of 1940.
Board Matters
The Board of Directors and Committees
During 2018, the Company’s Board of Directors met 17 times. None of the Company’s directors attended less than 75 percent of all Board of Directors meetings and committee meetings of which they were members. The Company does not have a policy requiring director attendance at its annual meeting; however, most directors attend the meeting as a matter of course. All current directors, except Ms. Ascuaga, attended the 2018 annual meeting of shareholders. The Board has established, among others, an Audit Committee and a Corporate Governance Committee, which serves as a nominating committee and a compensation committee, and each of these committees have charters. Charters for each of these committees are available on the Company’s website, www.plumasbank.com.
Shareholder Communication with the Board of Directors
If you wish to communicate with the Board of Directors or the Chairman of the Board you may send correspondence to the Corporate Secretary, Plumas Bancorp, 35 S. Lindan Avenue, Quincy, California 95971. The Corporate Secretary will perform a review of such correspondence to ensure that communications forwarded to the Board or the Chairman preserve the integrity of the process. For
10
example, items that are unrelated to the duties and responsibilities of the Board or the Chairman such as spam, junk mail and mass mailings, product complaints, personal employee complaints, product inquiries, new product suggestions, resumes and other forms of job inquiries, surveys, business solicitations or advertisements (the “Unrelated Items”) will not be forwarded. In addition, material that is unduly hostile, threatening, illegal or similarly unsuitable will not be forwarded. Any communication that is relevant to the conduct of the Company’s business and is not forwarded will be retained for one year (other than Unrelated Items) and made available to the Chairman and any other independent director on request. The independent directors grant the Corporate Secretary discretion to decide what correspondence shall be shared with the Company’s management and specifically instruct that any personal employee complaints be forwarded to the Company’s Human Resources Department.
Board Role in Risk Oversight
The Board’s duties include understanding and assessing risks to the Company and monitoring the management of those risks. To fulfill this responsibility the directors are expected to attend all Board meeting and meetings of the committees on which they serve and review materials in advance of the meetings. Each meeting includes a review of the activities of each board committee including the committee’s activities related to risk management. Each of our board committees concentrates on specific risks for which they have an expertise, and each committee is required to regularly report to the Board of Directors on its findings.
The Board believes that evaluating how the executive team manages the various risks confronting the Company is one of its most important areas of oversight. In carrying out this critical responsibility, the Board has designated the Audit Committee with primary responsibility for overseeing enterprise risk management. While the Audit Committee has primary responsibility for overseeing enterprise risk management, each of the other Board committees also considers risk within its area of responsibility. For example, the Corporate Governance Committee reviews risks related to legal and regulatory compliance as they relate to corporate governance structure and processes and reviews risks related to compensation matters. Our Loan Committee regularly reviews the Company’s lending policies, evaluates the adequacy of our allowance for loan losses, and approves the Company’s larger extensions of credit. The Board is apprised by the committee chairs of significant risks and management’s response to those risks via periodic reports. While the Board and its committees oversee risk management strategy, management is responsible for implementing and supervising day-to-day risk management processes and reporting to the Board and its committees on such matters.
Furthermore, because the banking industry is highly regulated, certain risks to the Company are monitored by the Board through its review of the Company’s compliance with regulations set forth by its regulatory authorities, including the FDIC and recommendations contained in regulatory examinations. The Company’s chief compliance officer regulatory reports to and meets with the Corporate Governance Committee.
With respect to risk related to compensation matters, the Corporate Governance Committee considers, in establishing and reviewing the Company’s executive compensation program, whether the program encourages unnecessary or excessive risk-taking and has concluded that it does not. Executives’ base salaries are fixed in amount and thus do not encourage risk-taking. On December 19, 2017, the Board approved the Company’s cash non-equity incentive plan for 2018 (See “Executive Compensation – Non-Equity Incentive Plan.”) No individual officer’s earnings under the 2018 non-equity incentive plan exceeded $63,614, except for Mr. Ryback who earned an incentive of $166,575. The Corporate Governance Committee concluded that the 2018 non-equity incentive plan did not encourage unnecessary or excessive risk taking. The other significant source of compensation to executives is in the form of long-term equity awards that are important to help further align executives’ interests with those of the Company’s shareholders. The Corporate Governance Committee believes that these awards do not encourage unnecessary or excessive risk-taking since the ultimate value of the awards is tied to the
11
Company’s stock price, and awards are subject to long-term vesting schedules to help ensure that executives have significant value tied to long-term stock price performance.
The Corporate Governance Committee has also reviewed the Company’s compensation programs for employees generally and has concluded that these programs do not create risks that are reasonably likely to have a material adverse effect on the Company. The Corporate Governance Committee believes that the design of the Company’s annual cash and long-term equity incentives provides an effective and appropriate mix of incentives to help ensure the Company’s performance is focused on long-term shareholder value creation and does not encourage the taking of short-term risks at the expense of long-term results.
Leadership Structure of Board
The Board believes that the Company and its shareholders are best served by having an independent Board Chairman and a separate CEO. We separate these roles in recognition of the differences between the two roles. The CEO is responsible for day-to-day leadership and performance of the Company, while the Chairman of the Board provides strategic guidance to the CEO and presides over meetings of the full Board.
Code of Ethics
The Board of Directors has adopted a code of business conduct and ethics for directors, officers (including the Company’s principal executive officer and principal financial officer) and financial personnel, known as the Corporate Governance Code of Ethics. This Code of Ethics Policy is available on the Company’s website at www.plumasbank.com. Shareholders may request a free copy of the Code of Ethics Policy from Plumas Bancorp, Ms. Elizabeth Kuipers, Investor Relations, 35 S. Lindan Avenue, Quincy, California 95971. Additionally, a copy of the Company’s Corporate Governance Code of Ethics can be accessed at http://www.plumasbank.com. Click on the “Investor Relations” tab and then “Governance Documents.”
Director Independence
The Board has determined that each of the following non-employee directors are “independent” within the meaning of the listing standards and rules of NASDAQ.
Michonne R. Ascuaga Robert J. McClintock Steven M. Coldani Terrance J. Reeson Gerald W. Fletcher Daniel E. West Richard F. Kenny
Mr. Ryback is not independent because he is an employee of the Company. The Board has not determined that Mr. Elliot is independent because he is the Company’s former President and Chief Executive Officer and receives retirement benefits from the Company.
Audit Committee
The Company has an Audit Committee composed of Mr. McClintock, Chairman, and Messrs. Kenny and Reeson. The Board has determined that each member of the Audit Committee meets the independence and experience requirements of the listing standards of NASDAQ and the SEC rules applicable to audit committee members. The Board has also determined that Mr. McClintock is qualified as an audit committee financial expert and that he has accounting or related financial management expertise, in each case in accordance with the rules of the SEC and NASDAQ’s listing standards.
12
The Audit Committee met ten times during 2018. The Audit Committee reviews all internal and external audits including the audit by Vavrinek, Trine, Day & Company, LLP, the Company’s independent auditor for 2018. The Audit Committee reports any significant findings of audits to the Board of Directors and ensures that the Company’s internal audit plans are met, programs are carried out, and deficiencies and weaknesses, if any, are addressed. The Audit Committee meets regularly to discuss and review the overall audit plan. The Audit Committee’s policy is to pre-approve all recurring audit and non-audit services provided by the independent auditors using engagement letters. These services may include audit services, audit-related services, tax services, and other services. Pre-approval is generally provided for up to one year and any pre-approval is detailed as to particular service or category of services and is generally subject to a specific budget. The independent auditors and management are required to periodically report to the Audit Committee regarding all services provided by the independent auditors and fees associated with those services performed to date. The fees paid to the independent auditors in 2018 and 2017 were approved per the Audit Committee’s pre-approval policies.
Audit Committee Report
This report of the Audit Committee shall not be deemed incorporated by reference by any general statement incorporating by reference this proxy statement into any filing under the Securities Act of 1933, as amended, or the Securities Exchange Act of 1934, as amended, except to the extent that the Company specifically incorporates this information by reference and shall not otherwise be deemed filed under the Acts.
The Board of Directors and the Audit Committee has reviewed the Company’s audited financial statements and discussed such statements with management. The Audit Committee has discussed with Vavrinek, Trine, Day & Company, LLP, the Company’s independent auditors during the year 2018, all communications required by standards of the Public Company Accounting Oversight Board, including the matters required to be discussed by Auditing Standard No. 16 (Communications with Audit Committees) and Rule 2-07 (Communication with Audit Committees) of Regulation S-X and, with and without management present, discussed and reviewed the results of the independent external audit firm’s examination of the financial statements. The Committee also discussed the results of internal audits.
The Audit Committee has also received the written disclosures and the letter from Vavrinek, Trine, Day & Company, LLP as required by the PCAOB’s Ethics and Independence Rule 3526 (Communication with Audit Committees Concerning Independence) and has discussed with the independent registered public accounting firm their independence.
Based on the review and discussions noted above, the Audit Committee recommended to the Board of Directors that the Company’s audited financial statements be included in the Company’s Annual Report on Form 10-K for the year ended December 31, 2018 for filing with the SEC.
THE AUDIT COMMITTEE: Robert J. McClintock, Chairman Terrance J. Reeson Richard F. Kenny
Corporate Governance Committee
The Company has a Corporate Governance Committee which met seven times during 2018. The Corporate Governance Committee consists of Mr. Kenny, Chairman, and Messrs. Coldani, Reeson, and West. The Board has determined that Messrs. Kenny, Coldani, Reeson, and West are “independent” within the meaning of the listing standards and rules of NASDAQ, including those applicable to compensation committee members. The Corporate Governance Committee, which functions as the Board’s nominating and compensation committees, provides assistance to the Board by identifying qualified individuals as prospective Board members, recommends to the Board the director nominees for
13
election at the annual meeting of shareholders, nominates the Chairperson and Vice-Chairperson of the Board, oversees the annual review and evaluation of the performance of the Board and its committees, and develops and recommends corporate governance guidelines to the Board of Directors.
The Corporate Governance Committee also serves as the Board’s compensation committee and at least annually reviews, adjusts (as appropriate), and approves the Company’s directors’ compensation, including cash, equity, or other compensation for service on the Board, any committee of the Board, and as Chairperson of the Board or any committee of the Board. The Corporate Governance Committee at least annually reviews, adjusts (as appropriate) and approves the Chief Executive Officer’s compensation, provides advice and consents to the Chief Executive Officer in the review and adjustment of executive officer compensation (other than the Chief Executive Officer), approves the compensation strategy for the Company’s employees, reviews and recommends for approval by the Board all equity-based compensation, including stock options and stock grants, and approves other personnel matters, which are in excess of management’s authority.
The Corporate Governance Committee does not have any written specific minimum qualifications or skills that the committee believes must be met by either a committee-recommended or a shareholder-recommended candidate to serve on the Board. The Corporate Governance Committee identifies nominees by first evaluating the current members of the Board willing to continue in service. Current members of the Board with skills and experience that are relevant to the Company’s business and who are willing to continue in service are considered for re-nomination, balancing the value of continuity of service by existing members of the Board with that of obtaining a new perspective. If any member of the Board does not wish to continue in service or if the Corporate Governance Committee or the Board decided not to re-nominate a member for re-election, the Corporate Governance Committee identifies the desired skills and experience of a new nominee in light of the following criteria. While no specific diversity policy exists, in practice, when identifying and evaluating new directors, the Corporate Governance Committee considers the diversity and mix of the existing members of the Board, including, but not limited to, such factors as: the age of the current directors, their geographic location (being a community bank, there is a strong preference for local directors), background, skills, and employment experience. Among other things, when examining a specific candidate’s qualifications, the Corporate Governance Committee considers the candidate’s ability to represent the best interest of the Company; existing relationships with the Company; interest in the affairs of the Company and its purpose; ability to fulfill director responsibilities; leadership skills; reputation within the Company’s community; community service; integrity; business judgment; ability to develop business for the Company; and ability to work as a member of a team. The Committee does not assign specific weights to particular criteria and no particular criterion is necessarily applicable to all prospective nominees. The Committee does not discriminate against prospective nominees on the basis of race, religion, national origin, gender, sexual orientation, disability or any other basis proscribed by law. All nominees to be considered for election as directors at the Meeting were recommended by the Corporate Governance Committee.
The Corporate Governance Committee will consider nominees to the Board proposed by
shareholders, although the Board has no formal policy with regard to shareholder nominees as it considers all nominees on their merits as aforementioned. Any shareholder nominations proposed for consideration by the Board may only be made by complying with the nomination procedures set forth in the Company’s Bylaws. See “Shareholder Proposals - Nomination of Director Candidates.” Any such notices should be addressed to:
Chairman of the Board Plumas Bancorp 35 S. Lindan Avenue Quincy, CA 95971
14
PROPOSAL 2 NON-BINDING ADVISORY VOTE ON EXECUTIVE COMPENSATION
The Board of Directors has adopted a policy that provides Company shareholders the opportunity to
vote on an advisory (nonbinding) resolution every three years to approve the compensation of the Company's executives named in the Summary Compensation Table.
This proposal, commonly known as a “Say-on-Pay” proposal, gives you as a shareholder the
opportunity to provide an advisory vote on the Company's executive compensation as disclosed in this proxy statement through the following resolution:
“RESOLVED, that the compensation paid to the Company’s named executive officers, as disclosed pursuant to Item 402 of Regulation S-K is hereby APPROVED.”
Because the vote is advisory, it will not be binding upon the Board of Directors, will not overrule
any decision made by the Board of Directors, and will not create or imply any additional fiduciary duty on the Board of Directors. The Corporate Governance Committee may, however, take into account the outcome of the vote when considering future executive compensation arrangements.
The Board of Directors believes that the Company's executive compensation program is reasonable in comparison both to similar sized companies in the industry and to the performance of the Company during 2018. We also believe that the Company's compensation program is effective in aligning the interests of the executives with the interests of the Company's shareholders on a long-term basis and is appropriate. THE BOARD OF DIRECTORS RECOMMENDS A VOTE FOR THE APPROVAL, ON AN ADVISORY (NON-BINDING) BASIS, OF THE COMPANY’S EXECUTIVE COMPENSATION AS DESCRIBED IN THIS PROXY STATEMENT.
PROPOSAL 3 NON-BINDING ADVISORY VOTE ON THE FREQUENCY OF
FUTURE ADVISORY VOTES ON THE COMPANY’S EXECUTIVE COMPENSATION
We are seeking advisory shareholder approval of the frequency of advisory shareholder votes on
compensation of named executive officers. Section 14A of the Exchange Act requires publicly traded companies to allow shareholders to indicate, on an advisory (nonbinding) basis at least once every six years, how frequently the Company should seek an advisory vote on the compensation of our named executive officers, as disclosed pursuant to the SEC’s compensation disclosure rules. This proposal allows shareholders to indicate whether they prefer an advisory vote on named executive officers every one, two or three years, through the following resolution:
“RESOLVED, that the shareholders of Plumas Bancorp recommend that the Company hold an advisory vote on the compensation of the named executive officers, as disclosed pursuant to the SEC’s rules, every one, two or three years, as determined by the option that receives the highest number of shareholder votes.” The next time shareholders will have an opportunity to vote on the frequency of advisory
shareholder votes to approve the compensation of our named executive officers will be in 2025. We value the opinion of our shareholders and welcome communication regarding our executive compensation policies and practices. Primarily based on the results of the advisory vote taken in 2013 in which 74% of the votes cast, excluding broker non-votes, voted in favor of a triennial vote on the compensation of the name executive officers, the Board has previously adopted a policy to provide a vote every three years on
15
executive compensation. After taking into account various considerations described below, we believe that a triennial vote will provide shareholders with the ability to express their views on our executive compensation policies and practices while providing us with an appropriate amount of time to consult with our shareholders and to consider their input.
Our executive compensation program is administered by our Corporate Governance Committee, as
described in this proxy statement. Compensation decisions with respect to our named executive officers, are disclosed in our proxy statement. We believe that establishing a three-year time frame for holding shareholder advisory votes on executive compensation will both enhance shareholder communication and provide the Company time to consider, engage with and respond to shareholders, in terms of expressed concerns or other feedback. In addition, we believe a long term focus will decrease the likelihood of a detrimental change in the Company's executive compensation program made in response to short-term economic or market fluctuations
Although, as an advisory vote, this proposal is not binding upon the Company or the Board, the
Board will carefully consider the shareholder vote on this matter, along with all other expressions of shareholder views it receives on this matter.
While you have the opportunity to vote for every 1, 2 or 3 years, or abstain from voting on the frequency of shareholders voting on “say-on-pay”, THE BOARD OF DIRECTORS RECOMMENDS THAT YOU VOTE FOR A FREQUENCY OF EVERY 3 YEARS.
Executive Officers
The following table sets forth information concerning the executive officers of the Company and the Bank:
Name Age Position and Principal Occupation for the Past Five YearsAndrew J. Ryback
53
President and Chief Executive Officer of the Company and the Banksince November 16, 2011.
Richard L. Belstock
62
Executive Vice President of the Company and the Bank since July 18,2012. Chief Financial Officer of the Company and the Bank since November 16, 2011.
Aaron M. Boigon
43
Executive Vice President and Chief Information Officer of the Banksince April 1, 2018. Senior Vice President and Director of InformationTechnology of the Bank since April 1, 2015. Previously, Vice President and Information Technology Manager of the Bank.
B J North
68
Executive Vice President and Chief Banking Officer of Plumas Bank since January 2018. Executive Vice President of Retail Banking, Marketing and Commercial Lending of the Bank since July 2011.
Jeffery T. Moore 62
Executive Vice President and Chief Credit Officer of the Bank sinceFebruary 21, 2019. Senior Vice President, Credit Administrator of the Bank since January 2018. Previously Executive Vice President and Chief Credit Officer of Community 1st Bank.
16
Executive Compensation The following tables sets forth information concerning the compensation earned by the Company’s President and Chief Executive Officer and the two other most highly compensated during 2018 (collectively, the “named executive officers.”)
Summary Compensation Table
Name and Principal Position Year Salary Bonus
Stock Awards
(1)
Option Awards
(2)
Non-Equity Incentive
Plan Compensation
Nonqualified Deferred
Compensation Earnings
All Other Compensation
(3)
Total (a) (b) (c) (d) (e) (f) (g) (h) (i) (j)
Andrew J. Ryback President and CEO of the Company and Plumas Bank
2018 2017
$300,009 $275,010
$0 $0
$0 $0
$ 0 $ 0
$ 166,575 $ 124,213
$ 0 $ 0
$ 14,694 $ 13,622
$481,278 $412,845
Richard L. Belstock EVP and CFO of the Company and Plumas Bank
2018 2017
$190,100 $175,100
$0 $0
$0 $0
$ 0 $ 0
$ 63,614 $ 51,166
$ 0 $ 0
$ 7,863 $ 7,367
$261,577 $233,633
BJ North EVP and Chief Banking Officer of Plumas Bank
2018 2017
$182,450 $169,950
$0 $0
$0 $0
$ 0 $ 0
$ 63,414 $ 50,066
$ 0 $ 0
$ 7,955 $ 7,549
$253,819 $227,565
(1) The Company did not grant any stock awards in 2018 or 2017. (2) The Company did not grant any option awards to the named executive officers in 2018 or 2017 (3)
The amounts in column (i) include premiums paid and accrued on life insurance policies (Mr. Ryback), personal use of a Company automobile (Mr. Ryback and Ms. North), tax gross ups, Company-provided gasoline, Company 401(k) matching contribution and cell phone allowance.
Non-Equity Incentive Plan
On December 20, 2017, the Board of Directors of Plumas Bancorp (the “Company”) approved the Company’s cash non-equity incentive plan for 2018 (the “2018 NEI”, the “Plan”). Eligible employees under the 2018 NEI include all employees of the Company’s subsidiary, Plumas Bank (the “Bank”), who are regularly scheduled to work at least 20 hours per week. The aggregate bonus pool is comprised of two pools, one for officers of the Company and one for all other employees. The officers’ portion represents 90.9% of the combined pools. Incentives are payable under the 2018 NEI once the Bank has reached 80% of targeted pretax, pre-bonus income. The maximum total bonus available for distribution is $1.5 million at 120% of targeted pretax, pre-bonus income and the maximum total bonus available for the officers’ pool would be $1.4 million. At target, the officers’ bonus pool would total $953,000. Up to 13% of the officers’ pool could be allocated to the Company’s Chief Executive Officer (“CEO”) and President. Executive Vice Presidents (“EVPs”) each can earn up to 5% of the officers’ bonus pool.
Under the 2018 NEI, the cash incentive payment to the Company’s CEO and President will be based 46% on pretax, pre-bonus income targets, 15% upon the attainment of performance goals, and 15% upon various performance metrics with the remaining 24% based on the CEO’s performance during 2018, as evaluated by the Company’s Corporate Governance Committee, which serves as the Company’s compensation committee. Cash incentive payments for the Company’s EVPs will be based 56% on pretax, pre-bonus income targets, 16% upon the attainment of performance goals, and 8% upon various performance metrics with the remaining 20% based on the CEO’s evaluation of the EVP’s performance during 2018. Goals for the CEO include targeted increases in loans and deposits, continued improvement in asset quality, implementation of a system of procedures and processes to facilitate the transition to an Electronic Document Management System (EDMS), and development of a current expected credit loss model as required under ASU No. 2016-13, Measurement of Credit Losses on Financial Instruments
17
(CECL). Metrics include targeted levels of ROE and ROA (calculated on a pre-tax basis) compared to a select group of peer institutions. At target, the maximum amount of incentive payment that can be earned by the Company’s CEO is $124,000 and for each EVP the maximum incentive payable at target would average $48,000. At 120% or more of target, the maximum amount of incentive payment that can be earned by the Company’s CEO is $178,000 and for each EVP the maximum incentive payable would average $69,000. The Company’s Board of Director can terminate or modify the Plan and all payouts under the Plan are subject to approval by the Company’s Corporate Governance Committee. A bonus pool of $1.4 million was accrued under the 2018 NEI based on the Bank achieving 112% of budgeted pretax, pre-bonus income and meeting all the performance goals and metrics. No individual officer’s earnings under the 2018 NEI exceeded $63,614, with the exception of Mr. Ryback who earned an incentive of $166,575 in 2018. A total of one hundred fifty-eight employees received bonus payments under the 2018 NEI, which were paid during the first quarter of 2019.
Incentives earned by NEOs under the Plan were as follows:
Incentive Earned Based on:
ExecutivePretaxIncome Goals Metrics Performance Total
Andrew J. Ryback $76,882 $25,627 $25,627 $38 439,Richard L. Belstock $35 726, $10 207, $5 104, $12 577, 63,614BJ North $35 726, $10 207, $5 104, $12 377, 63,414
A bonus pool of $1 million was earned under the 2017 NEI based on the Bank achieving 115% of
budgeted pretax, pre-bonus income, exceeding targeted levels of ROE and ROA and meeting three of the five goals. Incentives earned by NEOs under the Plan were as follows:
Incentive Earned Based on:
ExecutivePretaxIncome Goals Metrics Total
Andrew J. Ryback $80,939 $16,228 $27,046 $124,213Richard L. Belstock $37,297 $3,467 $10,402 $51,166BJ North $36,197 $3,467 $10,402 $50,066
A total of forty-six employees received incentive payments under the Plan, which were paid during
the first quarter of 2018.
Stock Option Awards
The Board considers equity compensation in the form of stock option awards to be an important component of its total compensation package because it helps align the interests of the Company’s executives to those of its shareholders and provides a significant retention incentive. During 2013 the Company’s shareholders approved the Plumas Bancorp 2013 Stock Option Plan (the “2013 Plan”), which allows for the granting of stock option awards to employees. The 2013 Plan has a term of 10 years. Up to 500,000 shares of common stock may be issued pursuant to awards of stock options under the 2013 Plan. The Corporate Governance Committee approves and recommends to the Board for its approval all stock option grants. The Company makes grants of equity-based compensation only at fair market value of our stock at the time of grant. The exercise price of stock options is set at the closing stock price on the date of grant. All option grants have a maximum vesting period of five (5) years and expire no more than ten (10) years from the date of grant.
$$$
166,575
18
During 2018, the Company granted a total of 56,000 stock options to Company officers; however, we choose to grant these only to officers who had not previously been granted shares under the 2013 Plan. The Company did not grant stock options during the year ended December 31, 2017.
The Company incorporates the officer’s position level in the determination of the total value of the equity-based compensation to be included in the officer’s total compensation. Generally, the higher the officer’s level, the more options that may be granted to the officer. Additional options may be granted to an individual based on outstanding achievement. This is consistent with the Company’s philosophy of rewarding those officers who have the most impact on our performance.
Post-Employment Benefits and Potential Payments Upon Termination or Change of Control
We consider providing significant post-employment benefits in the form of salary continuation benefits to our executives as an important long-term component of their total executive compensation to reward them for their service and loyalty to the Company. These post-employment benefits also help us retain executives because the benefits are subject to vesting over a period of years.
In 2005 the Company entered into a salary continuation agreement with Mr. Ryback. The purpose of the salary continuation agreement is to provide a special incentive to the experienced executive officer to continue employment with the Company on a long-term basis. The 2005 agreement provides Mr. Ryback with salary continuation benefits of up to $62,000 per year for 15 years after retirement at age 65. On April 1, 2016 this agreement was amended to increase Mr. Ryback’s annual benefit from $62,000 to $80,000 per year. In the event of death prior to retirement, Mr. Ryback’s beneficiary is entitled to a portion of the death benefits pursuant to a split dollar agreement. In the event of disability wherein Mr. Ryback does not continue employment with the Company, he is entitled to salary continuation benefits, at a reduced amount depending on the length of service with the Company, beginning at age 65 or on the date on which he is no longer entitled to disability benefits under the Company’s group disability insurance, whichever is earlier. If Mr. Ryback terminates employment with the Company for a reason other than death or disability prior to the retirement age of 65, he will be entitled to salary continuation benefits at a reduced amount depending on the length of service with the Company. The vesting of salary continuation benefits for Mr. Ryback occurs at a rate that provides for a 90% vesting at age 60 and 2% per year for the next five years of service.
In the event of a change of control of the Company and Mr. Ryback terminates employment with the Company or its successor within a period of 24 months after such change in control, the unvested portion of his salary continuation benefits would vest and the payment of the salary continuation benefits would begin the month following the month of termination, subject to the reduction of benefits if the benefits result in a limitation of deductibility of such benefits for the Company under Section 280G of the Internal Revenue Code. The salary continuation benefits are informally funded by single premium life insurance policies with Mr. Ryback as the insured party and the Company as the beneficiary of the policies.
The Company has entered into a split dollar agreement with Mr. Ryback. The purpose of the split dollar agreement is to provide special incentive to Mr. Ryback to continue employment with the Company on a long-term basis. To accomplish this, the Company agrees to divide the net death proceeds of life insurance policies on Mr. Ryback’s life with Mr. Ryback’s beneficiary. However, Mr. Ryback’s rights or interests in the split dollar policies no longer exist once he ceases to be employed by the Company for any reason whatsoever prior to normal retirement age provided that he has received or had the opportunity to receive any benefit under his executive salary continuation agreement. The Company has agreed to pay the taxes on the imputed income on the life insurance benefit provided to Mr. Ryback under the split dollar agreement.
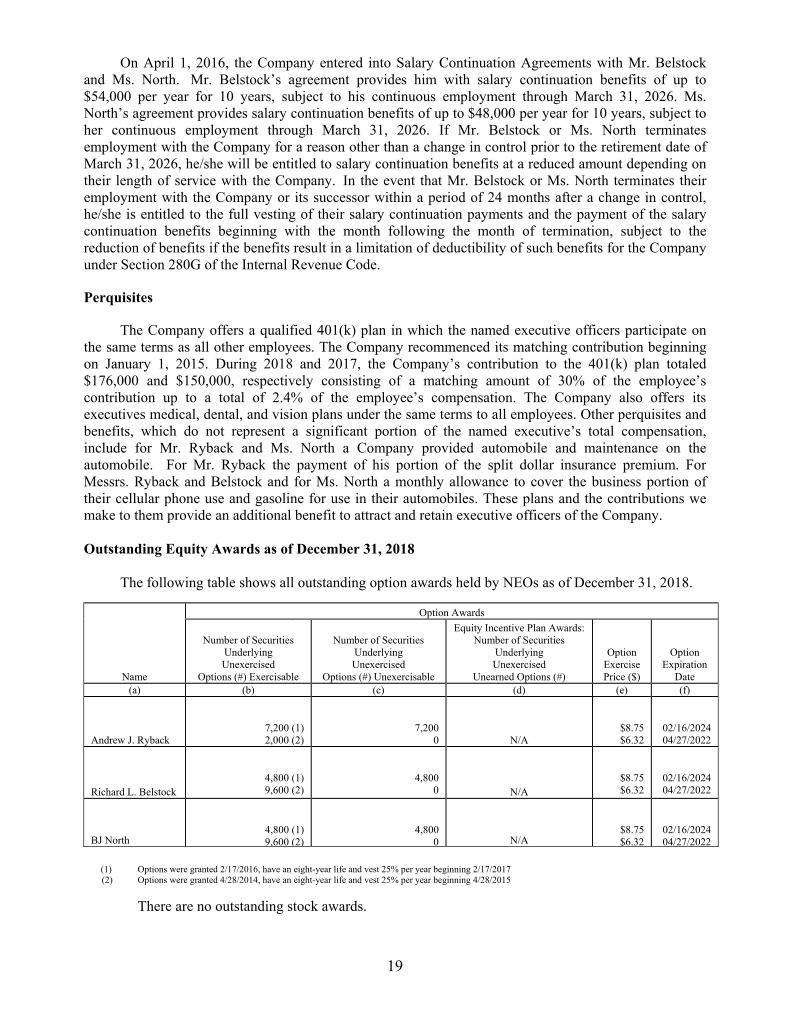
19
On April 1, 2016, the Company entered into Salary Continuation Agreements with Mr. Belstock and Ms. North. Mr. Belstock’s agreement provides him with salary continuation benefits of up to $54,000 per year for 10 years, subject to his continuous employment through March 31, 2026. Ms. North’s agreement provides salary continuation benefits of up to $48,000 per year for 10 years, subject to her continuous employment through March 31, 2026. If Mr. Belstock or Ms. North terminates employment with the Company for a reason other than a change in control prior to the retirement date of March 31, 2026, he/she will be entitled to salary continuation benefits at a reduced amount depending on their length of service with the Company. In the event that Mr. Belstock or Ms. North terminates their employment with the Company or its successor within a period of 24 months after a change in control, he/she is entitled to the full vesting of their salary continuation payments and the payment of the salary continuation benefits beginning with the month following the month of termination, subject to the reduction of benefits if the benefits result in a limitation of deductibility of such benefits for the Company under Section 280G of the Internal Revenue Code.
Perquisites
The Company offers a qualified 401(k) plan in which the named executive officers participate on the same terms as all other employees. The Company recommenced its matching contribution beginning on January 1, 2015. During 2018 and 2017, the Company’s contribution to the 401(k) plan totaled $176,000 and $150,000, respectively consisting of a matching amount of 30% of the employee’s contribution up to a total of 2.4% of the employee’s compensation. The Company also offers its executives medical, dental, and vision plans under the same terms to all employees. Other perquisites and benefits, which do not represent a significant portion of the named executive’s total compensation, include for Mr. Ryback and Ms. North a Company provided automobile and maintenance on the automobile. For Mr. Ryback the payment of his portion of the split dollar insurance premium. For Messrs. Ryback and Belstock and for Ms. North a monthly allowance to cover the business portion of their cellular phone use and gasoline for use in their automobiles. These plans and the contributions we make to them provide an additional benefit to attract and retain executive officers of the Company.
Outstanding Equity Awards as of December 31, 2018
The following table shows all outstanding option awards held by NEOs as of December 31, 2018.
Name
Option Awards
Number of Securities Underlying Unexercised
Options (#) Exercisable
Number of Securities Underlying Unexercised
Options (#) Unexercisable
Equity Incentive Plan Awards: Number of Securities
Underlying Unexercised
Unearned Options (#)
Option Exercise Price ($)
Option Expiration
Date (a) (b) (c) (d) (e) (f)
Andrew J. Ryback 7,200 (1)
2,000 (2)
7,200 0
N/A
$8.75 $6.32
02/16/2024 04/27/2022
Richard L. Belstock
4,800 (1) 9,600 (2)
4,800 0 N/A
$8.75 $6.32
02/16/2024 04/27/2022
BJ North
4,800 (1) 9,600 (2)
4,800 0
N/A
$8.75 $6.32
02/16/2024 04/27/2022
(1) Options were granted 2/17/2016, have an eight-year life and vest 25% per year beginning 2/17/2017 (2) Options were granted 4/28/2014, have an eight-year life and vest 25% per year beginning 4/28/2015
There are no outstanding stock awards.
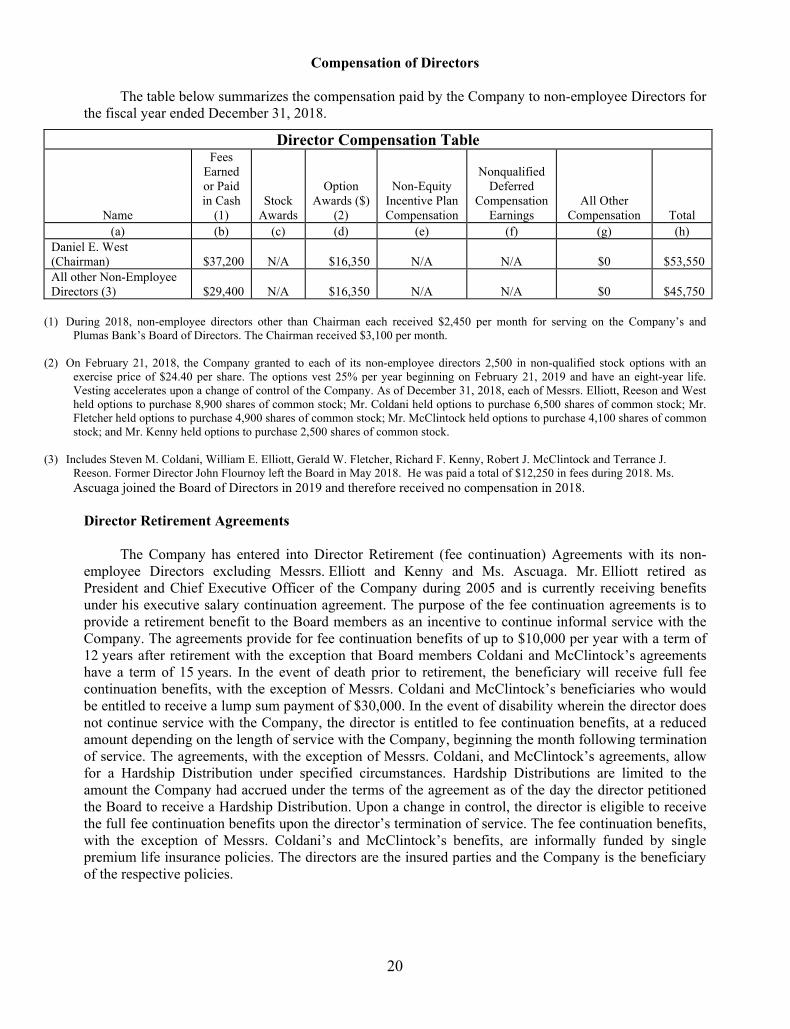
20
Compensation of Directors The table below summarizes the compensation paid by the Company to non-employee Directors for the fiscal year ended December 31, 2018.
Director Compensation Table
Name
Fees Earned or Paid in Cash
(1) Stock
Awards
Option Awards ($)
(2)
Non-Equity Incentive Plan Compensation
Nonqualified Deferred
Compensation Earnings
All Other Compensation Total
(a) (b) (c) (d) (e) (f) (g) (h) Daniel E. West (Chairman) $37,200 N/A $16,350 N/A N/A $0 $53,550 All other Non-Employee Directors (3) $29,400 N/A
$16,350 N/A N/A $0 $45,750
(1) During 2018, non-employee directors other than Chairman each received $2,450 per month for serving on the Company’s and
Plumas Bank’s Board of Directors. The Chairman received $3,100 per month.
(2) On February 21, 2018, the Company granted to each of its non-employee directors 2,500 in non-qualified stock options with an exercise price of $24.40 per share. The options vest 25% per year beginning on February 21, 2019 and have an eight-year life. Vesting accelerates upon a change of control of the Company. As of December 31, 2018, each of Messrs. Elliott, Reeson and West held options to purchase 8,900 shares of common stock; Mr. Coldani held options to purchase 6,500 shares of common stock; Mr.Fletcher held options to purchase 4,900 shares of common stock; Mr. McClintock held options to purchase 4,100 shares of common stock; and Mr. Kenny held options to purchase 2,500 shares of common stock.
(3) Includes Steven M. Coldani, William E. Elliott, Gerald W. Fletcher, Richard F. Kenny, Robert J. McClintock and Terrance J.
Reeson. Former Director John Flournoy left the Board in May 2018. He was paid a total of $12,250 in fees during 2018. Ms. Ascuaga joined the Board of Directors in 2019 and therefore received no compensation in 2018.
Director Retirement Agreements The Company has entered into Director Retirement (fee continuation) Agreements with its non-employee Directors excluding Messrs. Elliott and Kenny and Ms. Ascuaga. Mr. Elliott retired as President and Chief Executive Officer of the Company during 2005 and is currently receiving benefits under his executive salary continuation agreement. The purpose of the fee continuation agreements is to provide a retirement benefit to the Board members as an incentive to continue informal service with the Company. The agreements provide for fee continuation benefits of up to $10,000 per year with a term of 12 years after retirement with the exception that Board members Coldani and McClintock’s agreements have a term of 15 years. In the event of death prior to retirement, the beneficiary will receive full fee continuation benefits, with the exception of Messrs. Coldani and McClintock’s beneficiaries who would be entitled to receive a lump sum payment of $30,000. In the event of disability wherein the director does not continue service with the Company, the director is entitled to fee continuation benefits, at a reduced amount depending on the length of service with the Company, beginning the month following termination of service. The agreements, with the exception of Messrs. Coldani, and McClintock’s agreements, allow for a Hardship Distribution under specified circumstances. Hardship Distributions are limited to the amount the Company had accrued under the terms of the agreement as of the day the director petitioned the Board to receive a Hardship Distribution. Upon a change in control, the director is eligible to receive the full fee continuation benefits upon the director’s termination of service. The fee continuation benefits, with the exception of Messrs. Coldani’s and McClintock’s benefits, are informally funded by single premium life insurance policies. The directors are the insured parties and the Company is the beneficiary of the respective policies.
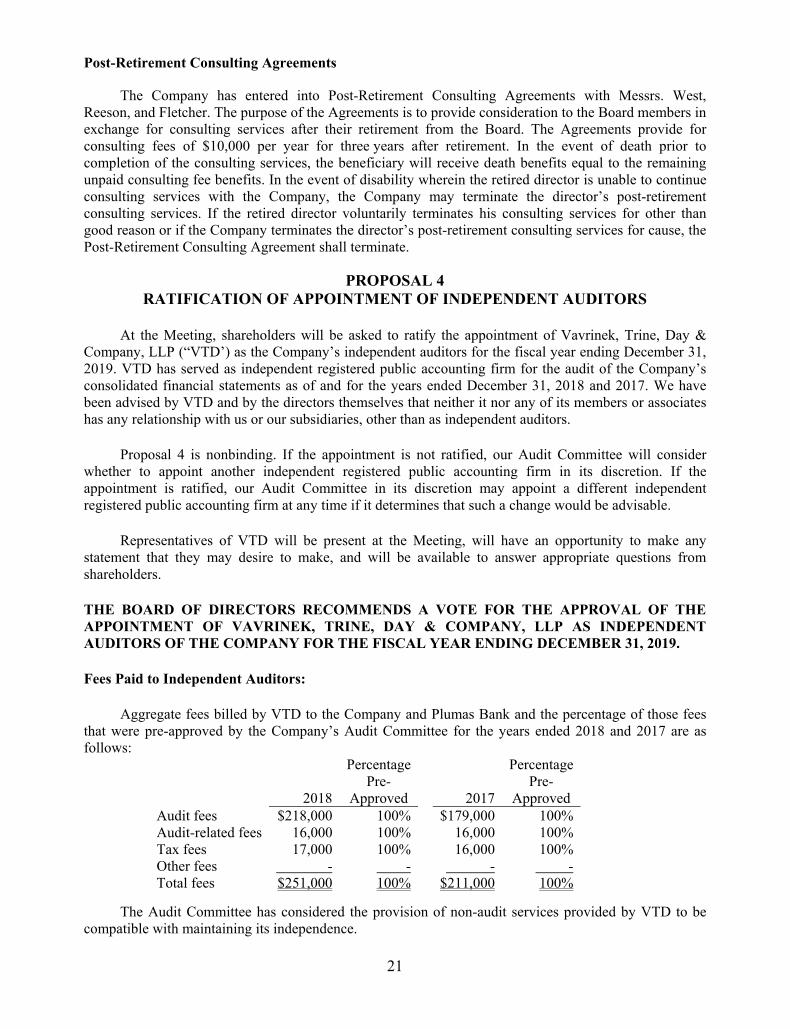
21
Post-Retirement Consulting Agreements
The Company has entered into Post-Retirement Consulting Agreements with Messrs. West, Reeson, and Fletcher. The purpose of the Agreements is to provide consideration to the Board members in exchange for consulting services after their retirement from the Board. The Agreements provide for consulting fees of $10,000 per year for three years after retirement. In the event of death prior to completion of the consulting services, the beneficiary will receive death benefits equal to the remaining unpaid consulting fee benefits. In the event of disability wherein the retired director is unable to continue consulting services with the Company, the Company may terminate the director’s post-retirement consulting services. If the retired director voluntarily terminates his consulting services for other than good reason or if the Company terminates the director’s post-retirement consulting services for cause, the Post-Retirement Consulting Agreement shall terminate.
PROPOSAL 4 RATIFICATION OF APPOINTMENT OF INDEPENDENT AUDITORS
At the Meeting, shareholders will be asked to ratify the appointment of Vavrinek, Trine, Day & Company, LLP (“VTD’) as the Company’s independent auditors for the fiscal year ending December 31, 2019. VTD has served as independent registered public accounting firm for the audit of the Company’s consolidated financial statements as of and for the years ended December 31, 2018 and 2017. We have been advised by VTD and by the directors themselves that neither it nor any of its members or associates has any relationship with us or our subsidiaries, other than as independent auditors.
Proposal 4 is nonbinding. If the appointment is not ratified, our Audit Committee will consider whether to appoint another independent registered public accounting firm in its discretion. If the appointment is ratified, our Audit Committee in its discretion may appoint a different independent registered public accounting firm at any time if it determines that such a change would be advisable.
Representatives of VTD will be present at the Meeting, will have an opportunity to make any statement that they may desire to make, and will be available to answer appropriate questions from shareholders.
THE BOARD OF DIRECTORS RECOMMENDS A VOTE FOR THE APPROVAL OF THE APPOINTMENT OF VAVRINEK, TRINE, DAY & COMPANY, LLP AS INDEPENDENT AUDITORS OF THE COMPANY FOR THE FISCAL YEAR ENDING DECEMBER 31, 2019.
Fees Paid to Independent Auditors:
Aggregate fees billed by VTD to the Company and Plumas Bank and the percentage of those fees that were pre-approved by the Company’s Audit Committee for the years ended 2018 and 2017 are as follows:
2018
Percentage Pre-
Approved 2017
Percentage Pre-
Approved Audit fees $218,000 100% $179,000 100% Audit-related fees 16,000 100% 16,000 100% Tax fees 17,000 100% 16,000 100% Other fees - - - - Total fees $251,000 100% $211,000 100%
The Audit Committee has considered the provision of non-audit services provided by VTD to be compatible with maintaining its independence.
22
Shareholder Proposals
In order for a shareholder proposal to be considered for inclusion in the Company’s proxy statement for next year’s annual meeting, the written proposal must be received by the Company no later than December 6, 2019 and should contain such information as is required under the Company’s Bylaws. Such proposals will need to comply with the SEC’s regulations regarding the inclusion of shareholder proposals in the Company’s proxy materials.
Nomination of Director Candidates: The Company’s Bylaws permit shareholders to nominate directors at a shareholder meeting. In order to make a director nomination at an annual shareholder meeting, it is necessary that you notify the Company not less than 120 days before the first anniversary of the date that the proxy statement for the preceding year’s annual meeting was first sent to shareholders. This proxy statement was first sent to shareholders on April 4, 2019. Thus, in order for any such nomination notice to be timely for next year’s annual meeting, it must be received by the Company not later than December 6, 2019. In addition, the notice must meet all other requirements contained in the Company’s Bylaws and include any other information required pursuant to Regulation 14A under the Exchange Act.
Copy of Bylaw Provisions: You may contact the Investor Relations Officer, Ms. Elizabeth Kuipers, at the Company for a copy of the relevant Bylaw provisions regarding the requirements for making shareholder proposals and nominating director candidates. Additionally, a copy of the Company’s Bylaws can be accessed at http://www.plumasbank.com. Click on the “Investor Relations tab” and then Governance Documents.
Certain Transactions
Some of the directors and executive officers of the Company and their immediate families, as well as the companies with which they are associated, are customers of, or have had banking transactions with, the Company in the ordinary course of the Company’s business, and the Company expects to have banking transactions with such persons in the future. In management’s opinion, all loans and commitments to lend in such transactions were made in compliance with applicable laws and on substantially the same terms, including interest rates and collateral, as those prevailing for comparable transactions with other non-affiliated persons of similar creditworthiness and, in the opinion of management, did not involve more than a normal risk of collectibility or present other unfavorable features.
Other Matters
Management does not know of any matters to be presented at the Meeting other than those set forth above. However, if other matters come before the Meeting, it is the intention of the persons named in the accompanying proxy to vote the shares represented by the proxy in accordance with the recommendations of management on such matters, and discretionary authority to do so is included in the proxy.
Available Information
The Company’s common stock is registered under the Securities Exchange Act of 1934 and as a result the Company is required to file annual reports, quarterly reports and other periodic filings with the SEC and are posted and are available at no cost on the Company’s website, www.plumasbank.com, as soon as reasonably practicable after the Company files such documents with the SEC. These reports and filings are also available for inspection and/or printing at no cost through the SEC website, www.sec.gov. In addition, regulatory report data for both the Company and Plumas Bank are available for inspection and/or printing at no cost through the Federal Financial Institutions Examination Council’s (the “FFIEC”) website, www.ffiec.gov and the Federal Deposit Insurance Corporation’s (the “FDIC”) website, www.fdic.gov, respectively.

23
You may request an additional copy of the proxy statement, 10-K, 2018 annual report to shareholders, and form of proxy as to this Meeting or all future shareholder meetings by calling us at 1.888.375.8627, by writing to us at Plumas Bancorp, 35 S. Lindan Avenue, Quincy, California 95971, Attn: Ms. Elizabeth Kuipers, Vice President and Investor Relations Officer, or by email at [email protected].

Top Related
Copyright © 2022 FDOKUMEN

