


Bahasa
Halaman
Hukum


University of Tennessee, Knoxville University of Tennessee, Knoxville
TRACE: Tennessee Research and Creative TRACE: Tennessee Research and Creative
Exchange Exchange
Masters Theses Graduate School
8-2005
Pitot Tube and Wind Tunnel Studies of the Flow Induced by One Pitot Tube and Wind Tunnel Studies of the Flow Induced by One
Atmosphere Uniform Glow Discharge (OAUGDP ®) Plasma Atmosphere Uniform Glow Discharge (OAUGDP ®) Plasma
Actuators using a Conventional and an Economical High Voltage Actuators using a Conventional and an Economical High Voltage
Power Supply Power Supply
Manish Yadav University of Tennessee - Knoxville, [email protected]
Follow this and additional works at: https://trace.tennessee.edu/utk_gradthes
Part of the Electrical and Electronics Commons
Recommended Citation Recommended Citation Yadav, Manish, "Pitot Tube and Wind Tunnel Studies of the Flow Induced by One Atmosphere Uniform Glow Discharge (OAUGDP ®) Plasma Actuators using a Conventional and an Economical High Voltage Power Supply. " Master's Thesis, University of Tennessee, 2005. https://trace.tennessee.edu/utk_gradthes/935
This Thesis is brought to you for free and open access by the Graduate School at TRACE: Tennessee Research and Creative Exchange. It has been accepted for inclusion in Masters Theses by an authorized administrator of TRACE: Tennessee Research and Creative Exchange. For more information, please contact [email protected].

To the Graduate Council:
I am submitting herewith a thesis written by Manish Yadav entitled "Pitot Tube and Wind Tunnel
Studies of the Flow Induced by One Atmosphere Uniform Glow Discharge (OAUGDP ®) Plasma
Actuators using a Conventional and an Economical High Voltage Power Supply." I have
examined the final electronic copy of this thesis for form and content and recommend that it be
accepted in partial fulfillment of the requirements for the degree of Master of Science, with a
major in Electrical Engineering.
J. Reece Roth, Major Professor
We have read this thesis and recommend its acceptance:
Leon Tolbert, Mostafa Howlader
Accepted for the Council:
Carolyn R. Hodges
Vice Provost and Dean of the Graduate School
(Original signatures are on file with official student records.)

To the Graduate Counc il:
I am submitting herewith a thesis written by Manish Yadav entitled "Pi tot Tube
and Wind Tunnel Studies of the Flow Induced by One Atmosphere Uniform Glow
Discharge (OAUGDP ) Plasma Actuators using a Conventional and an
Economical High Voltage Power Supply". I have examined the final paper copy
of this thesis for form and content and recommend that it be accepted in partial
fulfil lment of the requirements for the degree of Master of Science, with a major
in Electrical Engineering.
We have read this thesis and recom.mend its acceptance:
Leon Tolbert
Mostafa Howlader
Accepted for the Counci l :
�����'J Vice Chancellor and Dean of Graduate Studies

PITOT TUBE AND WIND TUNNEL STUDIES OF THE FLOW INDUCED
BY ONE ATMOSPHERE UNIFORM GLOW DISCHARGE (OAUGDP� PLASMA ACTUATORS USING A CONVENTIONAL AND AN
ECONOMICAL HIGH VOLTAGE POWER SUPPLY
A Thesis Presented for
the Master of Science Degree
The University of Tennessee, Knoxville
Manish Yadav
August - 2005

DEDICATION
This work is dedicated to my parents for their tireless encouragement and support.
11

ACKNOWLEDGEMENT
Thanks are due first to my supervisor, Professor J. Reece Roth, for his great
insights, perspectives and guidance throughout my stint as a graduate student at
the University of Tennessee. My sincere thanks go to Professor Leon Tolbert and
Professor Mostafa Howlader for serving as my committee members. I also thank
my colleagues at the UT Plasma Sciences Laboratory for their excellent
cooperation. I am grateful to Mr. Steve Wilkinson for his help during the work
done at the NASA Langley Research Center. This work was supported in part by
AFOSR contract AF F49620-01-1-0425 (ROTH), Dr. John Schmisseur, Program
Manager.
I thank my friends both here in United States and back home in India, who have
not been mentioned here personally in making this educational process a success.
Last but not the least, I thank my family members for all their love and
encouragement. I could not have made it without your support.
111
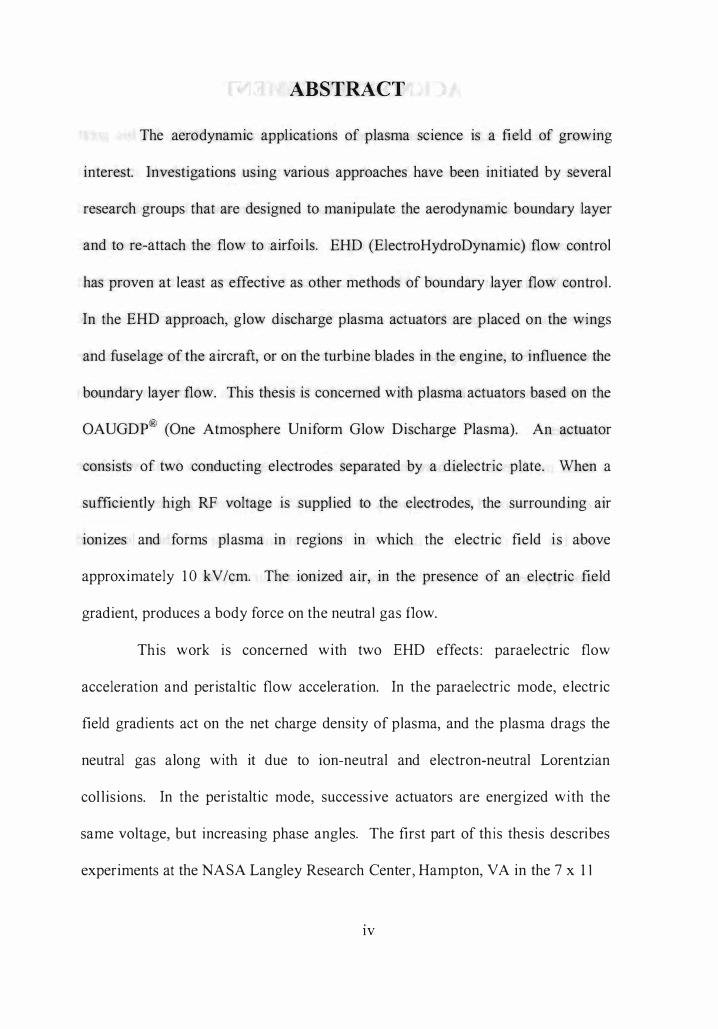
ABSTRACT
The aerodynamic applications of plasma science is a field of growing
interest. Investigations using various approaches have been initiated by several
research groups that are designed to manipulate the aerodynamic boundary layer
and to re-attach the flow to airfoils. EHD (ElectroHydroDynamic) flow control
has proven at least as effective as other methods of boundary layer flow control .
In the EHD approach, glow discharge plasma actuators are placed on the wings
and fuselage of the aircraft, or on the turbine blades in the engine, to influence the
boundary layer flow. This thesis is concerned with plasma actuators based on the
OAUGDp@ (One Atmosphere Uniform Glow Discharge Plasma). An actuator
consists of two conducting electrodes separated by a dielectric plate. When a
sufficiently high RF voltage is supplied to the electrodes, the surrounding air
ionizes and forms plasma in regions in which the electric field is above
approximately 1 0 kV /cm. The ionized air, in the presence of an electric field
gradient, produces a body force on the neutral gas flow.
This work is concerned with two EHD effects: paraelectric flow
acceleration and peristaltic flow acceleration. In the paraelectric mode, electric
field gradients act on the net charge density of plasma, and the plasma drags the
neutral gas along with it due to ion-neutral and electron-neutral Lorentzian
col lisions. In the peristaltic mode, successive actuators are energized with the
same voltage, but increasing phase angles. The first part of this thesis describes
experiments at the NASA Langley Research Center, Hampton, VA in the 7 x 11
IV
Inch Low Speed Wind Tunnel in which Pitot tube velocity profile measurements
and smoke flow visualization tests were conducted.
The second part of this thesis describes the development of a low cost
power supply to energize OAUGDPQ!;I plasma actuators. The power supply
consists of automotive ignition coil transformers, audio amplifiers, and a DC
battery. Using this power supply, plasma actuators were energized at voltages up
to 8 kV, and at frequencies between 0.5 and 8 kHz. This thesis also presents
illustrative paraelectric flow acceleration data obtained using the low-cost power
supply.
v

TABLE OF CONTENTS
Chapter 1 : INTRODUCTION
1 .1 Plasnla . . . . . . . . . . . . . . . . . . . . . . . . . . . . . . . . . . . . . . . . . . . . . . . . . . . . . . . . . . . . . . . . . . . . . . . . . . . . . . . . 1 1 .2 History of Electrical Discharges . . . . . . . . . . . . . . . . . . . . . . . . . . . . . . . . . . . . . . . . . . . . . . . . . . . . 1 1 .3 Need for Glow Discharge Plasma Sources at One Atmosphere of
Pressure . . . . . . . . . . . . . . . . . . . . . . . . . . . . . . . . . . . . . . . . . . . . . . . . . . . . . . . . . . . . . . . . . . . . . . . . . . . . . . 2 1 .4 One Atmosphere Plasma Sources . . . . . . . . . . . . . . . . . . . . . . . . . . . . . . . . . . . . . . . . . . . . . . . . 2 1 .5 The OAUGDp® (One Atmosphere Uniform Glow Discharge Plasma) . . . . . 3 1 .6 EHD (Electrohydrodynamic) Flow Control . . . . . . . . . . . . . . . . . . . . . . . . . . . . . . . . . . . . 4
1 .6 . 1 Paraelectric Flow Acceleration . . . . . . . . . . . . . . . . . . . . . . . . . . . . . . . . . . . . . . . 6 \ .6.2 Peristaltic Flow Acceleration . . . . . . . . . . . . . . . . . . . . . . . . . . . . . . . . . . . . . . . . . 9
Chapter 2: ELECTRODE GEOMETRIES
2 .1 Paralld Plate Plasma Reactors . . . . . . . . . . . . . . . . . . . . . . . . . . . . . . . . . . . . . . . . . . . . . . . . . . . 12 2 .2 Cop]anar Plasma Actuators . . . . . . . . . . . . . . . . . . . . . . . . . . . . . . . . . . . . . . . . . . . . . . . . . . . . . . 12 2.3 Asymmetric Electrode Configuration .... . . . . . . . . . . . . . . . . . . . . . . . . . . . . . . . . . . . . . . 14
2 . 3 . 1 Paraelectric Plasma Actuators . . . . . . . . . . . . . . . . . . . . . . . . . . . . . . . . . . . . . . 16 2 . 3 . 2 Peristaltic Plasma Actuators . . . . . . . . . . . . . . . . . . . . . . . . . . . . . . . . . . . . . . . . 20
Chapter 3: EXPERIMENTAL SET-UP
3 . 1 The Power Supply . . . . . . . . . . . . . . . . . . . . . . . . . . . . . . . . . . . . . . . . . . . . . . . . . . . . . . . . . . . . . . . . . 24 3 .1 .1 Power Supply for Paraelectric Plasma Actuators . . . . . . . . . . . . . . . . . . 26 3 .1 .2 Peristaltic Plasma Actuator Power Supply . . . . . . . . . . . . . . . ... . . . . . . . . 27
3 .2 Po�yphase Signal Generator (LabVIEW™) . . . . . . . . . . . . . . . . . . . . . . . . . . . . . . . . . . . . 29 3 .3 The Wind Tunnel . . . . . . . . . . . . . . . . . . . . . . . . . . . . . . . . . . . . . . . . . . . . . . . . . . . . . . . . . . . . . . . . . . . 32 3 .4 Pitot Tube System . . . . . . . . . . . . . . . . . . . . . . . . . . . . . . . . . . . . . . . . . . . . . . . . . . . . . . . . . . . . . . . . . . 32 3 .5 Smoke Wire Flow Visualization System . . . . . . . . . . . . . . . . . . . . . . . . . . . . . . . . . . . . . . . 36
Chapter 4 : EXPERIMENTAL RESULTS
4.1 Boundary Layer Veloc ity Profiles . . . . . . . . . . . . . . . . . . . . . . . . . . . . . . . . . . . . . . . . . . . . . . . 38 4.2 Boundary Layer Profile with Plasma Off. . . . . . . . . . . . . . . . . . . . . . . . . . . . . . . . . . . . . . . 4 1 4 .3 Effect of Frequency . . . . . . . . . . . . . . . . . . . . . . . . . . . . . . . . . . . . . . . . . . . . . . . . . . . . . . . . . . . . . . . . 42 4 .4 Effect of Number of Electrodes Energized . . . . . . . . . . . . . . . . . . . . . . . . . . . . . . . . . . . . . .44 4 .5 Effect of Applied RF Voltage . . . . . . . . . . . . . . . . . . . . . . . . . . . . . . . . . . . . . . . . . . . . . . . . . . . . 45 4 .6 Smoke Flow Visualization Tests . . . . . . . . . . . . . . . . . . . . . . . . . . . . . . . . . . . . . . . . . . . . . . . . .46
4 .6 .1 Smoke Flow Visualization using a Paraelectric Panel . . . . . . . . . . . . 48 4 .6 .2 Smoke Flow Visualization using a Peristaltic Panel . . . . . . . . . . . . . . .48
VI

Chapter 5: LOW COST POWER SUPPLY
5 . 1 Components of the Low Cost Power Supply . . . . . . . . . . . . . . . . . . . . . . . . . . . . . . . . . . . . 54 5 .1.1 Audio Amplifiers . . . . . . . . . . . . . . . . . . . . . . . . . . . . . . . . . . . . . . . . . . . . . . . . . . . . . . 54 5 .1 .2 Automotive Ignition Coils . . . . . . . . . . . . . . . . . . . . . . . . . . . . . . . . . . . . . . . . . . . . 57 5 .1 .3 DC Battery . . . . . . . . . . . . . . . . . . . . . . . . . . . . . . . . . . . . . . . . . . . . . . . . . . . . . . . . . . . . . . 58
5 .2 Experimental Set-up . . . . . . . . . . . . . . . . . . . . . . . . . . . . . . . . . . . . . . . . . . . . . . . . . . . . . . . . . . . . . . . 60 5 . 3 Experimental Results . . . . . . . . . . . . . . . . . . . . . . . . . . . . . . . . . . . . . . . . . . . . . . . . . . . . . . . . . . . . . 62 5 .4 Advantages of the Low Cost Power Supply . . . . . . . . . . . . . . . . . . . . . . . . . . . . . . . . . . . 63
Chapter 6: SUMMARY AND DISCUSSION . . . . . . . . . . . . . . . . . . . . . . . . . . . . . . . . . . . . . . . 66
REFERENCES . . . . . . . . ... . ... . . . . . ....... . . .. . . . . . . . . . . . . . . . . . . ... . . . . . . . . . .... . . . . ..... . . . 67
VITA ... . . . . . . . . . ...... . . . . . . . . . . . ..... . . . . . . ..... . . . . . ...... . .. . . . . . . . ... . . .. .. . . . . . . . . . . .... 72
Vll

LIST OF FIGURES
Figure 1 .1 : Parallel plate OAUGDP reactor . . . . . . . . . . . . . . . . . . . . . . . . . . . . . . . . . . . . . . . . . . . . 5
Figure 1 .2: Asymmetric panel with staggered lower electrodes . . . . . . . . . . . . . . . . . . . . . . . 7
Figure 1 . 3 : Paraelectric flow acceleration in an electric field gradient.. . . . . . . . . . . . . . 7
Figure 1 .4 : Polyphase power supply used to energize a peristaltic panel . . . . . . . . . . . 1 0
Figure 2 . 1 : Features of the normal glow discharge during half the RF cycle . . . . . . 13
Figure 2 .2 : Asymmetric panel configuration . . . . . . . . . . . . . . . . . . . . . . . . . . . . . . . . . . . . . . . . . . . . 15
Figure 2 . 3: Panel with asymmetric electrodes used for paraelectric flow acceleration . . . . . . . . . . . . . . . . . . . . . . . . . . . . . . . . . . . . . . . . . . . . . . . . . . . . . . . . . . . . . . . . . . . . . 16
Figure 2 . 4 : Paraelectric panel - electrodes on the upper surface and metal lic sheet electrode on the lower surface of the panel . . . . . . . . . . . . . . . . . . . . . . . . . . . . . . . 17
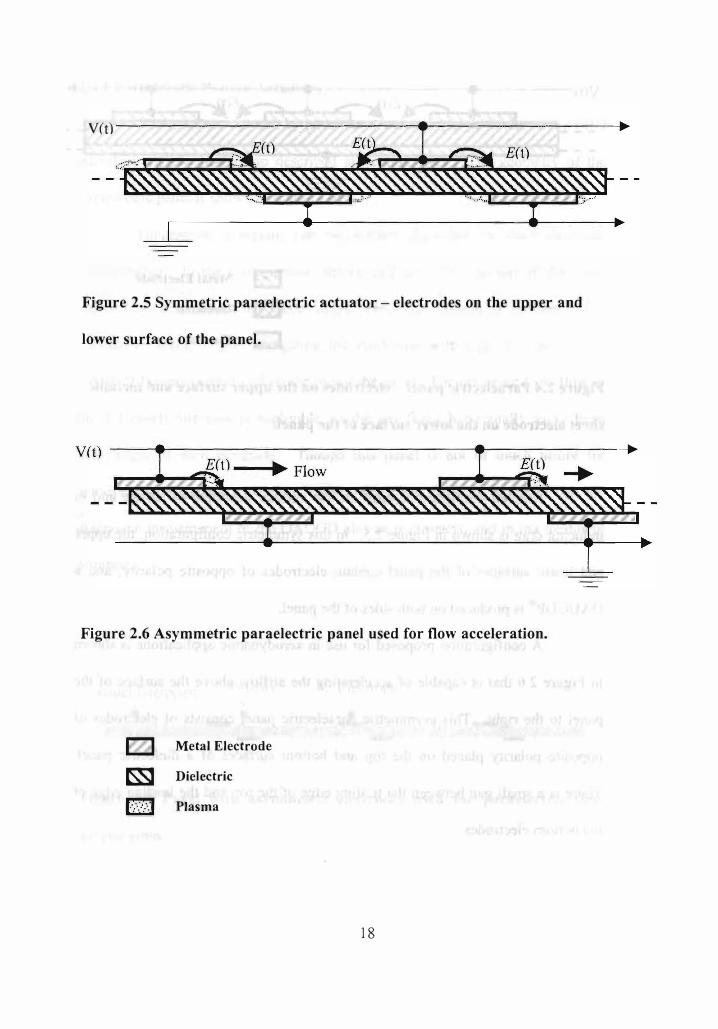
Figure 2 . 5 : Symmetric paraelectric actuator - electrodes on the upper and lower surface of the panel . . . . . . . . . . . . . . . . . . . . . . . . . . . . . . . . . . . . . . . . . . . . . . . . . . . . . . . . . . . 18
Figure 2 .6 : Asymmetric paraelectric panel used for flow acceleration . . . . . . . . . . . . . . 18
Figure 2 .7 : Aluminum oxide (Ah03) paraelectric panel (dimensions in mm) . . . . . 19
Figure 2 . 8 : Peristaltic flow acceleration due to traveling electrostatic wave . . . . . . . 20
Figure 2 .9 : Peristaltic flow acceleration in a combined paraelectric and peristaltic acceleration . . . . . . . . . . . . . . . . . . . . . . . . . . . . . . . . . . . . . . . . . . . . . . . . . . , . . . . . . . . . . . . . . . . . 21
Figure 2 .10: Aluminum oxide (Ah03) pure peristaltic panel (dimensions in n1n1) . . . . . . . . . . . . . . . . . . . . . . . . . . . . . . . . . . . . . . . . . . . . . . . . . . . . . . . . . . . . . . . . . . . . . . . . . . . . 22
F igure 2 . 1 1: Aluminum oxide (Ah03) combined paraelectric and peristaltic panel (dimensions in mm) . . . . . . . . . . . . . . . . . . . . . . . . . . . . . . . . . . . . . . . . . . . . . . . . . . 23
Figure 3 . 1: Digital image of the power supply composed of Powertron ™ amplifiers and high voltage transformers . . . . . . . . . . . . . . . . . . . . . . . . . . . . . . . . . 25
Figure 3 . 2 : Paraelectric plasma actuator energized by the power supply . . . . . . . . . . . 26
VIII
Figure 3 . 3 : Block diagram of the power supply used to drive peristaltic plasma actuators . . . . . . . . . .. . . . . . . . . . . . . . . . . . . . . . . . . . . . . . . . . . . . . . . . . . . . . . . . . . . . . . . . . . . . . 28
Figure 3 .4 : Schematic of the polyphase signal generator . . . . . . . . . . . . . . . . . . . . . . . . . . . . . 30
Figure 3 . 5 : Front panel of the LabVIEW polyphase generator program . . . . . . . . . . . . 31
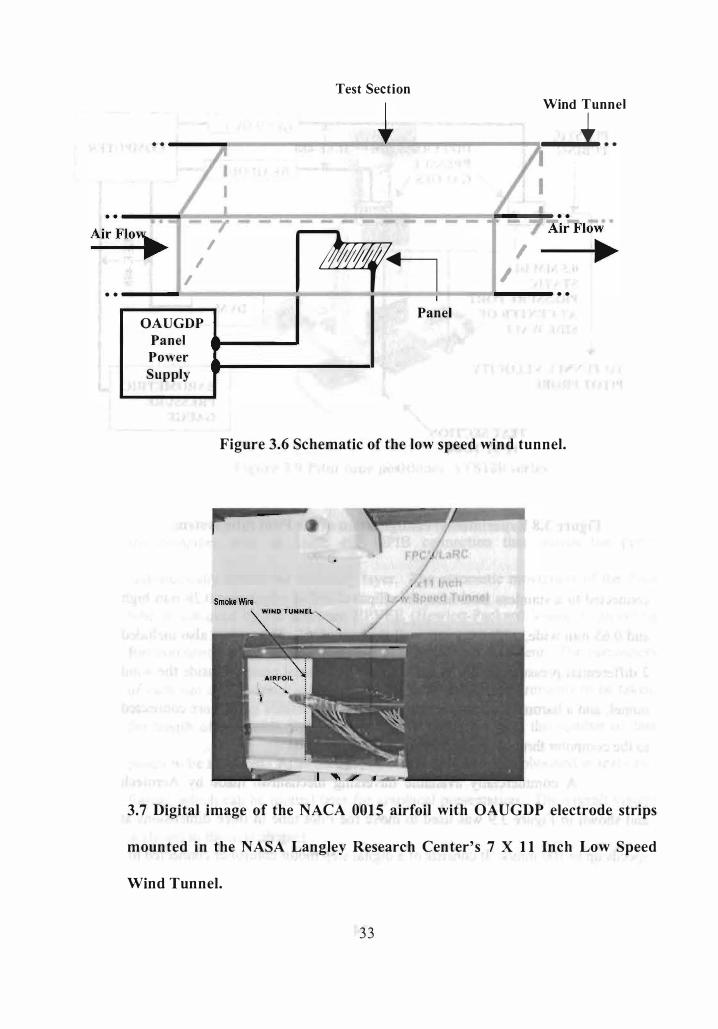
Figure 3 .6 : Schematic of the low speed wind tunnel. . . . . . . . . . . . . . . . . . . . . . . . . . . . . . . . . . 33
Figure 3 . 7 : Digital image of the NACA 0015 airfoil with OAUGDP electrode strips mounted in the NASA Langley Research Center's 7 X I I Inch Low Speed Wind Tunnel . . . . . . . . . . . . . . . . . . . . . . . . . . . . . . . . . . . . . . . . . . . . . . . . . .. 33
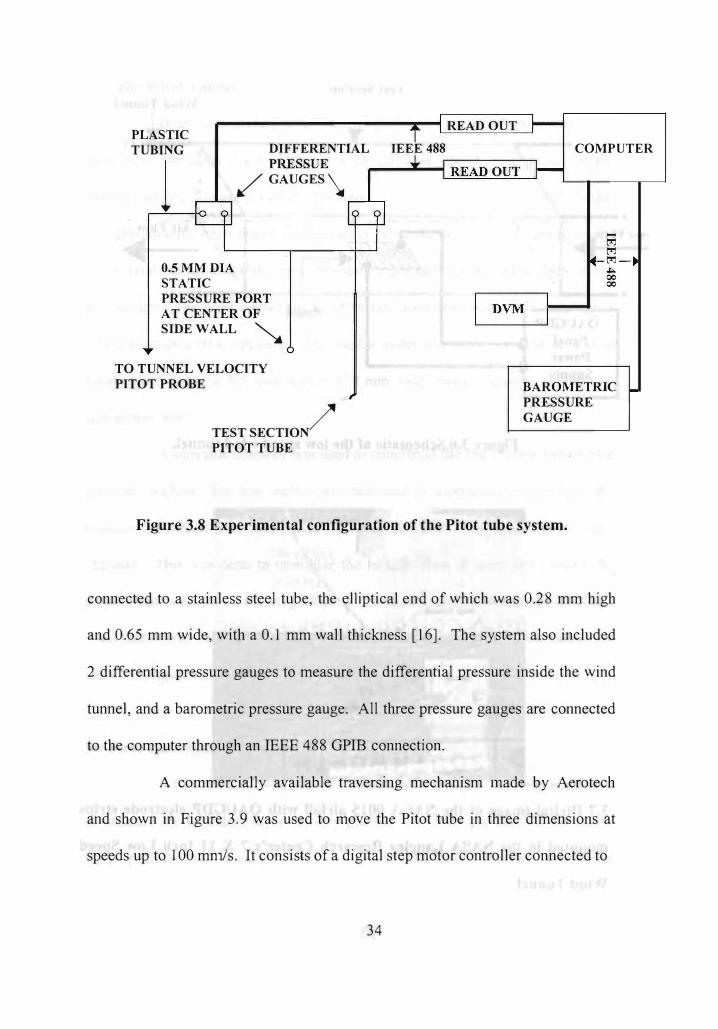
Figure 3 .8 : Experimental configuration of the Pitot tube system . . . . . . . . . . . . . . . . . . . . 34
Figure 3 .9 : Pitot tube positioner ATS I OO series . . . . . . . . . . . . . . . . . . . . . . . . . . . . . . . . . . . . . . . 35
Figure 3 . 1 0: Components of the smoke wire flow visualization system .. . . . . . . . . . . 37
Figure 4 . 1 : Schematic drawing of an aluminum oxide panel, showing the position of the Pitot tube above the panel . . . . . . . . . . . . . . . . . . . . . . . . . . . . ... . . . . . . . . . . . . . 39
Figure 4 .2 : Digital image of the Pitot tube and the aluminum oxide (Ah03) panel mounted in the wind tunnel. . . . . . . . . . . . . . . . . . . . .. . . . . . . . . . . . . . . . . . . . . . . . . . . 40
Figure 4.3 : Digital image of the opening of the Pitot tube . . . . . . . . . . . . . . . . . . . . . . . . . . . 40
Figure 4 .4 : Schematic of the Pitot tube measurement system in the wind tunnel . . . . . . . . . . . . . . . . . . . . . . . . . . . . . . . . . . . . . . . . . . . . . . . . . . . . . . . . . . . . . . . . . . . . . . . . . 41
Figure 4 .5 : Velocity profile with plasma off and wind tunnel free stream velocity of 3 .95 nlisec . . . . . . . . . . . . . . . . . . . . . . . . . . . . . . . . . . . . . . . . . . . . . . . . . . . . . . . . .. . . . . . . . . 42
Figure 4.6: Flow velocity plotted as a function of applied RF frequency . . . . . . . . . .43
Figure 4.7: Flow velocity plotted as a function of number of electrodes energized . . . . . . . . . . . . . . . . . . . . . . . . . . .. . . . . . . . . . . . . . . . . . . . . . . . . . . . . . . . . . . . . . . . . . . . 44
Figure 4 . 8 : Effect of voltage and the mode of EHD operation on the flow velocities . . . . . . . . . . . . . . . . . . . . . . . . . . . . . " . . . . . . . . . . . . . . . . . . . . . . . . . . . . . . . . . . . . . . . . 45
Figure 4 .9 : Effect of applied RF voltage and frequency on the flow velocities . . . 46
Figure 4 . 1 0: Experimental set-up for smoke flow visualization tests . . . . . . . . . . . . . . . 47
IX
Figure 4.11: Smoke flow visualization tests for paraelectric panel. ................. 49
Figure 4.12: Smoke flow visualization tests for pure peristaltic paneL . . . . . . . . . . . . . 51
Figure 4.13: Smoke flow visualization tests for combined paraelectric and peristaltic paneL . . . . . . . . . . . . . . . . . . . . . . . . . . . . . . . . . . . . . . .. . . . . . . . . . . . . . . . . . . 53
Figure 5.1: SPL CRM300-2 audio amplifier . . . . . . . . . . . . . . . . . . . . . . . . . . . . . . . . . . . . . . . . . . . 55
Figure 5.2: Automotive ignition coils . . . . . . . . . . . . . . . . . .. . . . . . . . . . . . . . . . . . . . . . . . . . . . . . . . . 57
Figure 5.3: 12V DC battery . . . . . .. . . . . . . . . . . . . . . . . . . . . . . . .. . . . . . . . . . . . . . . . . . . . . . . . . . . . . . . . 58
Figure 5.4: Battery charger. .............................................................. 59
Figure 5.5: Schematic for the power supply system . . . . . . . . . . . . . . . . . . . . . . . . . . . . . . . . . . . 60
Figure 5.6: Experimental configuration for the power supply system . . . . . . . . . . . . . . 61
Figure 5.7: OAUGDP actuator panels. (a) Plasma panel under normal
illumination. (b) Plasma panel energized by the low cost power
supply . . . . . . . . . . . . . . . . . . . . . . . . . . . . . . . . . . . . . . . . . . . . . . . . . . . . . . . . . . . . . . . . . . . . . . . . . . 62
Figure 5.8: E ffect of applied voltage and frequency on the flow velocity . . . . . . . . . 63
x

1 . 1 Plasma
1. INTRODUCTION
In 1 879, Sir William Crookes categorized plasma as the fourth state of
matter. In explanation, he noted that plasma is formed when heat is applied to a
gas, after transformation from solid to liquid and then from a liquid to the gaseous
state. In the plasma state, individual atoms break down into electrons and ions.
Irving Langmuir circa 1 928 gave a more detailed definition of plasma as an
approximately electrically neutral collection of ions and electrons which may or
may not contain a neutral background gas [ 1 ] .
1.2 History of Electrical Discharges
Many scientists of the 1 9th century investigated the behavior of DC
electrical discharges in gases. Sir Humphry Davy in 1 808 produced a steady-state
DC arc discharge in atmospheric air, fol lowed by Michael Faraday, who
developed the high voltage, low pressure DC electrical discharge tube circa 1 830.
J Plucker ( 185 9) and J W Hittorf (1869) demonstrated the emergence of cathode
rays from the negative e lectrode of such discharges, and the fluorescence effect it
caused. In these classical low pressure electrical discharges, a filamentation
instability (streamers) occured when attempts were made to operate a glow
discharge above a few Torr of pressure. The instability was usually accompanied
by cathode heating, them1lonic emission from the cathode, and a glow-to-arc
transition [1 ].
1

1.3 Need for Glow Discharge Plasma Sources at One Atmosphere of Pressure
The plasma sources operating much below or above one atmosphere of
pressure have significant disadvantages. Sources operating under vacuum have
the added cost of purchasing and maintaining the vacuum system, and additional
operating costs are associated with the batch processing of workpieces. Batch
processing of workpieces is also required for plasma sources operating above 1
atm, and regulatory restrictions associated with the National Boiler Code make
the enclosure design complex and expensive for operation above 3 atm. For these
reasons, plasma sources operating at 1 atm generally produce industrially
optimum operating conditions at low cost.
1.4 One Atmosphere Plasma Sources
In regions of high electric field near sharp points where electrically
stressed gas is present, a corona discharge may exist if the electric field exceeds
that for breakdown of the gas . Corona discharges have applications III
electrostatic precipitators, xerography, modifying the surface properties of
materials, and in air freshening. However, corona sources may produce such
detrimental effects as formation of ozone, X-rays, N02 and nitric acid (in the
presence of water vapor), and production of audible and RF noise. In addition,
these sources are characterized by low production rates of active species and
formation of corrosive active species that lead to degradation of electrodes and
workpieces [2] .
2
Another source that can be operated at one atmosphere is the Dielectric
Barrier Discharge (DBD), generated in the space between two electrodes, each of
which is covered with an insulating dielectric material. These sources are used
for ozone production and increasing the surface energy of materials. However,
these sources can produce ozone, audible noise, and radio frequency interference
below a few MHz, and can cause pinhole damage of the workpiece and dielectric
barrier. Also, the DBD is a filamentary plasma, which can lead to non-unifomlity
of effect when treating surfaces.
1 .5 The OAUGDp@ (One Atmosphere Uniform Glow Discharge Plasma)
Von Engle et al [3] made a major breakthrough in 1 93 3 when they
obtained normal glow discharges at 1 atm, by starting the discharge under vacuum
and then gradually increasing the pressure to 1 atm. Among the l imitations of this
discharge were a requirement for aggressively cooled cathodes, and instability of
the discharge with respect to the glow-to-arc transition at pressures approaching
one atmosphere.
l.R. Roth and his co-workers at Plasma Sciences Laboratory at
University of Tennessee operated the first One Atmosphere Uniform Glow
Discharge Plasma in air using a parallel plate OAUGDp@ reactor. This
capacitively coupled plasma is generated between two electrodes, at least one of
which is covered by a dielectric . This dielectric material is used to prevent RF
arcs and to allow the build-up of surface charge, important to the operation of the
plasma.
3

The OAUGDp@ works on the principle of ion trapping. The critical
frequency at which ions are trapped, and the uniform discharge is produced, is
given by
e Vrms
Vo ;::;; Hz . (1)
where Vo is the critical trapping frequency, m is the ion mass, Vrms is the mlS
voltage applied to the reactor plates, d is the distance between the plates, and Vc is
the ion collision frequency. When the plasma reactor configuration and the
operating parameters are set to values consistent with Equation 1, the mobility
drift of the ions in the oscillating electric field traps them between the electrodes
during an RF cycle. Ion trapping is advantageous in that it prevents charge loss,
and overheating of the cathode, which may lead to thermionic emission [4].
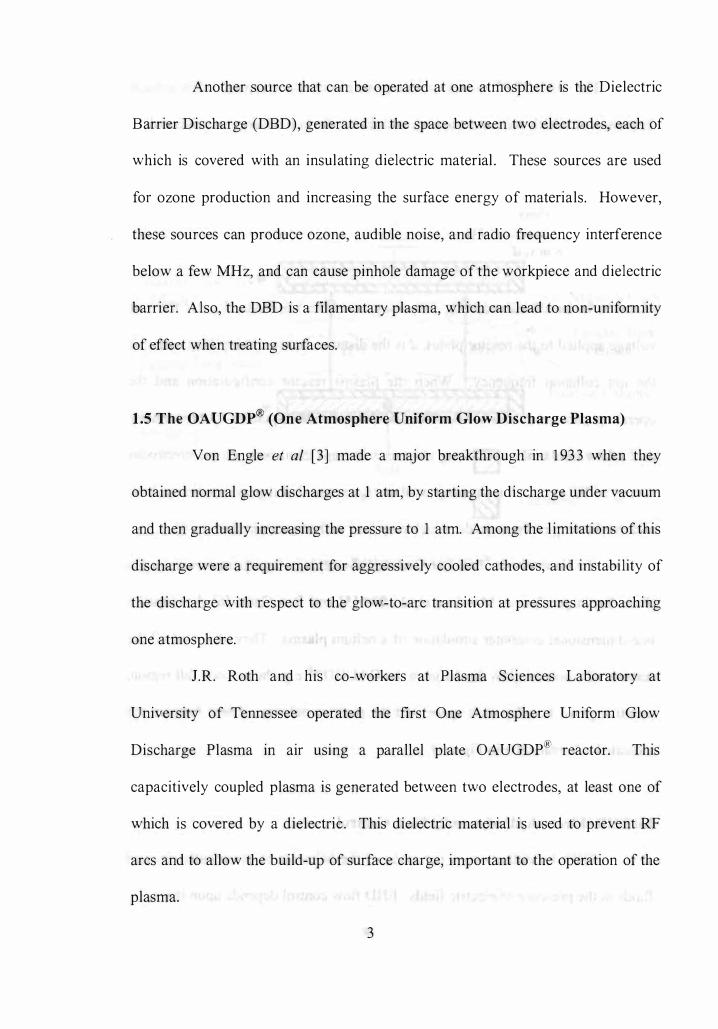
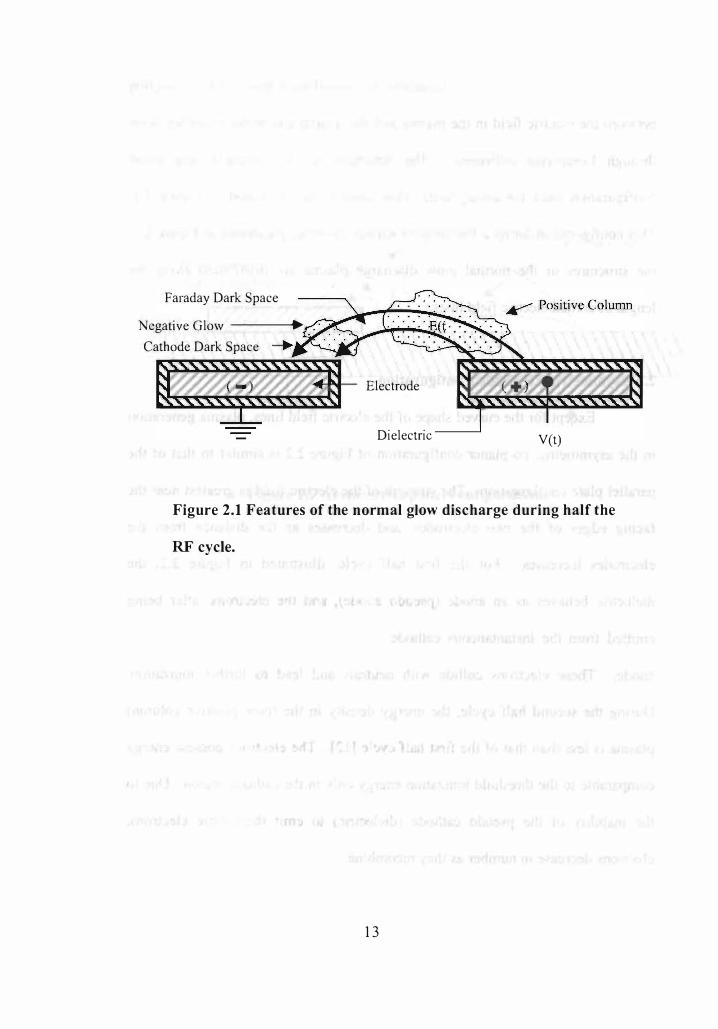
To demonstrate that the OAUGDp® displays the characteristics of a
glow discharge plasma, Massines et al 1998 [5] and Ben Gadri [6] developed a
one-dimensional computer simulation of a helium plasma. They observed all the
features of a nomlal glow discharge in the OAUGDp® e.g. the cathode fall region,
negative glow, Faraday dark space, and the positive column. These features are
indicated schematically in Figure 1.1.
1.6 EHD (Electrohydrodynamic) Flow Control
EHD, by definition, is the study of the behavior of electrically charged
fluids in the presence of electric fields. EHD flow control depends upon the
4
Instantaneous � h!:s�;:s;! Cathode/,-) .. -: -: -:'. '. -: -: .... -:. . . . .... .......... ..-- Negative Glow
..
..
. . . ..
..
. . ..
..
..
..
..
..
. . . . ' ... -.'.*- Faraday Dark
Cathode Dark Soace :::::::::: : ����::::::::::::::::::: :���:::::. '" Space
Positive Column Instantaneo us'------' �c:::s::s::s::s::s:!c:::fs::s::s::s:!c:::s::s::s::s:::d1:Sl Anode(+)
Metal Electrode vet)
Dielectric
Figure 1 . 1 Parallel plate OAUGDp® reactor.
5

interaction bet ween the partially ionized gas and the electric field. The resultant
ion-neutral and electron-neutral Lorentzian collisions drag the neutral gas towards
an increasing electric field gradient [1, 7]. The strong EHD coupling between the
electric field in the plasma and flowing neutral gas in the boundary layer provides
a significant momentum input that allows re-attachment o f flows on an airfoil at
high angles o f attack, manipulation o f the boundary layer, and increases in the
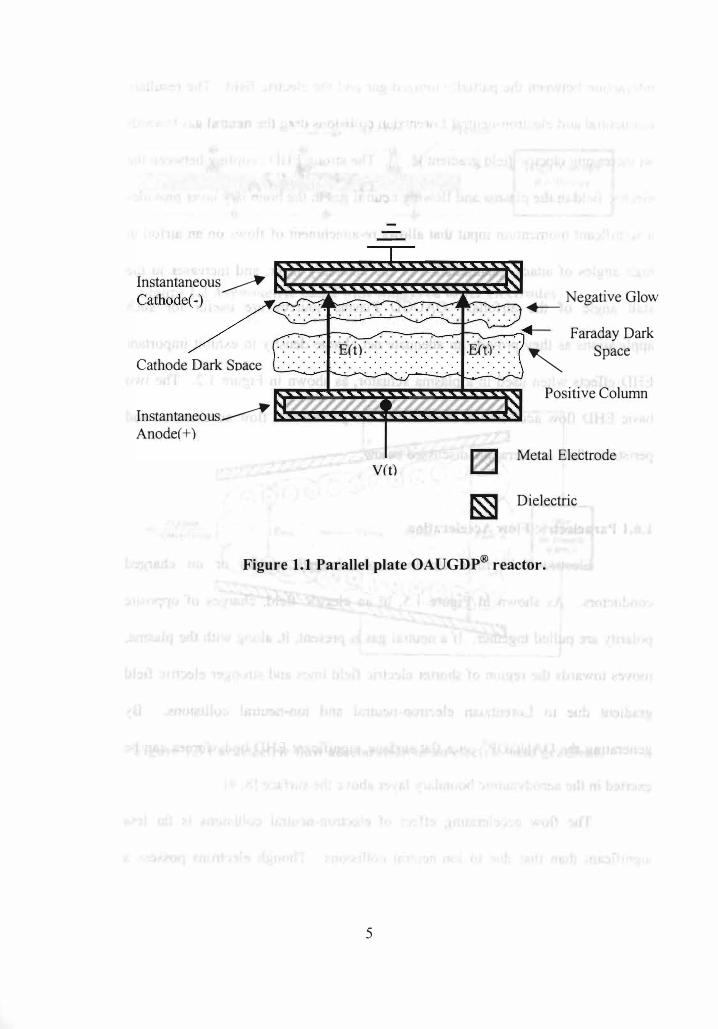
stall angle of the airfoils. OAUGD Plasma sources are useful for such
applications as they provide an adequate net charge density to exhibit important
EHD effects when used in a plasma actuator, as shown in Figure 1.2. The two
basic EHD flow acceleration mechanisms are paraelectric flo w acceleration and
peristaltic flow acceleration, discussed below.
1.6.1 Paraelectric Flow Acceleration
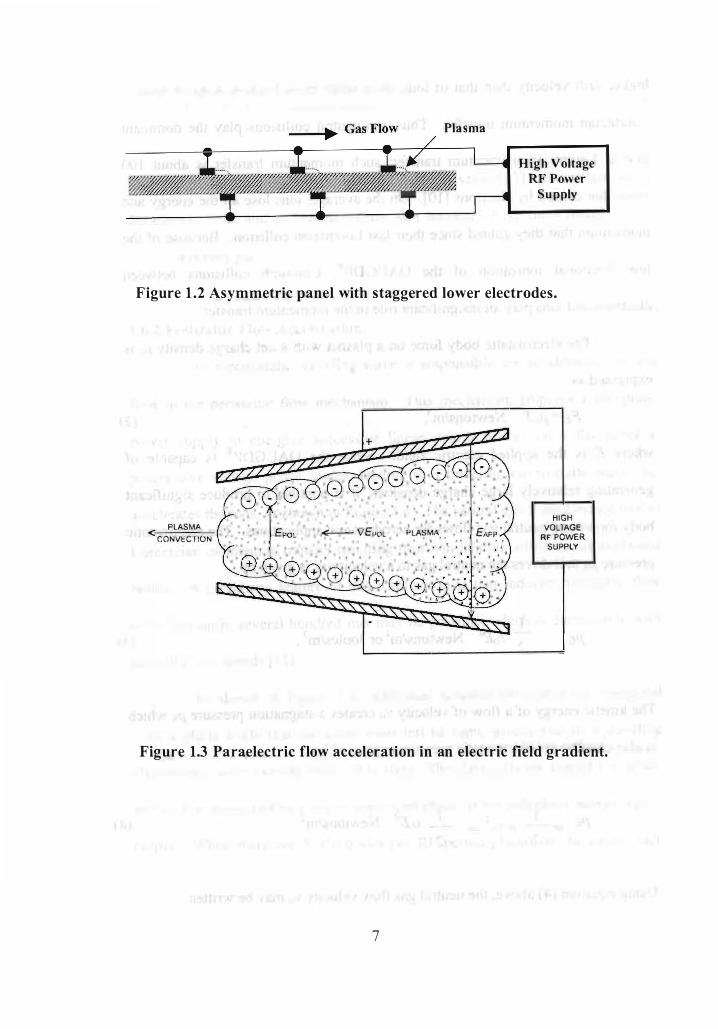
Electric field lines tem1inate on charged species or on charged
conductors. As shown in Figure 1.3, in an electric field, charges of opposite
polarity are pulled together. If a neutral gas is present, it, along with the plasma,
moves towards the region o f shorter electric field lines and stronger electric field
gradient due to Lorentzian electron-neutral and ion-neutral collisions. By
generating the OAUGDp® on a flat surface, significant EHD body forces can be
exerted in the aerodynamic boundary layer above the surface [8, 9].
The flow accelerating effect of electron-neutral collisions IS far less
significant than that due to ion-neutral collisions. Though electrons possess a
6
Plasma
High Voltage RF Power
Supply
Figure 1.2 Asymmetric panel with staggered lower electrodes.
< PLASMA
r.ONVECTION
+
. . . . . . .
• • II . " � VE�OL f'LASMA_:
,: • !=AP�',
HIGH VOLTAGE
RF POWER SUPPLY
Figure 1.3 Paraelectric flow acceleration in an electric field gradient.
7

higher drift velocity than that of ions, their small mass leads to a much smaller
Lorentzian momentum transfer. Thus, ion-neutral collisions play the dominant
role in Lorentzian momentum transfer; such momentum transfer is about 100
times that caused by electrons [10]. On the average, ions lose all the energy and
momentum that they gained since their last Lorentzian collision. Because of the
low fractional ionization of the OA UGDp®, Coulomb collisions between
electrons and ions play an insignificant role in the momentum transfer.
The electrostatic body force on a plasma with a net charge density Pc is
expressed as
(2)
where E is the applied electric field. Since the OAUGDp® is capable of
generating relatively large charge densities, it is possible to produce significant
body forces and neutral gas flows for aerodynamic applications. The electrostatic
pressure PE that drives the neutral gas to a velocity Vo is given by
] PE =
-;- coE2 Newtons/m2 or Joules/m3 . (3)
The kinetic energy of a flow of velocity Vo creates a stagnation pressure Ps which
is also equal to the electrostatic pressure expressed by
Ps ]
2
2 P Vo =
2
Using equation (4) above, the neutral gas flow velocity Vo may be written
8
(4)
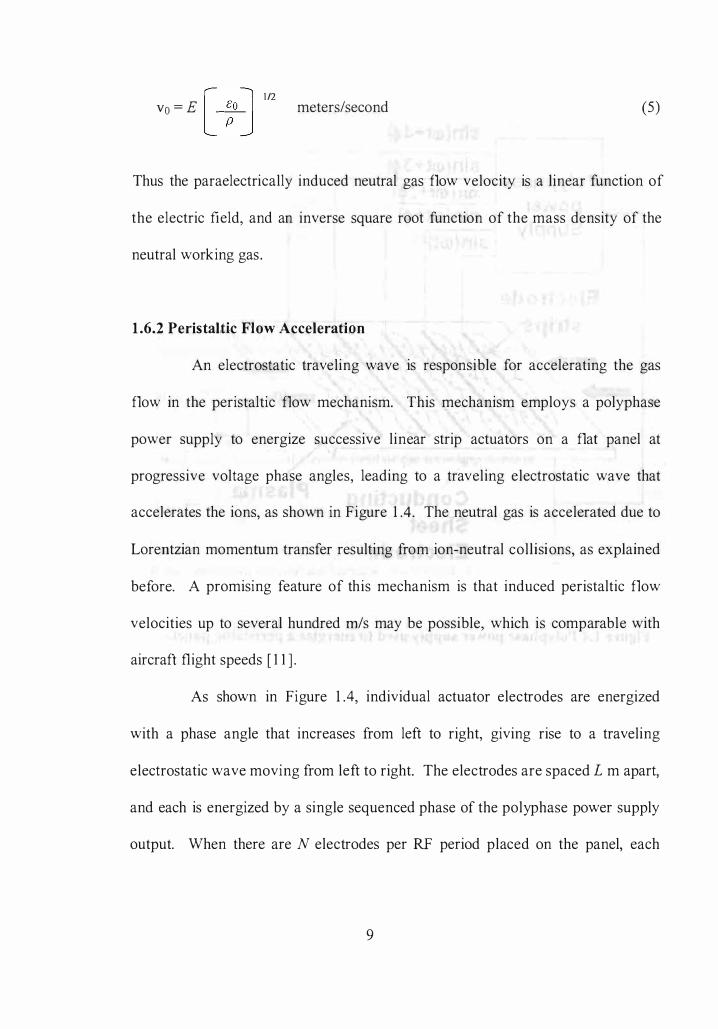
Vo � E [ �o j In meters/second (5)
Thus the paraelectrically induced neutral gas flow velocity is a linear function of
the electric field, and an inverse square root function of the mass density of the
neutral working gas .
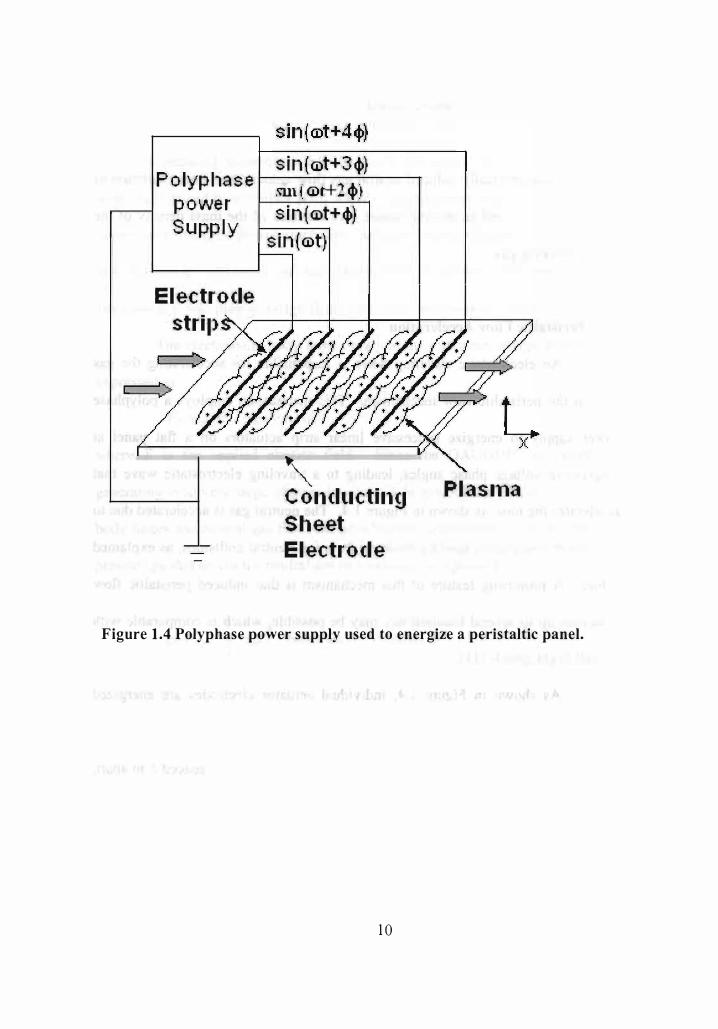
1.6.2 Peristaltic Flow Acceleration
An electrostatic traveling wave is responsible for accelerating the gas
flow in the peristaltic flow mechanism. This mechanism employs a polyphase
power suppiy to energize successive linear strip actuators on a flat panel at
progressive voltage phase angles, leading to a traveling electrostatic wave that
accelerates the ions, as shown in Figure 1 .4. The neutral gas is accelerated due to
Lorentzian momentum transfer resulting from ion-neutral coll isions, as explained
before. A promising feature of this mechanism is that induced peristaltic flow
velocities up to several hundred m/s may be possible, which is comparable with
aircraft flight speeds [11] .
As shown in Figure 1 .4, individual actuator electrodes are energized
with a phase angle that increases from left to right, giving rise to a traveling
electrostatic wave moving from left to right. The electrodes are spaced L m apart,
and each is energized by a single sequenced phase of the polyphase power supply
output. When there are N electrodes per RF period placed on the panel, each
9
sin( Ci)t+34-} Polyphase SIll j Ci)t+1 4-f power sin( {&)t+4-} Supply
Electrode strip�
sin( Ci)t}
... " Conducting Sheet Electrode
Plaslna
Figure 1 .4 Polyphase power supply used to energize a peristaltic panel.
1 0

actuator electrode has a phase angle of 3600lN with respect to the adjacent
electrode. The voltage of the traveling wave, V, is expressed as
V=Vosin(Ult-lex) Volts,
where k is the wavenumber of the electrostatic wave,
k=� NL
-I m .
The phase angle cP between adjacent electrode pairs is given by,
cP=
The maximum horizontal electric field of the traveling wave is
Emax = 27r Va
NL Vim,
And the maximum ion-induced neutral convection velocity Voi is
Voi = fJi Emax =
e --- x 2Vo
NT-mis,
where Ili is the ion mobilty and A1i is the jon mass.
1 1
(6)
(7)
(8)
(9)
(1 0)

2. ELECTRODE GEOMETRIES
2.1 Parallel Plate Plasma Reactors
A parallel plate plasma reactor operated as an OAUGDp® with dielectric
coated electrodes was shown in Figure 1.1. The structures shown in Figure 1.1
reverse their sequence with each half cycle of the RF. This configuration,
however, is not useful for aerodynamic flow control. Other actuator
configurations similar to Figure 2.1 were tested at the UT Plasma Sciences
Laboratory, where bare electrodes of opposite RF polarity were located on the
same side of a dielectric panel. this configuration not only gave rise to sparking
and tracking, but also the maximum time the panel would survive without
breakdown was only 5-10 seconds.
2.2 Coplanar Plasma Actuators
Due to the lack of utility of the parallel plate configuration for
aerodynamic applications, several approaches were tried at the UT Plasma
Sciences Laboratory to produce OAUGD plasma on a flat panel. In panels
designed early in 1995, bare electrodes were placed on the same side of a
dielectric panel. This configuration, however, gave rise to tracking and sparking
on the panel surface. Thereafter, panels were designed that had electrodes of
different polarity on opposite sides of the panel.
To understand the coplanar actuator configuration, one can visualize that
the upper electrode of a parallel plate reactor is flipped over and placed adjacent
to the lower electrode to make them coplanar as in Figure 2.1. 12
Faraday Dark Space
Negative Glow -----.
Cathode Dark Space
Electrode
Dielectric -----' Vet)
Figure 2.1 Features of the normal gllow discharge during half the
RF cycle.
13

Such a configuration is capable of providing a purely EHD coupling
between the electric field in the plasma and the neutral gas in the boundary layer
through Lorentzian collisions. The structures in the co-planar flat panel
configuration used for aerodynamic flow control are illustrated in Figure 2.1.
This configuration forms a flat layer of surface plasma. As shown in Figure 2.1,
the structures of the nom1al glow discharge plasma are distributed along the
length of arched electric field lines.
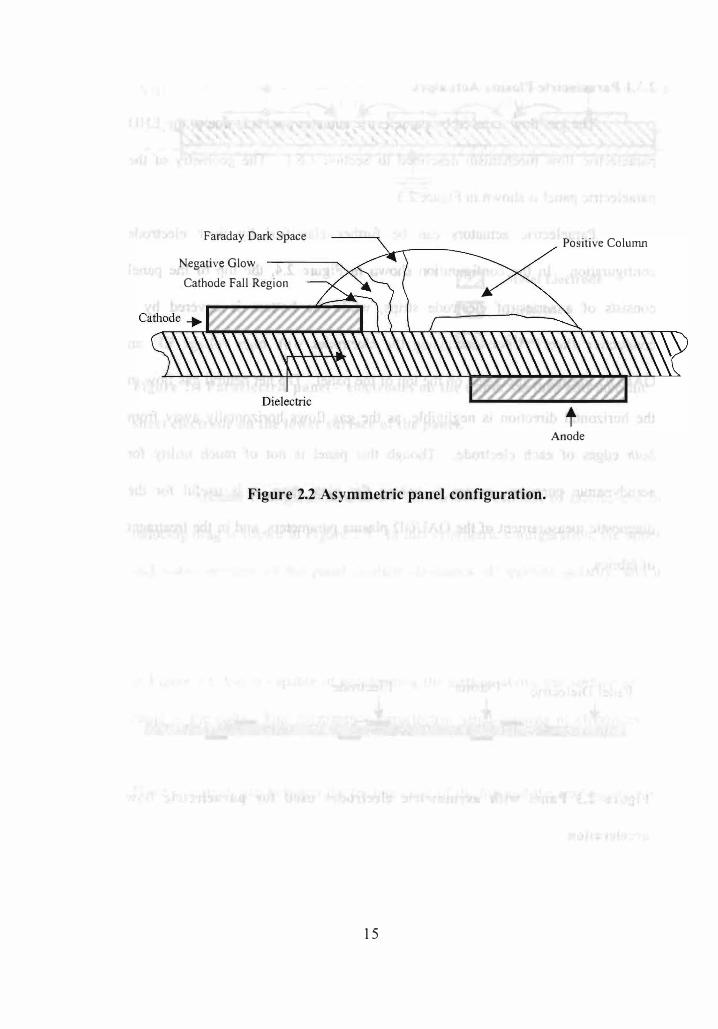
2.3 Asymmetric Electrode Configuration
Except for the curved shape of the electric field lines, plasma generation
in the asymmetric, co-planer configuration of Figure 2.2 is similar to that of the
parallel plate configuration. The strength of the electric field is greatest near the
facing edges of the two electrodes, and decreases as the distance from the
electrodes increases. For the first half cycle, illustrated in Figure 2.2, the
dielectric behaves as an anode (pseudo anode), and the electrons, after being
emitted from the instantaneous cathode on the ieft, travel towards the pseudo
anode. These electrons collide with neutrals and lead to further ionization.
During the second half cycle, the energy density in the (now positive column)
plasma is less than that of the first half cycle [12]. The electrons possess energy
comparable to the threshold ionization energy only in the cathode region. Due to
the inability of the pseudo cathode (dielectric) to emit thermionic electrons,
electrons decrease in number as they recombine.
14
Faraday Dark Space
Negative Glow
Cathode Fall Region
Figure 2.2 Asymmetric panel configuration.
15
Positive Colunm
t Anode

2.3.1 Paraelectric Plasma Actuators
The gas flow induced by paraelectric actuator panels is due to the EHD
paraelectric flow mechanism described in Section 1.6.1. The geometry of the
paraelectric panel is shown in Figure 2.3.
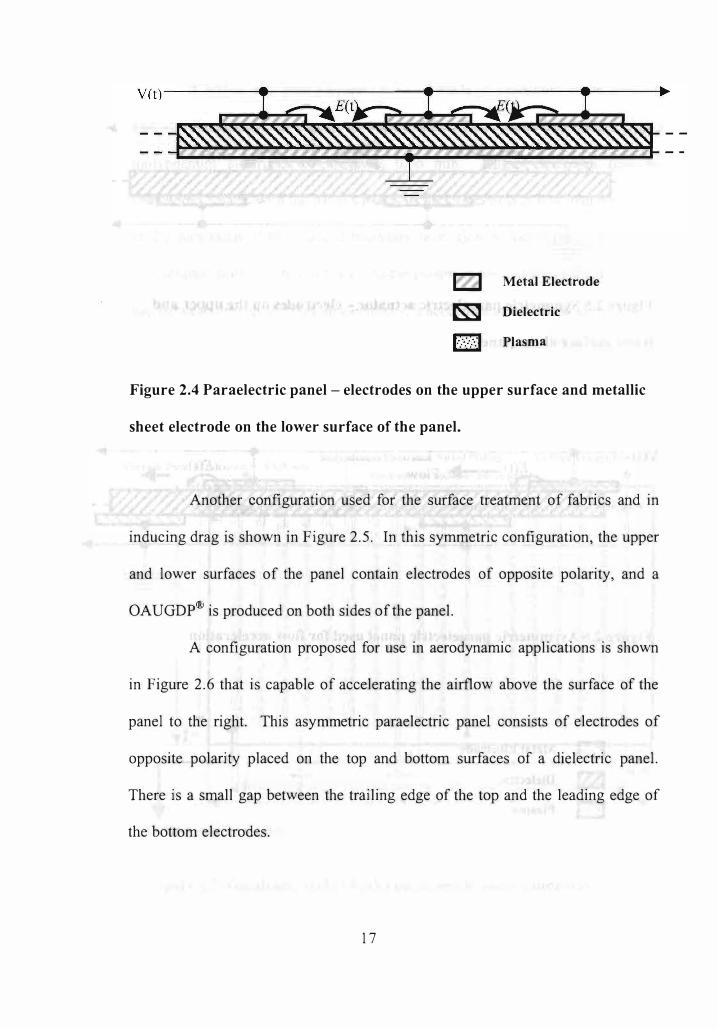
Paraelectric actuators can be further classified by their electrode
configuration. In the configuration shown in Figure 2.4, the top of the panel
consists of a series of electrode strips, while the bottom is covered by a
conductive sheet. Upon energizing the electrodes with high voltage RF, an
OAUGD Plasma is produced on the top of the panel. The net neutral gas flow in
the horizontal direction is negligible, as the gas flows horizontally away from
both edges of each electrode. Though this panel is not of much utility for
aerodynamic purposes, except to induce flat plate drag, it is useful for the
diagnostic measurement of the OAUGD plasma parameters, and in the treatment
of fabrics.
Figure 2.3 Panel with asymmetric electrodes used for paraelectric flow
acceleration.
16
v(t)---------i.------------------e----·
IZl Metal Electrode
� Dielectric
[:.:·::.:·:1 Plasma
Figure 2.4 Paraelectric panel- electrodes on the upper surface and metallic
sheet electrode on the lower surface of the panel.
Another configuration used for the surface treatment of fabrics and in
inducing drag is shown in Figure 2 .5 . In this symmetric configuration, the upper
and lower surfaces of the panel contain electrodes of opposite polarity, and a
OAUGDp® is produced on both sides of the panel.
A configuration proposed for use in aerodynamic applications is shown
in Figure 2 .6 that is capable of accelerating the airflow above the surface of the
panel to the right. This asymmetric paraelectric panel consists of electrodes of
opposite polarity placed on the top and bottom surfaces of a dielectric panel.
There is a small gap between the trailing edge of the top and the leading edge of
the bottom electrodes.
1 7
v(t) ----""--".......,...-'------.,------____ ......,...�_c_:"---�---.
Figure 2.5 Symmetric paraelectric actuator - electrodes on the upper and
lower surface of the panel.
v(t)----------------------tt--------...
Figure 2.6 Asymmetric paraelectric panel used for flow acceleration.
[ZJ Metal Electrode
� I>ielectric
f:.:.::.: . .) P I as m a
18
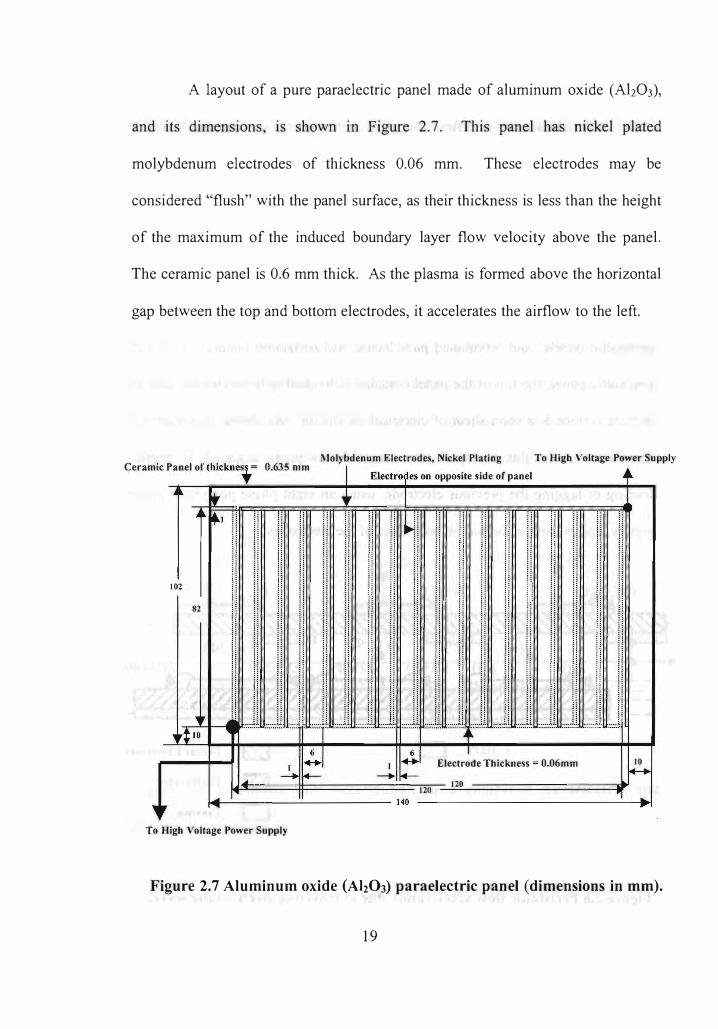
A layout of a pure paraelectric panel made of aluminum oxide (Ab03),
and its dimensions, is shown in Figure 2 .7 . This panel has nickel plated
molybdenum electrodes of thickness 0.06 mm. These electrodes may be
considered "flush" with the panel surface, as their thickness is less than the height
of the maximum of the induced boundary layer flow velocity above the panel.
The ceramic panel is 0.6 mm thick. As the plasma is formed above the horizontal
gap between the top and bottom electrodes, it accelerates the airflow to the left.
Molybdenum Electrodes, Nickel Plating Ceramic Panel of thicknest = 0.635 mm
To High Voltage Power Supply
,
,
il 102
82
; i
T Electro?es on opposite side of panel
i
......• ..:.
I ,
I
I
II II 11
.,1 .,1 :: n p
ii Ii II
11
" II I·
:::: .. 1 ! ... ,1.,1 ......
,. .1.1 II i i.� H . ..,1
..
,1 i)
....... "H·:::�:'J./::::::".7P:::::::::U:: :::�':y:::·:::.7lJ::::::::: .ti, il JI .
" i'I.I:::::.r::JJ::::::::,U .�. .:J'!' :::",1.: I::::.
1 �I Electrode Thickness = 0.06mm
120 10
1+-+ 120
���--------------------140 ________ __________________ ·I __ �. I
To High Voltage Power Supply
Figure 2.7 Aluminum oxide (Ah03) paraelectric panel (dimensions in mm).
19

2.3.2 Peristaltic Plasma Actuators
Peristaltic panels differ from paraelectric panels in both the layout of
electrodes and the manner in which the RF voltage is supplied to the individual
electrodes. While all electrodes are energized in phase in the paraelectric mode,
individual electrodes in the peristaltic mode are energized by RF voltages with
different phase angles.
Peristaltic panels can be classified into two categories, namely 'pure
peristaltic panels' and 'combined paraelectric and peristaltic panels'. In a pure
peristaltic panel, the top of the panel contains individual strip electrodes, and the
bottom surface is a solid sheet of electrical conductor. As shown in Figure 2.8,
the electrodes (in this example) are energized at a phase angle of 45 degrees
leading or lagging the previous electrode, using an eight phase polyphase power
supply, and plasma is formed on both sides of the electrodes.
IZ1 Metal Electrode
ts.;SI Dielectric
[:.:'::.:·:1 Plasma
Figure 2.8 Peristaltic flow acceleration due to traveling electrostatic wave.
20
This excitation produces a traveling electrostatic wave that accelerates the ions.
Due to Lorentzian momentum transfer by ion-neutral collisions, the neutral gas is
accelerated. The paraelectric flow acceleration effects on either side of the
electrodes are cancelled out by the adjacent electrode, thus leading to a purely
peristaltic flow mechanism. However, the paraelectrically induced gas flows
away from both sides of each electrode and creates vortices and disrupts the
peristaltic flow acceleration process by generating turbulence [13].
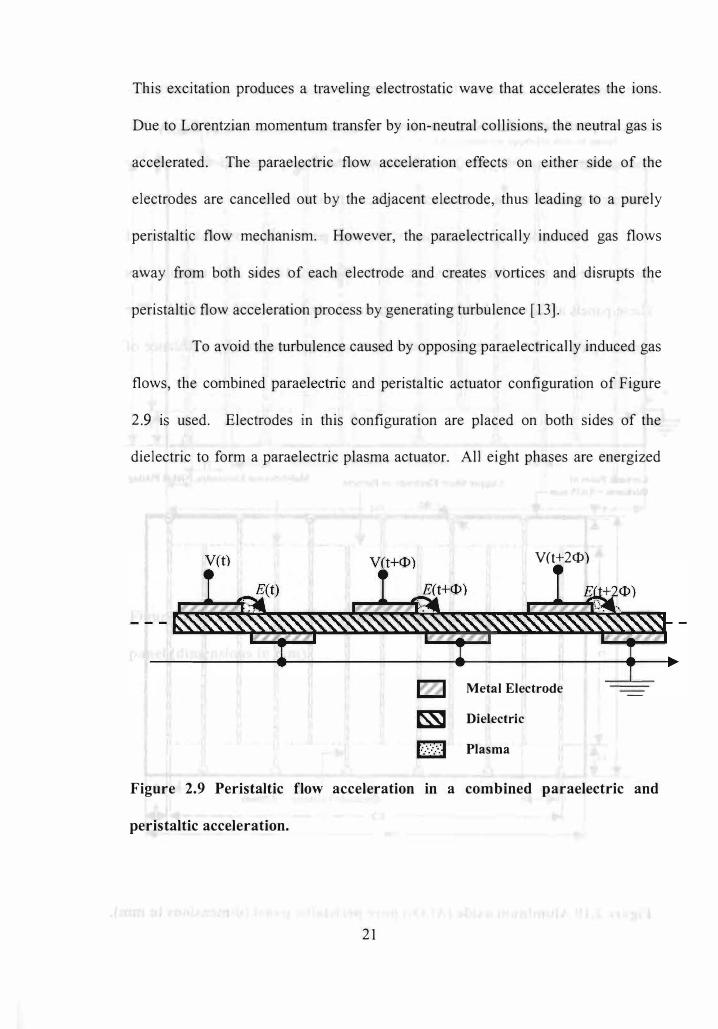
To avoid the turbulence caused by opposing paraelectrically induced gas
flows, the combined parae .ectric and peristaltic actuator configuration of Figure
2.9 is used. Electrodes in this configuration are placed on both sides of the
dielectric to form a paraelectric plasma actuator. All eight phases are energized
V(t+2<1»
IZl Metal Electrode
� I>ielectric
I:.:'::.:':) Plasma
Figure 2.9 Peristaltic flow acceleration in a combined paraelectric and
peristaltic acceleration.
21
with separate such actuators, thus avoiding turbulence caused by the upstream-
induced paraelectric flow from the pure peristaltic configuration of Figure 2.8.
The configuration of Figure 2.9 adds the paraelectrically induced flow velocity
from each actuator to the peristaltically induced flow velocity.
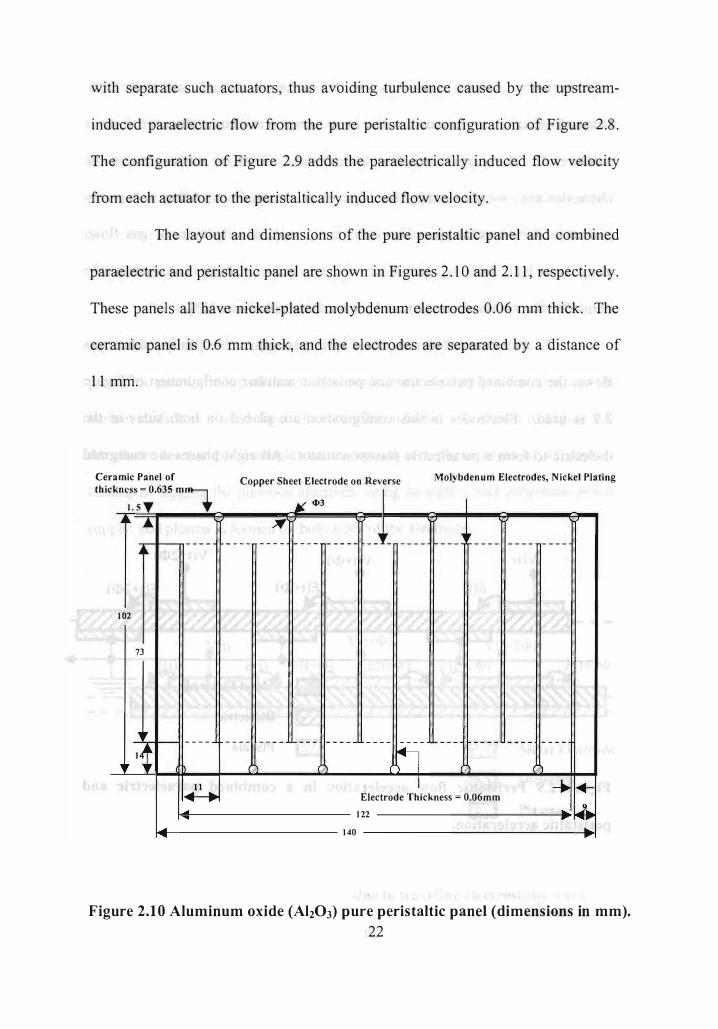
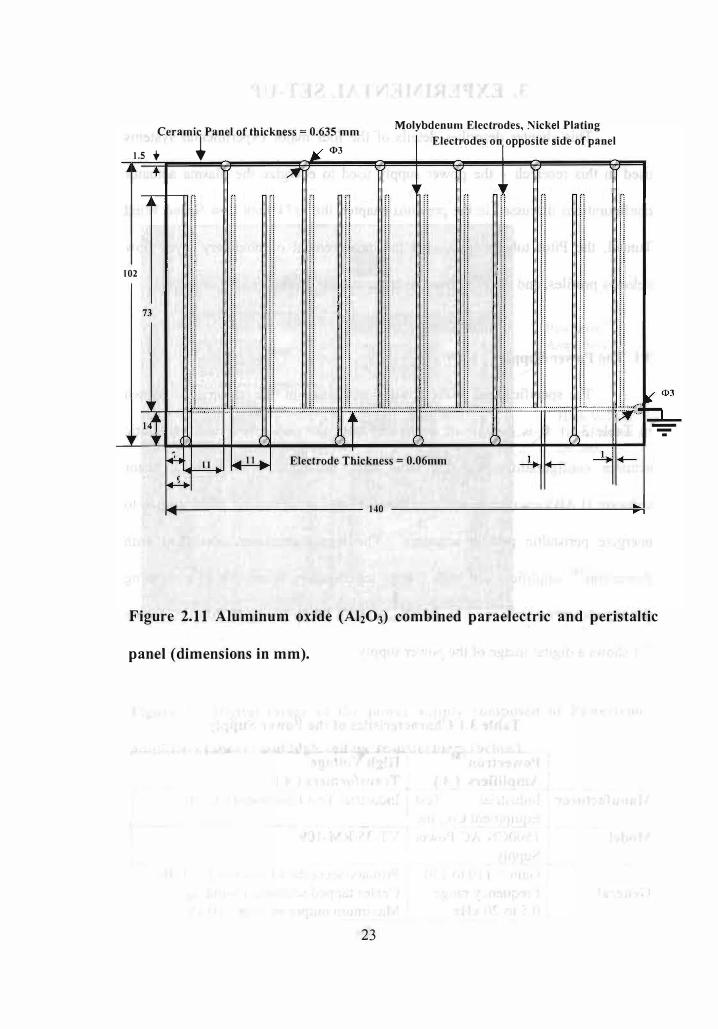
The layout and dimensions of the pure peristaltic panel and combined
paraelectric and peristaltic panel are shown in Figures 2. 1 0 and 2.11, respectively.
These panels all have nickel-plated molybdenum electrodes 0.06 nun thick. The
ceramic panel is 0.6 mm thick, and the electrodes are separated by a distance of
11 mm.
Ceramic Panel of thickness - 0 635 m. -
l.sT �IL �
�IL
102
73
" 1
"
... ""
----
----
� .... ""
Copper Sheet Electrode on Reverse
- - --
----
� ----
- ---
Jt <1>3
---
- --
-----
----
�
- - -
----
----
�
----
M I
Molybdenum Electrodes, Nickel Plating
---
---
.. ---- ----
----�'-�--
----
- - - -
� .-Electrode Thickness = O.06mm
122 � • 140 . , �
Figure 2.10 Aluminum oxide (Ah03) pure peristaltic panel (dimensions in mm). 22
Ceramic Panel of thickness = 0.635 mm
1.5 . ... !i <1>3
Molybdenum Electrodes, Nickel Plating
Electrodes on opposite side of panel
+
102
73
, 1r
:: 11
Ii II ::
,I
II " I,ll.' : : . . �":. ;.�,. Ii " . . "
i1.:::.: .. :.:.: ... : .. :::::::.:::::: .. ' L::: .. : .. . l'·;·; .. · .......... II·:" ...... · ...... ·Jl�, .... ........ ·l t.".:.: .. :.: .. :::: .. :.::� ... " •. ,.: .. :: .. : .. :: .. :: .. :.: .. : ... j � .. ;. .. � . ........... ... . ............ 11 .... , .. ', .. ............. ............. 1 .1.t:::: .. :: .::: : ... . � � <1>3 .. �.. ................ ..........
� �� ) I ( -:-
� 14-..:..1=-1 �, II � Electrode Thickness = 0.06mm
.4 14�1--.----------- 140 ....
Figure 2. 1 1 Aluminum oxide (Ah03) combined paraelectric and peristaltic
panel (dimensions in mm).
23
3. EXPERIMENTAL SET-UP
This chapter describes details of the four major experimental systems
used in this research - the power supply used to energize the plasma actuator
configurations discussed in the previous chapter, the 7x 11 Inch Low Speed Wind
Tunnel, the Pitot tube system used for measurement of boundary layer flow
velocity profiles, and the experimental apparatus for smoke visualization tests.
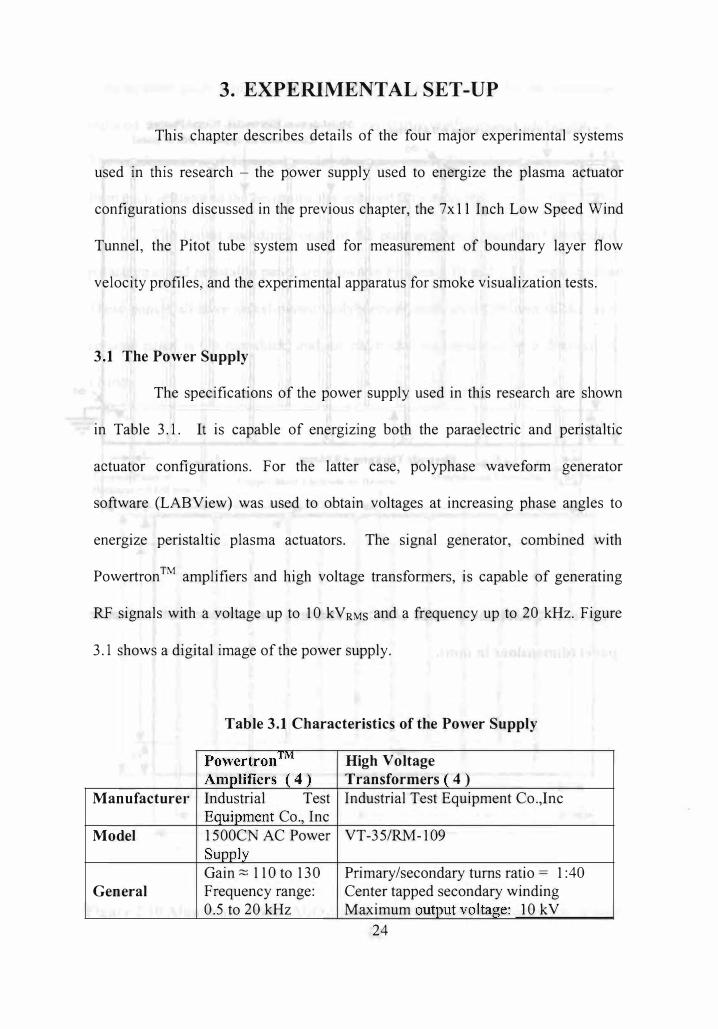
3.1 The Power Supply
The specifications of the power supply used in this research are shown
in Table 3.l. It is capable of energizing both the paraelectric and peristaltic
actuator configurations. For the latter case, polyphase waveform generator
software (LABView) was used to obtain voltages at increasing phase angles to
energize peristaltic plasma actuators. The signal generator, combined with
Powertron ™ amplifiers and high voltage transformers, is capable of generating
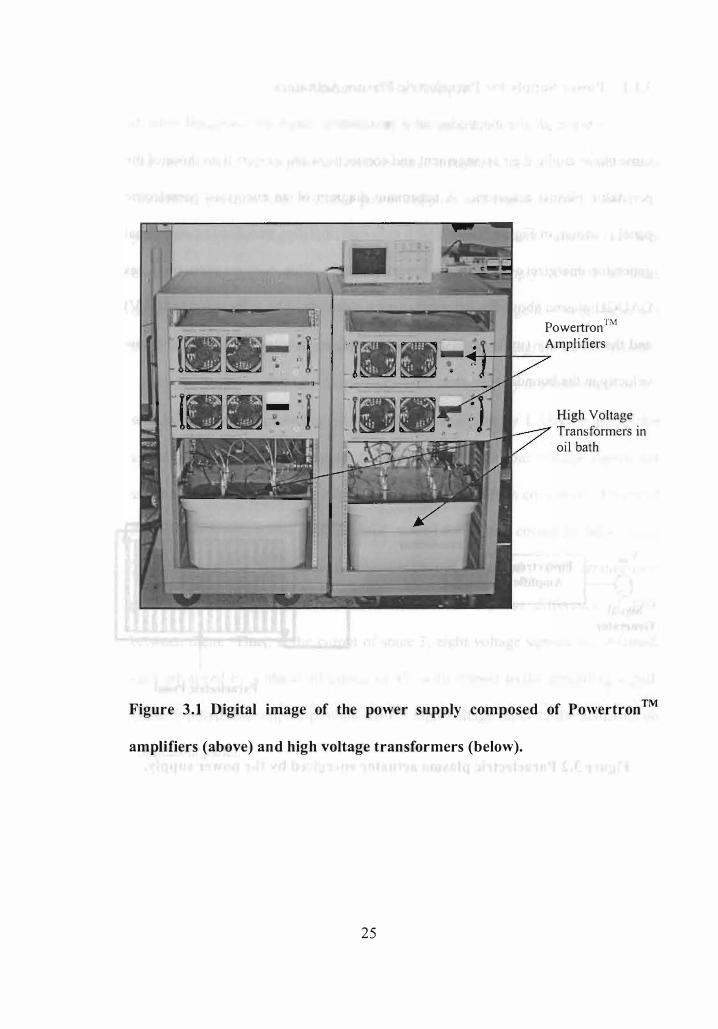
RF signals with a voltage up to 10 kVRMs and a frequency up to 20 kHz. Figure
3.1 shows a digital image of the power supply.
Table 3.1 Characteristics of the Power Supply
PowcrtronJW1 High Voltage Amplifiers (4 ) Transformers ( 4 )
Manufacturer Industrial Test Industrial Test Equipment Co.,Inc Equipment Co., Inc
Model 1500CN AC Power VT-35/RM-109 Supply Gain;:::; llO to 130 Primary/secondary turns ratio = 1:40
General Frequency range: Center tapped secondary winding 0.5 to 20 kHz Maximum output voltage: lOkV
24
Powertron ™
Amplifiers
High Voltage Transformers in oil bath
Figure 3.1 Digital image of the power supply composed of Powertron ™
amplifiers (above) and high voltage transformers (below).
25
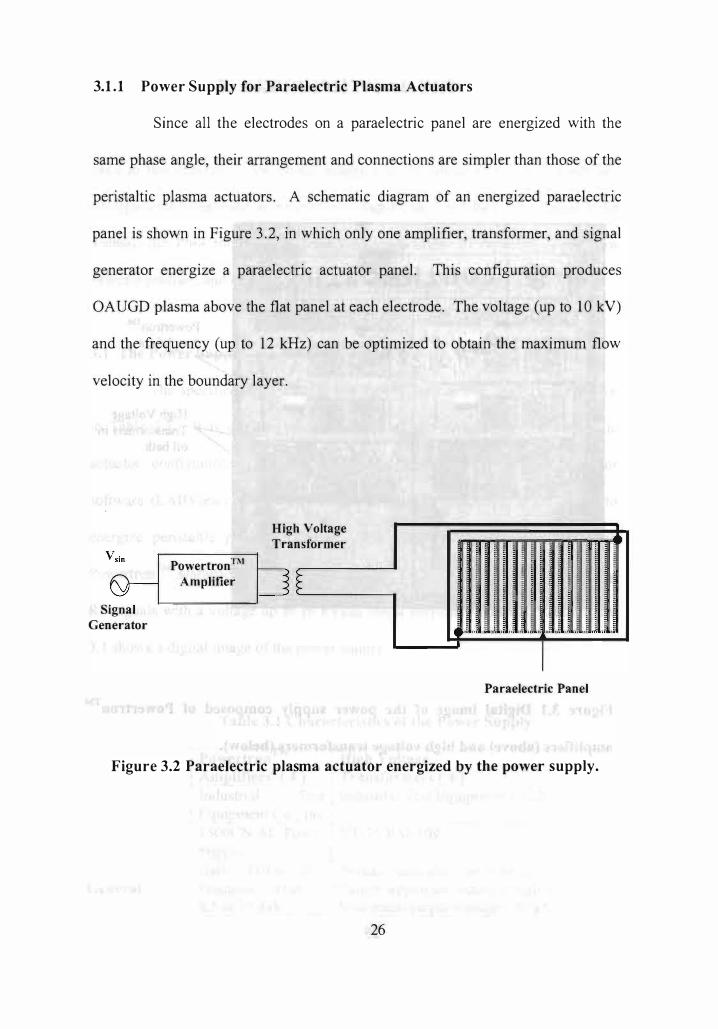
3.1.1 Power Supply for Paraelectric Plasma Actuators
Since all the electrodes on a paraelectric panel are energized with the
same phase angle, their arrangement and connections are simpler than those of the
peristaltic plasma actuators. A schematic diagram of an energized paraelectric
panel is shown in Figure 3 .2, in which only one amplifier, transformer, and signal
generator energize a paraelectric actuator panel. This configuration produces
OAUGD plasma above the flat panel at each electrode. The voltage (up to 1 0 kV)
and the frequency (up to 12 kHz) can be optimized to obtain the maximum flow
velocity in the boundary layer.
Signal
Generator
Powertron™
Amplifier
High Voltage
Transformer
�
i " ; " . • _ ' L 4 • I.. " ,,� , .. '"' .. '" .� ,. .. '" ,j,,,� "
Paraelectric Panel
Figure 3.2 Paraelectric plasma actuator energized by the power supply.
26
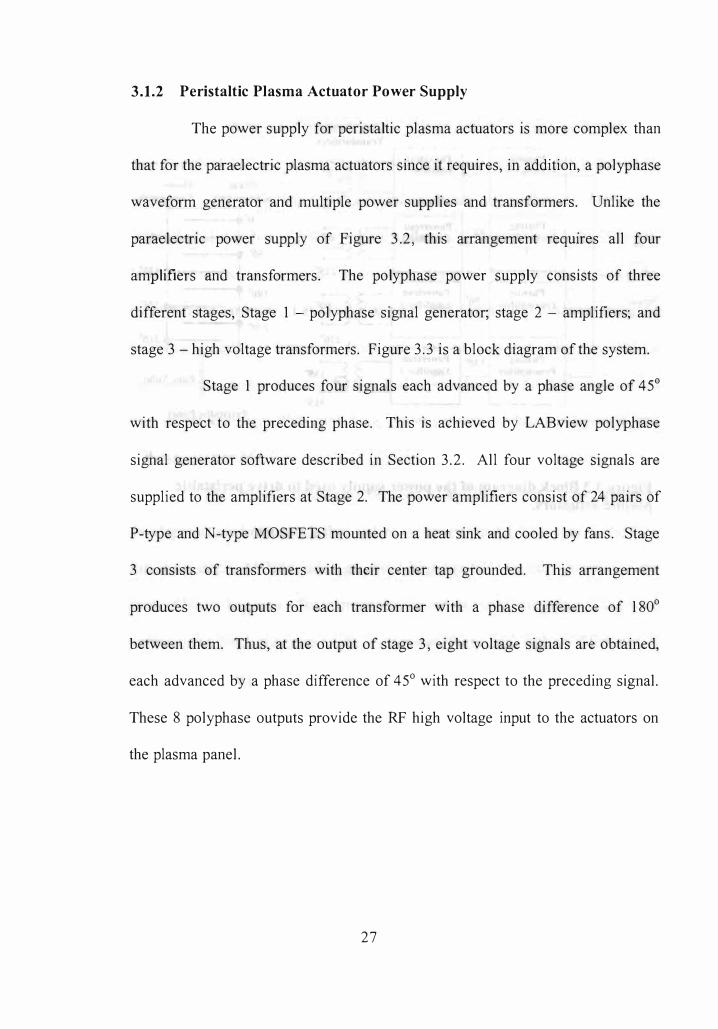
3.1 .2 Peristaltic Plasma Actuator Power Supply
The power supply for peristaltic plasma actuators is more complex than
that for the paraelectric plasma actuators since it requires, in addition, a polyphase
waveform generator and multiple power supplies and transformers. Unlike the
paraelectric power supply of Figure 3 .2 , this arrangement reqUIres all four
amplifiers and transformers. The polyphase power supply consists of three
different stages, Stage 1 - polyphase signal generator; stage 2 - amplifiers; and
stage 3 - high voltage transformers. Figure 3 .3 is a block diagram of the system.
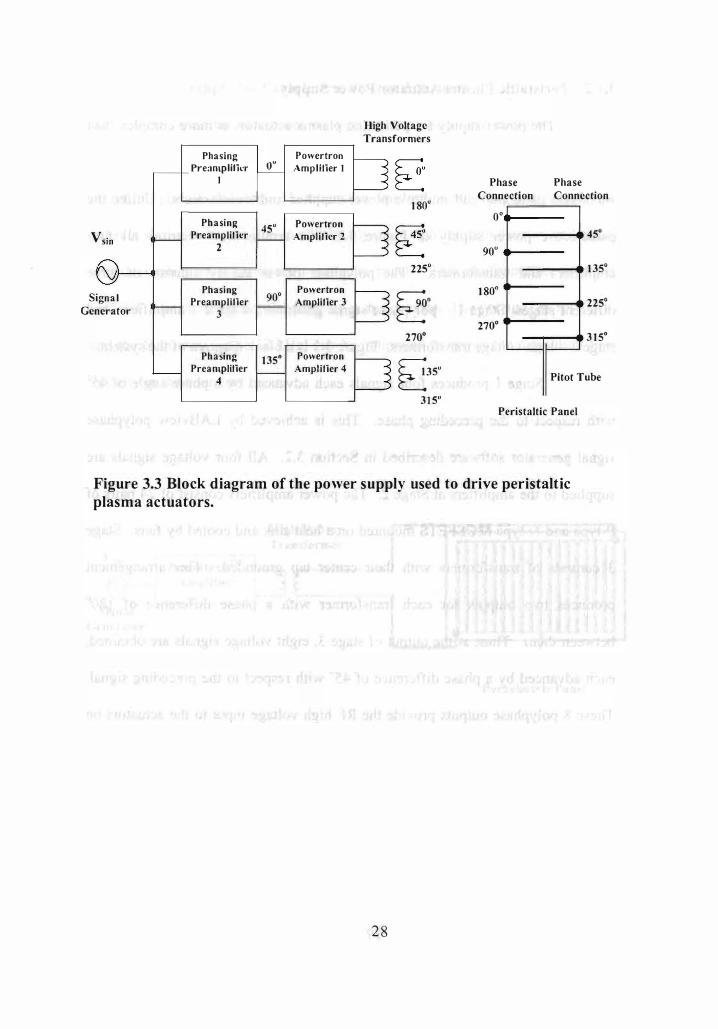
Stage 1 produces four signals each advanced by a phase angle of 45°
with respect to the preceding phase. This is achieved by LABview polyphase
signal generator software described in Section 3 .2 . All four voltage signals are
supplied to the amplifiers at Stage 2. The power amplifiers consist of 24 pairs of
P-type and N-type MOSFETS mounted on a heat sink and cooled by fans. Stage
3 consists of transformers with their center tap grounded. This arrangement
produces two outputs for each transformer with a phase difference of 1 80°
between them. Thus, at the output of stage 3 , eight voltage signals are obtained,
each advanced by a phase difference of 45° with respect to the preceding signal.
These 8 polyphase outputs provide the RF high voltage input to the actuators on
the plasma panel.
27
Vsin
Signal
Generator
Phasing Preamplilicr
I
Phasing Preamplifier
2
Phasing Preamplilier
3
Phasing Preamplifier
4
Powertron 0" Amplifier I
45" Powertron Amplifier 2
90· Powertron Amplifier 3
135" Powertron Amplifier 4
High Voltage Transformers
2 1 80"
� 225·
�. 2700
235"
3 1 5"
Phase Connection
0"
90"
1 80·
270·
L--
Phase Connection
450
1 350
2250
3 1 50 I--
Pitot T ube
Peristaltic Panel
Figure 3.3 Block diagram of the power supply used to drive peristaltic plasma actuators.
28

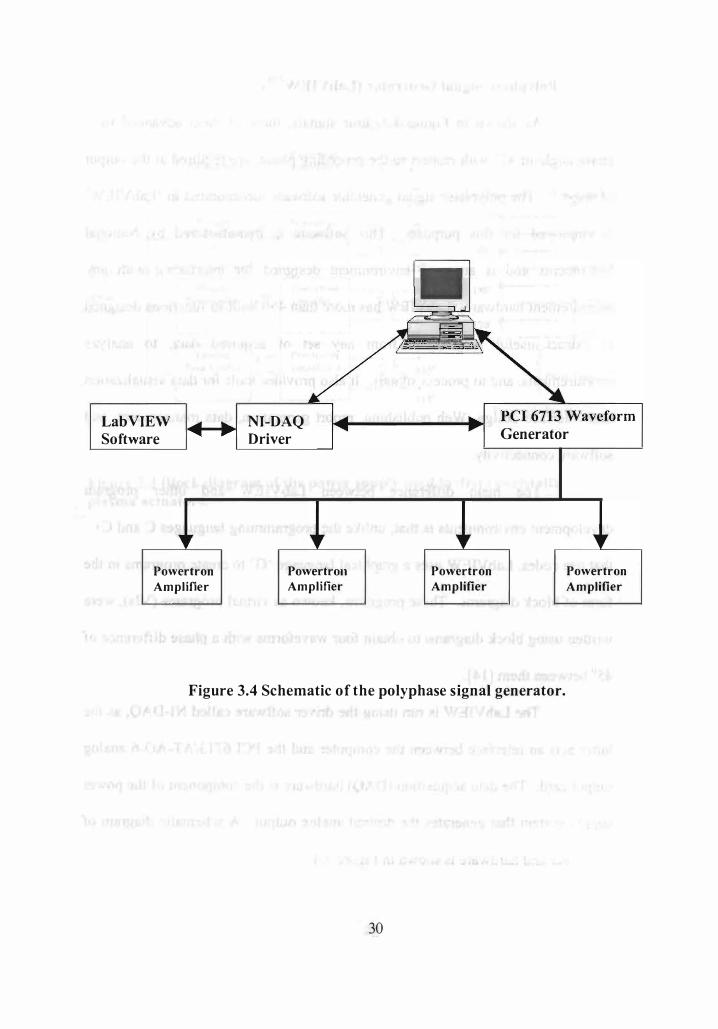
3.2 Polyphase Signal Generator (LabVIEW™)
As shown in Figure 3 . 3 , four signals, three of them advanced by a
phase angle of 45° with respect to the preceding phase, are required at the output
of stage 1 . The polyphase signal generator software incorporated in ' Lab VIEW'
is employed for this purpose. This software is manufactured by National
Instruments and is an open environment designed for interfacing with any
measurement hardware. LabVIEW has more than 450 built-in functions designed
to extract useful information from any set of acquired data, to analyze
measurements, and to process signals. It also provides tools for data visualization,
user interface design, Web publishing, report generation, data management, and
software connectivity.
The main difference between Lab VIEW and other program
development environments is that, unlike the programming languages C and C++
that use codes, LabVIEW uses a graphical language 'G' to create programs in the
form of block diagrams. These programs, known as virtual programs (VIs), were
written using block diagrams to obtain four waveforms with a phase difference of
45° between them [ 1 4] .
The LabVIEW is run using the driver software called NI-DAQ, as the
latter acts an interface between the computer and the PCI 67 1 31 A T -AO-6 analog
output card. The data acquisition (DAQ) hardware is the component of the power
supply system that generates the desired analog output. A schematic diagram of
the driver and hardware is shown in Figure 3 .4 .
29
LabVIEW Software
Powertron
Amplifier
NI-DAQ Driver
Powertrol1 Amplifier
Powertron Amplifier
Generator
Powertron
Amplifier
Figure 3.4 Schematic of the polyphase signal generator.
30
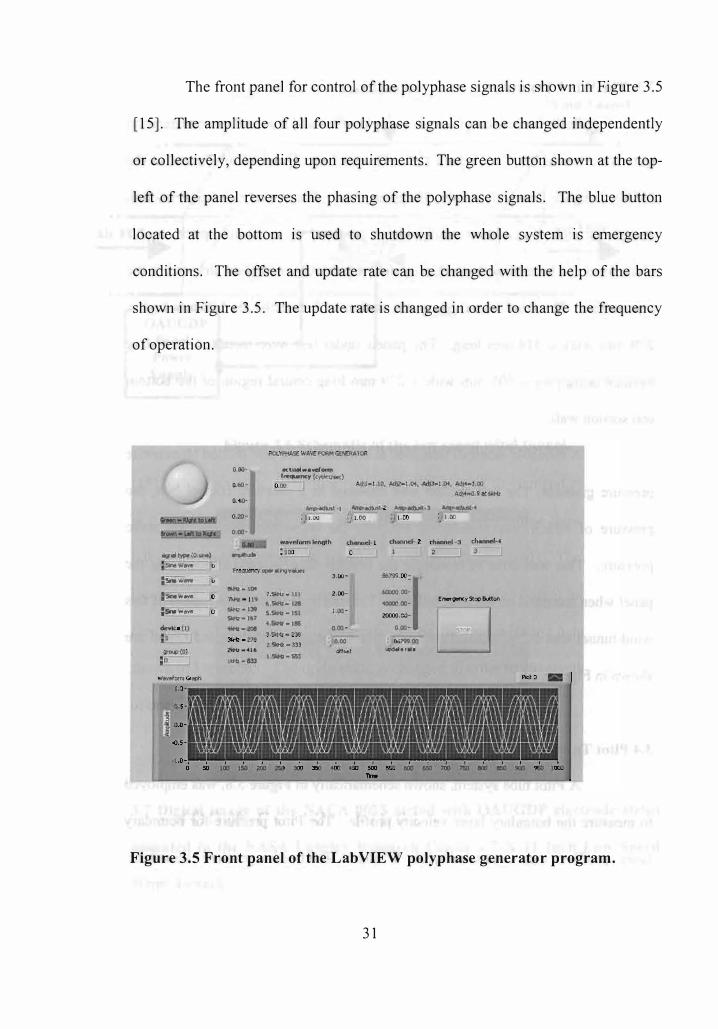
The front panel for control of the polyphase signals is shown in Figure 3.5
j(l 5]. The amplitude of all four polyphase signals can be changed independently
or collectively, depending upon requirements. The green button shown at the top-
left of the panel reverses the phasing of the polyphase signals. The blue button
located at the bottom is used to shutdown the whole system is emergency
conditions. The offset and update rate can be changed with the help of the bars
shown in Figure 3.5. The update rate is changed in order to change the frequency
of operation.
0,00- aa� ••• clc.m r ............ , (cydosJ",,)
0.60'"' 0 00
0.10-_ad",, '1 _ad"",,· �., _""", ••
0.20'
0.00-
� typo (O .... ) -
:) 1 .00 ��I 1.00
=)'inO...... 0 k_" "I'"'O!hQv .... 3.00-:,,"" .. 0;;-- 0
l_wlNO :es;r. W.:we
_ - 10< � - 1 l9 t>IOt> - l:!9 _ - 16'
_ - 201 _ - 210 2trrR _416 1 .... . 1133
1.sW-t:l - lli 2.00-6. __ 121
5._ - 151 1.00-_'- - 185 o,w -!.94iI _ 2311 .. _ - m
. 0.00 dfset
1 .SIHil - m
� 1 .00 -" 1 _.QQ-_.00- 1!:m.9IWlCY stop aJtton
L:J 2000C.OO-
c oo-06?99.oo �. , ...
Figure 3.5 Front panel of the Lab VIEW polyphase generator program.
31

3.3 The 'Vind Tunnel
Both the boundary layer velocity profiles and smoke flow visualization
tests were run in the 7 x 1 1 Inch (1 8 x 28 cm) Low Speed Wind Tunnel at the
NASA Langley Research Center, Hampton, VA. The tunnel is a conventional,
straight-through, open-return configuration powered by a variable-pitch, multi
blade axial fan located at the exit, providing a precisely controlled airspeed in the
test section. The wind tunnel has a test section with dimensions 1 78 mm high x
279 mm wide x 914 mm long. The panels under test were mounted on a drag
balance occupying a 305 mm wide x 279 mm long central region of the bottom
test section wall.
A movable sidewall was used to counteract the test section stream wise
pressure gradient. The test section was enclosed in a pressure control box, the
pressure of which was maintained equal to the freestream test section static
pressure. This was done to minimize the leakage flow in gaps surrounding the
panel when mounted on the drag balance. The maximum freestream speed of this
wind tunnel was 26 m/s. A schematic and a digital image of the wind tunnel are
shown in Figures 3.6 and 3.7 respectively.
3.4 Pitot Tube System
A Pitot tube system, shown schematically in Figure 3.8, was employed
to measure the boundary layer velocity profile. The Pitot pressure for boundary
layer profiles was measured with a quartz electronic pressure transducer
32
Test Section
:+: Wind Tunnel
. . ___ ======== ===;:� ____ ... --1 ..
Air Flo� I
I I • •
------.:============
OAUGDP
Panel
Power
Supply
�� Panel
I I
==:=::---- . .
Figure 3.6 Schematic of the low speed wind tunnel.
3.7 Digital image of the NACA 001 5 airfoil with OAUGDP electrode strips
mounted in the NASA Langley Research Center' s 7 X 1 1 Inch Low Speed
Wind Tunnel.
33
PLASTIC TUBING DIFFERENTIAL IEEE 488
READ OUT
COMPUTER
1 PRESSUE __ :&....�;;;:��� / GAUGES \ READ OUT
O.5 MM DIA STATIC PRESSURE PORT AT CENTER OF SIDE WALL �
TO TUNNEL VELOCITY PITOT PROBE
TEST SECTION/ PITOT TUBE
-M M M ""' 00 00
BAROMETRIC
PRESSURE GAUGE
Figure 3.8 Experimental configuration of the Pi tot tube system.
connected to a stainless steel tube, the elliptical end of which was 0.28 mm high
and 0.65 mm wide, with a 0. 1 mm wall thickness [ 1 6]. The system also included
2 differential pressure gauges to measure the differential pressure inside the wind
tunnel, and a barometric pressure gauge. All three pressure gauges are connected
to the computer through an IEEE 488 GPIB connection.
A commercially available traversing mechanism made by Aerotech
and shown in Figure 3 . 9 was used to move the Pitot tube in three dimensions at
speeds up to 1 00 mm/s. It consists of a digital step motor controller connected to
34
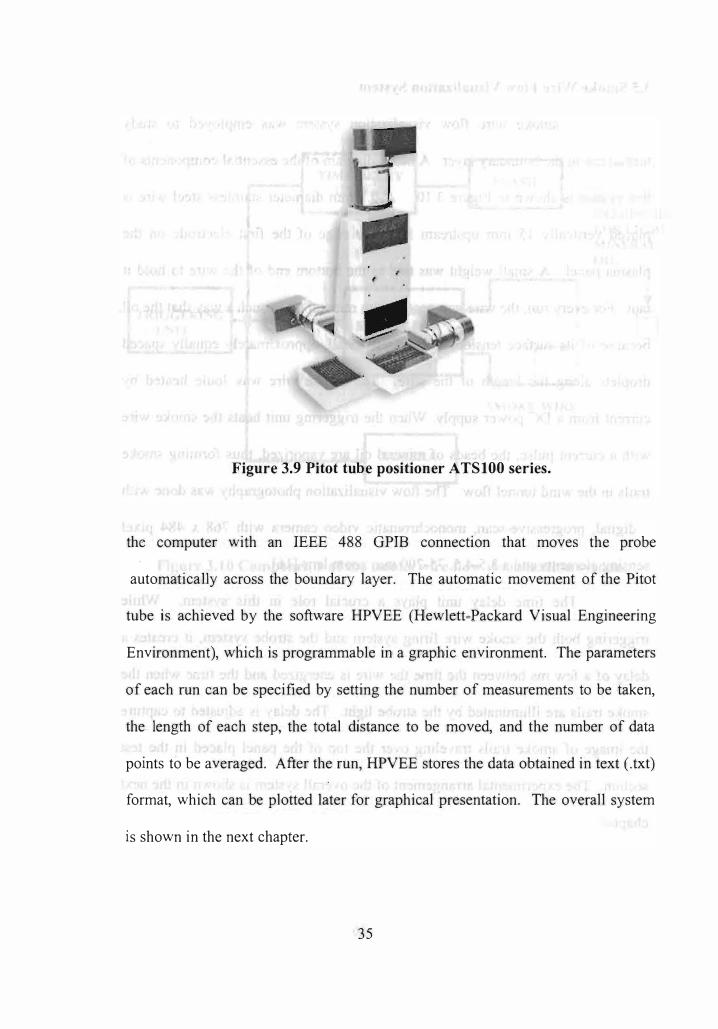
Figure 3.9 Pitot tube positioner ATSIOO series.
the computer with an IEEE 488 GPIB connection that moves the probe
automatically across the boundary layer. The automatic movement of the Pitot
tube is achieved by the software HPVEE (Hewlett-Packard Visual Engineering
Environment), which is programmable in a graphic environment. The parameters
of each run can be specified by setting the number of measurements to be taken,
the length of each step, the total distance to be moved, and the number of data
points to be averaged. After the run, HPVEE stores the data obtained in text (.txt)
format, which can be plotted later for graphical presentation. The overall system
is shown in the next chapter.
35
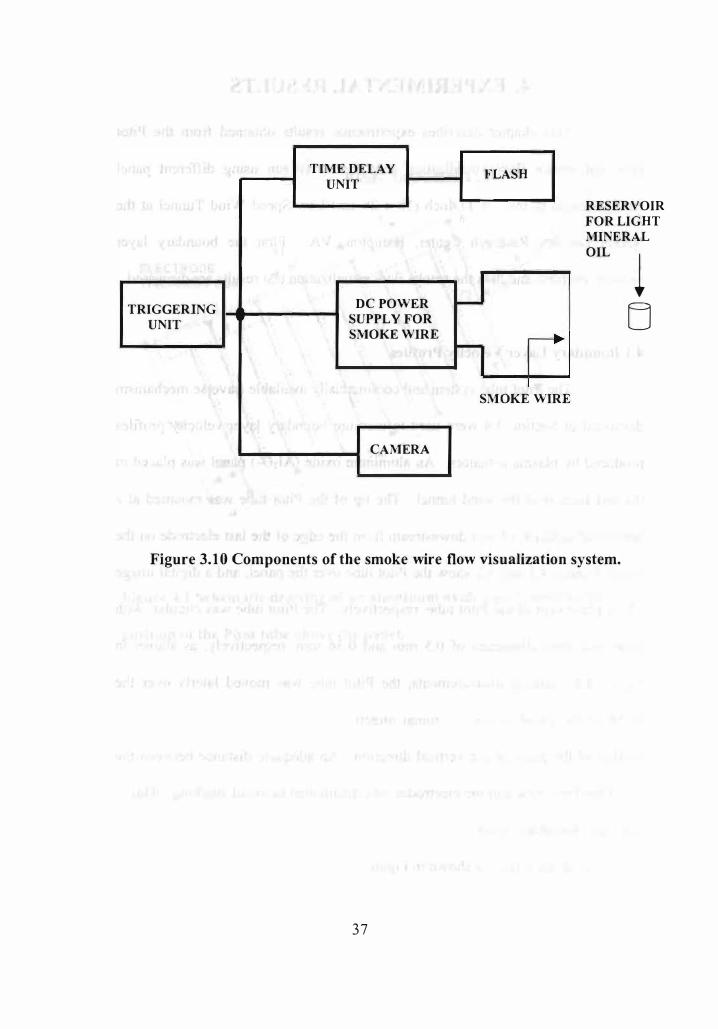
3.5 Smoke Wire Flow Visualization System
A smoke wire flow visualization system was employed to study
turbulence in the boundary layer. A block diagram of the essential components of
this system is shown in Figure 3 . 10 . A 0. 1 mm diameter stainless steel wire is
placed vertically 1 5 mm upstream from the edge of the first electrode on the
plasma panel. A small weight was tied to the bottom end of the wire to hold it
taut. For every run, the wire was coated with mineral oil in such a way that the oil ,
because of its surface tension, would foml small , approximately equally spaced
droplets along the length of the wire. The smoke wire was louIe heated by
cutTent from a DC power supply. When the triggering unit heats the smoke wire
with a cutTent pulse, the beads of mineral oil are vaporized, thus forming smoke
trails in the wind tunnel flow. The flow visualization photography was done with
a digital , progressive-scan, monochromatic video camera with 768 x 484 pixel
sensing elements and a 3 . 5-4 . 5 , 75 -200 mm zoom lens [ 1 6] .
The time delay unit plays a crucial role in this system. While
triggering both the smoke wire firing system and the strobe system, it creates a
delay of a few ms between the time the wire is energized and the time when the
smoke trails are illuminated by the strobe light. The delay is adjusted to capture
the image of smoke trails traveling over the top of the panel placed in the test
section. The experimental atTangement of the overal l system is shown in the next
chapter.
36
TIME DEl.AY UNIT
r
TRIGGERING DC POWER UNIT SUPPLY FOR
SMOKE WIRE
CAMERA
FLASH
LJ
n �
SMOKE WIRE
RESERVOIR FOR LIGHT MINERAL OIL
! u
Figure 3.10 Components of the smoke wire flow visualization system.
37
4. EXPERIMENTAL RESULTS
This chapter describes experimental results obtained from the Pitot
tube and smoke flow visualization tests that were run using different panel
configurations in the 7 x 1 1 Inch ( 1 8 x 28 cm) Low Speed Wind Tunnel at the
NASA Langley Research Center, Hampton, V A. First the boundary layer
velocity profiles, and then the smoke flow visualization test results are discussed.
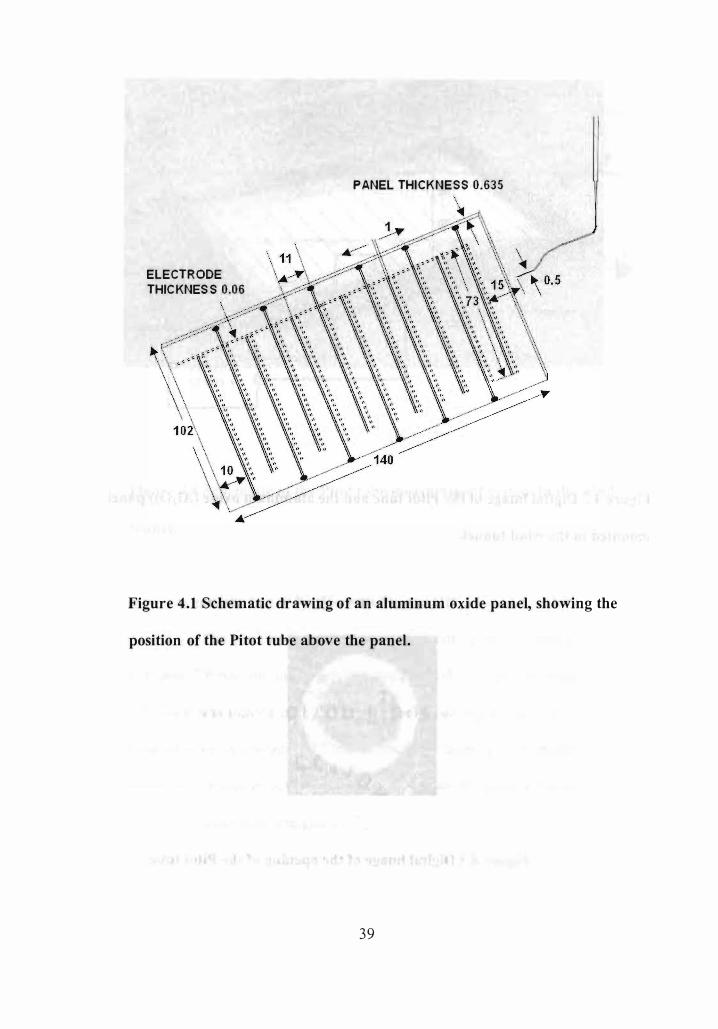
4.1 Boundary Layer Velocity Profiles
The Pitot tube system and commercially available traverse mechanism
discussed in Section 3 .4 were used to measure boundary layer velocity profiles
produced by plasma actuators. An aluminum oxide (Ah03) panel was placed in
the test section of the wind tunnel . The tip of the Pi tot tube was mounted at a
horizontal distance 15 mm downstream from the edge of the last electrode on the
panel. Figures 4. 1 and 4.2 show the Pitot tube over the panel , and a digital image
of the placement of the Pitot tube, respectively. The Pitot tube was circular, with
outer and inner diameters of 0 .5 mm and 0.36 mm, respectively, as shown in
Figure 4 .3 . During measurements, the Pitot tube was moved laterly over the
width of the panel in the horizontal direction and as much as 3 cm above the
surface of the panel in the vertical direction. An adequate distance between the
tip of the Pitot tube and the electrodes was maintained to avoid sparking. This is
why the boundary layer profile along the flow direction was not taken . A
schematic of the system is shown in Figure 4.4.
38
ELECTR ODE THIC KNES S 0.06
P ANEL THICKNESS 0.635
Figure 4.1 Schematic drawing of an aluminum oxide panel, showing the
position of the Pi tot tube above the panel.
39
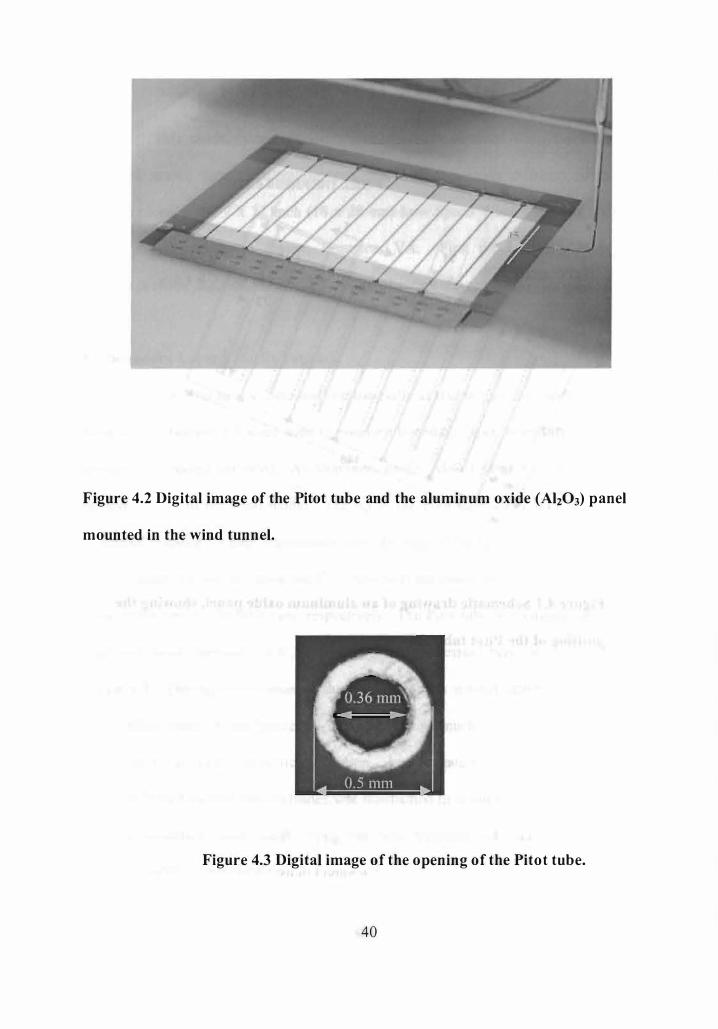
Figure 4.2 Digital image of the Pitot tube and the aluminum oxide (Alz03) panel
mounted in the wind tunnel.
Figure 4.3 Digital image of the opening of the Pitot tube.
40
STEPPING MOTOR ACTUATOR WIND TUNNEL � TEST lCTION � WIND TUNNEL
� • . ----�============== ========��---- . .
AIR FL0j. I
I, ' • .
----
--�
====
====
==
AIR FL� o=:" i ______ • •
'----.-- PANEL OAUGDP PANEL
POWER SUPPLY
PITOT TUBE
Figure 4.4 Schematic of the Pitot tube measurement system in the wind
tunnel.
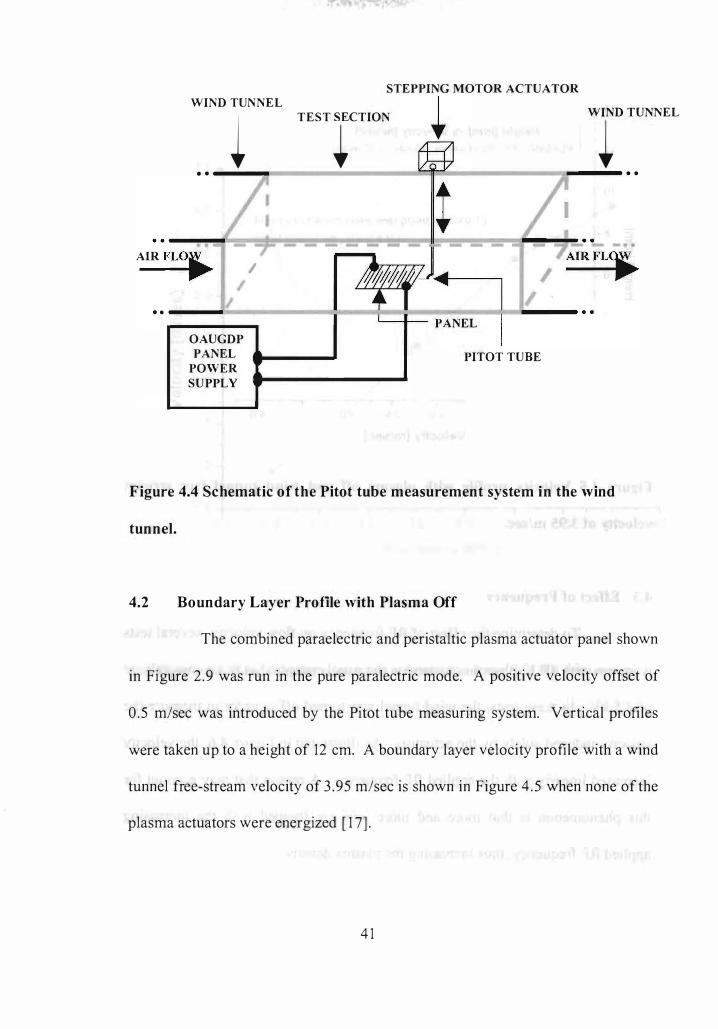
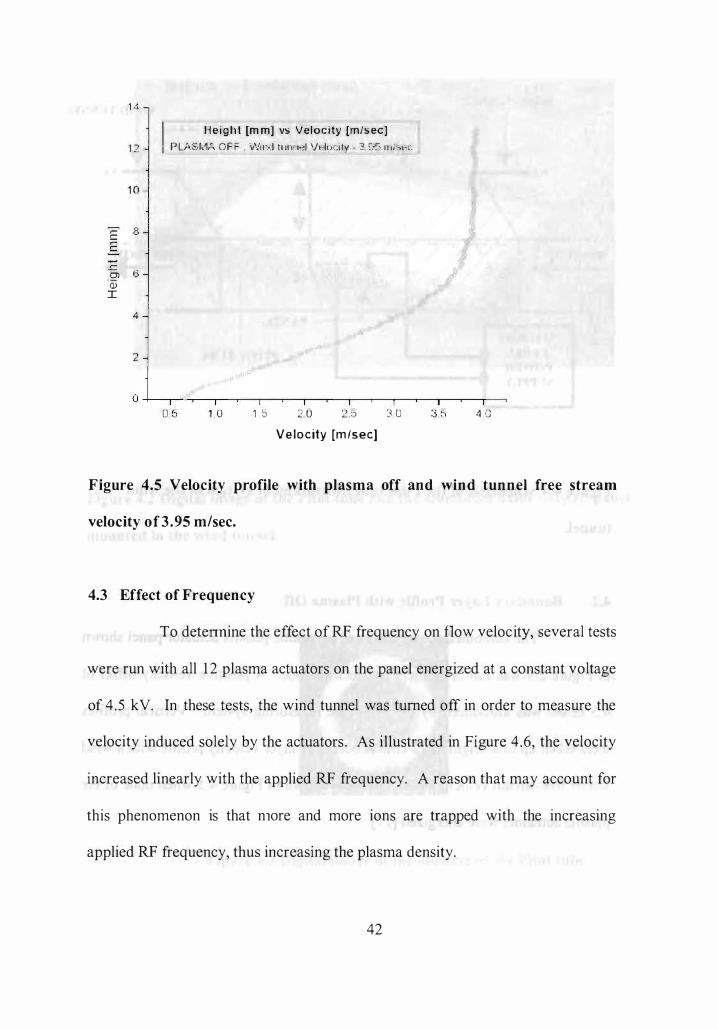
4.2 Boundary Layer Profile with Plasma Off
The combined paraelectric and peristaltic plasma actuator panel shown
in Figure 2 .9 was run in the pure paralectric mode. A positive velocity offset of
0 .5 m/sec was introduced by the Pitot tube measuring system. Vertical profiles
were taken up to a height of 12 cm. A boundary layer velocity profile with a wind
tunnel free-stream velocity of 3 .95 m/sec is shown in Figure 4 .5 when none of the
plasma actuators were energized [ 1 7] .
4 1
1 4
1 2
E 8 r-c:::
r::. Ql 6 Q) I
4
2
I He igh t [m m] vs Velocity [m/sec] • ';,' ,. ....... , - . ' ,' ... - o r � \ - -- t'
" ':I i.r., . ' ,.,. - ,-. P Lf',,, J.1,, " F r- , V , I I ,·,J t l JI � 1 . .1 JtollJ .. l ly - .. � '. 11 " ,,1-0. .
O +--'- -�'-�--'I��'I--�-'�--'t--�'I--�-'� 1 . 0 1 b � U � ,o J O 3 ,b 4 .U
Velocity [m /sec]
Figure 4.5 Velocity profile with plasma off and wind tunnel free stream
velocity of 3.95 m/sec.
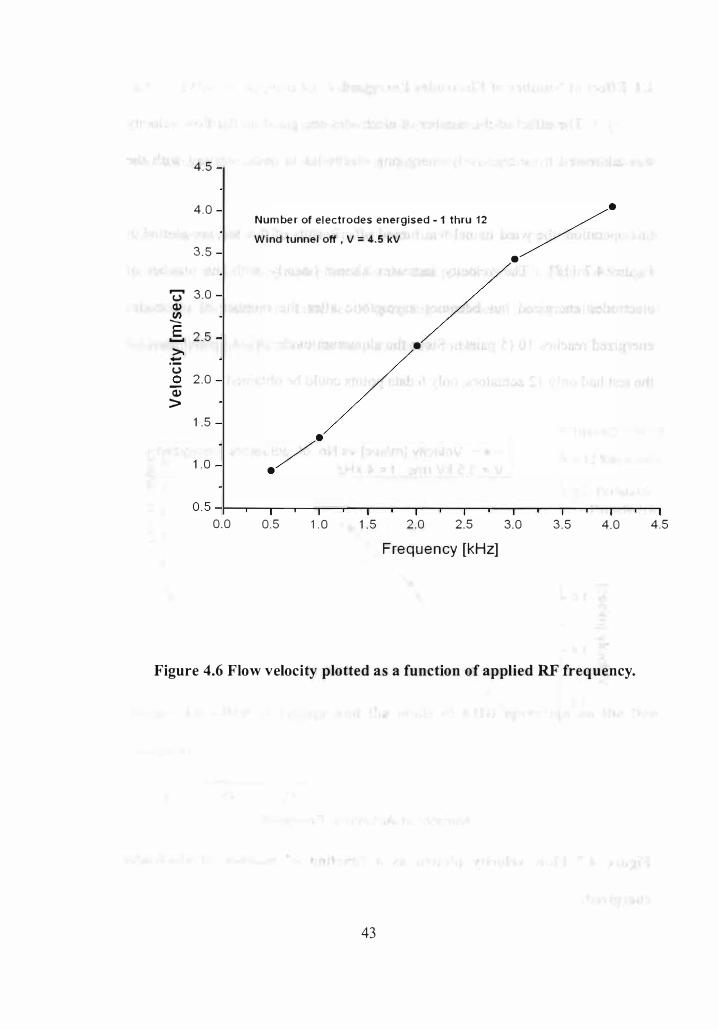
4.3 Effect of Frequency
To detennine the effect of RF frequency on flow velocity, several tests
were run with all 1 2 plasma actuators on the panel energized at a constant voltage
of 4 .5 kY. In these tests, the wind tunnel was tumed off in order to measure the
velocity induced solely by the actuators . As il lustrated in Figure 4 .6, the velocity
increased linearly with the applied RF frequency. A reason that may account for
this phenomenon is that n10re and more ions are trapped with the increasing
applied RF frequency, thus increasing the plasma density.
42
4 . 5
4 . 0
3 . 5
...... 3 .0 (,,) Q) 11'1 -E 2 . 5 -... >.
:t:: (,,) 0 2.0 Q)
> 1 .5
1 . 0
0 .0
Num be r of el ectrodes energised - 1 thru 12 W i nd tunnel off . V = 4.5 kV
•
0.5 1 . 0 1 . 5 2.0 2.5
Frequency [kHz]
3.0 3 . 5 4.0
Figure 4.6 Flow velocity plotted as a function of applied RF frequency.
43
4.5
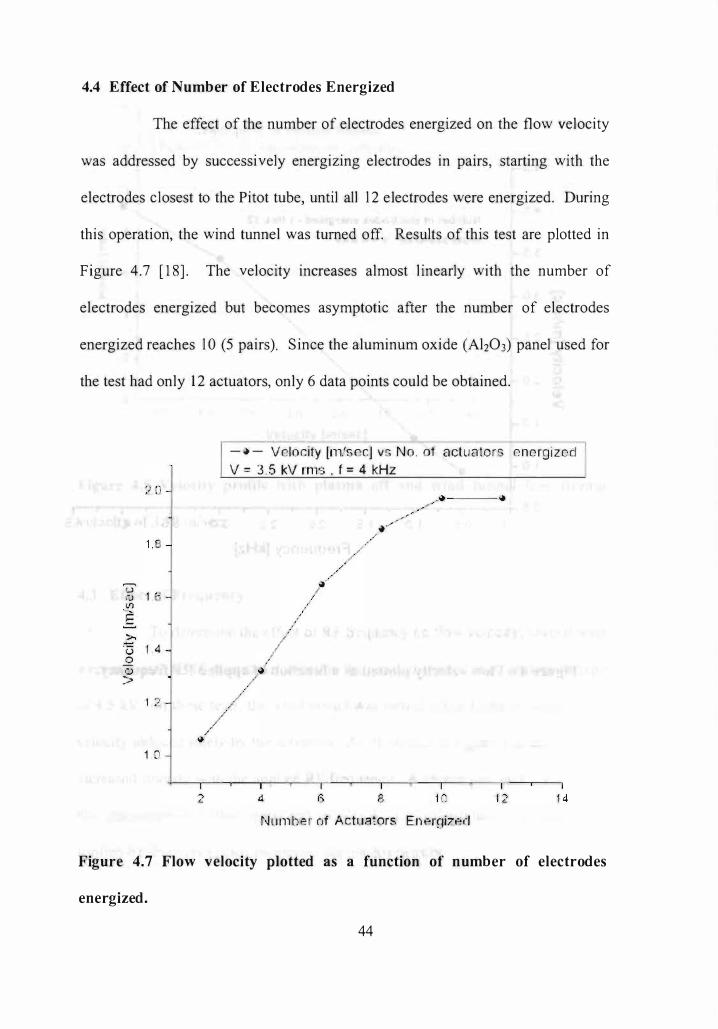
4.4 Effect of Number of Electrodes Energized
The effect of the number of electrodes energized on the flow velocity
was addressed by successively energizing electrodes in pairs, starting with the
electrodes closest to the Pitot tube, until all 1 2 e]ectrodes were energized. During
this operation, the wind tunnel was turned off. Results of this test are plotted in
Figure 4.7 [ 1 8]. The velocity increases almost linearly with the number of
electrodes energized but becomes asymptotic after the number of electrodes
energized reaches 1 0 (5 pairs). Since the aluminum oxide (Ah03) panel used for
the test had only 1 2 actuators, only 6 data points could be obtained.
1 .
U I:J I.f)
E >..
u 1 . 4 .2 0
>
1 2
1 J
- � - Velocity [1l1!5CCJ v " N o , ot act u a t o r s e n e ro i z eri V = 3 , 5 kV rms . f = 4 kHz
/'
/ .I
" ,I
/'
,/ .......
-� ; '
. .. ..
N L J lll be l' nf A ctuators E n f;rni7€�d
Figure 4.7 Flow velocity plotted as a function of number of electrodes
energized.
44
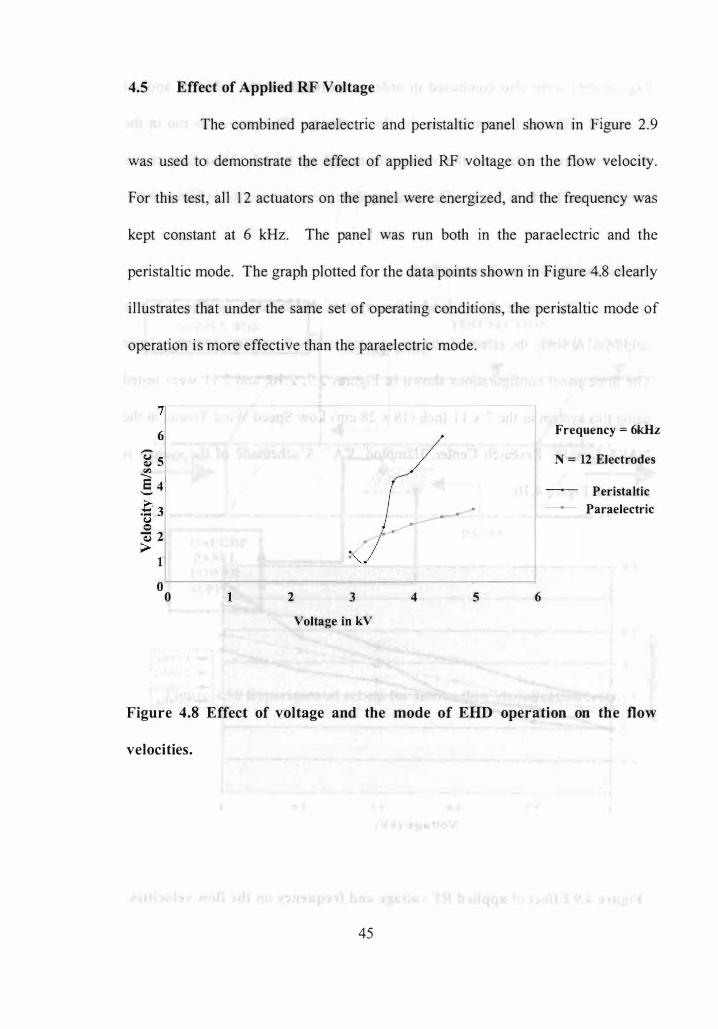
4.5 Effect of Applied RF Voltage
The combined paraelectric and peristaltic panel shown in Figure 2.9
was used to demonstrate the effect of applied RF voltage on the flow velocity.
For this test, all 1 2 actuators on the panel were energized, and the frequency was
kept constant at 6 kHz. The panel was run both in the paraelectric and the
peristaltic mode. The graph plotted for the data points shown in Figure 4.8 clearly
illustrates that under the same set of operating conditions, the peristaltic mode of
operation is more effective than the paraelectric mode.
,-.
� 5 '" --
5 4 '-
o o 1 2
. .
3
Voltage in kV
/
4
. .
5 6
Frequency = 6kHz
N = 12 Electrodes
Peristaltic
Para electric
Figure 4.8 Effect of voltage and the mode of ERD operation on the flow
velocities.
45
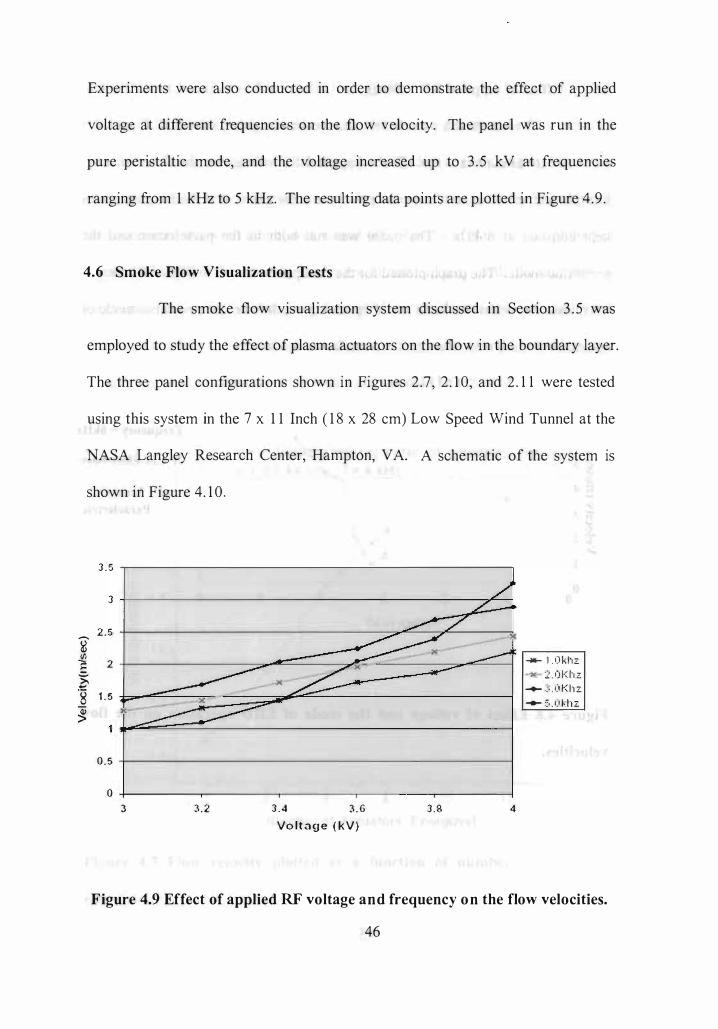
Experiments were also conducted in order to demonstrate the effect of applied
voltage at different frequencies on the flow velocity. The panel was run in the
pure peristaltic mode, and the voltage increased up to 3 . 5 kV at frequencies
ranging from 1 kHz to 5 kHz. The resulting data points are plotted in Figure 4 .9 .
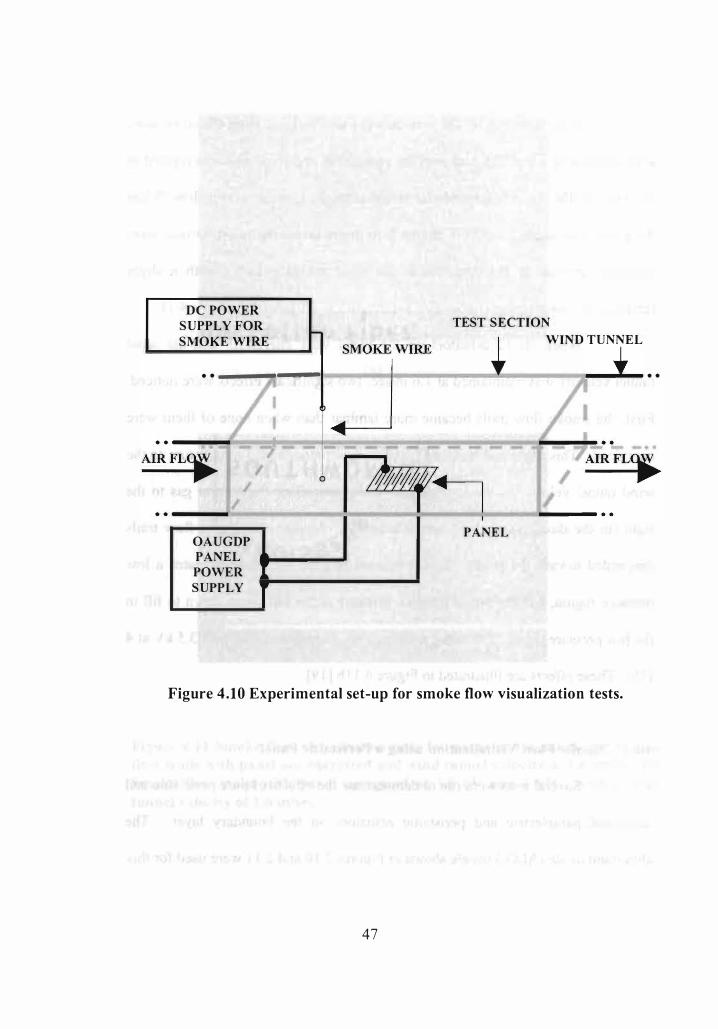
4.6 Smoke Flow Visualization Tests
The smoke flow visualization system discussed in Section 3 . 5 was
employed to study the effect of plasma actuators on the flow in the boundary layer.
The three panel configurations shown in Figures 2 .7 , 2 . 1 0, and 2 . 1 1 were tested
using this system in the 7 x 1 1 Inch ( 1 8 x 28 cm) Low Speed Wind Tunnel at the
NASA Langley Research Center, Hampton, VA. A schematic of the system is
shown in Figure 4. 1 0 .
3 . 5
3
2 . 5 � '"
� =: >; ....
'g �
2
1 . 5 ><
0.5
0 3 3 .2 3 . 4 3 . 6
Vo lt<lge ( k V) 3.8 4
-- '1 . I)"hz ")( ::: . O l< h z
__ ,:; I) �' h z - ::, I) I, h z
Figure 4.9 Effect of applied RF voltage and frequency on the flow velocities.
46
TEST SECTION DC POWER
SUPPLY FOR
SMOKE WIRE
• • ---�==:;:::=
* WIND TUNNEL j=
W
=
IRE===:!==
=,
-L • •
. . ------�������� AIR FL�
I o
. . ------�==�====�
OAUGDP PANEL
POWER
SUPPLY
�� PANEL
AIR FL� I
Figure 4.10 Experimental set-up for smoke flow visualization tests.
47
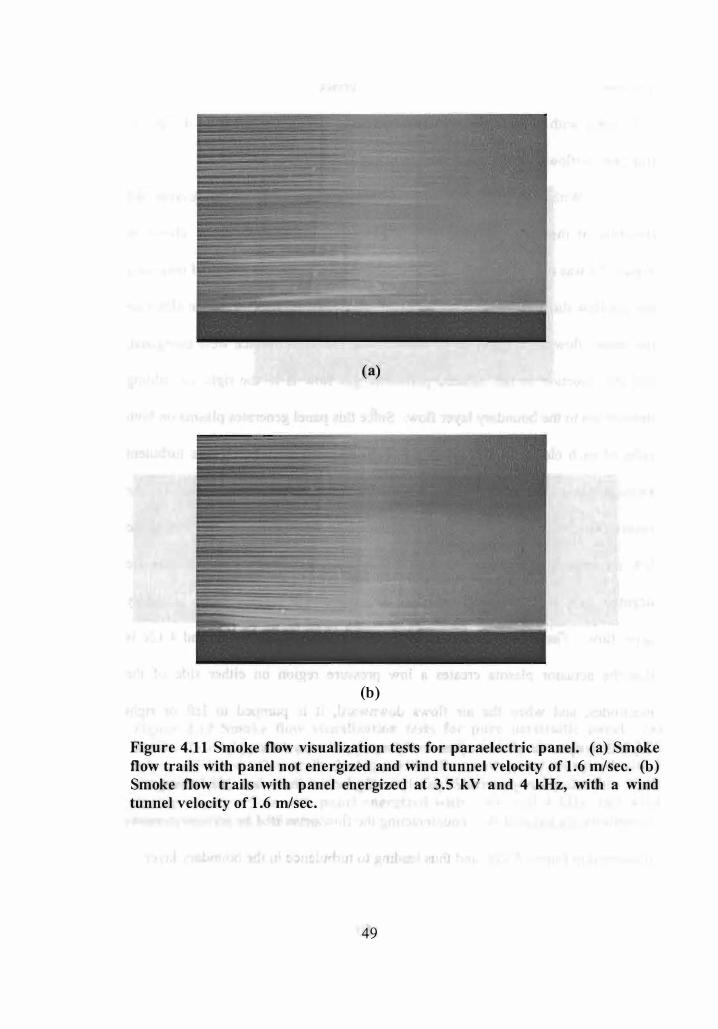
4.6.1 Smoke Flow Visualization using a Paraelectric Panel
Tests were run for the paraelectric panel with the wind tunnel veloc ity
kept constant at 1 . 6 mlsec, and with the panel both energized and unenergized to
demonstrate the effect of paraelectric actuators on the boundary layer flow. When
the panel was unenergized, the smoke flow trails above the panel surface were
general ly laminar in the direction of the wind tunnel velocity, with a sl ight
tendency to flow tripping (turbulence generation) as i l lustrated in Figure 4. 1 1 a .
When all 1 2 actuators on the panel were energized, and the wind
tunnel velocity was maintained at 1 . 6 mlsec, two significant effects were noticed.
First, the smoke flow trails became more laminar than when none of them were
energized. This happened because the plasma actuators added momentum to the
wind tunnel velocity at the boundary layer by propelling the neutral gas to the
right (in the direction of wind tunnel velocity). S econd, the smoke flow trails
descended toward the panel. This happened because the plasma creates a low
pressure region, and the air, at a higher pressure at the top, came down to fill in
the low pressure region. For these runs, actuators were energized with 3 . 5 kV at 4
kHz. These effects are illustrated in Figure 4. 1 1 b [ 1 9] .
4.6.2 Smoke Flow Visualization using a Peristaltic Panel
Several tests were run to demonstrate the effects of pure peristaltic and
combined paraelectric and peristaltic actuators on the boundary layer. The
aluminum oxide (Ah03) panels shown in Figures 2 . 1 0 and 2 . 1 1 were used for this
48
(a)
(b)
Figure 4. 1 1 Smoke flow visualization tests for paraelectric panel. (a) Smoke flow trails with panel not energized and wind tunnel velocity of 1 .6 m/sec. (b) Smoke flow trails with panel energized at 3.5 kV and 4 kHz, with a wind tunnel velocity of 1 .6 m/sec.
49
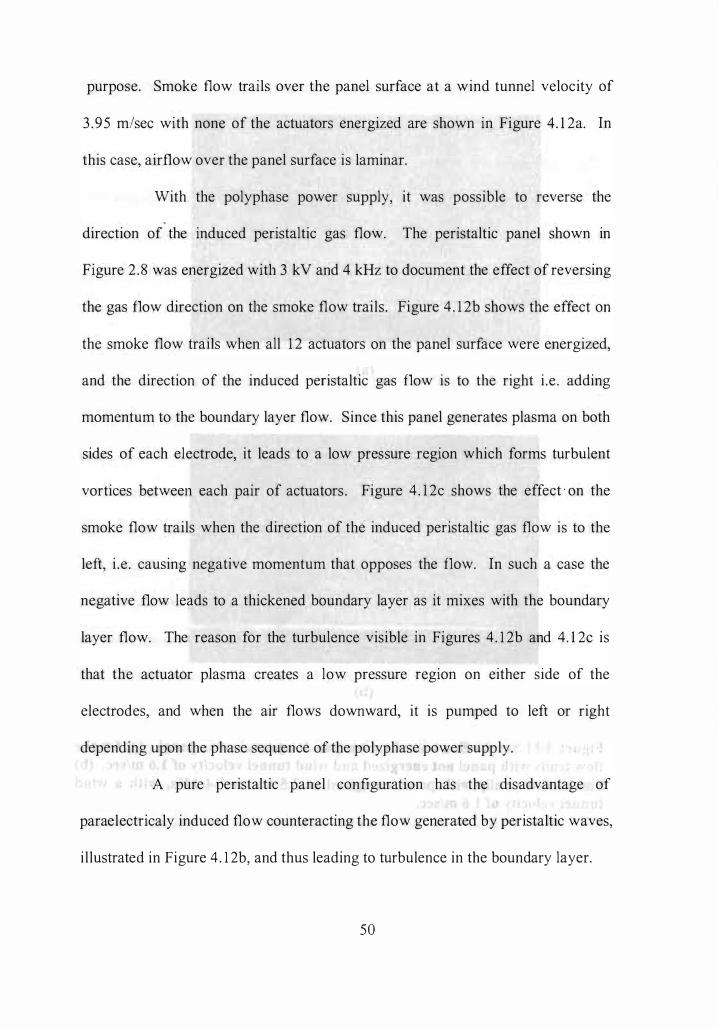
purpose. Smoke flow trails over the panel surface at a wind tunnel velocity of
3 .95 mlsec with none of the actuators energized are shown in Figure 4. 1 2a. In
this case, airflow over the panel surface is laminar.
With the polyphase power supply, it was possible to reverse the
-
direction of the induced peristaltic gas flow. The peristaltic panel shown in
Figure 2 .8 was energized with 3 kV and 4 kHz to document the effect of reversing
the gas flow direction on the smoke flow trails . Figure 4 . 1 2b shows the effect on
the smoke flow trails when all 1 2 actuators on the panel surface were energized,
and the direction of the induced peristaltic gas flow is to the right i .e . adding
momentum to the boundary layer flow. Since this panel generates plasma on both
sides of each electrode, it leads to a low pressure region which forms turbulent
vortices between each pair of actuators . Figure 4 . 1 2c shows the effect · on the
smoke flow trails when the direction of the induced peristaltic gas flow is to the
left, i .e . causing negative momentum that opposes the flow. In such a case the
negative flow leads to a thickened boundary layer as it mixes with the boundary
layer flow. The reason for the turbulence visible in Figures 4 . 1 2b and 4. 1 2c is
that the actuator plasma creates a low pressure region on either side of the
electrodes, and when the air flows downward, it is pumped to left or right
depending upon the phase sequence of the polyphase power supply.
A pure peristaltic panel configuration has the disadvantage of
paraelectricaly induced flow counteracting the flow generated by peristaltic waves,
i l lustrated in Figure 4 . 1 2b, and thus leading to turbulence in the boundary layer.
50
a
b c
Figure 4.12 Smoke flow visualization tests for pure peristaltic panel. (a) Smoke flow trails with panel not energized and wind tunnel velocity of 3.95 m/sec. (b) Smoke flow trails during positive flow with panel energized with 3 kV and 4 kHz, and wind tunnel velocity of 3.95 m/sec. (c) Smoke flow trails during negative flow with panel energized with 3 kV and 4 kHz, and wind tunnel velocity of 3.95 m/sec.
5 1

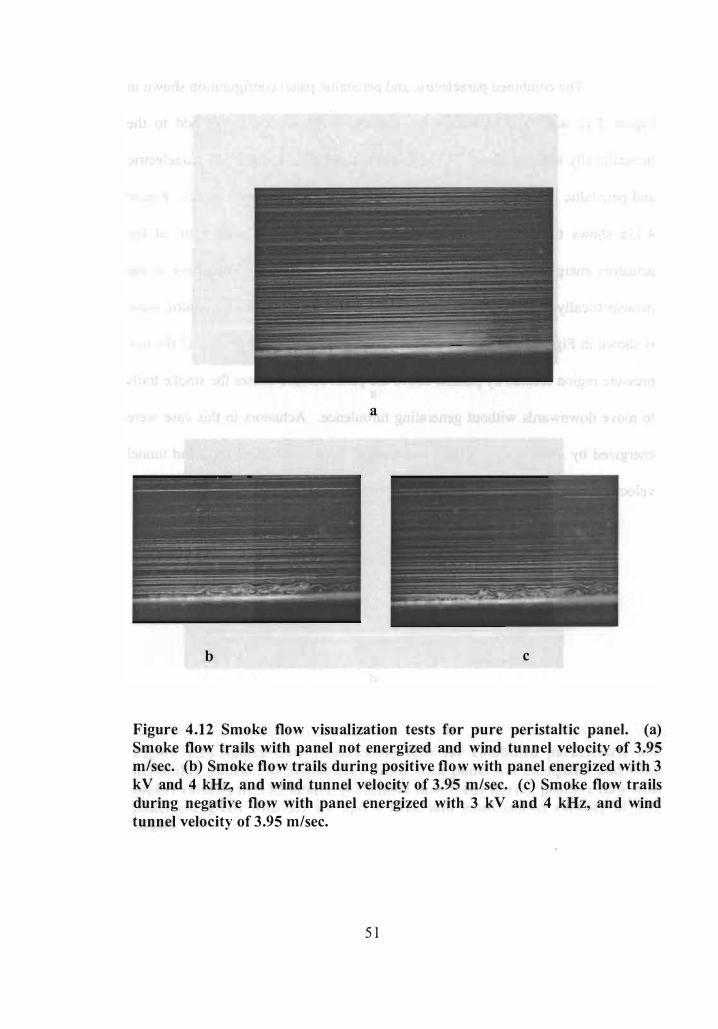
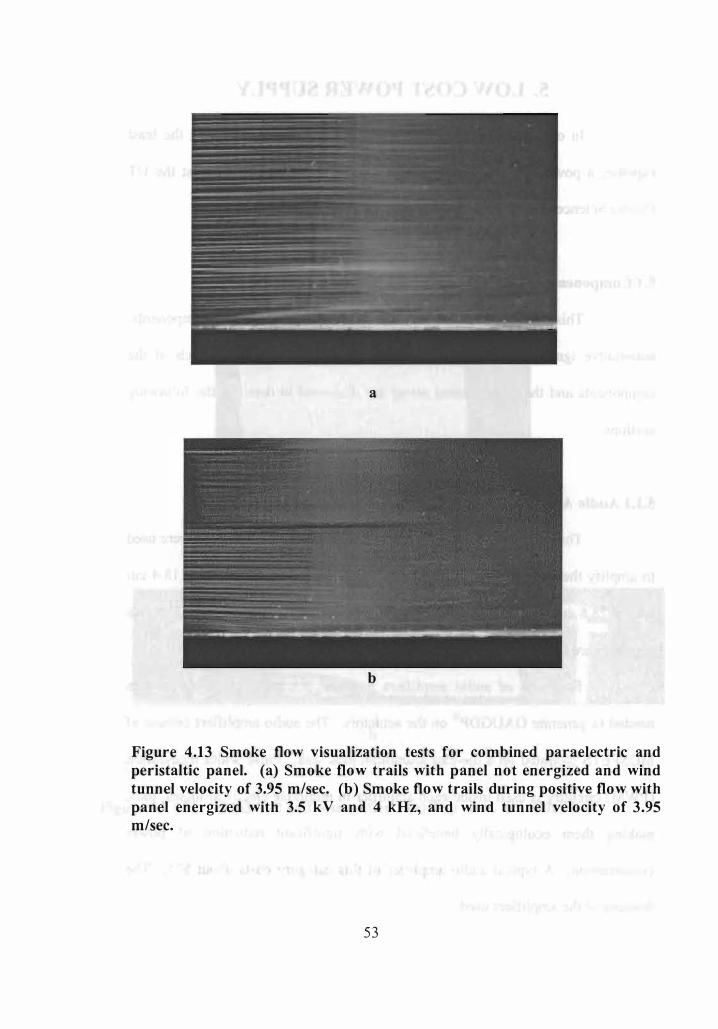
The combined paraelectric and peristaltic panel configuration shown in
Figure 2 . 1 1 was used to induce the paraelectric flow velocity to add to the
peristaltically induced flow. To demonstrate this effect, a combined paraelectric
and peristaltic panel was mounted in the test section of the wind tunnel . Figure
4 . 1 3a shows the smoke flow trails over the panel surface with none of the
actuators energized at a wind tunnel velocity of 3 .95 mlsec. The effect of the
paraelectrically induced flow being added to the flow induced by peristaltic wave
is shown in Figure 4. 1 3b, for which all 1 2 actuators were energized, and the low
pressure region created by plasma above the panel surface causes the smoke trails
to move downwards without generating turbulence. Actuators in this case were
energized by a voltage of 3 .5 kV and frequency of 4 kHz, and the wind tunnel
velocity was 3 .95 m/sec.
52
a
b
Figure 4.13 Smoke flow visualization tests for combined paraelectric and peristaltic panel. (a) Smoke flow trails with panel not energized and wind tunnel velocity of 3.95 m/sec. (b) Smoke flow trails during positive flow with panel energized with 3.5 kV and 4 kHz, and wind tunnel velocity of 3.95 m/sec.
53

5. LOW COST POWER SUPPLY
In order to generate the OAUGDp@ on plasma actuators at the least
expense, a power supply using low cost components was developed at the UT
Plasma Sciences Laboratory, and is discussed in detail in this Section.
5.1 Components of the Low Cost Power Supply
This power supply consists of three major sets of components :
automotive ignition coils, audio amplifiers, and a DC battery. Each of the
components and the experimental set-up are discussed in detail in the following
sections.
5.1 .1 Audio Amplifiers
Three hundred watt audio amplifiers, available off the shelf, were used
to amplify the voltage input from a signal generator. Each amplifier is 1 8 .4 cm
long x 28 .6 cm wide x 5 .73 cm high. Digital images of the top and side of this
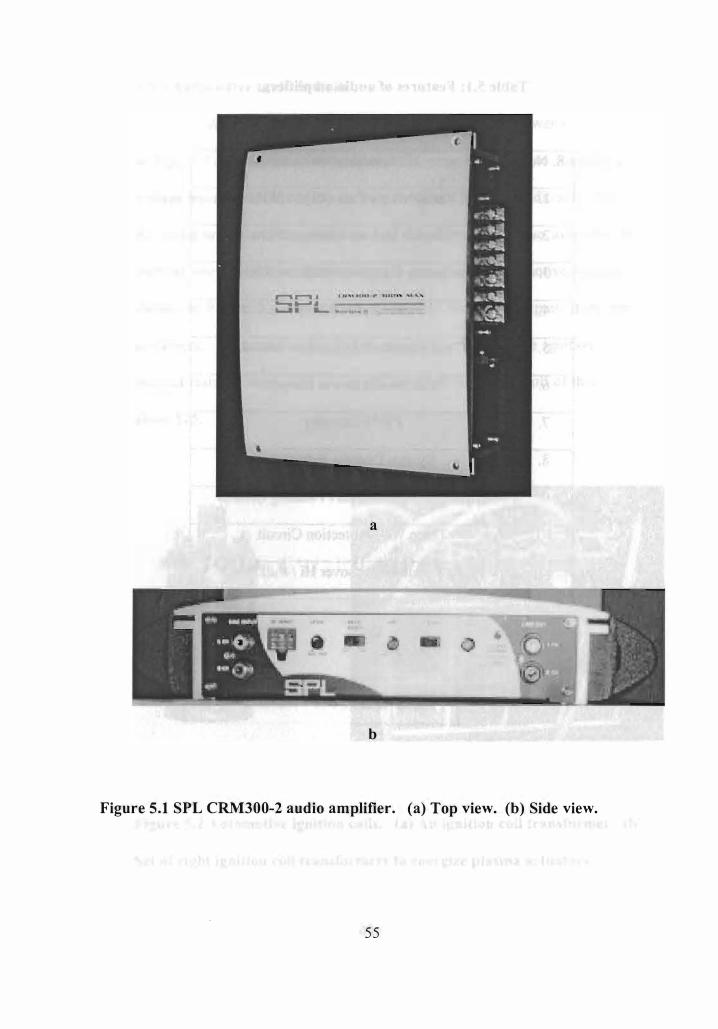
amplifier are shown in Figures 5 . 1 a and 5 . 1b .
Four sets of audio amplifiers provided the eight amplified outputs
needed to generate OAUGDp@ on the actuators . The audio amplifiers consist of
MOSFETS mounted on a die-cast aluminum heat sink. Pulse width modulation
(PWM) circuitry is used inside each amplifier to minimize electrical losses, thus,
making them ecologically beneficial with significant reduction of power
consumption. A typical audio amplifier of this category costs about $75. The
features of the amplifiers used in this research are shown in Table 5 . 1 [20] .
54
,..... � . _ _ A L...II a Ii-.
a
b
Figure 5.1 SPL CRM300-2 audio amplifier. (a) Top view. (b) Side view.
55

Table 5.1: Features of audio amplifiers.
S . No. Specification
l . Variable Low Pass 40Hz- 1 20Hz
2. Variable Hi Pass 1 50Hz- l .5Khz
3 . Frequency Response: 1 0Hz to 30Khz
4. SIN Ratio: 97 dB
5 . Total Harmonic Distortion: 0.02%
I 6. Full Mosfet Power Supply
7 . PWM Circuitry
8 . System Distress Indicator
9 . High/Low Level Inputs / Floating Ground
1 0. Three Way Protection Circuit
1 1 . Full Selectable Crossover Hi I Full / Low
56
5.1 .2 Automotive Ignition Coi'ls
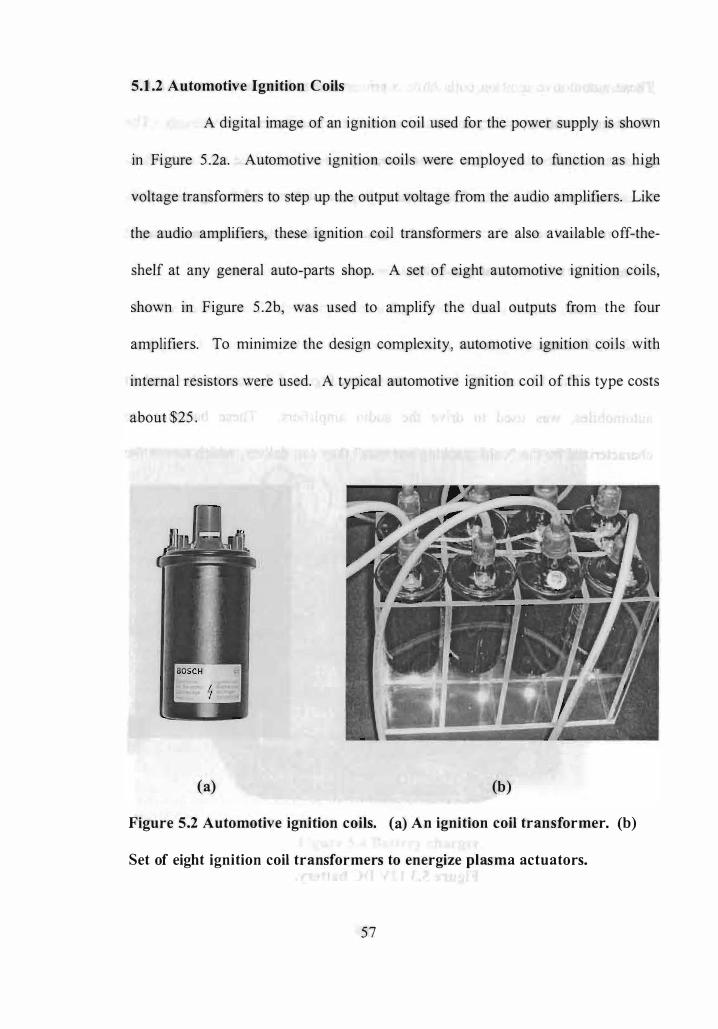
A digital image of an ignition coil used for the power supply is shown
in Figure 5 .2a. Automotive ignition coils were employed to function as high
voltage transformers to step up the output voltage from the audio amplifiers. Like
the audio amplifiers, these ignition coil transformers are also available off-the
shelf at any general auto-parts shop. A set of eight automotive ignition coils,
shown in Figure 5 .2b, was used to amplify the dual outputs from the four
amplifiers. To minimize the design complexity, automotive ignition coi ls with
internal resistors were used. A typical automotive ignition coil of this type costs
about $25 .
(a) (b)
Figure 5.2 Automotive ignition coils. (a) An ignition coil transformer. (b)
Set of eight ignition coil transformers to energize plasma actuators.
57
These automotive ignition coils have a primary/secondary turns ratio of 1 : 1 00.
The primary and secondary resistance is 3 .9 ohms and 7 ohms respectively. The
resistance of the wire used to connect the output terminal of the ignition coils to
the actuators is 6.7 ohms. The output voltage waveforms of the ignition coils
were measured to confirm that all the ignition coils delivered the same output
voltage at the same operating conditions.
5.1 .3 DC Battery
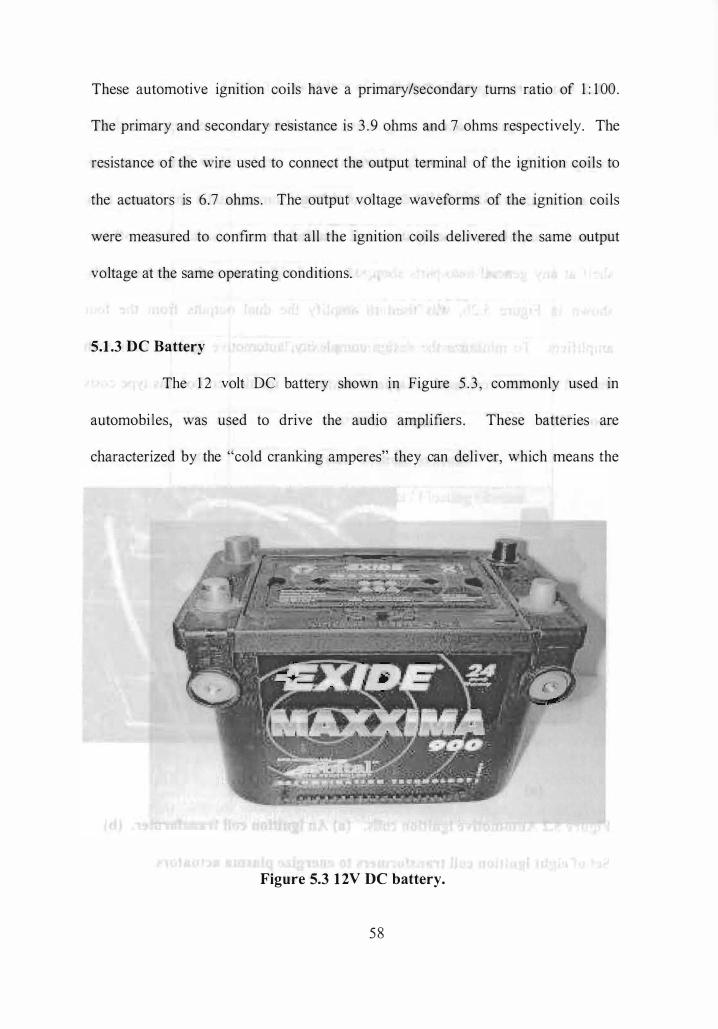
The 1 2 volt DC battery shown in Figure 5 . 3 , commonly used in
automobiles, was used to drive the audio amplifiers . These batteries are
characterized by the "cold cranking amperes" they can deliver, which means the
Figure 5.3 1 2V DC battery.
58
discharge load measured in amperes that a fully charged battery at 0 degrees F (-
1 7 .8 degrees C) can deliver for 30 seconds while maintaining the voltage above
7.2 volts. The cold cranking value for the battery used in these experiments was
650 amperes, while its cold cranking value at 32° F (0° C) was 780 amperes. A
typical battery costs about $90.
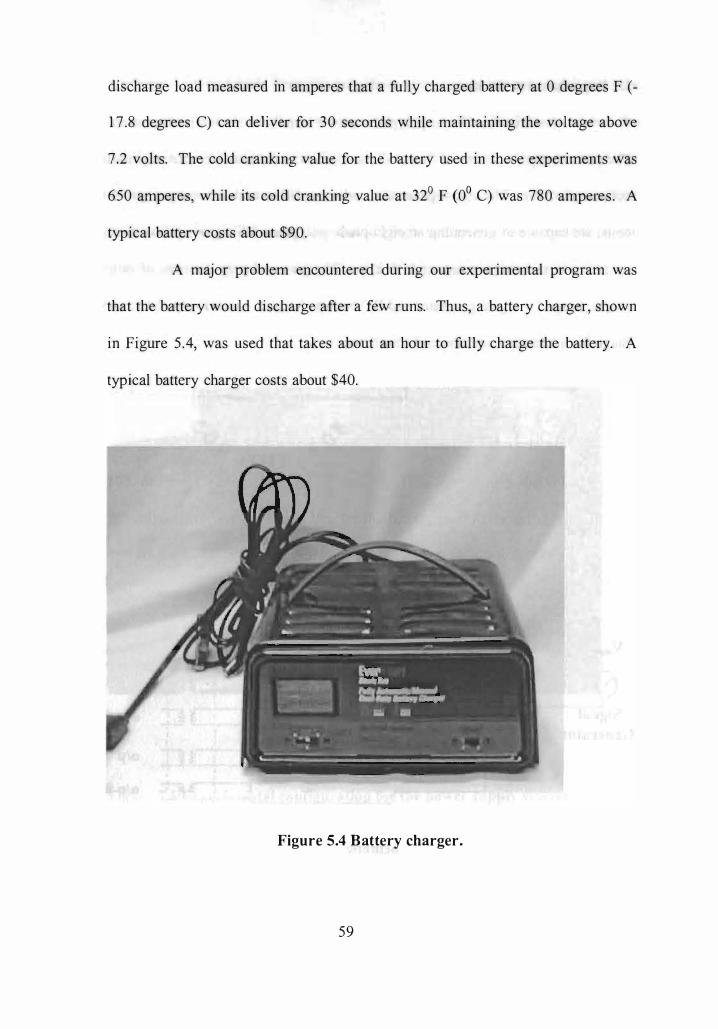
A major problem encountered during our experimental program was
that the battery would discharge after a few runs. Thus, a battery charger, shown
in Figure 5 .4, was used that takes about an hour to fully charge the battery. A
typical battery charger costs about $40.
Figure 5.4 Battery charger.
59
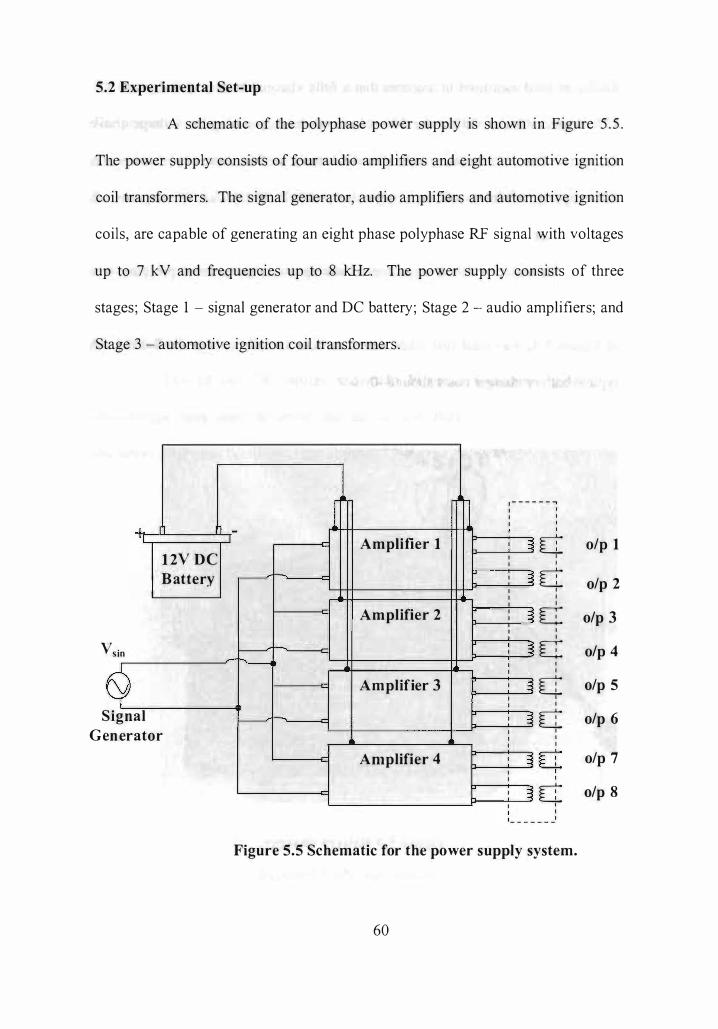
5.2 Experimental Set-up
A schematic of the polyphase power supply is shown in Figure 5 . 5 .
The power supply consists o f four audio amplifiers and eight automotive ignition
coil transformers. The signal generator, audio amplifiers and automotive ignition
coils, are capable of generating an eight phase polyphase RF signal with voltages
up to 7 kV and frequencies up to 8 kHz. The power supply consists of three
stages; Stage 1 - signal generator and DC battery; Stage 2 - audio amplifiers; and
Stage 3 - automotive ignition coil transformers .
+.
II 1 2V DC 'I Battery
v sin
ignal S Ge nerator
'1 - I Amplifier 1
�
Amplifier 2
r-------' --1'-Amplifier 3
'r-------'
Amplifier 4
I
1 - - - - - - , , , , , , , , , , � U , , , , , � U , , , , , , � ,
,
IT , ,
, , � , IT , , , , , � U , ,
, ,
, � U , ,
, , , ,
, � ,
U �, , ,
, � U , ,
, , - - - - - - -
Figure 5.5 Schematic for the power supply system.
60
o/p 1
o/p 2
o/p 3
o/p 4
o/p 5
o/p 6
o/p 7
o/p 8
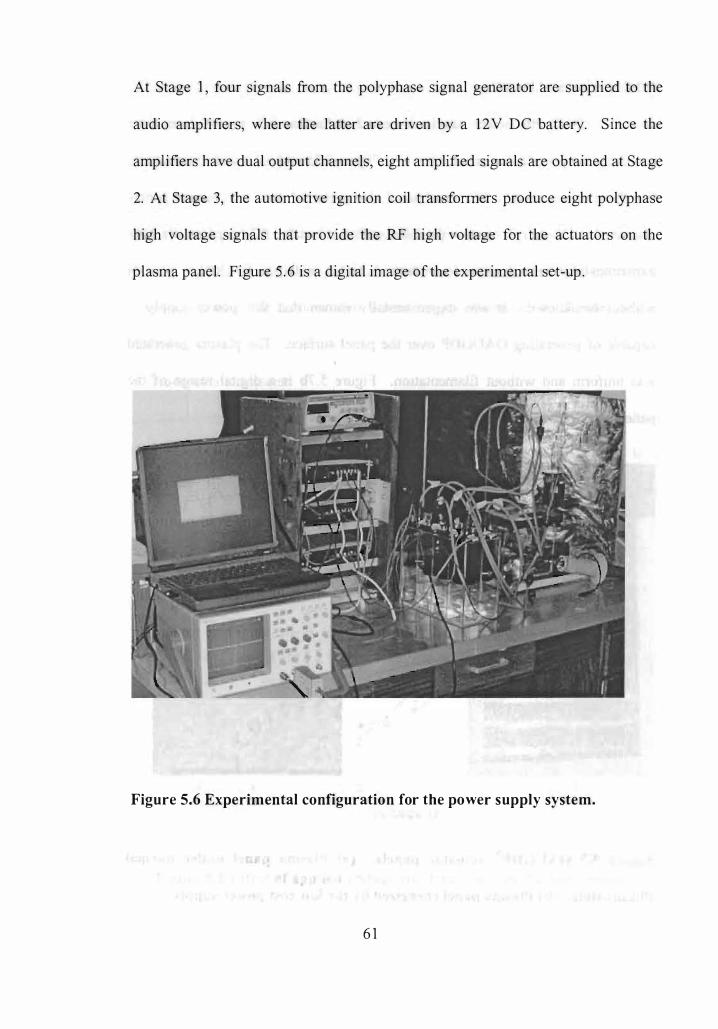
At Stage 1 , four signals from the polyphase signal generator are supplied to the
audio amplifiers, where the latter are driven by a 1 2V DC battery. S ince the
amplifiers have dual output channels, eight amplified signals are obtained at Stage
2. At Stage 3, the automotive ignition coil transfonners produce eight polyphase
high voltage signals that provide the RF high voltage for the actuators on the
plasma panel . Figure 5 . 6 is a digital image of the experimental set-up .
Figure 5.6 Experimental configuration for the power supply system.
6 1
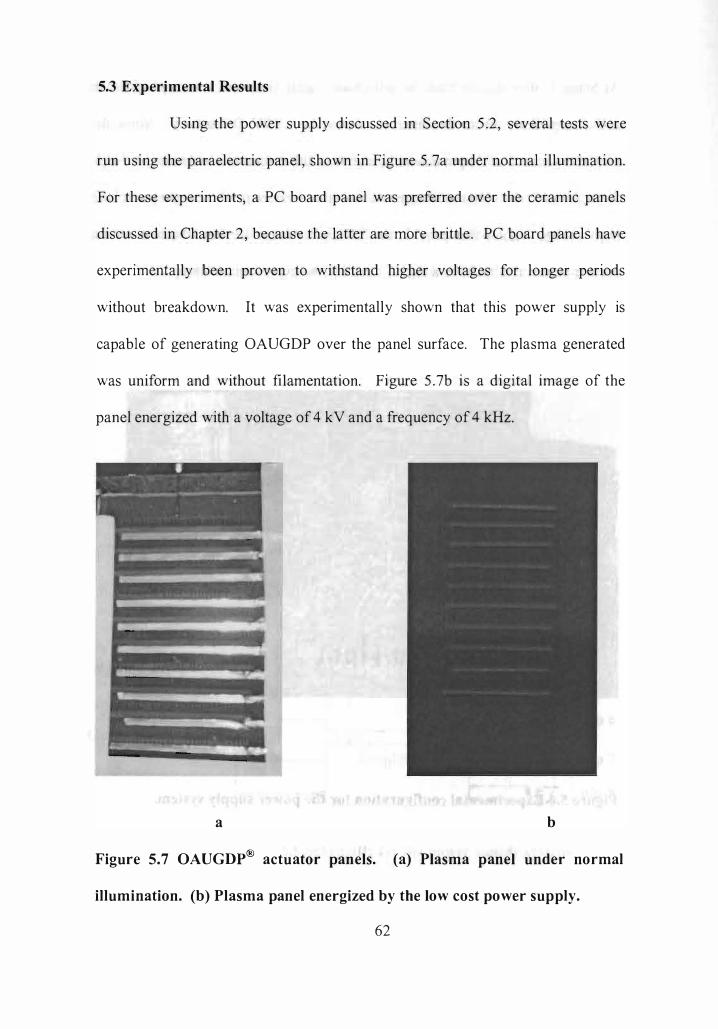
5.3 Experimental Results
Using the power supply discussed in Section 5 .2 , several tests were
run using the paraelectric panel, shown in Figure 5 . 7a under normal i llumination.
For these experiments, a PC board panel was preferred over the ceramic panels
discussed in Chapter 2 , because the latter are more brittle. PC board panels have
experimentally been proven to withstand higher voltages for longer periods
without breakdown. It was experimentally shown that this power supply is
capable of generating OAUGDP over the panel surface. The plasma generated
was uniform and without fi lamentation. Figure 5 .7b is a digital image of the
panel energized with a voltage of 4 kV and a frequency of 4 kHz.
a b
Figure 5.7 OAUGDp® actuator panels. (a) Plasma panel under normal
illumination. (b) Plasma panel energized by the low cost power supply.
62
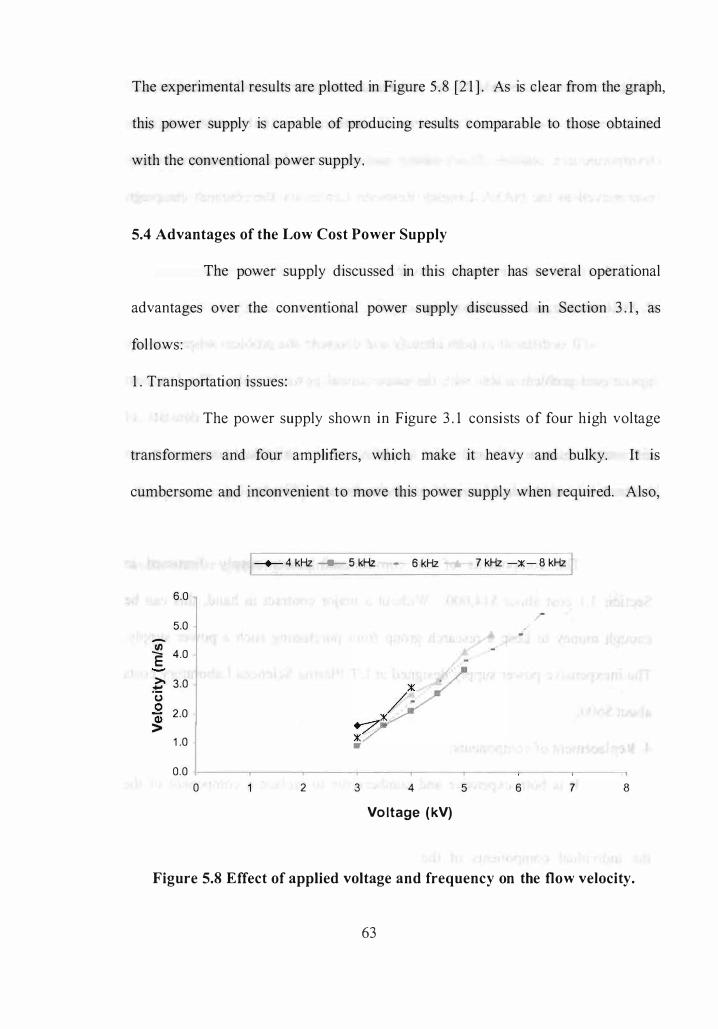
The experimental results are plotted in Figure 5 .8 [2 1 ] . As is clear from the graph,
this power supply is capable of producing results comparable to those obtained
with the conventional power supply.
5.4 Advantages of the Low Cost Power Supply
The power supply discussed in this chapter has several operational
advantages over the conventional power supply discussed in Section 3 . 1 , as
fol lows:
1 . Transportation issues:
The power supply shown in Figure 3 . 1 consi sts of four high voltage
transformers and four amplifiers, which make it heavy and bulky. It is
cumbersome and inconvenient to move this power supply when required. Also,
6.0
5.0 -I/) E 4.0
� 3.0 (J 0 2.0 . Q)
> 1 .0
0.0 0
E 4 kHz --- 5 kHz - 6 kHz
/--:;Y � •
2 3 4 5
Voltage (kV)
7 kHz -x - 8 kHz I
./
:- ----,
6 7 8
Figure 5.8 Effect of applied voltage and frequency on the flow velocity.
63
the transfonner oil needs to be suctioned out and then refilled before and
after a move, since it would otherwise slosh out whenever the power supply is
transported in a vehicle. This problem was encountered when the power supply
was moved to the NASA Langley Research Center for the research campaign
conducted in May 2003 . The low cost power supply solves this problem because
it is lightweight and convenient to move.
2. Maintenance and troubleshooting issues:
It is difficult to both identify and diagnose the problem whenever any
operational problem arises with the conventional power supply. The low cost
power supply designed to replace the conventional technology consists of
automotive ignition coils and audio amplifiers, so the individual components can
be removed and checked for problems without much difficulty.
3 . Cost:
The components of the conventional power supply discussed in
Section 3 . 1 cost about $ 1 4,000. Without a major contract in hand, this can be
enough money to keep a research group from purchasing such a power supply.
The inexpensive power supply designed at UT Plasma Sciences Laboratory costs
about $600.
4. Replacement of components :
It is both expensive and cumbersome to replace a component of the
conventional power supply, be it a transfonner or an amplifier. On the other hand,
the individual components of the low-cost power supply are both easy and
64
economical to replace. A typical automotive ignition coil and an audio amplifier
cost about $20 and $75 respectively. Also, it takes considerably less time to make
such a replacement in the low cost design, since the automotive ignition coils and
the audio amplifiers are easily available off-the-shelf at any automobile service
shop.
5 . Operational Parameters :
Though not as high, the voltage and frequency ratings of the low cost
power supply are close to that of the conventional power supply. The low cost
power supply is capable of producing voltages up to 7 kV and a frequency as high
as 1 0 kHz. It was observed that the audio amplifier + ignition coil system
perfom1s satisfactorily for a wide range of frequency without overheating [ 1 8] .
This power supply was capable o f energizing the plasma actuators and produced
similar results to that produced by the conventional Powertron ™ power supply
under similar operating conditions.
65

6. SUMMARY AND DISCUSSION
The ability of plasma actuators to manipulate the boundary layer velocity profiles
and to produce aerodynamic acceleration was demonstrated. Velocities up to
several meters per second were obtained at one atmosphere using paraelectric and
peristaltic OAUGDP actuators. Though desirable velocities are of the order of
approximately 50 rn/sec, which is the take-off and landing speed of the aircrafts,
this work i l lustrates that with some additional adjustments, velocities of that order
might be possible.
Smoke flow visualization tests were conducted to demonstrate the boundary layer
turbulence for various panel configurations discussed in chapter 2. A pure
peristaltic panel configuration has the disadvantage of paraelectricaly induced
flow counteracting the flow generated by peristaltic waves. It was il lustrated that
combined paraelectric and peristaltic panel can be used to have the
paraelectrically induced flow add to the flow induced by peristaltic wave.
A low cost power supply to energize the paraelectric panel was built in the UT
Plasma Laboratory. This power supply was proved to be cheaper, easier to
troubleshoot and maintain, and easier to transport. The experimental results
obtained using the economical power supply were demonstrated. These results
were comparable to the ones obtained using the conventional power supply.
66

REFERENCES
67
REFERENCES
1 . Roth, 1. R. : "Industrial Plasma Engineering. Volume I - Principles"- Institute
of Physics Publishing, Bristol and Philadelphia, ISBN 0-7503-03 1 8-2, ( 1 995) .
2 . Roth, 1. R. : "Industrial Plasma Engineering. Volume II -- Applications to
Non-Thermal Plasma Processing" - Institute of Physics Publishing, Bristol and
Philadelphia, ISBN 0-7503-0545-2, (200 1 ) . (8)
3. Von Eagle, A. , Seeliger, R, and Steenback, M . : "On the Glow Discharge at
High Pressure" - Zeit. fur Physik Vol . 85 , 1 44 ( 1 933) pp 1 40- 1 60.
4. Roth 1. R., Tsai P. P . , Liu C. , Laroussi M. and Spence P. D . : "One
Atmosphere Uniform Glow Discharge Plasma"- U. S. Patent #5,4 1 4,324,
Issued May 9, 1 995 .
5 . Massines, F . ; Ben Gadri, R. ; Rabehi, A. ; Decomps, Ph. ; Segur, P . ; and
Mayoux, Ch. : "Experimental and Theoretical Study of a Glow Discharge at
Atmospheric Pressure Controlled by Dielectric Barrier"- Journal of Applied
Physics, vol. 83 , No. 6, pp 2950-2957, 1 998.
6 . Ben Gadri R. : "One Atmosphere Glow Discharge Structure Revealed by
Computer Modeling"- IEEE Trans. Plasma Sci. , Vol. 27, No. l , 1 999.
7 . Sherman, D. M. : "Manipulating Aerodynamic Boundary Layers Using an
Electrohydrodynamic Effect Generated by a One Atmosphere Uniform Glow
Discharge Plasma" - M. S. in Physics Thesis, Department of Physics,
University of Tennessee, Knoxville, August 1 998.
68
8 . Shennan D . M. , Wilkinson S . P . , and Roth 1. R. : "Paraelectric Gas Flow
Accelerator"- U. S . Patent # 6,200,53 9 B I , Issued March 1 3 , 200 ! .
9. Roth J. R. : "Method and Apparatus for Covering B odies with a Uniform
Glow Discharge Plasma and Applications Thereof'- U. S. Patent #5,669,5 83,
Issued Sept 23 , 1 997.
1 0 . Sin H., Madban R. , Roth 1. R. and Wilkinson S.: " Subsonic Plasma
Aerodynamics using Lorentzian Momentum Transfer in Atmospheric Nonnal
Glow Discharge Plasmas"- Paper YF2- 004, Presented at the 55th APS
Gaseous Electronics Conference, Minneapolis, Minnesota, October 1 5 - 1 8 ,
2002, APS Bulletin, Volume 47, No.- 07 (2002), Page -78.
1 1 . Roth 1 . R., Sherman D. M. and Wilkinson S . P. : "Boundary Layer Flow
Control with a One Atmosphere Unifonn Glow Discharge Surface Plasma"
AIAA Paper 98-0328, Proc. of the 36th AIAA Aerospace Sc iences Meeting &
Exhibit Reno, NV, January 1 2- 1 5 , 1 998.
1 2 . W. Shyy, BJayaraman and A. Anderson : "Modeling of Glow Discharge
induced Fluid Dynamics" - Journal of Applied Phys ics, Vol . 92, No. I I (2002)
pp 6434- 6443.
1 3 . Roth 1. R. : "Aerodynamic Flow Acceleration using Paraelectric and Peristaltic
Electrohydrodynamic (EHD) Effects of a One Atmosphere Unifonn Glow
Discharge Plasma (OAUGDP )"- Physics of Plasmas, Vol . 1 0 , No.5 (2003).
1 4. PCIIPXI-67 1 1 167 1 3 User Manual, National Instruments, October 1 998
Edition Part Number 322080A-O l .
69
1 5 . Madhan R.C.M. "Boundary Layer Flow Acceleration by Paraelectric and
Peristaltic EHD Effects of Aerodynamic Plasma Actuators"- M.S . in
Electrical Engineering Thesis, Department of Electrical and Computer
Engineering, University of Tennessee, Knoxville, May 2004.
1 6. Roth 1. R., Sherman D. M. and Wilkinson S. P.: "Electrohydrodynamic Flow
Control with a Glow Discharge Surface Plasma"- AIAA Journal, Vol. 38 , No.
7, July 2000, pp 1 1 66- 1 1 72 .
1 7 . Roth 1. R. , Madhan R. , Rahel 1. and Yadav M. "Aerodynamic Boundary Layer
Control Using EHD Effects of a One Atmosphere Uniform Glow Discharge
Plasma (OAUGDP@)"- Paper GTP 024, Proceedings of the 2003 APS
Gaseous Electronics Conference, October 2 1 -24, 2003, San Francisco,
California.
1 8 . Roth 1. R. , Madhan, R. C. M., Manish Yadav, Jozef Rahel and Wilkinson S .
P . : "Flow Field Measurement of Paraelectric, Peristaltic and Combined
Plasma Actuators based on the One Atmosphere Uniform Glow Discharge
Plasma (OAUGDp™),,- AIAA Paper 2003-0845, Presented at the 42nd AIAA
Aerospace Sciences Meeting & Exhibit Reno, NV, January 5-8, 2004.
1 9 . Roth J.R., Yadav M., Madhan R. and Wilkinson S . : "Aerodynamic Flow
Control by Peristaltic Acceleration of a One Atmosphere Uniform Glow
Discharge Plasma" - Paper 5A07, Proceedings of the 30th IEEE International
Conference on Plasma Science, Jeju, Korea, June 2-5, 2003, Page 320, IEEE
Catalog Number 03CH37470, ISBN 0-7803-79 1 1 -X.
70

20. User Manual - 2004 Edition, Brill iant Electronics (http://www.briUiant
electronics . com/car _ amplifiers_ spl_ crm300 _ 2.htm).
2 1 . Manish Yadav, Xin Dai and Roth J. R. : "Measurement of the Boundary Layer
Velocity Induced by Paraelectric Plasma Actuators using an Inexpensive High
Voltage Power Supply"- Paper 3P-38, Proceedings of the 3 1 st IEEE
International Conference on Plasma Science, Baltimore, Maryland, June 28-
July 1 , 2004, Page 244, IEEE Catalog No. 04CH37537, ISBN 0-7803-8334-6.
7 1
VITA
Manish Yadav received his Bachelor of Engineering degree (with distinction)
from Jawaharlal Institute of Technology, Khargone, India in June, 200 1 . There,
he was the first rank holder in the department for eight consecutive semesters. He
began his graduate studies in Electrical Engineering at the University of
Tennessee, Knoxville as a graduate research assistant in the UT Plasma Sciences
Laboratory. He has worked in the field of subsonic plasma aerodynamics, using
the One Atmosphere Uniform Glow Discharge Plasma (OAUGDp®) to cause
aerodynamic flow acceleration and manipulation of the boundary layer. In
addition to industrial applications of plasma science, his research interests include
VLSI design and computer networking. He is a student member of the IEEE
Nuclear and Plasma Sciences Society. He plans to join the MBA program after
graduating from the Department of Electrical and Computer Engineering in
Summer - 2005 .
�� 11543 om 91 72
Top Related
Copyright © 2022 FDOKUMEN

