A wind tunnel study of the mean pressure forces acting on large groups of low-rise buildings
19
Journal of Wind Engineering and Industrial Aerodynamics, 6 (1980) 207--225 207 © Elsevier Scientific Publishing Company, Amsterdam -- Printed in The Netherlands A WIND TUNNEL STUDY OF THE MEAN PRESSURE FORCES ACTING ON LARGE GROUPS OF LOW-RISE BUILDINGS M. HUSSAIN University of Engineering and Technology, Lahore (Pakistan) B.E. LEE Department of Building Science, University of Sheffield, Sheffield $10 2TN (Gt. Britain) (Received June 8, 1979; accepted in revised form December 18, 1979) Summary The assessment of the wind pressure forces acting on low-rise buildings in urban and suburban areas is dependent on an understanding of the complex flow phenomena in an inner region of the atmospheric boundary layer close to the surface of the earth. As a re- sult of these complexities the current design methods which attempt to predict such for- ces, for either wind loading or natural ventilation purposes, tend to over-simplify the assess ment problem and can lead to inaccurate estimates. Whilst the few studies reported previously in the literature demonstrate that the proxi- mity effects of buildings grouped together can affect the values of their surface pressure coefficients, too often simplified design procedures take the form of a correction factor applied only to a design wind speed whilst the pressure coefficients to which this speed is applied remain based on the results of tests on isolated bodies. The purpose of this paper is to present the results of a series of wind tunnel tests in which the surface pressure fields of low-rise buildings have been studied. These tests start with an examination of how the body shape influences the surface pressures for a range of isolated bodies. The test results then go on to describe how the parameters which describe an array of such model buildings influence the surface pressures. Both the body form and the array form have been widely varied in order to formulate design information which covers a practical range of built form planning requirements. The results presented here demonstrate that it is possible to describe the surface pres- sures on groups of low-rise buildings in terms of three types of flow regime known to exist for the flow over general arrays of roughness elements on a surface. 1. Introduction The state of our knowledge of the structure of the wind and its effects on buildings can sometimes have limiting effects on the design of tall structures, particularly where human susceptibility to vibration is concerned. This situa- tion is rarely applicable to low-rise buildings, often housing units, where the limiting factors are more likely to be those associated with economic cons- truction processes. With less incentive to investigate, the result is that our knowledge of the way pressure forces occur on low-rise buildings is relatively
-
Upload
sinhvienit -
Category
Documents
-
view
3 -
download
0
Transcript of A wind tunnel study of the mean pressure forces acting on large groups of low-rise buildings
Journal of Wind Engineering and Industrial Aerodynamics, 6 (1980) 207--225 207 © Elsevier Scientific Publishing Company, Amsterdam -- Printed in The Netherlands
A W I N D T U N N E L S T U D Y O F T H E M E A N P R E S S U R E F O R C E S A C T I N G
O N L A R G E G R O U P S O F L O W - R I S E B U I L D I N G S
M. HUSSAIN
University of Engineering and Technology, Lahore (Pakistan)
B.E. LEE
Department of Building Science, University of Sheffield, Sheffield $10 2TN (Gt. Britain)
(Received June 8, 1979; accepted in revised form December 18, 1979)
S u m m a r y
The assessment of the wind pressure forces acting on low-rise buildings in urban and suburban areas is dependent on an understanding of the complex flow phenomena in an inner region of the atmospheric boundary layer close to the surface of the earth. As a re- sult of these complexities the current design methods which at tempt to predict such for- ces, for either wind loading or natural ventilation purposes, tend to over-simplify the assess ment problem and can lead to inaccurate estimates.
Whilst the few studies reported previously in the literature demonstrate that the proxi- mity effects of buildings grouped together can affect the values of their surface pressure coefficients, too often simplified design procedures take the form of a correction factor applied only to a design wind speed whilst the pressure coefficients to which this speed is applied remain based on the results of tests on isolated bodies.
The purpose of this paper is to present the results of a series of wind tunnel tests in which the surface pressure fields of low-rise buildings have been studied. These tests start with an examination of how the body shape influences the surface pressures for a range of isolated bodies. The test results then go on to describe how the parameters which describe an array of such model buildings influence the surface pressures. Both the body form and the array form have been widely varied in order to formulate design information which covers a practical range of built form planning requirements.
The results presented here demonstrate that it is possible to describe the surface pres- sures on groups of low-rise buildings in terms of three types of flow regime known to exist for the flow over general arrays of roughness elements on a surface.
1. I n t r o d u c t i o n
T h e s t a t e o f o u r k n o w l e d g e o f t h e s t r u c t u r e o f t h e w i n d a n d its e f f e c t s on
bu i ld ings can s o m e t i m e s h a v e l i m i t i n g e f f e c t s o n t h e des ign o f ta l l s t r u c t u r e s ,
p a r t i c u l a r l y w h e r e h u m a n s u s c e p t i b i l i t y t o v i b r a t i o n is c o n c e r n e d . Th i s s i tua-
t i o n is r a r e l y a p p l i c a b l e t o low- r i se bu i ld ings , o f t e n h o u s i n g un i t s , w h e r e t h e
l i m i t i n g f a c t o r s are m o r e l i k e l y t o be t h o s e a s s o c i a t e d w i t h e c o n o m i c cons-
t r u c t i o n p rocesses . W i t h less i n c e n t i v e t o i nves t iga t e , t h e r e s u l t is t h a t o u r
k n o w l e d g e o f t h e w a y p r e s s u r e fo rce s o c c u r o n low- r i se b u i l d i n g s is r e l a t i v e l y
208
poor, particularly where the effects of the proximity of one such building to another are concerned. Indeed, during the final discussion session at the Fourth International Conference on Wind Effects on Buildings and Structures, Har- ding [ 1 ] made a plea that a wind loading code should be produced principal- ly for the benefi t of low-rise structures, since these involve the majori ty of the building construction budget, and to which the majori ty of all wind dam- age occurs.
The purpose of this paper is to report the results of a wind tunnel s tudy of the pressure forces on low-rise buildings and the way in which they are in- fluenced by the shape of the building itself and the form of the pattern, or array, in which large groups of such buildings may be arranged. This s tudy has a t tempted to cover the ranges of both building form and group array form which apply to typical fuli~cale situations; a detailed s tudy of the factors which describe these form parameters is given by Soliman and Lee [2] .
In a previous paper, Lee and Soliman [3] reported a s tudy of the mean, wind-induced, pressure forces on arrays of cube-type roughness elements im- mersed in a turbulent boundary layer. This initial s tudy was successful in that it appeared to confirm that the existence o f three types of f low regime, associated with different element layout patterns, was applicable to three-di- mensional bodies. This regime classification, first suggested by Morris [4 ] , of isolated roughness flow, wake interference flow and skimming flow, had pre- viously only been identified in connect ion with two-dimensional roughness elements. However there were a number of criticisms of this work and its po- tential application to the problems of wind effects on arrays of low-rise build- ings. These criticisms, which concerned both the range of building forms test- ed and the characteristics o f the incident flow, have been accepted as having some validity, and as a result, the more detailed investigation to be presented here has been undertaken. The authors now consider that the critical issues have been resolved and that the data contained in this paper have an applica- tion to building aerodynamics.
The importance of understanding how the flow effects which influence a low-rise building are modified by its presence in a large group of similar build- ings is not restricted to loading code considerations. The distribution of ex- ternal pressure forces will also govern the wind-induced natural ventilation characteristics of buildings. Such natural ventilation rates play an important role in determining bo th the internal comfor t condit ions of a building as well as its space heating energy demands. This latter consideration is becoming of increasing significance; as bttildings become bet ter thermally insulated a great- er proport ion of the heating demand is required to satisfy heat losses associat- ed with air infiltration. Within the regime of ventilation design, perhaps more so than that of loading codification, the information available to the designer is not adequate for the proper execut ion of his task and the need for a clearer understanding of the wind forces on buildings in urban and sub-urban areas is paramount.

209
2. The experimental procedure
Full details of the experimental procedure and of its results can be found in Hussain [5].
2.1 The wind tunnel and incident flow The series of experimental tests, to be described here, were conducted in
the Sheffield University 1.2 X 1.2 m Boundary Layer Wind Tunnel. Details of the design, construction and operation of this wind tunnel in the format in which it existed over the test period are given in Lee [6]. The tunnel has since been rebuilt and now has a larger speed range. The working section, whose cross-section now measures 1.2 X 1.2 m, has a length of 7.2 m incorpo- rating a 1.1-m diameter turntable whose center lies 5.4 m downstream of the entry position.
For the measurements to be reported here the incident flow consisted of a simulated atmospheric boundary layer wind appropriate to flow over urban terrain conditions. This incident flow was subsequently modified by the flow characteristics produced by a particular model array layout pattern in the im- mediate vicinity of an instrumented central model. The compromise between the size of the model array and the use of the simulated atmospheric flow apparatus is discussed later. The characteristics of the simulated urban atmos- pheric boundary layer are given in detail by Lee [6] and are summarised here: Depth of boundary layer = 800 m. Power law exponent = 0.28. Scale ratio {spectral method) 1: 350. The method used for the production of the simulated boundary layer utilises the fence, spires and floor roughness element approach suggested by Couni- hart [7]. This use of Counihan's method has been shown by Lee [6] to give an adequate representation of both the mean velocity and turbulence charac- teristics of the urban atmospheric boundary layer.
2.2 The models The roughness element array layouts utilised building models made of hard-
wood which surrounded a central instrumented model, machined from alumi- nium alloy. The central model was fitted with pressure tappings on one vertic- al face only such that it was necessary to rotate the model to obtain both windward and leeward pressure distributions and hence to evaluate the drag force from an integration of the pressure distribution measurements. Full de- tails of the exact location of each of the pressure tappings on all of the 20 different models used in this investigation are given in Hussain [5]. Twenty- six tappings were located on each vertical face with eight along the vertical centreline. The central models were also fitted with seven tappings on the roof centreline. The model surface pressures themselves were measured using a Scanivalve pressure scanning switch fitted with a Setra Type 237 differential pressure transducer and also using a TEM multiple-tube tilting manometer.
210
The pressure datum was taken from the static pressure tube of a standard NPL-type pitot~static tube situated in the free Stream vertically above the central model. This pitot~static tube also provided a measurement of the dy- namic head used to non~limensionalise the surface pressures and was coupled to a Betz manometer in addition to the TEM instrument. The measurements of flow velocity used in the velocity profile analysis, referred to later, were made with a DISA Series M Hot Wire Anemometer System using straight. slant and X-array probes. All the measurements reported here are for the wind direction normal to the windward face.
The test programme was divided into a number of parts which utilised different model forms. The initial tests were performed with a cube-type building shape in order to check the earlier findings of Lee and Soliman [ 3] under the improved incident flow conditions which more adequately simu- late the atmospheric boundary layer. The cube had a side length measure- ment o f 36 mm, denoted by H, and contained 33 pressure tappings on one face and the roof. Mean pressure measurements were made on the windward and leeward faces and on the roof for 13 cases of element plan area density from 3.1% to 50%, with the elements arranged in both normal, grid iron, and staggered, checkerboard, patterns, where the remaining elements of the array were also 36 mm side length cubes. Mean velocity profile measurements were made for 8 values of the plan area density in the range 5--30% for the normal layout pattern only.
In the second and third phases of the investigation central models of var- ious different plan forms were used, where in every case the model shape used for the array was the same as that of the instrumented model. The sec- ond series of tests used models having frontal aspect ratios of 0.5, 1.0, 1.5, 2.0 and 4.0 where in each case the side aspect ratio of these models remain- ed square with a side length of 36 mm. Tests were carried out for the normal array pattern only over a range of 15 plan area densities from 2.5% to 60% for the mean pressure measurements and 7 plan area densities from 5% to 40% for the mean velocity profiles. The third series of tests covered the same range of layout pattern densities but were for models having side aspect ratios of 0.5, 1.0, 1.5 and 2.0 where again the front aspect ratio remained square with a 36 mm side length.
The fourth phase of the investigation was concerned with the effect of varying the height of the central model relative to that of the surrounding roughness element layout. The models used were square in horizontal cross- section with a side length of 36 mm and the surrounding elements of the array were 36 mm cubes. The relative heights of the different central models used were 0.5, 0.8, 0.9, 1.0, 1.1, 1.2, 1.3, 1.5, 1.7, 2.0, 3.0 and 4.0 times the cube height. Mean pressure measurements were made for array plan area densities of 5.0%, 6.25%, 12.5% and 25% in the normal layout pattern and 10%, 12.5%, 25% and 40% in the staggered layout pattern.
211
2.3 Isolated models In addition to the phases of the investigation described in the preceding
section a series of mean surface pressure measurements were carried out on each of the model shapes set in isolation in the centre of the turntable. In this series of tests the atmospheric boundary layer simulation apparatus re- mained in the forward part of the working section, with the exception of tests on the cube model in isolation, which was also tested in the empty tun- nel subject only to the smooth wall boundary layer growth on the tunnel floor.
2. 4 The effects of upstream fetch Following the isolated model tests but prior to the tests on model arrays,
a further phase of the investigation was conducted, in order to determine the influence of upstream fetch geometry on the model surface pressure distribu- tions. The extremes of upstream fetch conditions were either that the parti- cular model layout under test could be arranged to fill the entire length of the working section, 5.4 m upstream from the turntable centre, or that the general roughness array of the atmospheric boundary layer simulation appa- ratus could extend down to the immediate proximity of a very small particul- ar array size. However it was felt that some compromise would exist where- by it was possible to have a sufficiently large array size to yield representa- tive results and at the same time to have the correct general background to the flow field conditions that would be produced by the simulation appara- tus. This part of the investigation, which utilised only the cube form of mod- el, was conducted for plan area densities of 5%, 10%, and 20% in the normal layout pattern and 10%, 20% and 25% in the staggered layout pattern.
3. Results and discussion
3.1 Isolated models Measurements of the mean surface pressure on the cube model in isolation
were made both with the simulated atmospheric flow upstream as well as in the empty tunnel smooth wall boundary layer. A reduction in the mean pres- sures on both the side walls and the roof was apparent when the flow simula- tion was introduced, leaving a clear space of 25 H around the model. This re- sulted in a decrease in CD1, the drag coefficient based on the free stream velo- city, from 0.65 to 0.28. This reduction is thought to be principally caused by the corresponding increase of the ratio of building height to boundary layer thickness from 4 to 22. When the mean drag coefficient, based on the velocity at the model roof height, CDH, was evaluated, values of 0.87 and 1.57 were obtained for the empty tunnel condition and the simulated bound- ary layer flow respectively. This latter value compares poorly with the value of 1.20 given by both the British Standard Code of Practice for Wind Loads, CP3 [8] , and ESDU [9] .
Using the range of models of various height ratios, isolated and with the
212
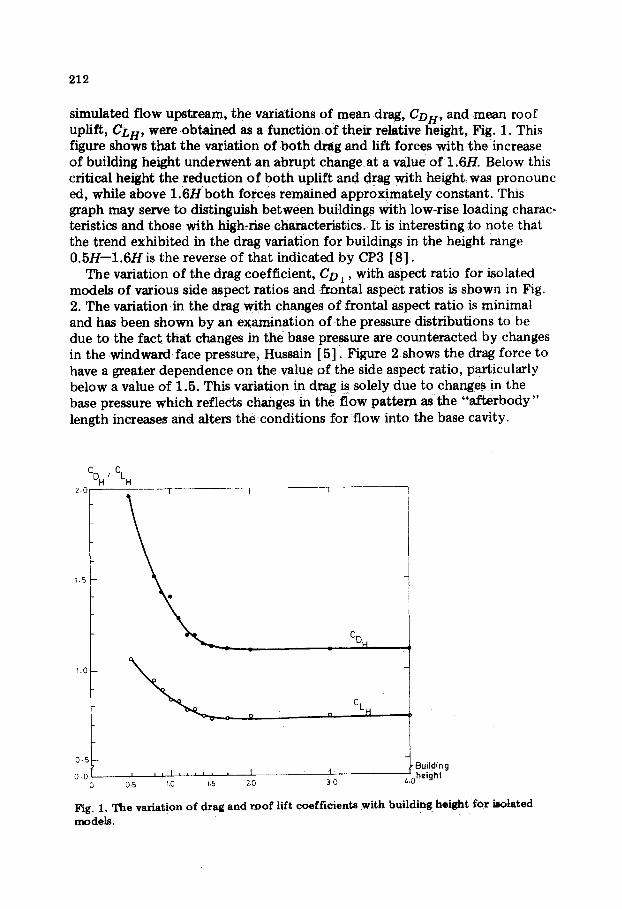
simulated f low upstream, the variations of mean drag, CDH, and mean roof uplift, CLH, were obtained as a function of their relative height, Fig. 1. This figure shows that the variation of bo th drag and lift forces with the increase of building height underwent an abrupt change at a value of 1.6H. Below this critical height the reduct ion of both uplift and drag with height was pronounc ed, while above 1.6H bo th forces remained approximately constant. This graph may serve to distinguish between buildings with low-rise loading charac- teristics and those with high-rise characteristics. It is interesting to note that the trend exhibited in the drag variation for buildings in the height range 0 .5H--1.6H is the reverse of that indicated by CP3 [8] .
The variation of the drag coefficient, CD ~, with aspect ratio for isolated models of various side aspect ratios and frontal aspect ratios is shown in Fig. 2. The variation in the drag with changes of frontal aspect ratio is minimal and has been shown by an examination of the pressure distributions to be due to the fact that changes in the base pressure are counteracted by changes in the windward face pressure, Hussain [5] . Figure 2 shows the drag force to have a greater dependence on the value of the side aspect ratio, particularly below a value of 1.5. This variation in drag is solely due to changes in the base pressure which reflects changes in the flow pat tern as the " a f t e rbody" length increases and alters the conditions for flow into the base cavity.
CDH t CLH 2.0, I
1.5
1.0
0-5
0.0 i I I t I I , ' ,
0.5 1.0 1.5
I I
2,0 3.0
CD H
n CLH
I Building z. 0 helght
Fig. 1. The variation of drag and roof lift coefficients with building height for i~olated
models.

213
C D 0,30
0 .25
0 .20
0.15 i
0-10 1 i
0.0
i I I
Fr9ntal aspect ratio
Side aspecT" rotio
I ~ I I Aspect 0.5 1.0 1-5 2.0 3.0 4.0 ratio
Fig. 2. The variation o f drag coefficient for isolated buildings of different frontal and side aspect ratios.
3.2 The influence of upstream fetch The reason for carrying out this part of the test programme was to deter-
mine the upstream fetch conditions which would permit mean pressure and velocity measurements to be made which would adequately reflect the influ- ences due to model pattern and area density changes. The array size, denot- ed by R, could be varied in the range 3H--145H upstream, and 3H--25H downstream, of the instrumented model. The tests started by gradually ex- tending the array size in the otherwise empty working section until the pres- sures measured on the surface of the instrumented model ceased to vary. At this point the pressures were considered to have stabilised.
Figure 3 shows the variation of the drag coefficient CD~ with R/H for the various combinations of pattern and plan area density tested. It can be seen
CD 1 0 z, ,
0.3
o.2t
0.~
F
:l model C at 'os herac ' ncbdent ow ,* ! ~.~_.. .s.~.i .~ide. ~.w. ~m rh
i
20.0
L T . . . . .
I ~.~_,, . . . . -1---o2s.0 i u
3, '3 ~ l 3 20 Z.0 60 80 100
R/H 120 140
• No rma~ pattern _ _ ~ _ _ _ S taggered pattern
Fig. 3. The variation of drag coefficient with upstream fetch length for arrays of cubes.
214
that the rate at which the drag coefficient decreases as the fetch length is ex- tended is dependent on the density and pattern of the array. The reduction is quite abrupt for the higher densities and more gradual for the low density arrays, where for the 5% normal pat tern and 10% staggered pat tern the ma- jor i ty of the reduction has occurred by R = 25H, and for the 20% normal pat- tern and 25% staggered pattern, by R = 10H.
Following this approximate assessment of the array fetch required for pressure stability the simulated atmospheric boundary layer apparatus was then introduced upstream. A further reduction in the value of CD1 was then recorded for all the combinations of array pattern and density considered. Taking the 5% normal pattern as an example the values of CD1 of 0.25 and 0.17 for array fetches of 25H and 145H, respectively, fell to 0.15 when the simulation apparatus was introduced upstream of a pattern array size of 25H. This reduction is considered to just ify the use of a particular model array fetch of 25H for low density arrays reducing to 10H for the highest density arrays in the test programme. The simulation apparatus then remained in the forward part of the working section for the remainder of the test programme, extending downstream to meet the size of a particular model array.
The conclusion reached in this section has referred only to measurements of the drag coefficient; however, it could be equally well substantiated by reference to the roof uplift force coefficient results.
3. 3 Cube-type building arrays As stated in the Introduct ion to this paper the purpose of this phase of the
s tudy was to repeat the earlier investigation b y Lee and Soliman [3] on the wind pressure forces on arrays of cube elements, bu t under more-rigorous incident f low conditions. The range of test parameters relevant to this phase of the investigation is described in Section 2.
One of the more important conclusions reached b y Lee and Soliman | 3] , following the work of Morris [4] and Marshall [10] , was that the variation of bo th the windward and leeward pressure coefficients, Cpw and Cpb, with element spacing, or plan area density, could be represented by a broken straight line. From this, it followed that the variation of the mean drag coef- ficient, CD1, with spacing for a particular type of layout pattern could also be represented b y a broken straight-line relationship where the breaks, or in- flections, were considered to reflect a change in the type of flow regime. This was considered as supporting evidence for the existence of Morris's three flow-regime categories in the flow over three-dimensional roughness elements. These flow regimes which are applicable to pipe flow, o p e n chan- nel flow and flat plate boundary layers are denoted as isolated roughness flow, wake interference flow and skimming flow. In the isolated roughness flow regime the roughness elements are sufficiently far apart that each ele- ment acts in isolation and behind each the wake and separation bubble de- velop completely, reat tachment occurring before the next element is reach- ed. In the second regime the roughness elements are close enough to each
215
other so that the separation bubble associated with each element does not have room to develop fully. In the third regime, the roughness elements are closer still so that stable vortices are created in the spaces between the ele- ments. The flow here appears to skim on the crests of the elements.
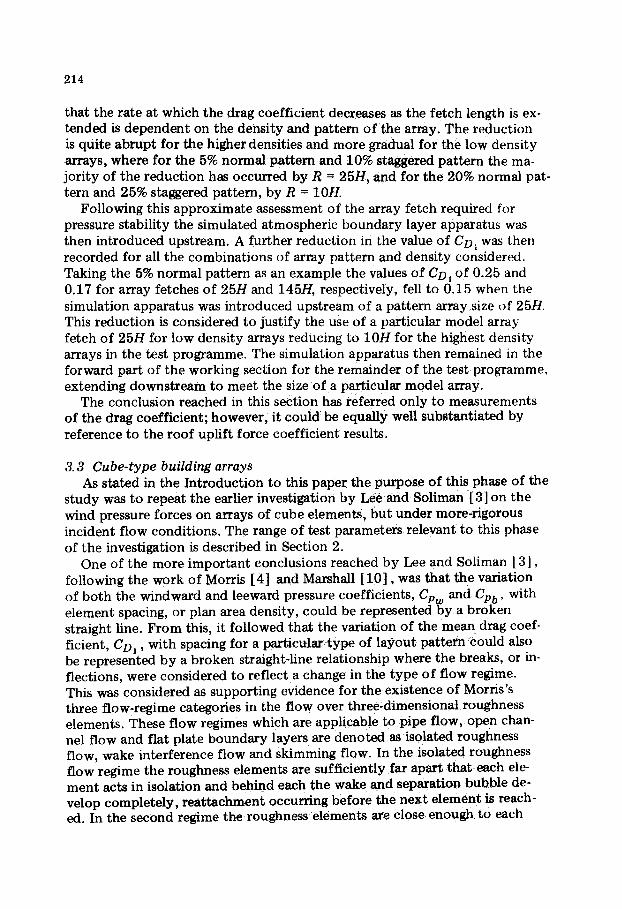
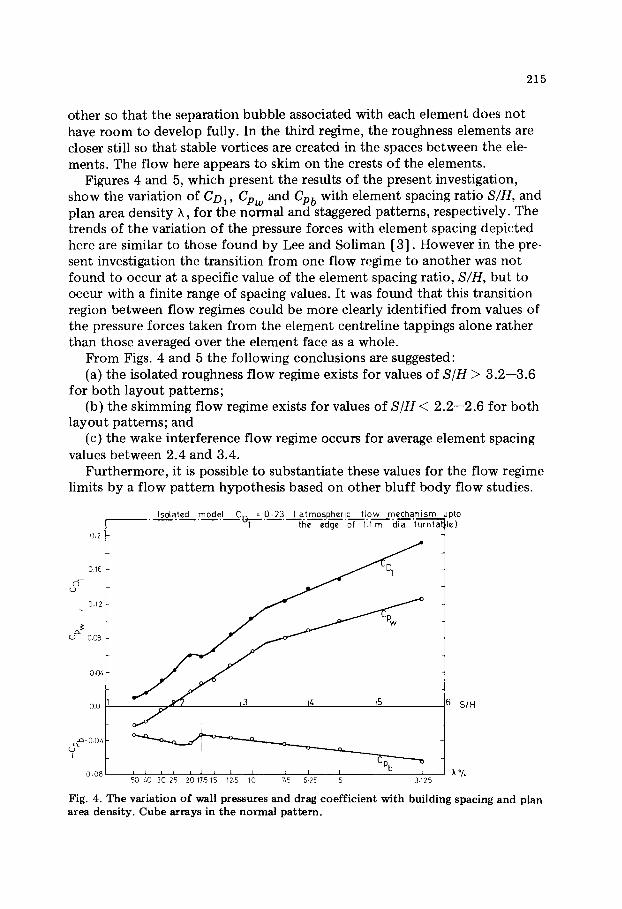
Figures 4 and 5, which present the results of the present investigation, show the variation of CDI , Cpw and Cpb with element spacing ratio S/H, and plan area density X, for the normal and staggered patterns, respectively. The trends of the variation of the pressure forces with element spacing depicted here are similar to those found by Lee and Soliman [3] . However in the pre- sent investigation the transition from one flow regime to another was not found to occur at a specific value of the element spacing ratio, S/H, but to occur with a finite range of spacing values. It was found that this transition region between flow regimes could be more clearly identified from values of the pressure forces taken from the element centreline tappings alone rather than those averaged over the element face as a whole.
From Figs. 4 and 5 the following conclusions are suggested: (a) the isolated roughness flow regime exists for values of S/H > 3.2--3.6
for both layout patterns; (b) the skimming flow regime exists for values of S/H ~ 2.2--2.6 for both
layout patterns; and (c) the wake interference flow regime occurs for average element spacing
values between 2.4 and 3.4. Fur thermore, it is possible to substantiate these values for the flow regime
limits by a flow pattern hypothesis based on other bluff body flow studies.
Iso{ated model C~1 = 0.23 {atmospheric f low mechanism ,pro the edge of h l m dia turntal le)
0.2'
s o16 J q
0.12
S o : Pw
0.04 i
0.0 S/H
o .o~
i
o . 0 8 , ~ , , L , L ~ K. , L b , X " / ° 50 LO 30 2'5 20 1"/.5 15 12.5 ] 75 5.25 5 3.125
Fig. 4. The variation of wall pressures and drag coefficient with building spacing and plan area density. Cube arrays in the normal pattern.
216
CI~ C
0.16
0.1
O,0e
0.04
0'0
-0.04 t
-CPb ~
~w Iso~Itcd model ~ 0 ~ 2 3 _Lat~(~nWl~iC flow .rn~.cl~t~srn Upto • the ~ ' " ~ " ~ . i ~" -~ '~ t~r~,~l )
• CD •
p~
~ ' ~ ~ ~ n ~ n CPI~ 510 I I t I I I I I 110 I
4035 30 25 20 17.5 15 t2-5 7.5 5
SIH
Fig. 5. The variation of wall pressures and drag coefficients with building spacing and plan area density. Cube arrays in the staggered pattern.
It is suggested that the lower limit of the isolated roughness flow regime would be reached at an element spacing equivalent to the total distance be- tween the upstream separation point and the downstream reattachment point of the flow around an isolated cube. The figures given for these separated flow region lengths by Castro and Robins [11] of 0 .9 / /and 1.5/4, for the up- stream and downstream distances respectively, ~ogether with the cube length itself of 1H, agree well with the value of 3 .4 / / fo r the average lower limit of the isolated roughness flow regime found in the present study.
Similarly it is possible to arrive at an estimate for the upper limit of the skimming flow regime by considering the cavity size necessary for the esta- blishment of a stable vortex. Tani et at. [ I 2 ] , in work on two<iimensional grooves in a smooth surface, estimated that the onset of a stable vortex con- dition occurs at a cavity length-to-height ratio of 1.4. When the length of the element, IH, is added to this, the figure agrees well with the present results.
Figures 4 and 5 also show the value of the isolated element drag. A com- parison of this value with those for the drag of grouped elements clearly illus- trates the importance of proximity effects in the determination of wind pres- sure forces.
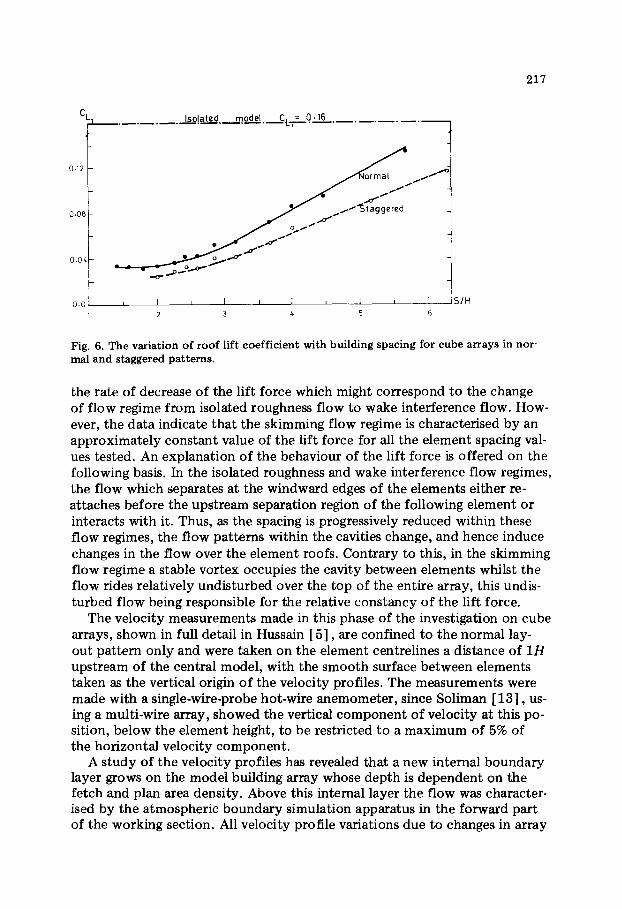
In this phase of the investigation the roof pressure distributions were also measured and were subsequently integrated to give the mean roof uplift force. An examination of the pressure distributions showed the point of maximum suction to be at the leading edge of the roof for all conditions of array pat- tern and density. Figure 6 shows the variation of the roof lift coefficient, based on the free stream velocity, CL], with element spacing and plan area density. From this figure it can be seen that there is no apparent change in
217
CL. solatecl mode l Ct..1- O. 16
0.12
O.Og
0.04
0.0
J o..s.l""
t I ~ I L l ~ I L ]
2 3 4 5 6
SJH
Fig. 6. The variat ion of roof lift coeff ic ient with building spacing for cube arrays in nor- real and staggered patterns.
the rate of decrease of the lift force which might correspond to the change of flow regime from isolated roughness flow to wake interference flow. How- ever, the data indicate that the skimming flow regime is characterised by an approximately constant value of the lift force for all the element spacing val- ues tested. An explanation of the behaviour of the lift force is offered on the following basis. In the isolated roughness and wake interference flow regimes, the flow which separates at the windward edges of the elements either re- attaches before the upstream separation region of the following element or interacts with it. Thus, as the spacing is progressively reduced within these flow regimes, the flow patterns within the cavities change, and hence induce changes in the flow over the element roofs. Contrary to this, in the skimming flow regime a stable vortex occupies the cavity between elements whilst the flow rides relatively undisturbed over the top of the entire army, this undis- turbed flow being responsible for the relative constancy of the lift force.
The velocity measurements made in this phase of the investigation on cube arrays, shown in full detail in Hussain [5] , are confined to the normal lay- out pattern only and were taken on the element centrelines a distance of 1H upstream of the central model, with the smooth surface between elements taken as the vertical origin of the velocity profiles. The measurements were made with a single-wire-probe hot-wire anemometer , since Soliman [13] , us- ing a multi-wire array, showed the vertical component of velocity at this po- sition, below the element height, to be restricted to a maximum of 5% of the horizontal velocity component .
A s tudy of the velocity profiles has revealed that a new internal boundary layer grows on the model building array whose depth is dependent on the fetch and plan area density. Above this internal layer the flow was character- ised by the atmospheric boundary simulation apparatus in the forward part of the working section. All velocity profile variations due to changes in array
218
format were restricted to the internal layer. A log--log plot of the velocity profile was used to measure the thickness of the internal layer. The graphical method proposed b y Perry and Jouber t [14] was used to derive values of the zero plane displacement, d, and the roughness length, Z0, in the manner illus- trated by Lee and Soliman [3] .
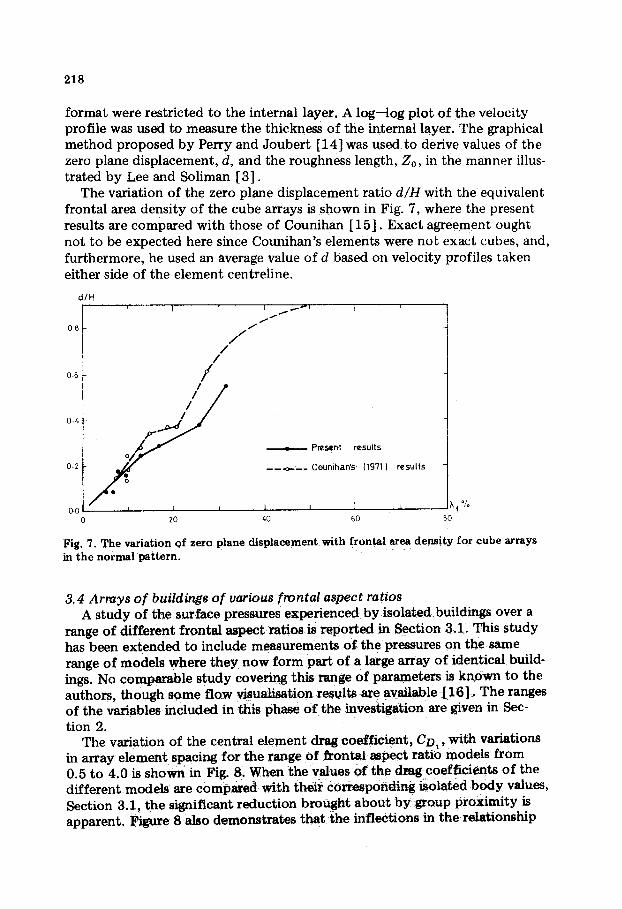
The variation of the zero plane displacement ratio d/H with the equivalent frontal area density of the cube arrays is shown in Fig. 7, where the present results are compared with those of Counihan [ 15] . Exact agreement ought not to be expected here since Counihan's elements were not exact cubes, and, furthermore, he used an average value of d based on velocity profiles taken either side of the element centreline.
d / H
0-8
0.6
0 .4
0.2
0-0 )~ f °Io 0 ~,0
/ /
/ /
/ / //i//
• Present resul ts
- - - - . , o - - - - - C o u n i h a f f s (19"11) r e s u l t s
i I I I 20 40 60
Fig. 7. The variat ion of zero plane d isplacement wi th f ronta l area dens i ty for cube arrays in t he normal pat tern.
3.4 Arrays of buildings of various frontal aspect ratios A study of the surface pressures experienced by isolated buildings over a
range of different frontal aspect ratios is reported in Section 3.1. This s tudy has been extended to include measurements o f the pressures on the same range of models where they now form part of a large array of identical build- ings. No comparable s tudy covering this range of parameters is known to the authors, though some flow visualisation results are available [16] . The ranges of the variables included in this phase of the investigation are given in Sec- tion 2.
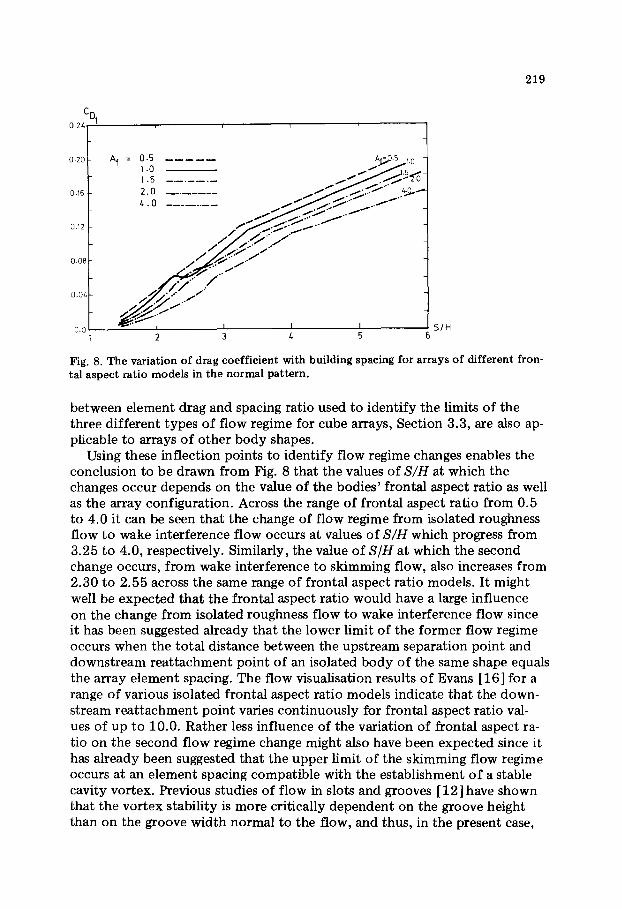
The variation of the central element drag coefficient , CD,, with variations in array element spacing for the range o f frontal aspect ratio models from 0.5 to 4.0 is shown in Fig. 8. When the values of the drag coefficients of the different models are compared with their corresponding isolated body values, Section 3.1, the significant reduction brought abou t b y group proximity is apparent. Figure 8 also demonstrates that the inflections in the relationship
219
0.24C D1
0.20
0.16
0.12
0,08
0,0 z.
o.o
Af 0.5 = ~ A J,;'°5..,,.1.0
2. o . . . . . . . . I ~ . . C . ~ : . . ~ _..*..~.-
~ ) " / " .°'
I I I I 2 3 ~ 5
51H 6
Fig. 8. The variation of drag coefficient with building spacing for arrays of different fron- tal aspect ratio models in the normal pattern.
between element drag and spacing ratio used to identify the limits of the three different types of flow regime for cube arrays, Section 3.3, are also ap- plicable to arrays of other body shapes.
Using these inflection points to identify flow regime changes enables the conclusion to be drawn from Fig. 8 that the values of S/H at which the changes occur depends on the value of the bodies' frontal aspect ratio as well as the array configuration. Across the range of frontal aspect ratio from 0.5 to 4.0 it can be seen that the change of flow regime from isolated roughness flow to wake interference flow occurs at values of S/H which progress from 3.25 to 4.0, respectively. Similarly, the value of S/H at which the second change occurs, from wake interference to skimming flow, also increases from 2.30 to 2.55 across the same range of frontal aspect ratio models. It might well be expected that the frontal aspect ratio would have a large influence on the change from isolated roughness flow to wake interference flow since it has been suggested already that the lower limit of the former flow regime occurs when the total distance between the upstream separation point and downstream reattachment point of an isolated body of the same shape equals the array element spacing. The flow visualisation results of Evans [16] for a range of various isolated frontal aspect ratio models indicate that the down- stream reat tachment point varies continuously for frontal aspect ratio val- ues of up to 10.0. Rather less influence of the variation of frontal aspect ra- tio on the second flow regime change might also have been expected since it has already been suggested that the upper limit of the skimming flow regime occurs at an element spacing compatible with the establishment of a stable cavity vortex. Previous studies of flow in slots and grooves [12] have shown that the vortex stability is more critically dependent on the groove height than on the groove width normal to the flow, and thus, in the present case,
220
on the element height which remains constant rather than on the element frontal aspect ratio which governs the cavity width.
The roof pressure distributions which were also measured, again showed the position of maximum suction to be at the leading edge of the roof for all element forms and array densities tested. It was found that the magnitude of the maximum suction peak was influenced significantly by the value of the element spacing, S/H, but not by different values of the element plan area density when the spacing was the same.
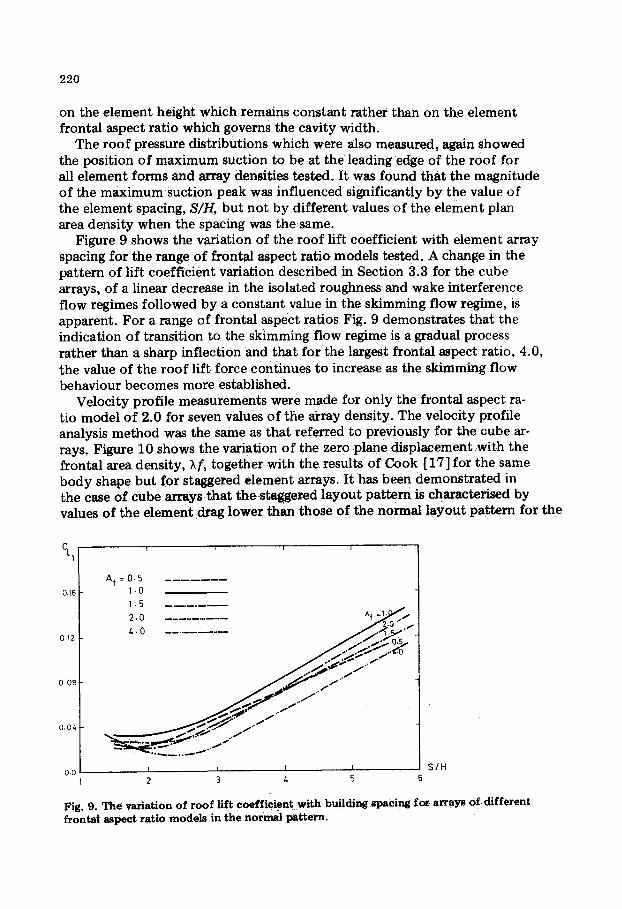
Figure 9 shows the variation of the roof lift coefficient with element array spacing for the range of frontal aspect ratio models tested. A change in the pattern of lift coefficient variation described in Section 3.3 for the cube arrays, of a linear decrease in the isolated roughness and wake interference flow regimes followed by a constant value in the skimming flow regime, is apparent. For a range of frontal aspect ratios Fig. 9 demonstrates that the indication of transition to the skimming flow regime is a gradual process rather than a sharp inflection and tha t for the largest frontal aspect ratio, 4.0, the value of the roof lift force continues to increase as the skimming flow behaviour becomes more established.
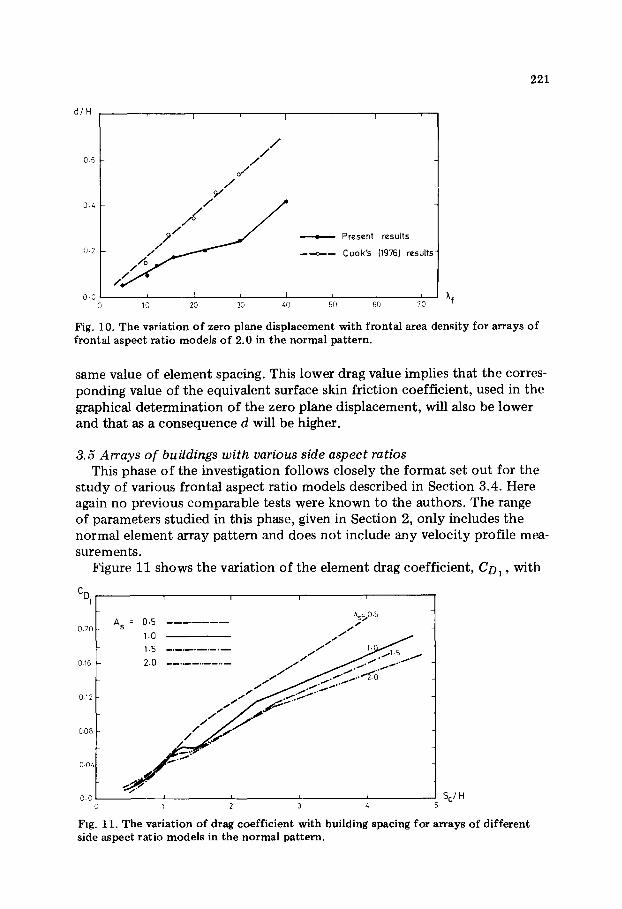
Velocity profile measurements were made for only the frontal aspect ra- tio model of 2.0 for seven values of the array density. The velocity profile analysis method was the same as that referred to previously for the cube ar- rays. Figure 10 shows the variation of the zero plane displacement with the frontal area density, ~,f, together with the results of Cook [17] for the same body shape but for staggered element arrays. It has been demonstrated in the case of cube arrays that the staggered layout pat tern is characterised by values of the element drag lower than those of the normal layout pattern for the
CL 1
0,16
0,12
0.08
0.04
- - i t i 1
Af =0.5 1.0 1.5 2.0 A! = l . ~ / f
.0"
Z
~ , k ~ . ~ , ~ .~ r j,,-~
o.o I ~ ; i . S/H 2 3 L 5 6
Fig. 9. The variation o f r o o f l i f t coefficient with building spacing for a r rays of different f r on t a l aspec t ratio models in t h e n o r m a l p a t t e r n .
221
d / H
0.6
0.4
0.2
0-0
I I I
/ /
/ o/
/
, I l I I0 20 30 40
• Present results
----o---- Cook's {1976} results
[ Xf 50 60 7~0
Fig. 10. T h e variat ion o f zero p lane d i s p l a c e m e n t w i t h fronta l area dens i ty for arrays o f f ronta l a s p e c t rat io m o d e l s o f 2 .0 in t h e no r ma l pat tern .
same value of element spacing. This lower drag value implies that the corres- ponding value of the equivalent surface skin friction coefficient, used in the graphical determination of the zero plane displacement, will also be lower and that as a consequence d will be higher.
3.5 Arrays of buildings with various side aspect ratios This phase of the investigation follows closely the format set out for the
study of various frontal aspect ratio models described in Section 3.4. Here again no previous comparable tests were known to the authors. The range of parameters studied in this phase, given in Section 2, only includes the normal element array pattern and does not include any velocity profile mea- surements.
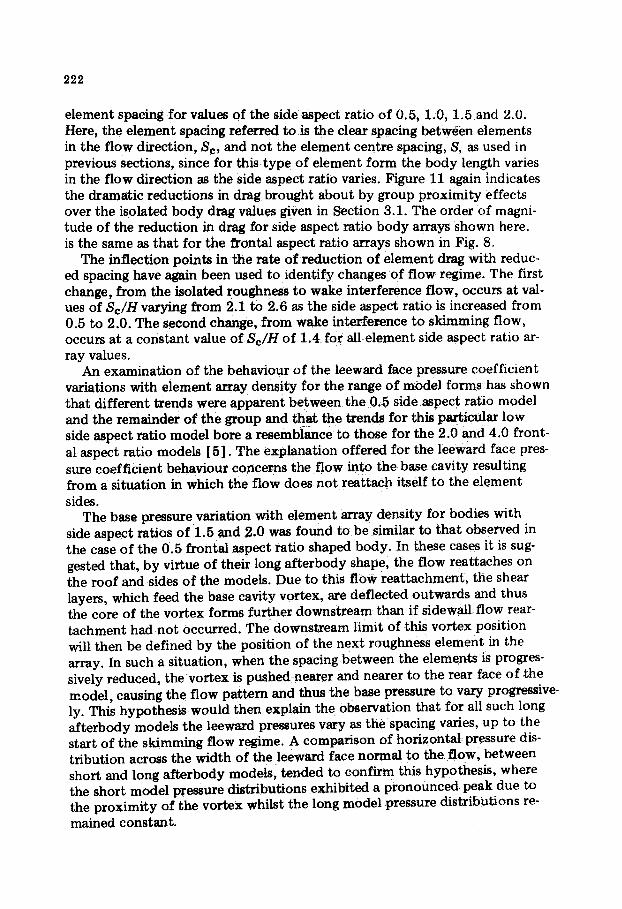
Figure 11 shows the variation of the element drag coefficient, CD1 , with
i i i i
As~0& A s = 0.5 / I
1.0 / ' 1.5 j / j / / ~ ~ , .
/ f S..1" t I ~ , .
0,12 d / ~. I . ' I '
O. 08 / / / / ~ " /
0.04 / ' ~
0.0 , t I i SC/H 1 2 3 4
Fig. 11. T h e variat ion o f drag c o e f f i c i e n t w i t h bu i ld ing spac ing for arrays o f d i f f erent s ide a spec t rat io m o d e l s in the n o r m a l pat tern .
CD I
0.20
222
element spacing for values of the side aspect ratio of 0.5, 1.0, 1.5 and 2.0. Here, the element spacing referred to is the clear spacing between elements in the f low direction, Sc, and not the element centre spacing, S, as used in previous sections, since for this type of element form the body length varies in the f low direction as the side aspect ratio varies. Figure 11 again indicates the dramatic reductions in drag brought about by group proximity effects over the isolated body drag values given in Section 3.1. The order of magni- tude of the reduction in drag for side aspect ratio body arrays shown here, is the same as that for the frontal aspect ratio arrays shown in Fig. 8.
The inflection points in the rate o f reduct ion of element drag with reduc- ed spacing have again been used to identify changes of f low regime. The first change, from the isolated roughness to wake interference flow, occurs at val- ues of Sc/H varying from 2.1 to 2.6 as the side aspect ratio is increased from 0.5 to 2.0. The second change, from wake interference to skimming flow, occurs at a constant value of Sc/H of 1.4 for all element side aspect ratio ar- ray values.
An examination of the behaviour of the leeward face pressure coefficient variations with element array density for the range of model forms has shown that different trends were apparent be tween the 0.5 side aspect ratio model and the remainder of the group and that the trends for this particular low side aspect ratio model bore a resemblance to those for the 2.0 and 4.0 front- al aspect ratio models [5] . The explanation offered for the leeward face pres- sure coefficient behaviour concerns the flow into the base cavity resulting from a situation in which the flow does not reattach itself to the element sides.
The base pressure variation with element array density for bodies with side aspect ratios of 1.5 and 2.0 was found to be similar to that observed in the case of the 0.5 frontal aspect ratio shaped body. In these cases it is sug- gested that, b y virtue of their long af te rbody shape, the flow reattaches on the roof and sides of the models. Due to this flow reat tachment , the shear layers, which feed the base cavity vortex, are def lected outwards and thus the core of the vortex forms further downstream than if sidewall flow rear- tachment had not occurred. The downstream limit of this vortex position will then be defined by the position of the next roughness element in the array. In such a situation, when the spacing between the elements is progres- sively reduced, the vortex is pushed nearer and nearer to the rear face of ~he model , causing the flow pat tern and thus the base pressure to vary progressive- ly. This hypothesis would then explain the observation that for all such long a f te rbody models the leeward pressures vary as the spacing varies, up to the start of the skimming flow regime. A comparison of horizontal pressure dis- tr ibution across the width of the leeward face normal to the flow, between short and long af te rbody models, tended to confirm this hypothesis, where the short model pressure distributions exhibited a pronounced peak due to the proximity of the vortex whilst the long model pressure distributions re-
mained constant.
223
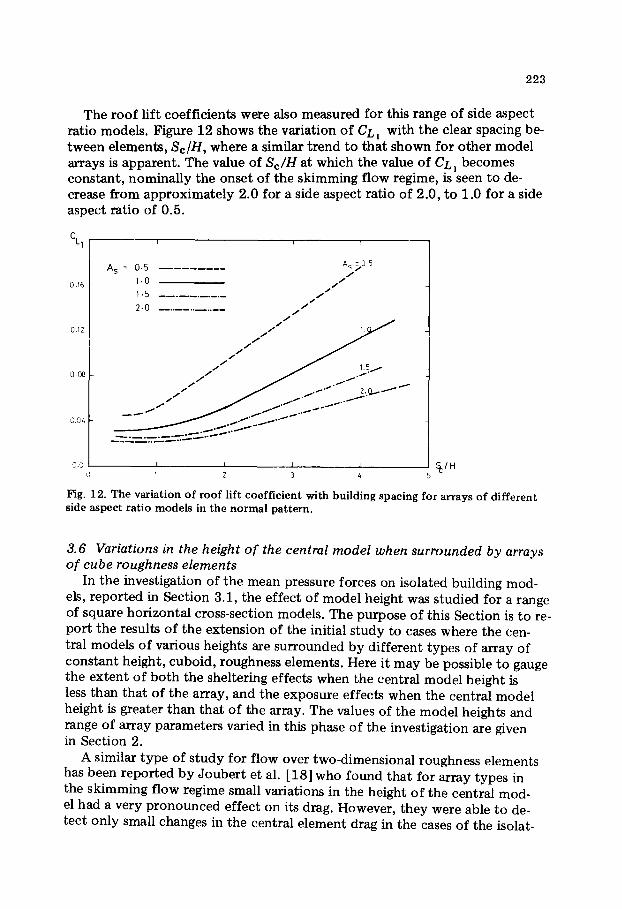
The roof lift coefficients were also measured for this range of side aspect ratio models. Figure 12 shows the variation of CL, with the clear spacing be- tween elements, Sc/H, where a similar trend to that shown for other model arrays is apparent. The value of Sc/H at which the value of CL~ becomes constant, nominally the onset of the skimming flow regime, is seen to de- crease from approximately 2.0 for a side aspect ratio of 2.0, to 1.0 for a side aspect ratio of 0.5.
CL 1
0.16
0.12
0.08
0.04
A s = 0.5 A s ~0.5 I "
1-0 i f j
1.5 . . . . . . . . . . . . . / I
2.0 . . . . . . . . . . . . , , / / /
. . / ffJf ~
/ f J 1 .5~ j J J _~ . . I " -
0 , 0 I I I I 0 1 2 3 4
s~/u
Fig. 12. The variation of roof lift coefficient with building spacing for arrays of different side aspect ratio models in the normal pattern.
3.6 Variations in the height of the central model when surrounded by arrays of cube roughness elements
In the investigation of the mean pressure forces on isolated building mod- els, reported in Section 3.1, the effect of model height was studied for a range of square horizontal cross-section models. The purpose of this Section is to re- port the results of the extension of the initial s tudy to cases where the cen- tral models of various heights are surrounded by different types of array of constant height, cuboid, roughness elements. Here it may be possible to gauge the extent of both the sheltering effects when the central model height is less than that of the array, and the exposure effects when the central model height is greater than that of the array. The values of the model heights and range of array parameters varied in this phase of the investigation are given in Section 2.
A similar type of s tudy for flow over two-dimensional roughness elements has been reported by Joubert et al. [18] who found that for array types in the skimming flow regime small variations in the height of the central mod- el had a very pronounced effect on its drag. However, they were able to de- tect only small changes in the central element drag in the cases of the isolat-
224
ed roughness and w a k e interference f low regimes. Of more importance to the present s tudy, however, Joube r t e t al. investigated one specific case of a three-dimensional element array l ayou t using cuboid roughness elements in a staggered, 8% plan area densi ty array. Their central model had a 3 : l hori- zontal side aspect ratio with its wider side normal to the flow and they re- por ted that its drag coefficient, CD1, showed a linear increase with increases in its height.
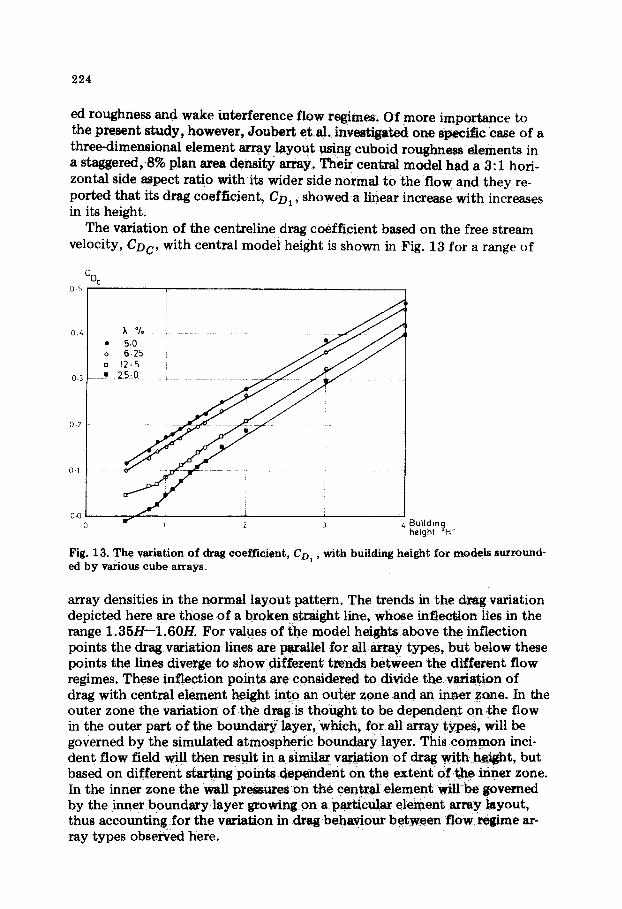
The variation of the centretine drag coefficient based on the free stream velocity, CDc , with central model height is shown in Fig. 13 for a range of
CD c 0.5
o 6 .25
o 12.5 // / / 0.3 •
0.2
0.1
0.0 J 0 ~ Bu~Idlng
height "H"
Fig. 13. The variation o f drag coefficient, CD~ , with building height for models surround- ed by various cube arrays.
array densities in the normal layout pattern. The trends in the drag variation depicted here are those of a broken straight line, whose inflection lies in the range 1.35H--1.60H. For values of the model heights above the inflection points the drag variation lines are parallel for all array types, bu t below these points the lines diverge to show different trends between the different f low regimes. These inflection points are considered to divide the variation of drag with central element height into an ou te r zone and an inner zone. In the outer zone the variation of the drag is thought to be dependent on the flow in the outer part o f the boundary layer, which, for all array types, will be governed b y the simulated atmospheric boundary layer. This c o m m o n inci- dent f low field will then result in a similar variation of drag with he~ht , but based on different starting points dependent on the extent of the inner zone. In the inner zone the wall pressures on the central element wiUbe governed by the inner boundary layer growing on a particular element array layout, thus accounting for the variation in drag behaviour be tween f low regime ar- ray types observed here.
225
C o n c l u s i o n s
Th i s p a p e r has a t t e m p t e d t o d e m o n s t r a t e , b y m e a n s o f a r i g o r o u s m o d e l a n a l o g u e t e c h n i q u e , t h a t t h e p r o x i m i t y e f f e c t s d u e t o t h e c o n s t r u c t i o n o f
l o w - r i s e b u i l d i n g s in g r o u p a r r a y s a r e i m p o r t a n t in t h e d e t e r m i n a t i o n o f w ind - i n d u c e d s u r f a c e p r e s s u r e fo rces . T h e s e p r o x i m i t y e f f e c t s a re a p p a r e n t a t v e r y l o w b u i l d i n g p l a n n i n g d e n s i t i e s a n d c a n n o t be a d e q u a t e l y c o m p e n s a t e d f o r
b y m o d e l t e s t s on i s o l a t e d b u i l d i n g s in s i m u l a t e d a t m o s p h e r i c b o u n d a r y lay- e rs , w h i c h r e f l e c t o n l y t h e g e n e r a l c h a r a c t e r i s t i c s o f a p a r t i c u l a r t e r r a i n c a t e - g o r y .
R e f e r e n c e s
1 L. Harding, Discussion Session 8, Proc. 4th Int. Conf. Wind Effects on Buildings and Structures, H~athrow. London, Sept. 1975.
2 B.F. Soliman and B.E. Lee, Some aspects of density and form relevant to air flow in urban areas, Build International, 7 (1974) 451--473.
3 B.E. Lee and B.F. Soliman, An investigation of the forces on three dimensional bluff bodies in rough wall turbulent boundary layers, Trans. A.S.M.E.J . Fluid Eng., 99 (1977) 503--510.
4 H.M. Morris, Flow in rough conduits, Trans. A.S.C.E., 120 (1955) 373--398. 5 M. Hussain, A study of the wind forces on low rise building arrays and their appli-
cation to natural ventilation design methods, Ph.D. Thesis, Department of Building Science, Sheffield University, 1979.
6 B.E. Lee, The simulation of atmospheric boundary layers in the Sheffield University 1.2 x 1.2 m boundary layer wind tunnel, Proc. 3rd Colloq. Ind. Aerodyn. , Fach- hochschule Aachen, F.D.R., June 1978.
7 J.C. Counihan, Simulation of an adiabatic urban boundary layer in a wind tunnel, Atmos. Environ., 7 (1973) 673--689.
8 British Standards Institution, Code of Practice 3, Chapter 5, Part II, Wind Loads, London, 1972.
9 E.S.D.U., Fluid forces, pressures and moments on rectangular blocks, Engineering Societies Data Unit, Item 71016, London, Sept. 1971.
10 J.K. Marshall, Drag measurements in roughness arrays of varying density and distri- butions, J. Agric. Meteorol., 8 (1971) 269--292.
11 I. Castro and A. Robins, The flow around a surface mounted cube in uniform and turbulent streams, J. Fluid Mech., 79 (1977) 307--335.
12 I. Tani, M. Iuchi and H. Komoda, Experimental investigation of flow associated with a step or a groove, Rep. No. 364, Vol. 27, Aeronautical Research Institute, University of Tokyo, 1961.
13 B.F. Soliman, A study of the wind pressure forces acting on groups of buildings, Ph.D. Thesis, Department of Building Science, University of Sheffield, 1976.
14 A.E. Perry and P N. Joubert , Rough wall boundary layers in adverse pressure gra- dients, J. Fluid Mech., 17 (1963) 193--211.
15 J.C. Counihan, Wind tunnel determination of the roughness length as a function of the fetch and roughness densities of three dimensional roughness elements, J. Atmos. Environ., 5 (1971) 637--642.
16 B.H. Evans, Natural airflow around buildings, Texas Eng. Expt. Res. Stn., Rep. No. 59, 1957.
17 N.J. Cook, Data for wind tunnel simulation of the adiabatic atmospheric boundary layer, Bldg. Res. Establ., Note N - 135/76, 1976.
18 P.N. Joubert , A.E. Perry and L.K. Stevens, Drag of a bluff body immersed in a rough wall boundary layer, Proc. 3rd Int. Conf. Wind Effects on Building Structures, Tokyo, 1971.