


Bahasa
Halaman
Hukum

Saudi Pharmaceutical Journal (2011) 19, 65–74
King Saud University
Saudi Pharmaceutical Journal
www.ksu.edu.sawww.sciencedirect.com
ORIGINAL ARTICLE
Phytochemical and biological studies of Adiantumcapillus-veneris L.
Zedan Z. Ibraheim *, Amany S. Ahmed, Yaser G. Gouda
Department of Pharmacognosy, Faculty of Pharmacy, Assiut University, Assiut 71526, Egypt
Received 1 August 2010; accepted 7 January 2011
Available online 18 January 2011
*
10
E
13
El
Pe
do
KEYWORDS
Adiantum capillus-veneris L.;
Adiantane;
Filicane triterpenoids;
Flavonoids;
Anti-inflammatory;
Hypoglycemic
Corresponding author. T
6566770; fax: +20 88 23327
-mail address: Zedanibrahei
19-0164 ª 2011 King Saud
sevier B.V. All rights reserve
er review under responsibilit
i:10.1016/j.jsps.2011.01.007
Production and h
el.: +20
76.
m59@ho
Universit
d.
y of King
osting by E
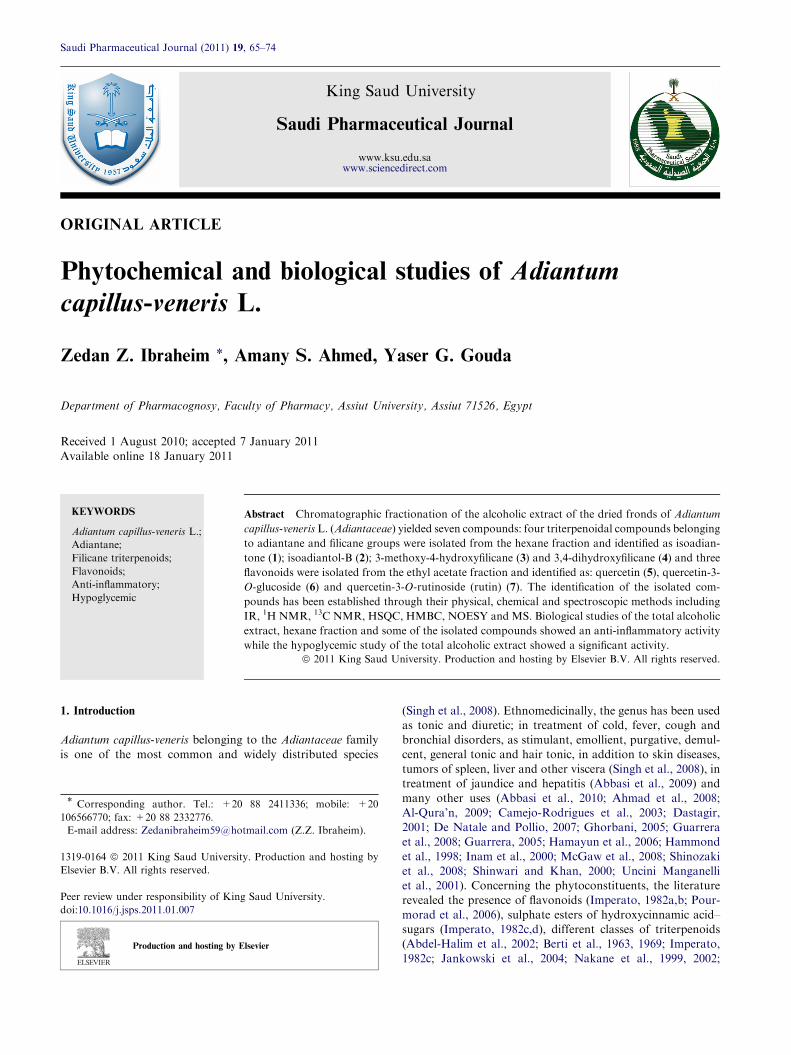
Abstract Chromatographic fractionation of the alcoholic extract of the dried fronds of Adiantum
capillus-veneris L. (Adiantaceae) yielded seven compounds: four triterpenoidal compounds belonging
to adiantane and filicane groups were isolated from the hexane fraction and identified as isoadian-
tone (1); isoadiantol-B (2); 3-methoxy-4-hydroxyfilicane (3) and 3,4-dihydroxyfilicane (4) and three
flavonoids were isolated from the ethyl acetate fraction and identified as: quercetin (5), quercetin-3-
O-glucoside (6) and quercetin-3-O-rutinoside (rutin) (7). The identification of the isolated com-
pounds has been established through their physical, chemical and spectroscopic methods including
IR, 1H NMR, 13C NMR, HSQC, HMBC, NOESY and MS. Biological studies of the total alcoholic
extract, hexane fraction and some of the isolated compounds showed an anti-inflammatory activity
while the hypoglycemic study of the total alcoholic extract showed a significant activity.ª 2011 King Saud University. Production and hosting by Elsevier B.V. All rights reserved.
1. Introduction
Adiantum capillus-veneris belonging to the Adiantaceae family
is one of the most common and widely distributed species
88 2411336; mobile: +20
tmail.com (Z.Z. Ibraheim).
y. Production and hosting by
Saud University.
lsevier
(Singh et al., 2008). Ethnomedicinally, the genus has been usedas tonic and diuretic; in treatment of cold, fever, cough andbronchial disorders, as stimulant, emollient, purgative, demul-cent, general tonic and hair tonic, in addition to skin diseases,
tumors of spleen, liver and other viscera (Singh et al., 2008), intreatment of jaundice and hepatitis (Abbasi et al., 2009) andmany other uses (Abbasi et al., 2010; Ahmad et al., 2008;
Al-Qura’n, 2009; Camejo-Rodrigues et al., 2003; Dastagir,2001; De Natale and Pollio, 2007; Ghorbani, 2005; Guarreraet al., 2008; Guarrera, 2005; Hamayun et al., 2006; Hammond
et al., 1998; Inam et al., 2000; McGaw et al., 2008; Shinozakiet al., 2008; Shinwari and Khan, 2000; Uncini Manganelliet al., 2001). Concerning the phytoconstituents, the literaturerevealed the presence of flavonoids (Imperato, 1982a,b; Pour-
morad et al., 2006), sulphate esters of hydroxycinnamic acid–sugars (Imperato, 1982c,d), different classes of triterpenoids(Abdel-Halim et al., 2002; Berti et al., 1963, 1969; Imperato,
1982c; Jankowski et al., 2004; Nakane et al., 1999, 2002;
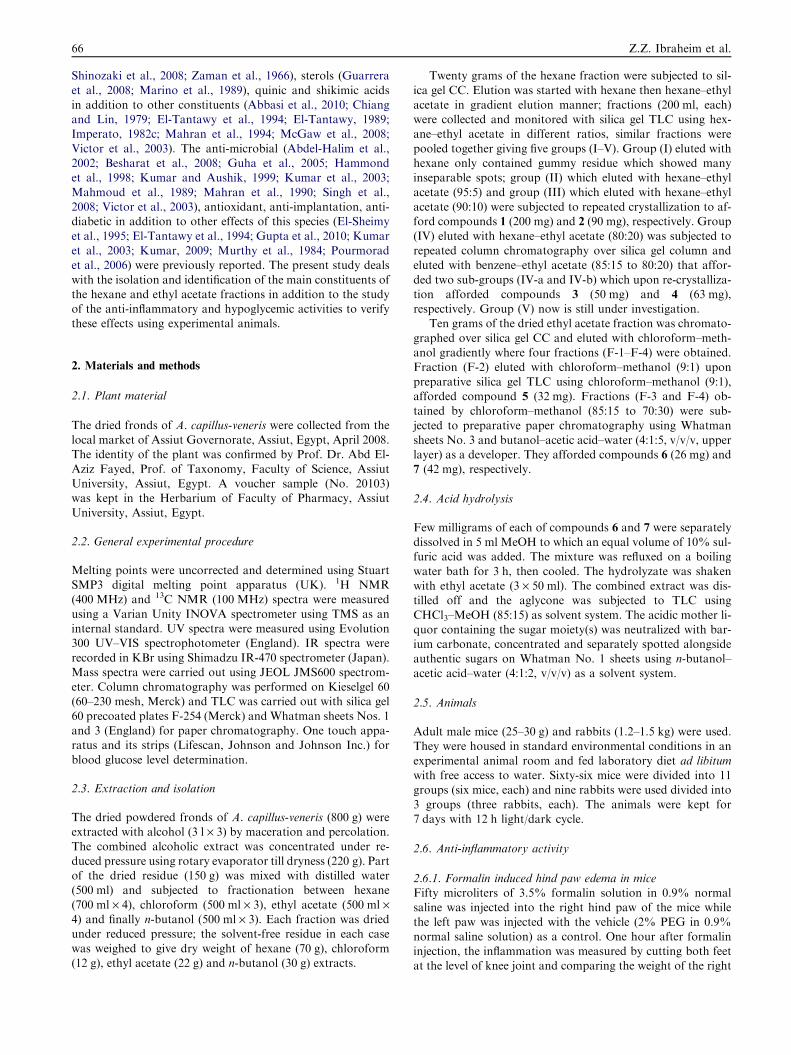
66 Z.Z. Ibraheim et al.
Shinozaki et al., 2008; Zaman et al., 1966), sterols (Guarrera
et al., 2008; Marino et al., 1989), quinic and shikimic acidsin addition to other constituents (Abbasi et al., 2010; Chiangand Lin, 1979; El-Tantawy et al., 1994; El-Tantawy, 1989;Imperato, 1982c; Mahran et al., 1994; McGaw et al., 2008;
Victor et al., 2003). The anti-microbial (Abdel-Halim et al.,2002; Besharat et al., 2008; Guha et al., 2005; Hammondet al., 1998; Kumar and Aushik, 1999; Kumar et al., 2003;
Mahmoud et al., 1989; Mahran et al., 1990; Singh et al.,2008; Victor et al., 2003), antioxidant, anti-implantation, anti-diabetic in addition to other effects of this species (El-Sheimy
et al., 1995; El-Tantawy et al., 1994; Gupta et al., 2010; Kumaret al., 2003; Kumar, 2009; Murthy et al., 1984; Pourmoradet al., 2006) were previously reported. The present study deals
with the isolation and identification of the main constituents ofthe hexane and ethyl acetate fractions in addition to the studyof the anti-inflammatory and hypoglycemic activities to verifythese effects using experimental animals.
2. Materials and methods
2.1. Plant material
The dried fronds of A. capillus-veneris were collected from thelocal market of Assiut Governorate, Assiut, Egypt, April 2008.The identity of the plant was confirmed by Prof. Dr. Abd El-
Aziz Fayed, Prof. of Taxonomy, Faculty of Science, AssiutUniversity, Assiut, Egypt. A voucher sample (No. 20103)was kept in the Herbarium of Faculty of Pharmacy, Assiut
University, Assiut, Egypt.
2.2. General experimental procedure
Melting points were uncorrected and determined using StuartSMP3 digital melting point apparatus (UK). 1H NMR(400 MHz) and 13C NMR (100 MHz) spectra were measured
using a Varian Unity INOVA spectrometer using TMS as aninternal standard. UV spectra were measured using Evolution300 UV–VIS spectrophotometer (England). IR spectra were
recorded in KBr using Shimadzu IR-470 spectrometer (Japan).Mass spectra were carried out using JEOL JMS600 spectrom-eter. Column chromatography was performed on Kieselgel 60(60–230 mesh, Merck) and TLC was carried out with silica gel
60 precoated plates F-254 (Merck) and Whatman sheets Nos. 1and 3 (England) for paper chromatography. One touch appa-ratus and its strips (Lifescan, Johnson and Johnson Inc.) for
blood glucose level determination.
2.3. Extraction and isolation
The dried powdered fronds of A. capillus-veneris (800 g) wereextracted with alcohol (3 l · 3) by maceration and percolation.
The combined alcoholic extract was concentrated under re-duced pressure using rotary evaporator till dryness (220 g). Partof the dried residue (150 g) was mixed with distilled water(500 ml) and subjected to fractionation between hexane
(700 ml · 4), chloroform (500 ml · 3), ethyl acetate (500 ml ·4) and finally n-butanol (500 ml · 3). Each fraction was driedunder reduced pressure; the solvent-free residue in each case
was weighed to give dry weight of hexane (70 g), chloroform(12 g), ethyl acetate (22 g) and n-butanol (30 g) extracts.
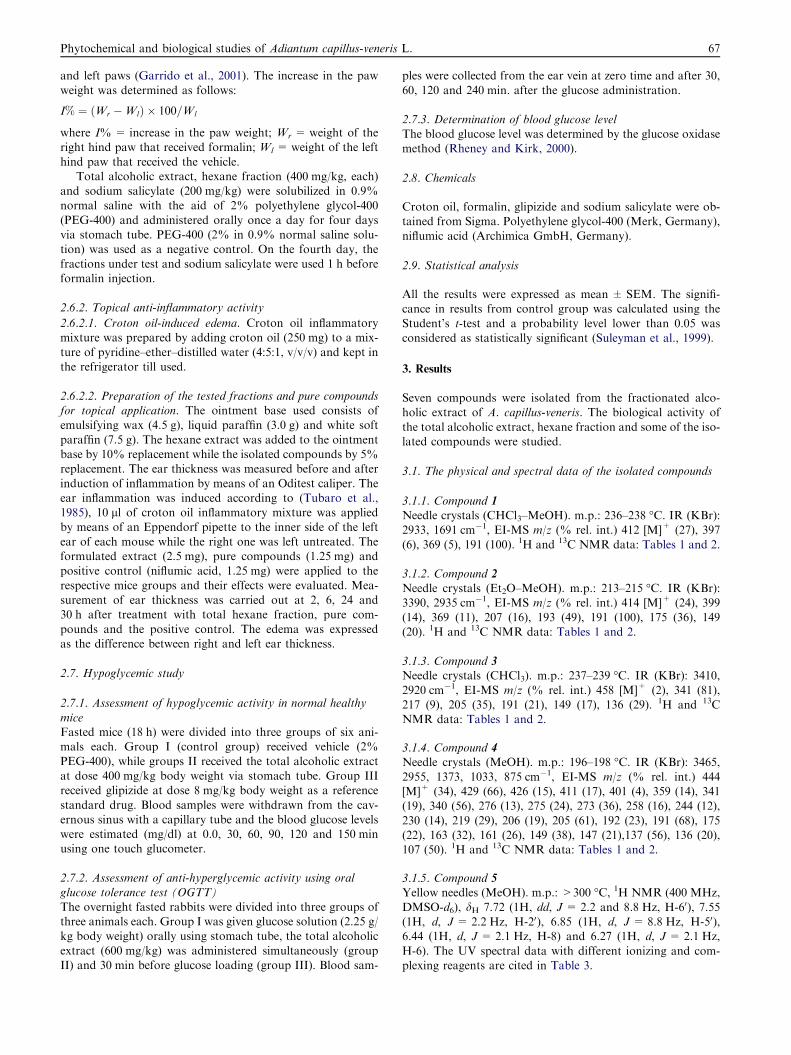
Twenty grams of the hexane fraction were subjected to sil-
ica gel CC. Elution was started with hexane then hexane–ethylacetate in gradient elution manner; fractions (200 ml, each)were collected and monitored with silica gel TLC using hex-ane–ethyl acetate in different ratios, similar fractions were
pooled together giving five groups (I–V). Group (I) eluted withhexane only contained gummy residue which showed manyinseparable spots; group (II) which eluted with hexane–ethyl
acetate (95:5) and group (III) which eluted with hexane–ethylacetate (90:10) were subjected to repeated crystallization to af-ford compounds 1 (200 mg) and 2 (90 mg), respectively. Group
(IV) eluted with hexane–ethyl acetate (80:20) was subjected torepeated column chromatography over silica gel column andeluted with benzene–ethyl acetate (85:15 to 80:20) that affor-
ded two sub-groups (IV-a and IV-b) which upon re-crystalliza-tion afforded compounds 3 (50 mg) and 4 (63 mg),respectively. Group (V) now is still under investigation.
Ten grams of the dried ethyl acetate fraction was chromato-
graphed over silica gel CC and eluted with chloroform–meth-anol gradiently where four fractions (F-1–F-4) were obtained.Fraction (F-2) eluted with chloroform–methanol (9:1) upon
preparative silica gel TLC using chloroform–methanol (9:1),afforded compound 5 (32 mg). Fractions (F-3 and F-4) ob-tained by chloroform–methanol (85:15 to 70:30) were sub-
jected to preparative paper chromatography using Whatmansheets No. 3 and butanol–acetic acid–water (4:1:5, v/v/v, upperlayer) as a developer. They afforded compounds 6 (26 mg) and7 (42 mg), respectively.
2.4. Acid hydrolysis
Few milligrams of each of compounds 6 and 7 were separatelydissolved in 5 ml MeOH to which an equal volume of 10% sul-furic acid was added. The mixture was refluxed on a boiling
water bath for 3 h, then cooled. The hydrolyzate was shakenwith ethyl acetate (3 · 50 ml). The combined extract was dis-tilled off and the aglycone was subjected to TLC using
CHCl3–MeOH (85:15) as solvent system. The acidic mother li-quor containing the sugar moiety(s) was neutralized with bar-ium carbonate, concentrated and separately spotted alongsideauthentic sugars on Whatman No. 1 sheets using n-butanol–
acetic acid–water (4:1:2, v/v/v) as a solvent system.
2.5. Animals
Adult male mice (25–30 g) and rabbits (1.2–1.5 kg) were used.They were housed in standard environmental conditions in an
experimental animal room and fed laboratory diet ad libitumwith free access to water. Sixty-six mice were divided into 11groups (six mice, each) and nine rabbits were used divided into
3 groups (three rabbits, each). The animals were kept for7 days with 12 h light/dark cycle.
2.6. Anti-inflammatory activity
2.6.1. Formalin induced hind paw edema in miceFifty microliters of 3.5% formalin solution in 0.9% normalsaline was injected into the right hind paw of the mice whilethe left paw was injected with the vehicle (2% PEG in 0.9%
normal saline solution) as a control. One hour after formalininjection, the inflammation was measured by cutting both feetat the level of knee joint and comparing the weight of the right
Phytochemical and biological studies of Adiantum capillus-veneris L. 67
and left paws (Garrido et al., 2001). The increase in the paw
weight was determined as follows:
I% ¼ ðWr �WlÞ � 100=Wl
where I% = increase in the paw weight; Wr = weight of theright hind paw that received formalin; Wl =weight of the left
hind paw that received the vehicle.Total alcoholic extract, hexane fraction (400 mg/kg, each)
and sodium salicylate (200 mg/kg) were solubilized in 0.9%normal saline with the aid of 2% polyethylene glycol-400
(PEG-400) and administered orally once a day for four daysvia stomach tube. PEG-400 (2% in 0.9% normal saline solu-tion) was used as a negative control. On the fourth day, the
fractions under test and sodium salicylate were used 1 h beforeformalin injection.
2.6.2. Topical anti-inflammatory activity
2.6.2.1. Croton oil-induced edema. Croton oil inflammatorymixture was prepared by adding croton oil (250 mg) to a mix-
ture of pyridine–ether–distilled water (4:5:1, v/v/v) and kept inthe refrigerator till used.
2.6.2.2. Preparation of the tested fractions and pure compoundsfor topical application. The ointment base used consists ofemulsifying wax (4.5 g), liquid paraffin (3.0 g) and white soft
paraffin (7.5 g). The hexane extract was added to the ointmentbase by 10% replacement while the isolated compounds by 5%replacement. The ear thickness was measured before and after
induction of inflammation by means of an Oditest caliper. Theear inflammation was induced according to (Tubaro et al.,1985), 10 ll of croton oil inflammatory mixture was appliedby means of an Eppendorf pipette to the inner side of the left
ear of each mouse while the right one was left untreated. Theformulated extract (2.5 mg), pure compounds (1.25 mg) andpositive control (niflumic acid, 1.25 mg) were applied to the
respective mice groups and their effects were evaluated. Mea-surement of ear thickness was carried out at 2, 6, 24 and30 h after treatment with total hexane fraction, pure com-
pounds and the positive control. The edema was expressedas the difference between right and left ear thickness.
2.7. Hypoglycemic study
2.7.1. Assessment of hypoglycemic activity in normal healthy
miceFasted mice (18 h) were divided into three groups of six ani-mals each. Group I (control group) received vehicle (2%
PEG-400), while groups II received the total alcoholic extractat dose 400 mg/kg body weight via stomach tube. Group IIIreceived glipizide at dose 8 mg/kg body weight as a reference
standard drug. Blood samples were withdrawn from the cav-ernous sinus with a capillary tube and the blood glucose levelswere estimated (mg/dl) at 0.0, 30, 60, 90, 120 and 150 minusing one touch glucometer.
2.7.2. Assessment of anti-hyperglycemic activity using oralglucose tolerance test (OGTT)The overnight fasted rabbits were divided into three groups ofthree animals each. Group I was given glucose solution (2.25 g/kg body weight) orally using stomach tube, the total alcoholic
extract (600 mg/kg) was administered simultaneously (groupII) and 30 min before glucose loading (group III). Blood sam-
ples were collected from the ear vein at zero time and after 30,
60, 120 and 240 min. after the glucose administration.
2.7.3. Determination of blood glucose levelThe blood glucose level was determined by the glucose oxidasemethod (Rheney and Kirk, 2000).
2.8. Chemicals
Croton oil, formalin, glipizide and sodium salicylate were ob-tained from Sigma. Polyethylene glycol-400 (Merk, Germany),
niflumic acid (Archimica GmbH, Germany).
2.9. Statistical analysis
All the results were expressed as mean ± SEM. The signifi-cance in results from control group was calculated using the
Student’s t-test and a probability level lower than 0.05 wasconsidered as statistically significant (Suleyman et al., 1999).
3. Results
Seven compounds were isolated from the fractionated alco-holic extract of A. capillus-veneris. The biological activity of
the total alcoholic extract, hexane fraction and some of the iso-lated compounds were studied.
3.1. The physical and spectral data of the isolated compounds
3.1.1. Compound 1
Needle crystals (CHCl3–MeOH). m.p.: 236–238 �C. IR (KBr):2933, 1691 cm�1, EI-MS m/z (% rel. int.) 412 [M]+ (27), 397
(6), 369 (5), 191 (100). 1H and 13C NMR data: Tables 1 and 2.
3.1.2. Compound 2
Needle crystals (Et2O–MeOH). m.p.: 213–215 �C. IR (KBr):3390, 2935 cm�1, EI-MS m/z (% rel. int.) 414 [M]+ (24), 399(14), 369 (11), 207 (16), 193 (49), 191 (100), 175 (36), 149(20). 1H and 13C NMR data: Tables 1 and 2.
3.1.3. Compound 3Needle crystals (CHCl3). m.p.: 237–239 �C. IR (KBr): 3410,
2920 cm�1, EI-MS m/z (% rel. int.) 458 [M]+ (2), 341 (81),217 (9), 205 (35), 191 (21), 149 (17), 136 (29). 1H and 13CNMR data: Tables 1 and 2.
3.1.4. Compound 4Needle crystals (MeOH). m.p.: 196–198 �C. IR (KBr): 3465,
2955, 1373, 1033, 875 cm�1, EI-MS m/z (% rel. int.) 444[M]+ (34), 429 (66), 426 (15), 411 (17), 401 (4), 359 (14), 341(19), 340 (56), 276 (13), 275 (24), 273 (36), 258 (16), 244 (12),
230 (14), 219 (29), 206 (19), 205 (61), 192 (23), 191 (68), 175(22), 163 (32), 161 (26), 149 (38), 147 (21),137 (56), 136 (20),107 (50). 1H and 13C NMR data: Tables 1 and 2.
3.1.5. Compound 5Yellow needles (MeOH). m.p.: >300 �C, 1H NMR (400 MHz,
DMSO-d6), dH 7.72 (1H, dd, J = 2.2 and 8.8 Hz, H-60), 7.55(1H, d, J = 2.2 Hz, H-20), 6.85 (1H, d, J = 8.8 Hz, H-50),6.44 (1H, d, J = 2.1 Hz, H-8) and 6.27 (1H, d, J = 2.1 Hz,
H-6). The UV spectral data with different ionizing and com-plexing reagents are cited in Table 3.
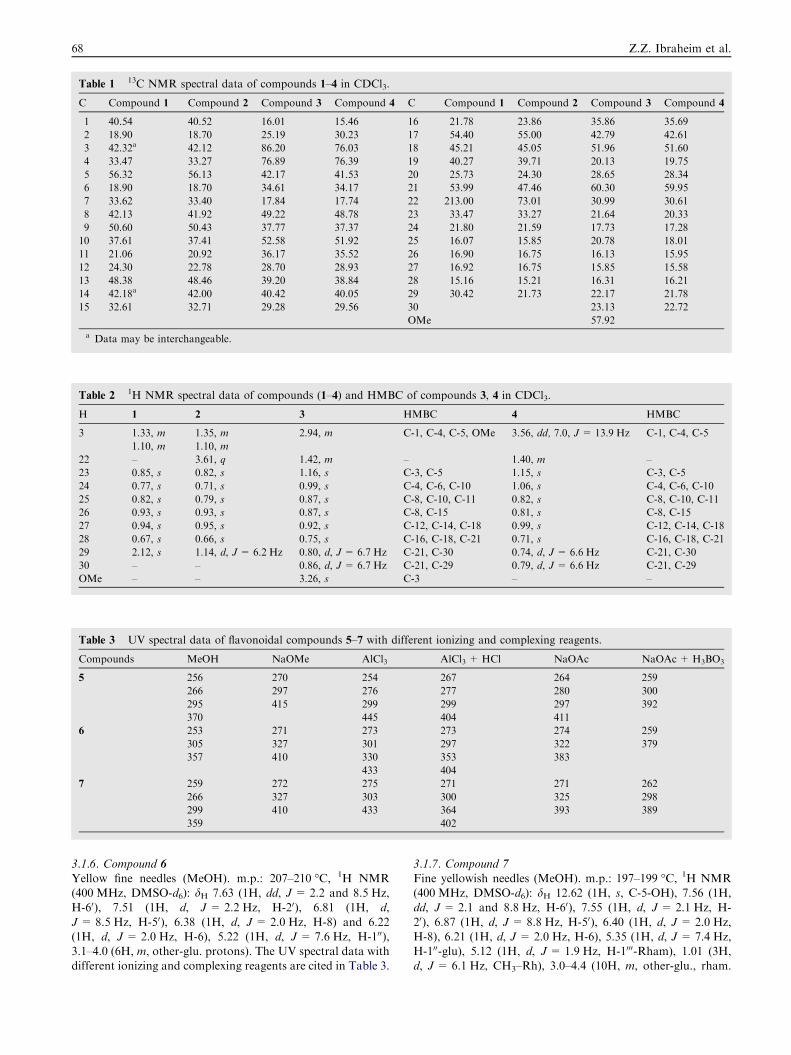
Table 1 13C NMR spectral data of compounds 1–4 in CDCl3.
C Compound 1 Compound 2 Compound 3 Compound 4 C Compound 1 Compound 2 Compound 3 Compound 4
1 40.54 40.52 16.01 15.46 16 21.78 23.86 35.86 35.69
2 18.90 18.70 25.19 30.23 17 54.40 55.00 42.79 42.61
3 42.32a 42.12 86.20 76.03 18 45.21 45.05 51.96 51.60
4 33.47 33.27 76.89 76.39 19 40.27 39.71 20.13 19.75
5 56.32 56.13 42.17 41.53 20 25.73 24.30 28.65 28.34
6 18.90 18.70 34.61 34.17 21 53.99 47.46 60.30 59.95
7 33.62 33.40 17.84 17.74 22 213.00 73.01 30.99 30.61
8 42.13 41.92 49.22 48.78 23 33.47 33.27 21.64 20.33
9 50.60 50.43 37.77 37.37 24 21.80 21.59 17.73 17.28
10 37.61 37.41 52.58 51.92 25 16.07 15.85 20.78 18.01
11 21.06 20.92 36.17 35.52 26 16.90 16.75 16.13 15.95
12 24.30 22.78 28.70 28.93 27 16.92 16.75 15.85 15.58
13 48.38 48.46 39.20 38.84 28 15.16 15.21 16.31 16.21
14 42.18a 42.00 40.42 40.05 29 30.42 21.73 22.17 21.78
15 32.61 32.71 29.28 29.56 30 23.13 22.72
OMe 57.92
a Data may be interchangeable.
Table 2 1H NMR spectral data of compounds (1–4) and HMBC of compounds 3, 4 in CDCl3.
H 1 2 3 HMBC 4 HMBC
3 1.33, m
1.10, m
1.35, m
1.10, m
2.94, m C-1, C-4, C-5, OMe 3.56, dd, 7.0, J = 13.9 Hz C-1, C-4, C-5
22 – 3.61, q 1.42, m – 1.40, m –
23 0.85, s 0.82, s 1.16, s C-3, C-5 1.15, s C-3, C-5
24 0.77, s 0.71, s 0.99, s C-4, C-6, C-10 1.06, s C-4, C-6, C-10
25 0.82, s 0.79, s 0.87, s C-8, C-10, C-11 0.82, s C-8, C-10, C-11
26 0.93, s 0.93, s 0.87, s C-8, C-15 0.81, s C-8, C-15
27 0.94, s 0.95, s 0.92, s C-12, C-14, C-18 0.99, s C-12, C-14, C-18
28 0.67, s 0.66, s 0.75, s C-16, C-18, C-21 0.71, s C-16, C-18, C-21
29 2.12, s 1.14, d, J= 6.2 Hz 0.80, d, J = 6.7 Hz C-21, C-30 0.74, d, J = 6.6 Hz C-21, C-30
30 – – 0.86, d, J = 6.7 Hz C-21, C-29 0.79, d, J = 6.6 Hz C-21, C-29
OMe – – 3.26, s C-3 – –
Table 3 UV spectral data of flavonoidal compounds 5–7 with different ionizing and complexing reagents.
Compounds MeOH NaOMe AlCl3 AlCl3 + HCl NaOAc NaOAc + H3BO3
5 256
266
295
370
270
297
415
254
276
299
445
267
277
299
404
264
280
297
411
259
300
392
6 253
305
357
271
327
410
273
301
330
433
273
297
353
404
274
322
383
259
379
7 259
266
299
359
272
327
410
275
303
433
271
300
364
402
271
325
393
262
298
389
68 Z.Z. Ibraheim et al.
3.1.6. Compound 6
Yellow fine needles (MeOH). m.p.: 207–210 �C, 1H NMR(400 MHz, DMSO-d6): dH 7.63 (1H, dd, J = 2.2 and 8.5 Hz,H-60), 7.51 (1H, d, J = 2.2 Hz, H-20), 6.81 (1H, d,
J= 8.5 Hz, H-50), 6.38 (1H, d, J = 2.0 Hz, H-8) and 6.22(1H, d, J = 2.0 Hz, H-6), 5.22 (1H, d, J = 7.6 Hz, H-100),3.1–4.0 (6H, m, other-glu. protons). The UV spectral data withdifferent ionizing and complexing reagents are cited in Table 3.
3.1.7. Compound 7
Fine yellowish needles (MeOH). m.p.: 197–199 �C, 1H NMR(400 MHz, DMSO-d6): dH 12.62 (1H, s, C-5-OH), 7.56 (1H,dd, J = 2.1 and 8.8 Hz, H-60), 7.55 (1H, d, J= 2.1 Hz, H-
20), 6.87 (1H, d, J= 8.8 Hz, H-50), 6.40 (1H, d, J = 2.0 Hz,H-8), 6.21 (1H, d, J = 2.0 Hz, H-6), 5.35 (1H, d, J = 7.4 Hz,H-100-glu), 5.12 (1H, d, J= 1.9 Hz, H-1000-Rham), 1.01 (3H,d, J = 6.1 Hz, CH3–Rh), 3.0–4.4 (10H, m, other-glu., rham.
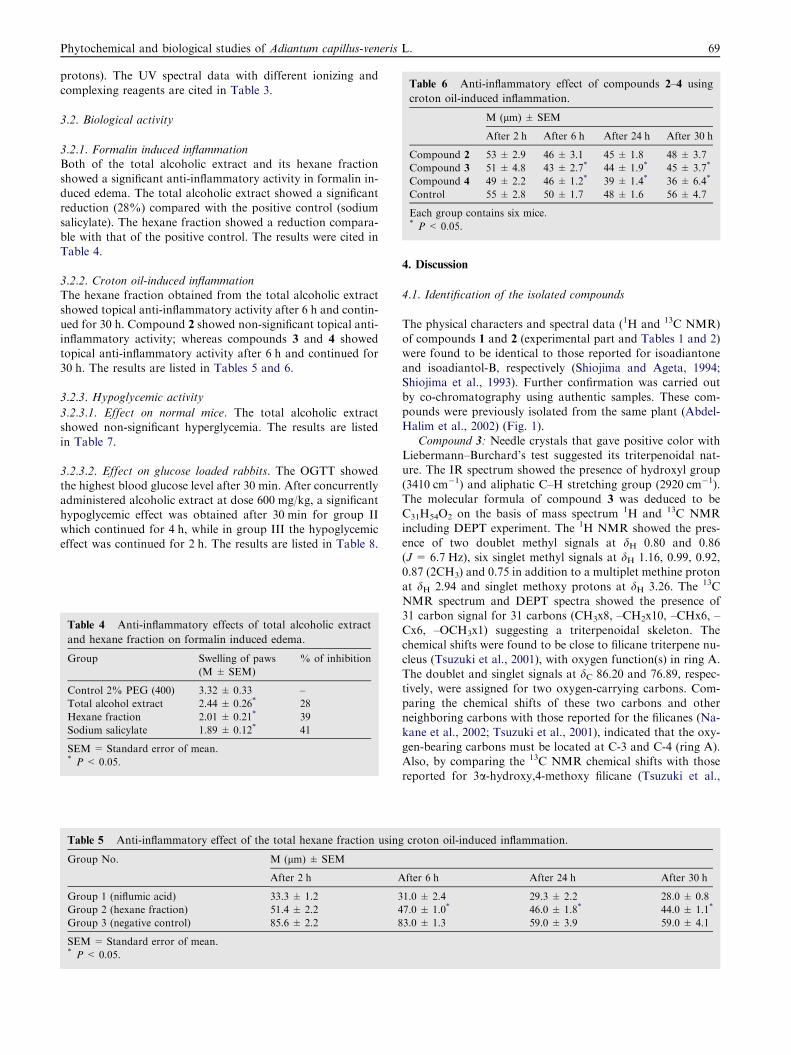
Table 6 Anti-inflammatory effect of compounds 2–4 using
croton oil-induced inflammation.
M (lm) ± SEM
After 2 h After 6 h After 24 h After 30 h
Compound 2 53 ± 2.9 46 ± 3.1 45 ± 1.8 48 ± 3.7
Compound 3 51 ± 4.8 43 ± 2.7* 44 ± 1.9* 45 ± 3.7*
Compound 4 49 ± 2.2 46 ± 1.2* 39 ± 1.4* 36 ± 6.4*
Control 55 ± 2.8 50 ± 1.7 48 ± 1.6 56 ± 4.7
Each group contains six mice.* P< 0.05.
Phytochemical and biological studies of Adiantum capillus-veneris L. 69
protons). The UV spectral data with different ionizing and
complexing reagents are cited in Table 3.
3.2. Biological activity
3.2.1. Formalin induced inflammationBoth of the total alcoholic extract and its hexane fraction
showed a significant anti-inflammatory activity in formalin in-duced edema. The total alcoholic extract showed a significantreduction (28%) compared with the positive control (sodium
salicylate). The hexane fraction showed a reduction compara-ble with that of the positive control. The results were cited inTable 4.
3.2.2. Croton oil-induced inflammationThe hexane fraction obtained from the total alcoholic extract
showed topical anti-inflammatory activity after 6 h and contin-ued for 30 h. Compound 2 showed non-significant topical anti-inflammatory activity; whereas compounds 3 and 4 showedtopical anti-inflammatory activity after 6 h and continued for
30 h. The results are listed in Tables 5 and 6.
3.2.3. Hypoglycemic activity
3.2.3.1. Effect on normal mice. The total alcoholic extractshowed non-significant hyperglycemia. The results are listed
in Table 7.
3.2.3.2. Effect on glucose loaded rabbits. The OGTT showed
the highest blood glucose level after 30 min. After concurrentlyadministered alcoholic extract at dose 600 mg/kg, a significanthypoglycemic effect was obtained after 30 min for group IIwhich continued for 4 h, while in group III the hypoglycemic
effect was continued for 2 h. The results are listed in Table 8.
Table 4 Anti-inflammatory effects of total alcoholic extract
and hexane fraction on formalin induced edema.
Group Swelling of paws
(M± SEM)
% of inhibition
Control 2% PEG (400) 3.32 ± 0.33 –
Total alcohol extract 2.44 ± 0.26* 28
Hexane fraction 2.01 ± 0.21* 39
Sodium salicylate 1.89 ± 0.12* 41
SEM= Standard error of mean.* P < 0.05.
Table 5 Anti-inflammatory effect of the total hexane fraction using
Group No. M (lm) ± SEM
After 2 h A
Group 1 (niflumic acid) 33.3 ± 1.2 3
Group 2 (hexane fraction) 51.4 ± 2.2 4
Group 3 (negative control) 85.6 ± 2.2 8
SEM= Standard error of mean.* P < 0.05.
4. Discussion
4.1. Identification of the isolated compounds
The physical characters and spectral data (1H and 13C NMR)
of compounds 1 and 2 (experimental part and Tables 1 and 2)were found to be identical to those reported for isoadiantoneand isoadiantol-B, respectively (Shiojima and Ageta, 1994;Shiojima et al., 1993). Further confirmation was carried out
by co-chromatography using authentic samples. These com-pounds were previously isolated from the same plant (Abdel-Halim et al., 2002) (Fig. 1).
Compound 3: Needle crystals that gave positive color withLiebermann–Burchard’s test suggested its triterpenoidal nat-ure. The IR spectrum showed the presence of hydroxyl group
(3410 cm�1) and aliphatic C–H stretching group (2920 cm�1).The molecular formula of compound 3 was deduced to beC31H54O2 on the basis of mass spectrum 1H and 13C NMR
including DEPT experiment. The 1H NMR showed the pres-ence of two doublet methyl signals at dH 0.80 and 0.86(J= 6.7 Hz), six singlet methyl signals at dH 1.16, 0.99, 0.92,0.87 (2CH3) and 0.75 in addition to a multiplet methine proton
at dH 2.94 and singlet methoxy protons at dH 3.26. The 13CNMR spectrum and DEPT spectra showed the presence of31 carbon signal for 31 carbons (CH3x8, –CH2x10, –CHx6, –
Cx6, –OCH3x1) suggesting a triterpenoidal skeleton. Thechemical shifts were found to be close to filicane triterpene nu-cleus (Tsuzuki et al., 2001), with oxygen function(s) in ring A.
The doublet and singlet signals at dC 86.20 and 76.89, respec-tively, were assigned for two oxygen-carrying carbons. Com-paring the chemical shifts of these two carbons and otherneighboring carbons with those reported for the filicanes (Na-
kane et al., 2002; Tsuzuki et al., 2001), indicated that the oxy-gen-bearing carbons must be located at C-3 and C-4 (ring A).Also, by comparing the 13C NMR chemical shifts with those
reported for 3a-hydroxy,4-methoxy filicane (Tsuzuki et al.,
croton oil-induced inflammation.
fter 6 h After 24 h After 30 h
1.0 ± 2.4 29.3 ± 2.2 28.0 ± 0.8
7.0 ± 1.0* 46.0 ± 1.8* 44.0 ± 1.1*
3.0 ± 1.3 59.0 ± 3.9 59.0 ± 4.1
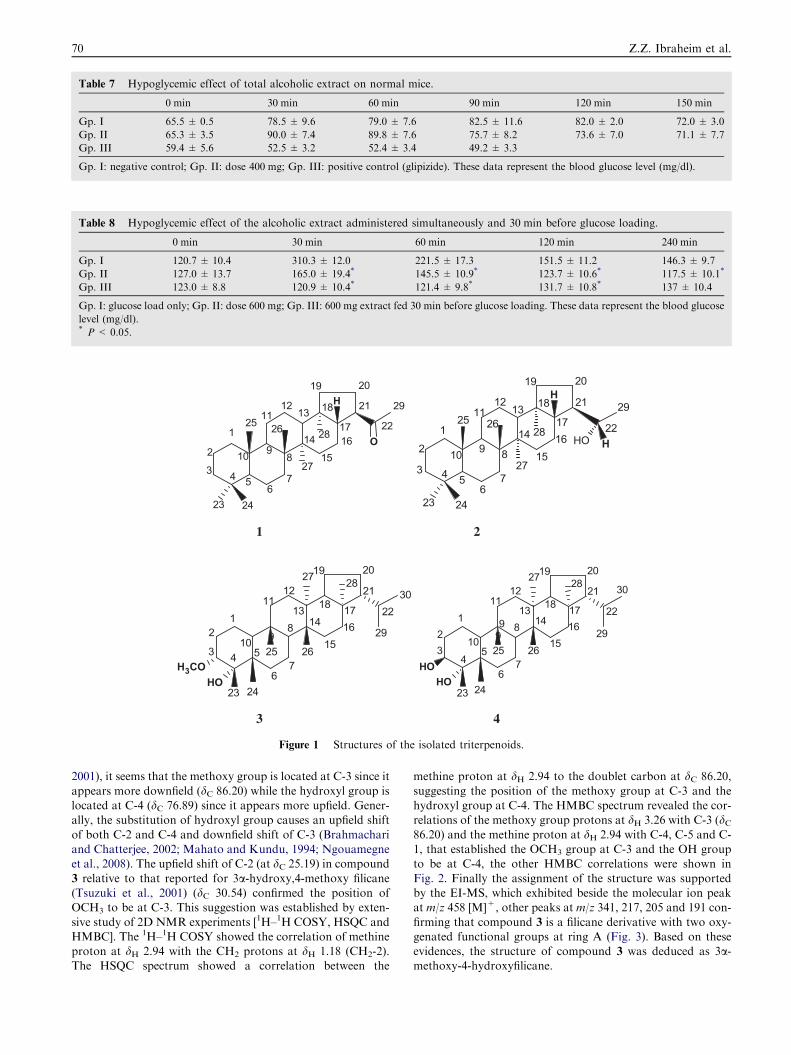
Table 7 Hypoglycemic effect of total alcoholic extract on normal mice.
0 min 30 min 60 min 90 min 120 min 150 min
Gp. I 65.5 ± 0.5 78.5 ± 9.6 79.0 ± 7.6 82.5 ± 11.6 82.0 ± 2.0 72.0 ± 3.0
Gp. II 65.3 ± 3.5 90.0 ± 7.4 89.8 ± 7.6 75.7 ± 8.2 73.6 ± 7.0 71.1 ± 7.7
Gp. III 59.4 ± 5.6 52.5 ± 3.2 52.4 ± 3.4 49.2 ± 3.3
Gp. I: negative control; Gp. II: dose 400 mg; Gp. III: positive control (glipizide). These data represent the blood glucose level (mg/dl).
Table 8 Hypoglycemic effect of the alcoholic extract administered simultaneously and 30 min before glucose loading.
0 min 30 min 60 min 120 min 240 min
Gp. I 120.7 ± 10.4 310.3 ± 12.0 221.5 ± 17.3 151.5 ± 11.2 146.3 ± 9.7
Gp. II 127.0 ± 13.7 165.0 ± 19.4* 145.5 ± 10.9* 123.7 ± 10.6* 117.5 ± 10.1*
Gp. III 123.0 ± 8.8 120.9 ± 10.4* 121.4 ± 9.8* 131.7 ± 10.8* 137 ± 10.4
Gp. I: glucose load only; Gp. II: dose 600 mg; Gp. III: 600 mg extract fed 30 min before glucose loading. These data represent the blood glucose
level (mg/dl).* P< 0.05.
H
O1
35 7
6
910
1112
13
1516
19 20
21
22
2925
27
2817
18
23 24
26
82
4
141
35 7
6
910
1112
13
1516
19 20
21
22
2925
27
28
H
HOH17
18
23 24
26
82
4
14
H3COOH
1
3 57
6
910
1112
13
1516
19 20
21
22
29
25
27 28
1718
23 24
26
8
30
2
4
14
OHOH
1
3 57
6
910
1112
13
1516
19 20
21
22
2925
27 28
1718
23 24
26
8
30
92
4
14
1 2
3 4
Figure 1 Structures of the isolated triterpenoids.
70 Z.Z. Ibraheim et al.
2001), it seems that the methoxy group is located at C-3 since it
appears more downfield (dC 86.20) while the hydroxyl group islocated at C-4 (dC 76.89) since it appears more upfield. Gener-ally, the substitution of hydroxyl group causes an upfield shift
of both C-2 and C-4 and downfield shift of C-3 (Brahmachariand Chatterjee, 2002; Mahato and Kundu, 1994; Ngouamegneet al., 2008). The upfield shift of C-2 (at dC 25.19) in compound
3 relative to that reported for 3a-hydroxy,4-methoxy filicane(Tsuzuki et al., 2001) (dC 30.54) confirmed the position ofOCH3 to be at C-3. This suggestion was established by exten-
sive study of 2D NMR experiments [1H–1H COSY, HSQC andHMBC]. The 1H–1H COSY showed the correlation of methineproton at dH 2.94 with the CH2 protons at dH 1.18 (CH2-2).The HSQC spectrum showed a correlation between the
methine proton at dH 2.94 to the doublet carbon at dC 86.20,
suggesting the position of the methoxy group at C-3 and thehydroxyl group at C-4. The HMBC spectrum revealed the cor-relations of the methoxy group protons at dH 3.26 with C-3 (dC86.20) and the methine proton at dH 2.94 with C-4, C-5 and C-1, that established the OCH3 group at C-3 and the OH groupto be at C-4, the other HMBC correlations were shown in
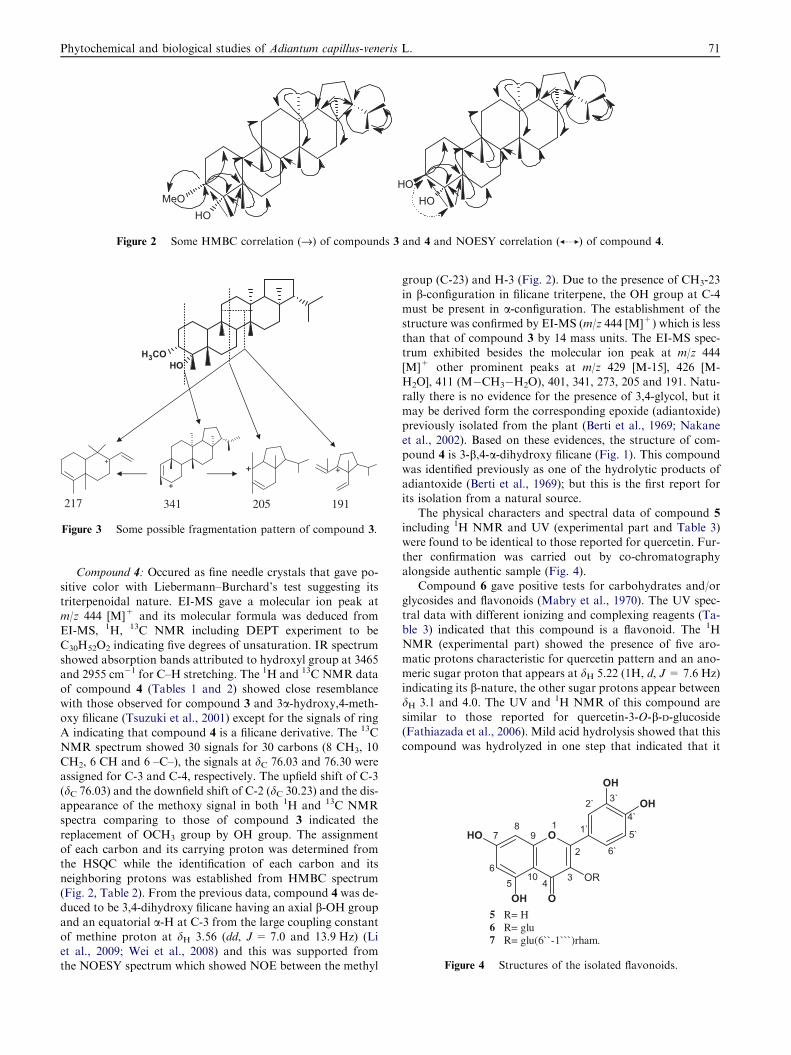
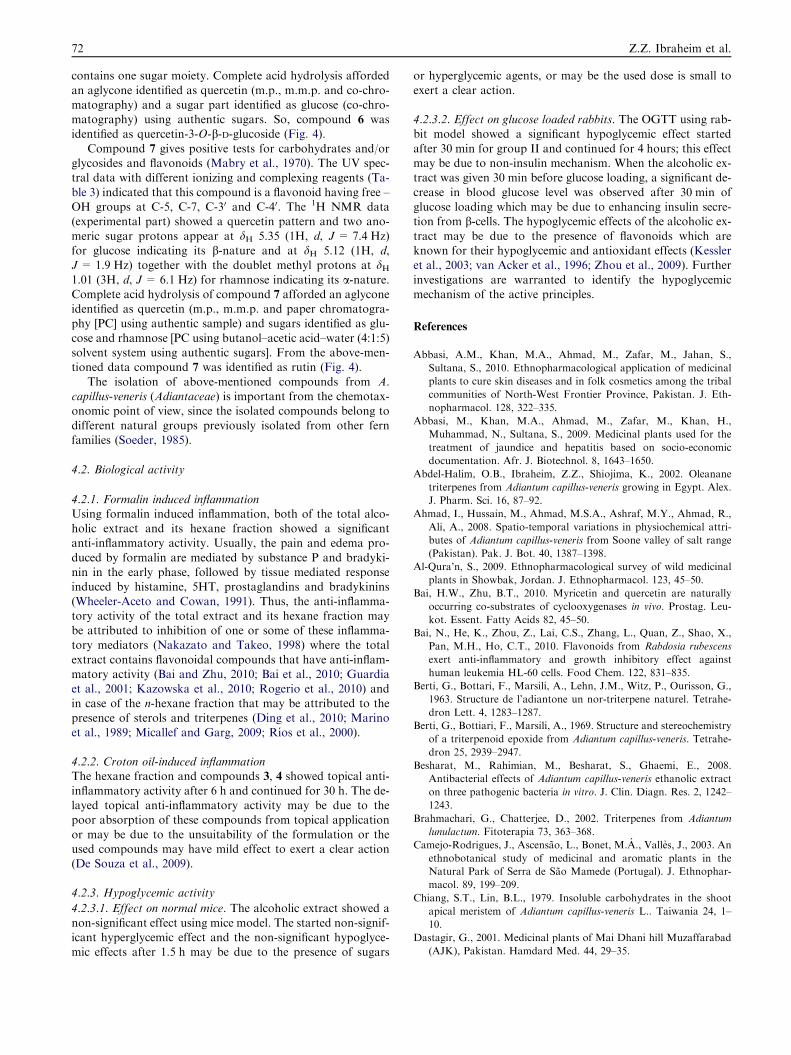
Fig. 2. Finally the assignment of the structure was supportedby the EI-MS, which exhibited beside the molecular ion peakat m/z 458 [M]+, other peaks at m/z 341, 217, 205 and 191 con-
firming that compound 3 is a filicane derivative with two oxy-genated functional groups at ring A (Fig. 3). Based on theseevidences, the structure of compound 3 was deduced as 3a-methoxy-4-hydroxyfilicane.
MeOHO
OHHO
Figure 2 Some HMBC correlation (fi) of compounds 3 and 4 and NOESY correlation ( ) of compound 4.
H3COOH
+
+
+ +
217 341 205 191
Figure 3 Some possible fragmentation pattern of compound 3.
OOH
OH O
OH
OH
OR
2
3456
78
96`
5`
4`
3`2`
1`
10
1
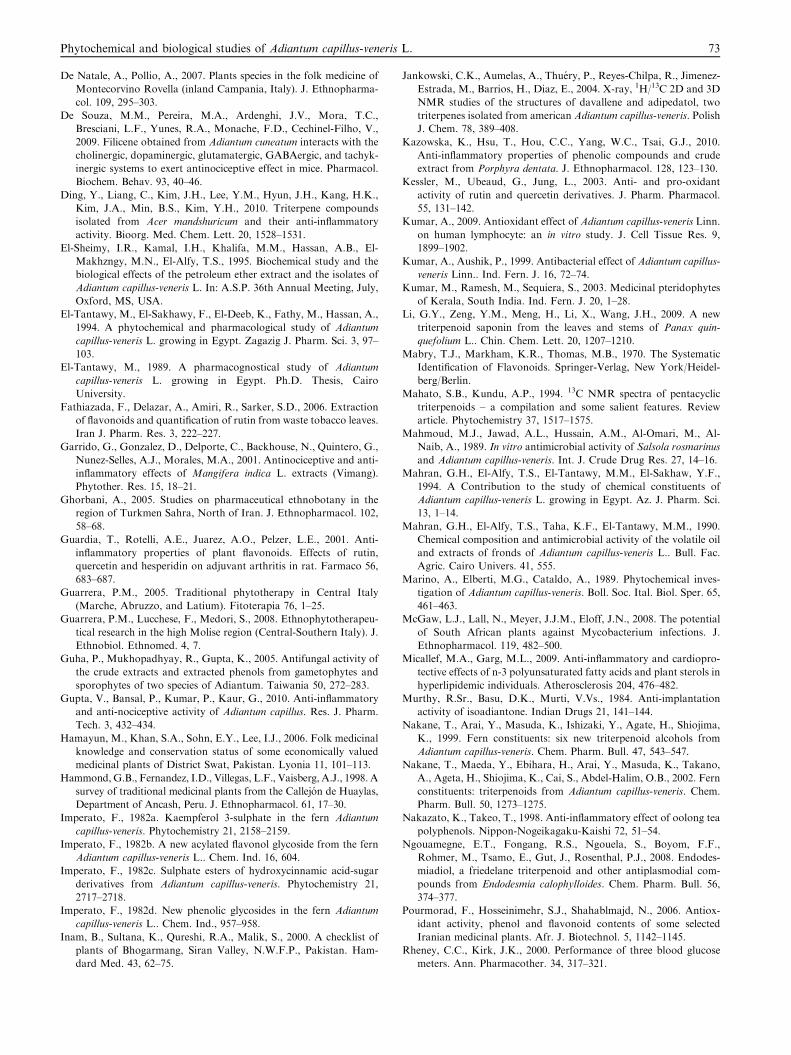
5 R= H6 R= glu7 R= glu(6``-1```)rham.
Figure 4 Structures of the isolated flavonoids.
Phytochemical and biological studies of Adiantum capillus-veneris L. 71
Compound 4: Occured as fine needle crystals that gave po-
sitive color with Liebermann–Burchard’s test suggesting itstriterpenoidal nature. EI-MS gave a molecular ion peak atm/z 444 [M]+ and its molecular formula was deduced fromEI-MS, 1H, 13C NMR including DEPT experiment to be
C30H52O2 indicating five degrees of unsaturation. IR spectrumshowed absorption bands attributed to hydroxyl group at 3465and 2955 cm�1 for C–H stretching. The 1H and 13C NMR data
of compound 4 (Tables 1 and 2) showed close resemblancewith those observed for compound 3 and 3a-hydroxy,4-meth-oxy filicane (Tsuzuki et al., 2001) except for the signals of ring
A indicating that compound 4 is a filicane derivative. The 13CNMR spectrum showed 30 signals for 30 carbons (8 CH3, 10CH2, 6 CH and 6 –C–), the signals at dC 76.03 and 76.30 wereassigned for C-3 and C-4, respectively. The upfield shift of C-3
(dC 76.03) and the downfield shift of C-2 (dC 30.23) and the dis-appearance of the methoxy signal in both 1H and 13C NMRspectra comparing to those of compound 3 indicated the
replacement of OCH3 group by OH group. The assignmentof each carbon and its carrying proton was determined fromthe HSQC while the identification of each carbon and its
neighboring protons was established from HMBC spectrum(Fig. 2, Table 2). From the previous data, compound 4 was de-duced to be 3,4-dihydroxy filicane having an axial b-OH group
and an equatorial a-H at C-3 from the large coupling constantof methine proton at dH 3.56 (dd, J = 7.0 and 13.9 Hz) (Liet al., 2009; Wei et al., 2008) and this was supported fromthe NOESY spectrum which showed NOE between the methyl
group (C-23) and H-3 (Fig. 2). Due to the presence of CH3-23in b-configuration in filicane triterpene, the OH group at C-4must be present in a-configuration. The establishment of the
structure was confirmed by EI-MS (m/z 444 [M]+) which is lessthan that of compound 3 by 14 mass units. The EI-MS spec-trum exhibited besides the molecular ion peak at m/z 444
[M]+ other prominent peaks at m/z 429 [M-15], 426 [M-H2O], 411 (M�CH3�H2O), 401, 341, 273, 205 and 191. Natu-rally there is no evidence for the presence of 3,4-glycol, but it
may be derived form the corresponding epoxide (adiantoxide)previously isolated from the plant (Berti et al., 1969; Nakaneet al., 2002). Based on these evidences, the structure of com-pound 4 is 3-b,4-a-dihydroxy filicane (Fig. 1). This compound
was identified previously as one of the hydrolytic products ofadiantoxide (Berti et al., 1969); but this is the first report forits isolation from a natural source.
The physical characters and spectral data of compound 5
including 1H NMR and UV (experimental part and Table 3)were found to be identical to those reported for quercetin. Fur-
ther confirmation was carried out by co-chromatographyalongside authentic sample (Fig. 4).
Compound 6 gave positive tests for carbohydrates and/or
glycosides and flavonoids (Mabry et al., 1970). The UV spec-tral data with different ionizing and complexing reagents (Ta-ble 3) indicated that this compound is a flavonoid. The 1HNMR (experimental part) showed the presence of five aro-
matic protons characteristic for quercetin pattern and an ano-meric sugar proton that appears at dH 5.22 (1H, d, J= 7.6 Hz)indicating its b-nature, the other sugar protons appear betweendH 3.1 and 4.0. The UV and 1H NMR of this compound aresimilar to those reported for quercetin-3-O-b-D-glucoside(Fathiazada et al., 2006). Mild acid hydrolysis showed that this
compound was hydrolyzed in one step that indicated that it
72 Z.Z. Ibraheim et al.
contains one sugar moiety. Complete acid hydrolysis afforded
an aglycone identified as quercetin (m.p., m.m.p. and co-chro-matography) and a sugar part identified as glucose (co-chro-matography) using authentic sugars. So, compound 6 wasidentified as quercetin-3-O-b-D-glucoside (Fig. 4).
Compound 7 gives positive tests for carbohydrates and/orglycosides and flavonoids (Mabry et al., 1970). The UV spec-tral data with different ionizing and complexing reagents (Ta-
ble 3) indicated that this compound is a flavonoid having free –OH groups at C-5, C-7, C-30 and C-40. The 1H NMR data(experimental part) showed a quercetin pattern and two ano-
meric sugar protons appear at dH 5.35 (1H, d, J = 7.4 Hz)for glucose indicating its b-nature and at dH 5.12 (1H, d,J= 1.9 Hz) together with the doublet methyl protons at dH1.01 (3H, d, J= 6.1 Hz) for rhamnose indicating its a-nature.Complete acid hydrolysis of compound 7 afforded an aglyconeidentified as quercetin (m.p., m.m.p. and paper chromatogra-phy [PC] using authentic sample) and sugars identified as glu-
cose and rhamnose [PC using butanol–acetic acid–water (4:1:5)solvent system using authentic sugars]. From the above-men-tioned data compound 7 was identified as rutin (Fig. 4).
The isolation of above-mentioned compounds from A.capillus-veneris (Adiantaceae) is important from the chemotax-onomic point of view, since the isolated compounds belong to
different natural groups previously isolated from other fernfamilies (Soeder, 1985).
4.2. Biological activity
4.2.1. Formalin induced inflammationUsing formalin induced inflammation, both of the total alco-holic extract and its hexane fraction showed a significantanti-inflammatory activity. Usually, the pain and edema pro-
duced by formalin are mediated by substance P and bradyki-nin in the early phase, followed by tissue mediated responseinduced by histamine, 5HT, prostaglandins and bradykinins
(Wheeler-Aceto and Cowan, 1991). Thus, the anti-inflamma-tory activity of the total extract and its hexane fraction maybe attributed to inhibition of one or some of these inflamma-tory mediators (Nakazato and Takeo, 1998) where the total
extract contains flavonoidal compounds that have anti-inflam-matory activity (Bai and Zhu, 2010; Bai et al., 2010; Guardiaet al., 2001; Kazowska et al., 2010; Rogerio et al., 2010) and
in case of the n-hexane fraction that may be attributed to thepresence of sterols and triterpenes (Ding et al., 2010; Marinoet al., 1989; Micallef and Garg, 2009; Rıos et al., 2000).
4.2.2. Croton oil-induced inflammationThe hexane fraction and compounds 3, 4 showed topical anti-
inflammatory activity after 6 h and continued for 30 h. The de-layed topical anti-inflammatory activity may be due to thepoor absorption of these compounds from topical application
or may be due to the unsuitability of the formulation or theused compounds may have mild effect to exert a clear action(De Souza et al., 2009).
4.2.3. Hypoglycemic activity
4.2.3.1. Effect on normal mice. The alcoholic extract showed a
non-significant effect using mice model. The started non-signif-icant hyperglycemic effect and the non-significant hypoglyce-mic effects after 1.5 h may be due to the presence of sugars
or hyperglycemic agents, or may be the used dose is small to
exert a clear action.
4.2.3.2. Effect on glucose loaded rabbits. The OGTT using rab-bit model showed a significant hypoglycemic effect started
after 30 min for group II and continued for 4 hours; this effectmay be due to non-insulin mechanism. When the alcoholic ex-tract was given 30 min before glucose loading, a significant de-
crease in blood glucose level was observed after 30 min ofglucose loading which may be due to enhancing insulin secre-tion from b-cells. The hypoglycemic effects of the alcoholic ex-
tract may be due to the presence of flavonoids which areknown for their hypoglycemic and antioxidant effects (Kessleret al., 2003; van Acker et al., 1996; Zhou et al., 2009). Further
investigations are warranted to identify the hypoglycemicmechanism of the active principles.
References
Abbasi, A.M., Khan, M.A., Ahmad, M., Zafar, M., Jahan, S.,
Sultana, S., 2010. Ethnopharmacological application of medicinal
plants to cure skin diseases and in folk cosmetics among the tribal
communities of North-West Frontier Province, Pakistan. J. Eth-
nopharmacol. 128, 322–335.
Abbasi, M., Khan, M.A., Ahmad, M., Zafar, M., Khan, H.,
Muhammad, N., Sultana, S., 2009. Medicinal plants used for the
treatment of jaundice and hepatitis based on socio-economic
documentation. Afr. J. Biotechnol. 8, 1643–1650.
Abdel-Halim, O.B., Ibraheim, Z.Z., Shiojima, K., 2002. Oleanane
triterpenes from Adiantum capillus-veneris growing in Egypt. Alex.
J. Pharm. Sci. 16, 87–92.
Ahmad, I., Hussain, M., Ahmad, M.S.A., Ashraf, M.Y., Ahmad, R.,
Ali, A., 2008. Spatio-temporal variations in physiochemical attri-
butes of Adiantum capillus-veneris from Soone valley of salt range
(Pakistan). Pak. J. Bot. 40, 1387–1398.
Al-Qura’n, S., 2009. Ethnopharmacological survey of wild medicinal
plants in Showbak, Jordan. J. Ethnopharmacol. 123, 45–50.
Bai, H.W., Zhu, B.T., 2010. Myricetin and quercetin are naturally
occurring co-substrates of cyclooxygenases in vivo. Prostag. Leu-
kot. Essent. Fatty Acids 82, 45–50.
Bai, N., He, K., Zhou, Z., Lai, C.S., Zhang, L., Quan, Z., Shao, X.,
Pan, M.H., Ho, C.T., 2010. Flavonoids from Rabdosia rubescens
exert anti-inflammatory and growth inhibitory effect against
human leukemia HL-60 cells. Food Chem. 122, 831–835.
Berti, G., Bottari, F., Marsili, A., Lehn, J.M., Witz, P., Ourisson, G.,
1963. Structure de l’adiantone un nor-triterpene naturel. Tetrahe-
dron Lett. 4, 1283–1287.
Berti, G., Bottiari, F., Marsili, A., 1969. Structure and stereochemistry
of a triterpenoid epoxide from Adiantum capillus-veneris. Tetrahe-
dron 25, 2939–2947.
Besharat, M., Rahimian, M., Besharat, S., Ghaemi, E., 2008.
Antibacterial effects of Adiantum capillus-veneris ethanolic extract
on three pathogenic bacteria in vitro. J. Clin. Diagn. Res. 2, 1242–
1243.
Brahmachari, G., Chatterjee, D., 2002. Triterpenes from Adiantum
lunulactum. Fitoterapia 73, 363–368.
Camejo-Rodrigues, J., Ascensao, L., Bonet, M.A., Valles, J., 2003. An
ethnobotanical study of medicinal and aromatic plants in the
Natural Park of Serra de Sao Mamede (Portugal). J. Ethnophar-
macol. 89, 199–209.
Chiang, S.T., Lin, B.L., 1979. Insoluble carbohydrates in the shoot
apical meristem of Adiantum capillus-veneris L.. Taiwania 24, 1–
10.
Dastagir, G., 2001. Medicinal plants of Mai Dhani hill Muzaffarabad
(AJK), Pakistan. Hamdard Med. 44, 29–35.
Phytochemical and biological studies of Adiantum capillus-veneris L. 73
De Natale, A., Pollio, A., 2007. Plants species in the folk medicine of
Montecorvino Rovella (inland Campania, Italy). J. Ethnopharma-
col. 109, 295–303.
De Souza, M.M., Pereira, M.A., Ardenghi, J.V., Mora, T.C.,
Bresciani, L.F., Yunes, R.A., Monache, F.D., Cechinel-Filho, V.,
2009. Filicene obtained from Adiantum cuneatum interacts with the
cholinergic, dopaminergic, glutamatergic, GABAergic, and tachyk-
inergic systems to exert antinociceptive effect in mice. Pharmacol.
Biochem. Behav. 93, 40–46.
Ding, Y., Liang, C., Kim, J.H., Lee, Y.M., Hyun, J.H., Kang, H.K.,
Kim, J.A., Min, B.S., Kim, Y.H., 2010. Triterpene compounds
isolated from Acer mandshuricum and their anti-inflammatory
activity. Bioorg. Med. Chem. Lett. 20, 1528–1531.
El-Sheimy, I.R., Kamal, I.H., Khalifa, M.M., Hassan, A.B., El-
Makhzngy, M.N., El-Alfy, T.S., 1995. Biochemical study and the
biological effects of the petroleum ether extract and the isolates of
Adiantum capillus-veneris L. In: A.S.P. 36th Annual Meeting, July,
Oxford, MS, USA.
El-Tantawy, M., El-Sakhawy, F., El-Deeb, K., Fathy, M., Hassan, A.,
1994. A phytochemical and pharmacological study of Adiantum
capillus-veneris L. growing in Egypt. Zagazig J. Pharm. Sci. 3, 97–
103.
El-Tantawy, M., 1989. A pharmacognostical study of Adiantum
capillus-veneris L. growing in Egypt. Ph.D. Thesis, Cairo
University.
Fathiazada, F., Delazar, A., Amiri, R., Sarker, S.D., 2006. Extraction
of flavonoids and quantification of rutin from waste tobacco leaves.
Iran J. Pharm. Res. 3, 222–227.
Garrido, G., Gonzalez, D., Delporte, C., Backhouse, N., Quintero, G.,
Nunez-Selles, A.J., Morales, M.A., 2001. Antinociceptive and anti-
inflammatory effects of Mangifera indica L. extracts (Vimang).
Phytother. Res. 15, 18–21.
Ghorbani, A., 2005. Studies on pharmaceutical ethnobotany in the
region of Turkmen Sahra, North of Iran. J. Ethnopharmacol. 102,
58–68.
Guardia, T., Rotelli, A.E., Juarez, A.O., Pelzer, L.E., 2001. Anti-
inflammatory properties of plant flavonoids. Effects of rutin,
quercetin and hesperidin on adjuvant arthritis in rat. Farmaco 56,
683–687.
Guarrera, P.M., 2005. Traditional phytotherapy in Central Italy
(Marche, Abruzzo, and Latium). Fitoterapia 76, 1–25.
Guarrera, P.M., Lucchese, F., Medori, S., 2008. Ethnophytotherapeu-
tical research in the high Molise region (Central-Southern Italy). J.
Ethnobiol. Ethnomed. 4, 7.
Guha, P., Mukhopadhyay, R., Gupta, K., 2005. Antifungal activity of
the crude extracts and extracted phenols from gametophytes and
sporophytes of two species of Adiantum. Taiwania 50, 272–283.
Gupta, V., Bansal, P., Kumar, P., Kaur, G., 2010. Anti-inflammatory
and anti-nociceptive activity of Adiantum capillus. Res. J. Pharm.
Tech. 3, 432–434.
Hamayun, M., Khan, S.A., Sohn, E.Y., Lee, I.J., 2006. Folk medicinal
knowledge and conservation status of some economically valued
medicinal plants of District Swat, Pakistan. Lyonia 11, 101–113.
Hammond,G.B., Fernandez, I.D., Villegas, L.F., Vaisberg, A.J., 1998. A
survey of traditional medicinal plants from the Callejon de Huaylas,
Department of Ancash, Peru. J. Ethnopharmacol. 61, 17–30.
Imperato, F., 1982a. Kaempferol 3-sulphate in the fern Adiantum
capillus-veneris. Phytochemistry 21, 2158–2159.
Imperato, F., 1982b. A new acylated flavonol glycoside from the fern
Adiantum capillus-veneris L.. Chem. Ind. 16, 604.
Imperato, F., 1982c. Sulphate esters of hydroxycinnamic acid-sugar
derivatives from Adiantum capillus-veneris. Phytochemistry 21,
2717–2718.
Imperato, F., 1982d. New phenolic glycosides in the fern Adiantum
capillus-veneris L.. Chem. Ind., 957–958.
Inam, B., Sultana, K., Qureshi, R.A., Malik, S., 2000. A checklist of
plants of Bhogarmang, Siran Valley, N.W.F.P., Pakistan. Ham-
dard Med. 43, 62–75.
Jankowski, C.K., Aumelas, A., Thuery, P., Reyes-Chilpa, R., Jimenez-
Estrada, M., Barrios, H., Diaz, E., 2004. X-ray, 1H/13C 2D and 3D
NMR studies of the structures of davallene and adipedatol, two
triterpenes isolated from american Adiantum capillus-veneris. Polish
J. Chem. 78, 389–408.
Kazowska, K., Hsu, T., Hou, C.C., Yang, W.C., Tsai, G.J., 2010.
Anti-inflammatory properties of phenolic compounds and crude
extract from Porphyra dentata. J. Ethnopharmacol. 128, 123–130.
Kessler, M., Ubeaud, G., Jung, L., 2003. Anti- and pro-oxidant
activity of rutin and quercetin derivatives. J. Pharm. Pharmacol.
55, 131–142.
Kumar, A., 2009. Antioxidant effect of Adiantum capillus-veneris Linn.
on human lymphocyte: an in vitro study. J. Cell Tissue Res. 9,
1899–1902.
Kumar, A., Aushik, P., 1999. Antibacterial effect of Adiantum capillus-
veneris Linn.. Ind. Fern. J. 16, 72–74.
Kumar, M., Ramesh, M., Sequiera, S., 2003. Medicinal pteridophytes
of Kerala, South India. Ind. Fern. J. 20, 1–28.
Li, G.Y., Zeng, Y.M., Meng, H., Li, X., Wang, J.H., 2009. A new
triterpenoid saponin from the leaves and stems of Panax quin-
quefolium L.. Chin. Chem. Lett. 20, 1207–1210.
Mabry, T.J., Markham, K.R., Thomas, M.B., 1970. The Systematic
Identification of Flavonoids. Springer-Verlag, New York/Heidel-
berg/Berlin.
Mahato, S.B., Kundu, A.P., 1994. 13C NMR spectra of pentacyclic
triterpenoids – a compilation and some salient features. Review
article. Phytochemistry 37, 1517–1575.
Mahmoud, M.J., Jawad, A.L., Hussain, A.M., Al-Omari, M., Al-
Naib, A., 1989. In vitro antimicrobial activity of Salsola rosmarinus
and Adiantum capillus-veneris. Int. J. Crude Drug Res. 27, 14–16.
Mahran, G.H., El-Alfy, T.S., El-Tantawy, M.M., El-Sakhaw, Y.F.,
1994. A Contribution to the study of chemical constituents of
Adiantum capillus-veneris L. growing in Egypt. Az. J. Pharm. Sci.
13, 1–14.
Mahran, G.H., El-Alfy, T.S., Taha, K.F., El-Tantawy, M.M., 1990.
Chemical composition and antimicrobial activity of the volatile oil
and extracts of fronds of Adiantum capillus-veneris L.. Bull. Fac.
Agric. Cairo Univers. 41, 555.
Marino, A., Elberti, M.G., Cataldo, A., 1989. Phytochemical inves-
tigation of Adiantum capillus-veneris. Boll. Soc. Ital. Biol. Sper. 65,
461–463.
McGaw, L.J., Lall, N., Meyer, J.J.M., Eloff, J.N., 2008. The potential
of South African plants against Mycobacterium infections. J.
Ethnopharmacol. 119, 482–500.
Micallef, M.A., Garg, M.L., 2009. Anti-inflammatory and cardiopro-
tective effects of n-3 polyunsaturated fatty acids and plant sterols in
hyperlipidemic individuals. Atherosclerosis 204, 476–482.
Murthy, R.Sr., Basu, D.K., Murti, V.Vs., 1984. Anti-implantation
activity of isoadiantone. Indian Drugs 21, 141–144.
Nakane, T., Arai, Y., Masuda, K., Ishizaki, Y., Agate, H., Shiojima,
K., 1999. Fern constituents: six new triterpenoid alcohols from
Adiantum capillus-veneris. Chem. Pharm. Bull. 47, 543–547.
Nakane, T., Maeda, Y., Ebihara, H., Arai, Y., Masuda, K., Takano,
A., Ageta, H., Shiojima, K., Cai, S., Abdel-Halim, O.B., 2002. Fern
constituents: triterpenoids from Adiantum capillus-veneris. Chem.
Pharm. Bull. 50, 1273–1275.
Nakazato, K., Takeo, T., 1998. Anti-inflammatory effect of oolong tea
polyphenols. Nippon-Nogeikagaku-Kaishi 72, 51–54.
Ngouamegne, E.T., Fongang, R.S., Ngouela, S., Boyom, F.F.,
Rohmer, M., Tsamo, E., Gut, J., Rosenthal, P.J., 2008. Endodes-
miadiol, a friedelane triterpenoid and other antiplasmodial com-
pounds from Endodesmia calophylloides. Chem. Pharm. Bull. 56,
374–377.
Pourmorad, F., Hosseinimehr, S.J., Shahablmajd, N., 2006. Antiox-
idant activity, phenol and flavonoid contents of some selected
Iranian medicinal plants. Afr. J. Biotechnol. 5, 1142–1145.
Rheney, C.C., Kirk, J.K., 2000. Performance of three blood glucose
meters. Ann. Pharmacother. 34, 317–321.
74 Z.Z. Ibraheim et al.
Rıos, J.L., Recio, M.C., Manez, S., Giner, R.M., 2000. Natural
triterpenoids as anti-inflammatory agents. In: Atta-Ur-Rahman
(Ed.), Studies in Natural Products Chemistry, Bioactive Natural
Products, vol. 22, part C. Elsevier Science Publishers, Amsterdam,
Netherlands, pp. 93–143.
Rogerio, A.P., Dora, C.L., Andrade, E.L., Chaves, J.S., Silva, L.F.,
Lemos-Senna, E., Calixto, J.B., 2010. Anti-inflammatoryeffect of
quercetin-loaded microemulsion in the airways allergic inflamma-
tory model in mice. Pharmacol. Res. 61, 288–297.
Shinozaki, J., Shibuya, M., Masuda, K., Ebizuka, Y., 2008. Squalene
cyclase and oxidosqualene cyclase from a fern. FEBS Lett. 582,
310–318.
Shinwari, M.I., Khan, M.A., 2000. Folk use of medicinal herbs of
Margalla Hills National Park, Islamabad. J. Ethnopharmacol. 69,
45–56.
Shiojima, K., Ageta, H., 1994. Fern constituents: triterpenoids isolated
from the leaves of Adiantum edgeworthii. Structures of 19a-hydroxyadiantone and fern-9(11)-en-25-oic acid. Chem. Pharm.
Bull. 42, 45–47.
Shiojima, K., Arai, Y., Kasama, T., Ageta, H., 1993. Fern constitu-
ents: triterpenoids isolated from the leaves of Adiantum monochla-
mys. Filicenol A, Filicenol B, Isoadiantol B, Hakonanediol and
Epihakonanediol. Chem. Pharm. Bull. 41, 262–267.
Singh, M., Singh, N., Khare, P.B., Rawat, A.K.S., 2008. Antimicrobial
activity of some important Adiantum species used traditionally in
indigenous systems of medicine. J. Ethnopharmacol. 115, 327–329.
Soeder, R.W., 1985. Fern constituents: including occurrence, chemo-
taxonomy and physiological activity. Bot. Rev. 51, 442–536.
Suleyman, H., Demirezer, L.O., Kuruuzum, A., Banoglu, Z.N., Gocer,
F., Ozbakir, G., Gepdiremen, A., 1999. Antiinflammatory effect of
the aqueous extract from Rumex patientia L. roots. J. Ethnophar-
macol. 65, 141–148.
Tsuzuki, K., Ohashi, A., Arai, Y., Masuda, K., Takano, A., Shiojima,
K., Ageta, H., Cai, S.Q., 2001. Triterpenoids from Adiantum
caudatum. Phytochemistry 58, 363–367.
Tubaro, A., Dri, P., Delbello, G., Zilli, C., Della Loggia, R., 1985. The
croton oil ear test revisited. Agents Actions 17, 347–349.
Uncini Manganelli, R.E., Camangi, F., Tomei, P.E., 2001. Curing
animals with plants: traditional usage in Tuscany (Italy). J.
Ethnopharmacol. 78, 171–191.
Van Acker, S.A.B.E., Van Den Berg, D.J., Tromp, M.N.J.L.,
Griffioen, D.H., Van Bennekom, W.P., Van Der Vijgh, W.J.F.,
Bast, A., 1996. Structural aspects of antioxidant activity of
flavonoids. Free Radic. Biol. Med. 20, 331–342.
Victor, B., Maridass, M., Ramesh, U., Prabhu, J.M.A., 2003.
Antibacterial activity of essential oils from the leaves of Adiantum
capillus-veneris Linn.. Malaysian J. Sci. 22, 65–66.
Wei, Y., Ma, C.M., Chen, D., Hattori, M., 2008. Anti-HIV-1 protease
triterpenoids from Stauntonia obovatifoliola Hayata subsp. inter-
media. Phytochemistry 69, 1875–1879.
Wheeler-Aceto, H., Cowan, A., 1991. Neurogenic and tissue-mediated
components of formalin-induced edema: evidence for supraspinal
regulation. Agents Actions 34, 264–269.
Zaman, A., Prakash, A., Berti, G., Bottari, F., Macchia, B., Marsili,
A., Morelli, L., 1966. A new nortriterpenoid ketol from two
Adiantum species. Tetrahedron Lett., 3943–3947.
Zhou, T., Luo, D., Li, X., Luo, Y., 2009. Hypoglycemic and
hypolipidemic effects of flavonoids from lotus (Nelumbo
nuficera Gaertn) leaf in diabetic mice. J. Med. Plants Res. 3,
290–293.
Top Related
Copyright © 2022 FDOKUMEN

