


Bahasa
Halaman
Hukum


Agricultural and Forest Meteorology 116 (2003) 19–36
Photosynthesis, respiration and conservative carbonuse efficiency of four field grown crops
R. Albrizio, P. Steduto∗CIHEAM-IAMB-Bari, via Ceglie 9, 70010 Valenzano (BA), Italy
Received 3 April 2002; received in revised form 18 November 2002; accepted 16 December 2002
Abstract
The present work aims at testing the hypothesis that carbon use efficiency (CUE) of sunflower, grain sorghum, wheat andchickpea crops, having different photosynthetic pathways (C3, C4) and yield composition (carbohydrates, proteins, lipids),will hold constant over the natural thermal regime occurring during the entire crop cycle in the open field. All crops werewell watered. Sunflower and sorghum had two treatments of nitrogen application, while wheat had only one suitable level ofnitrogen, and chickpea had no nitrogen at all. Canopy temperature, day-time net photosynthesis (P), and night-time respiration(R) were monitored by closed-system canopy chambers, properly automated for continuous measurements. Night-time respi-ration response to temperature and noon-time photosynthesis were measured at leaf scale, as well. Results showed a strictlylinear relationship (i.e. constant CUE) between cumulativeP (
∑P ) and cumulativeR(
∑R) over the entire cycle of sorghum
(slope = 2.28) and wheat (3.35), and up to anthesis of sunflower (2.08) and chickpea (2.83), irrespective of the thermalregimes evolution and nitrogen nutritional levels. The same linearity was maintained when relationships were observed interms of biomass versus
∑R. In sunflower, significant deviation from linearity is observed after anthesis, with a difference
between the two nitrogen treatments. No conclusions could be drawn for post-anthesis chickpea due to the interruption of theexperiment caused by an intense thunderstorm. Leaf-scale respiration responses to temperature were insufficient to explainthe corresponding behaviour at canopy-level.© 2003 Elsevier Science B.V. All rights reserved.
Keywords:Canopy gas-exchange; Carbon balance; CUE;P/R ratio
1. Introduction
Knowledge of crop carbon balance, as a responseof CO2 gain (photosynthesis,P) and CO2 loss (respi-ration,R) to environmental conditions, is fundamentalto the understanding and quantitative assessment ofplant growth, primary productivity of ecosystems andthe impact of climate change on vegetation.
∗ Corresponding author. Tel.:+39-080-4606224;fax: +39-080-4606206.E-mail address:[email protected] (P. Steduto).
Crop respiration has been much less studied, ascompared to photosynthesis, for various reasonssuch as methodological difficulties in measurements(Loomis and Connor, 1992; Amthor and Baldocchi,2001) and conceptual limitations in modelling (Ryan,1991; Choudhury, 2001). Hence, the accuracy of pre-dictions of the carbon balance is largely dependenton the uncertainties associated with the estimationof respiration (Waring et al., 1998; Högberg et al.,2001). Most of these uncertainties, in turn, are relatedto the extrapolation of inferences drawn from lowerhierarchical scale experiments (e.g. short-term and/
0168-1923/03/$ – see front matter © 2003 Elsevier Science B.V. All rights reserved.doi:10.1016/S0168-1923(02)00252-6

20 R. Albrizio, P. Steduto / Agricultural and Forest Meteorology 116 (2003) 19–36
or leaf/plant level) to boundary conditions ofhigher hierarchical scale (e.g. long-term and/orcrop/community level).
A dominant approach to carbon balance modelling,in fact, frames the respiratory responses within thelow-hierarchy “growth-maintenance” paradigm (e.g.Ryan, 1991), where plant respiration is partitionedinto the functional components of construction, main-tenance and ion uptake (Farrar, 1985; Lambers, 1985;Amthor, 1986), with a resultingR response to envi-ronmental conditions considerably different from thecorrespondingP response.
For instance, short-term observations generallyshow that, over normal ranges of plant tempera-tures, respiration is highly sensitive to temperaturewhile photosynthesis is relatively insensitive (Amthor,1989). This observation tacitly implies that respiration(R) and photosynthesis (P) are somehow indepen-dent fluxes, minimising the importance of the energyand substrates provided byP for R of the existingplant structures (Lawlor, 1995; Dewar et al., 1999)and, consequently, overlooking the underlying linksbetweenR and P. Similarly, short-term studies havedemonstrated the strong correlation existing betweenmaintenance respiration and tissue nitrogen content(e.g.Ryan, 1991).
In contrast, long-term whole-plant experiments haveshown a strictly bounded relationship betweenR andP over a wide range of temperatures (Gifford, 1994,1995; Tjoelker et al., 1999) and that the primary im-pact of nitrogen fertilisation is via leaf area growthrather than leaf nitrogen content (e.g.Garcia et al.,1988). This suggests that, at the community level, thestrict link betweenR andP would hold over a reason-able range of temperature and nitrogen availability tothe community.
A strict proportionality betweenR and P wasalso found byByrd et al. (1992)in both ‘C3’ and‘C4’ species, grown under controlled environmentsover a relatively long period and a wide range ofnitrogen levels, indicating that an increase in photo-synthesis, induced by higher nitrogen leaf content,causes a proportional increase in the whole-plantrespiration, irrespective of the CO2 assimilationpathway.
Moreover, a close relationship betweenP and R,often expressed in terms of ratio between net pri-mary production (NPP) and gross primary production
(GPP), has been also reported byWaring et al. (1998)in a forest ecosystem, and byGifford (1995), Tjoelkeret al. (1999)and Cheng et al. (2000)under variableCO2 concentrations during long-term whole-plant ex-periments.
The conservative behaviour of carbon use efficiency(CUE), observed byGifford (1995)induced the sameauthor to propose the constancy of CUE (otherwiseindicated as constant NPP/GPP ratio) as an appro-priate simplification, for higher hierarchical scales, toapproach modelling of respiration (Dewar, 1996) andproductivity predictions (McCree, 1988; Cheng et al.,2000). The advantage would be in the reduced diffi-culty of deriving NPP directly from GPP rather thanfrom carbohydrate allocation (Waring et al., 1998),likely with much smaller errors involved (Landsbergand Waring, 1997).
Therefore, a constant NPP/GPP ratio is viewed as arobust approach to carbon balance modelling (Dewaret al., 1999; Cheng et al., 2000).
The literature review highlights that there is stillplenty of room for further investigations on such atopic, due to the following experimental constraints:reduced number of experiments and observations fo-cusing on CUE determination under variable environ-mental conditions and mostly confined to temperatureand CO2 (Gifford, 1995; Tjoelker et al., 1999; Chenget al., 2000); limited understanding of the mechanismsstabilising the ratio between photosynthesis and res-piration (Gifford, 1995); uncertainty on whether CUEconstancy is species-dependent and invariant underdifferent nutritional status (Luo et al., 1996; Chenget al., 2000); most of the experiments being carried outin artificially controlled environments; the microme-teorological field experiments (e.g.Baldocchi, 1994;Suyker and Verma, 2001; Saigusa et al., 2002) areaffected by methodological limitations (Amthor andBaldocchi, 2001).
Furthermore, the investigation on the conservativebehaviour of CUE assumes special importance whenthe carbon cost required for different biomass com-positions varies largely among species. For instance,in the studies ofCheng et al. (2000)on sunflower,and of Gifford (1995) on wheat, the crop cycle wasinvestigated only up to the vegetative stage leavingit questionable whether CUE remains constant alsoafter forming the reproductive organs. Indeed, theonly long-term experiment reportingR and P over
R. Albrizio, P. Steduto / Agricultural and Forest Meteorology 116 (2003) 19–36 21
the whole cycle of field-grown sunflower (Whitfieldet al., 1989) showed that cumulative dark respirationincreased proportionally to net assimilation only up toanthesis, while it increased more than proportionallythereafter, causing a curvilinear relationship betweenR andP.
An additional and important aspect is the responseof crop CUE while environmental variables such asthermal regimes and nutrient levels, and growth ex-pressions such as plant ontogeny and translocation ofassimilates and nitrogen, change concurrently undernatural out-door conditions. In this regard, little infor-mation exists on the whole seasonal expression of croprespiration of different species grown in open field andunder different nutrient supplies (Biscoe et al., 1975;Rochette et al., 1996).
The objective of this work, then, was to contributeto the consolidation of the paradigm that assumesconstant NPP/GPP ratio by testing the hypothesisthat CUE will remain conservative over the naturalthermal regime occurring during the entire cycle offour field crops (sunflower, grain sorghum, wheat andchickpea) having differenthabitus, climatic and nu-trient requirements, photosynthetic pathway (C3 andC4), and yield composition (carbohydrates, proteins,lipids). The CUE of sunflower and sorghum was alsoinspected under two nitrogen-nutrient levels. Leafrespiration response to temperature (short-term) wasalso investigated to observe possible relationshipswith canopy-level responses.
2. Materials and methods
All trials took place at the experimental field ofthe Mediterranean Agronomic Institute (IAMB) lo-cated in Valenzano (Bari), Southern Italy (41◦03′N,16◦52′E, 72 m a.s.l.) in two subsequent years (1998and 1999). The soil of the experimental field, around0.5–0.6 m deep, is a sand clay-loam and defined asTypic Haploxeralfs Lithic Ruptic-Xerorthenic Xe-rochrepts according to the USDA soil taxonomy. Theclimate is typically Mediterranean, characterised byaverage annual rainfall of about 400–500 mm dis-tributed mainly during autumn and winter, with aver-age maximum temperature reaching 30–35◦C duringsummer time.
2.1. Field trials
Sunflower (Helianthus annuusL.) hybrid “Turbo-sol” and grain sorghum (Sorghum bicolorL. Moench.)hybrid “Ramada” were both sown on 1 April 1998in rows 0.60 and 0.40 m apart, respectively. The cor-responding final plant density was of 5.6 plant m−2
for sunflower, and 16.7 plant m−2 for sorghum, andcomplete emergence occurred 18 days (19 April) and20 days (21 April) after planting (DAP), respectively.Both crops were differentiated in nitrogen supply:treatment N1 was well fertilised with urea, treatmentN0 was the unfertilised control. N1 treatment receivedfive nitrogen applications through the irrigation water(fertigation), with a total amount of 110 kg ha−1 forsunflower and 130 kg ha−1 for sorghum.
Durum wheat (Triticum durumL.) cv. “Appulo”and chickpea (Cicer arietinumL.) cv. “Sultano” weresown on 18 December 1998 and on 2 March 1999,respectively, in rows 0.18 and 0.35 m apart. The cor-responding final plant density was of 255 plant m−2
for wheat and 28 plant m−2 for chickpea, and com-plete emergence occurred on 12 January (25 DAP)and 19 March (17 DAP), respectively. Due to the ex-pected great difficulties in controlling nitrogen in re-lation to water regimes of a winter crop, wheat hadno nitrogen treatment differentiation, but only onenitrogen-fertilisation schedule corresponding to fiveurea applications, with a total amount of 110 kg ha−1.No nitrogen fertilisation was applied to chickpea be-cause of its nitrogen fixation ability.
Each of the four crops was grown in a 2000 m2
plot, fertilised with phosphorus, well irrigated, andmaintained in healthy conditions.
2.2. Canopy CO2 gas-exchange measurements
Canopy CO2 gas-exchanges were measured bycanopy chambers, operating as closed-system, prop-erly automated for day and night monitoring of CO2flux, without any climate control.
The automated system enables the chamber to keepthe top wall closed and airtight during measurementsand to hold it open in between consecutive measure-ments, so that the chamber can continuously standover a canopy minimising the disturbance of the cropenvironment. The basic chamber unit, made of poly-carbonate walls, had a ground surface area of 0.84 m2

22 R. Albrizio, P. Steduto / Agricultural and Forest Meteorology 116 (2003) 19–36
(1.4 m×0.6 m) and a height of 0.5 m, with a total vol-ume of 0.42 m3. More chamber units were mounted ontop of each other to accommodate plant growth. Thetop wall is zip-fastened on one side so that a simplestring can pull up the other side. The alternate mo-tion of pulling and releasing the string (to open andclose the top wall) is run by a simple rotating en-gine, relay-driven by a micrologger (CR10X, Camp-bell Sci., Logan, UT, USA) through an intermediarycircuit.
While taking measurements, the atmosphere insidethe chamber is stirred by four high-speed brush-lessfans (Micronell, Vista California, CA, USA) mountedat the lower side of the chamber (two for each cor-ner of the wall fastening the top cover) and directeddiagonally upward, providing 0.65 m3 min−1 air dis-placement. The infrared gas analyser (IRGA) used forthe CO2 concentration measurements was the Li-6262(Li-Cor Inc., Lincoln, NE, USA), operating in absolutemode. Two fine-wire chromel–constantan thermocou-ples (0.075 mm, Type E, Campbell Sci., Logan, UT,USA) were mounted inside the chamber for air tem-perature measurements (Tin).
The chambers, one for each crop and treatment,were operated automatically using a 12 V 60 Ah carbattery as power supply. A detailed description of thechamber system used in this experimental work andits performance are given inSteduto et al. (2002).
Chamber data acquisition from all sensors startsafter 5 s from closure, at 0.5 s interval, and for 15 s.The measurement is repeated every 15 min for 2–3days, with the chamber continuously standing at thesame location. The CO2 flux, expressed as carbonexchange rate (CER), was calculated by deriving theslopes relating the variation of concentrations to timethrough the quadratic regression method (Wagneret al., 1997), utilising the well-established equationsfor closed-systems (e.g.Ball, 1987) and canopychambers (Steduto et al., 2002).
The point-in-time CER values (every 15 min) wereintegrated over time to obtain daily CER averagedover the 2–3-day period. Such a period represents ameasurement set. After each set, all plants enclosed inthe chamber were sampled for leaf area (by leaf areameter, LI-3000, Li-Cor Inc., Lincoln, NE, USA) andbiomass (by dry weighing) determinations. The cham-ber was moved to a different location for subsequentmeasurement sets at about 7–10-day intervals. CER,
accounting for the number of plants enclosed in thechamber, was differentiated in terms of net photosyn-thesis (P) and dark respiration (R), with P flux calcu-lated during day-time hours (from sunrise to sunset)and R flux calculated during night-time hours (fromsunset to sunrise).
ConcerningP measurements, it should be recog-nised that under sunny days chambers tend to increasethe amount of diffuse radiation within the canopy(Denmead et al., 1993). On the other hand, there is a re-duction of direct-radiation transmittance by the cham-ber walls (Steduto et al., 2002). The net result can bean increasedP during sunny days and no modificationof P during cloudy days (Denmead et al., 1993).
Since CER also includes the CO2 efflux from thesoil (CS), always positive during day and night, theactual fluxes ofP and R should be calculated asCER+ CS and CER− CS, respectively, keeping inmind that the presence of the chamber might alterCS(Lund et al., 1999). From preliminary experiments,though, it was observed that shortly after irrigation,CS was very low, slightly increasing over the fol-lowing couple of days, and generally close to theoperational resolution of the measurement method(≈1–2�mol m−2 s−1). This observation was also re-ported bySteduto (1993)for a maize-cropped field.Since the measurement sets were taken after irrigation,when the gas diffusivity of the soil was minimal, itwas decided to neglect the soil CO2 contribution to theCER measurements and to accept the uncertainty pos-sibly introduced by this variable. To derive cumulativeCO2 fluxes, for the days between measurement sets,Pwas derived using a correlation with intercepted solarradiation, andR was derived using a correlation withbiomass.
Notwithstanding some of the limitations of thecanopy chambers, diurnal measurements of CERshow to be comparable with corresponding measure-ments taken with micrometeorological methods (e.g.Held et al., 1990; Dugas et al., 1991; Steduto et al.,2002), while nocturnal measurements of CER appearto be even more reliable than those taken by eddycovariance method, due to stable atmosphere or inter-mittent eddies occurring during night-time (Amthorand Baldocchi, 2001; Saigusa et al., 2002).
CO2-exchange monitoring started on: 21 May (50DAP, and plants with three pairs of leaves) for sun-flower; 12 June (71 DAP, with 0.45 m high crop) for

R. Albrizio, P. Steduto / Agricultural and Forest Meteorology 116 (2003) 19–36 23
grain sorghum; 29 March (101 DAP, 10 days beforethe flag leaf emission) for wheat; 28 April (57 DAP,with 20–25 cm high plants) for chickpea. They fin-ished on: 19 August (140 DAP, at senescence phase)for sunflower; 9 September (160 DAP, at physiologi-cal maturity) for sorghum; 31 May (164 DAP, at milkmaturity of grains) for wheat; 16 June (106 DAP, atstarting of pod setting) for chickpea. Unfortunately,the chickpea crop cycle was interrupted by a violentthunderstorm with hail at the pod-filling stage. Uponcompletion of the experiment, 10 measurement setswere obtained for sunflower, eight for sorghum, andsix for wheat and chickpea.
Due to the high experimental sophistication andcosts of the gas-exchange system and equipments, notreatment replicates were included in the experimen-tal design, and the measurements within each treat-ment can be considered only as “pseudo-replicates”(Hurlbert, 1984). Since pseudo-replicates are not sta-tistically independent, they yield an inappropriate er-ror term to test the null hypothesis. In other terms,observed significant differences between treatmentsare not legitimate on a pure inferential-statistics basis.Notwithstanding the reduced statistical power, an ap-praisal of the treatments effect is based also on the bi-ological and mechanistic knowledge of the processesinvolved in the system under investigation, and on thevery high accuracy of the CO2 exchange-rates deter-mination, as detected through a wide set of prelimi-nary tests carried out on the canopy chamber beforestarting the experiments (Steduto et al., 2002). More-over, the main objective of this study was to quantifythe carbon balance through CO2 exchange rates, whilecomparison between treatments was only secondary.These justifications were recognised also byLuo et al.(2000), for gas-exchange experiments. The least sig-nificant differences between treatments and regressionslopes were evaluated by the Student’st-test.
On the same days canopy chambers were oper-ated, leaf photosynthetic rates (Al ) were measured byLI-6400 (Li-Cor Inc., Lincoln, NE, USA), in order tocompare photosynthetic responses at leaf and canopyscales.
2.3. Leaf respiration responses to temperature
Leaf respiration response (Rl ) to leaf temperature(Tl ) was taken by using LI-6400.
Tl was measured by direct contact of the abaxialsurface of the leaf with the fine-wire thermocouplemounted in the LI-6400 leaf chamber.
Rl response curves were determined duringnight-time, generally from 23:00 to 1:00 h. The mea-surement started at actual leaf temperature value andcontinued, in a step-wise fashion, with temperatureincreases of 3◦C up to the maximum value allowedby the instrumentation (generally 12–14◦C aboveambient). Thereafter, the measurements continueddownward with temperature decrease of 3◦C untilcrossing the initial temperature and down to the mini-mum value allowed by the instrumentation (generally8–9◦C below ambient). At each step, gas-exchangevariables were recorded after achieving steady-stateconditions (about 5 min) and about 1 h was neededto obtain one curve. Measurements at about 10-dayintervals were taken from 29 May up to 30 July(58–121 DAP) for sunflower, from 19 June up to 27August (78–147 DAP) for sorghum, from 27 April upto 31 May (130–164 DAP) for wheat, and from 25May up to 10 June (85–100 DAP) for chickpea.
3. Results
3.1. Seasonal canopy carbon exchange rates
Daily integrals ofP andR for sunflower, sorghum,wheat and chickpea during the whole crop cycle areshown inFig. 1(a–d).
Whole-stand net primary production (P) initiallyincreased steeply for all the crops, reaching themaximum net CO2 assimilation rate of: 79.8 and97.0 g m−2 per day, for N0 and N1 treatments ofsunflower, respectively; 64.5 and 92.3 g m−2 per day,for N0 and N1 treatments of sorghum, respectively;38.5 g m−2 per day for wheat and 86.6 g m−2 per dayfor chickpea. Peak values ofP occurred at full anthe-sis for the two treatments of both sunflower (22 June,82 DAP) and sorghum (12 July, 102 DAP), and atthe end of anthesis for wheat (7 May, 140 DAP) andchickpea (4 June, 95 DAP).P tended progressivelyto decline while the senescence progressed, reachingthe minimum values at the end of the measurementtime for all the crops. Chickpea was not monitoreduntil the end of its cycle, because a hail thunderstormcompletely destroyed the crop.

24 R. Albrizio, P. Steduto / Agricultural and Forest Meteorology 116 (2003) 19–36
Fig. 1. Daily values of day-time photosynthesis (P) and night-time respiration (R) during the crop cycle of (a) sunflower, (b) sorghum, (c)wheat and (d) chickpea. In (a) and (b), open and closed symbols represent nitrogen treatments N0 and N1, respectively.
Daily P in N1 treatment was consistently higher thanin N0 for both sunflower and sorghum crops, althoughN effect was much stronger in sorghum. In sunflower,in fact, P of N1 was higher thanP of N0 only aroundanthesis (from 82 to 89 DAP), while no differenceswere observed for the rest of the season. In sorghum,instead,P of N1 was higher thanP of N0 from thebeginning of fertilisation up to the end of the season.
Daily dark respiration (R) increased during theearly vegetative phases, reaching the maximum values
of: 50.0 and 54.0 g m−2 per day for N0 and N1 treat-ments of sunflower, respectively; 28.3 and 42.1 g m−2
per day for N0 and N1 treatments of sorghum, respec-tively; 12.3 g m−2 per day for wheat and 31.1 g m−2
per day for chickpea. Peak values ofR occurred co-incidentally with the filling stage of sunflower, wheatand chickpea reproductive organs, and with the flow-ering stage of sorghum. Rates ofR tended to declinetoward the end of the crop cycle for all the crops,as a consequence of ceased growth respiration and

R. Albrizio, P. Steduto / Agricultural and Forest Meteorology 116 (2003) 19–36 25
decreased maintenance respiration rate, associatedwith an extensive senescence.
The effect of N fertilisation onRshowed to be anal-ogous to the effect onP. In the case of sunflower,Rof treatment N1 was higher thanR of N0 only aroundthe seed-filling stage (from 89 to 98 DAP), while aslightly higherR of N0 was observed for the rest ofthe season. In sorghum, instead,R of N1 was higherthanR of N0 from the week after the first fertilisationup to the end of the season.
3.2. Cumulative carbon exchange rates,carbon use and growth efficiencies
Except for sunflower, both cumulativeP (∑
P )and biomass were linearly correlated with cumulativeR (
∑R) for all four crops during the entire season
(Figs. 2 and 3). Slopes and determination coefficient(r2) values of the regressions between
∑P and
∑R
and between biomass and∑
R, determined on groundsurface-area basis for all crops and treatments, are re-ported inTable 1. The slopes of such regressions aremeasures of the CUE and of growth efficiency, respec-tively.
N0 and N1 treatments of sunflower fitted the sameregression either in terms of carbon use (Fig. 2a)or growth efficiencies (Fig. 3a), in pre-anthesis,while the value of the carbon use (and growth) ef-ficiency strongly declined in post-anthesis. Betweenpre- and post-anthesis, CUE decreased by 47 and36% for N0 and N1, respectively, while growth ef-ficiency decreased by 82 and 90% for N0 and N1,
Table 1Slopes and determination coefficient (r2) of the regressions between cumulative day-time photosynthesis (
∑P ) and night-time respiration
(∑
R), and between biomass and∑
R, of the investigated crops and nitrogen treatments
Crop Treatments Regression∑
P vs.∑
R Regression biomass vs.∑
R
Slope r2 Slope r2
Sunflower pre-anthesis N0 2.08 0.991 1.05 0.957N1
Sunflower post-anthesis N0 1.10 0.998 0.19 0.744N1 1.34 0.989 0.11 0.476
Sorghum N0 2.28 0.996 1.24 0.984N1
Wheat – 3.35 0.987 1.78 0.984Chickpea – 2.83 0.991 1.14 0.988
Regressions of sunflower are distinguished between pre- and post-anthesis stages.
respectively. The reductions of both the regres-sions were associated with an evident breakdownof linearity at the anthesis stage. The increase in∑
R, as compared to∑
P and biomass, was rele-vant even if a new linearity was re-established afteranthesis.
In contrast to what observed for sunflower, N0 andN1 treatments of sorghum fitted the same regression asCUE (Fig. 2b) and growth efficiency (Fig. 3b) duringthe whole crop cycle. This finding indicates that Nlevel affected carbon gain (as eitherP or biomass)and carbon loss (R) in a similar way, and that the twoN treatments had similar efficiencies throughout thewhole season.
Comparing the CUE of the different crops (Table 1),pre-anthesis sunflower had the lowest value (2.08)followed by sorghum (2.28), chickpea (2.83) andwheat (3.35). The same order was reflected also ingrowth efficiency, except chickpea that showed lowergrowth efficiency than sorghum, most likely due toa greater allocation of biomass into its root system.The tighter regressions between
∑P and
∑R, as
compared to biomass versus∑
R (see r2 values),indicate the very high accuracy ofP and R deter-minations using the canopy chambers and IRGAsystems.
Table 2reports the total net photosynthesis (Pt) andtotal dark respiration (Rt) values obtained at the endof each crop season, along with the seasonalPt/Rt ra-tio. Sorghum of treatment N1 had the highestPt value(4.94 kgCO2
m−2, 16% higher than N0), closely fol-lowed by sunflower of treatment N1 (4.24 kgCO2
m−2,

26 R. Albrizio, P. Steduto / Agricultural and Forest Meteorology 116 (2003) 19–36
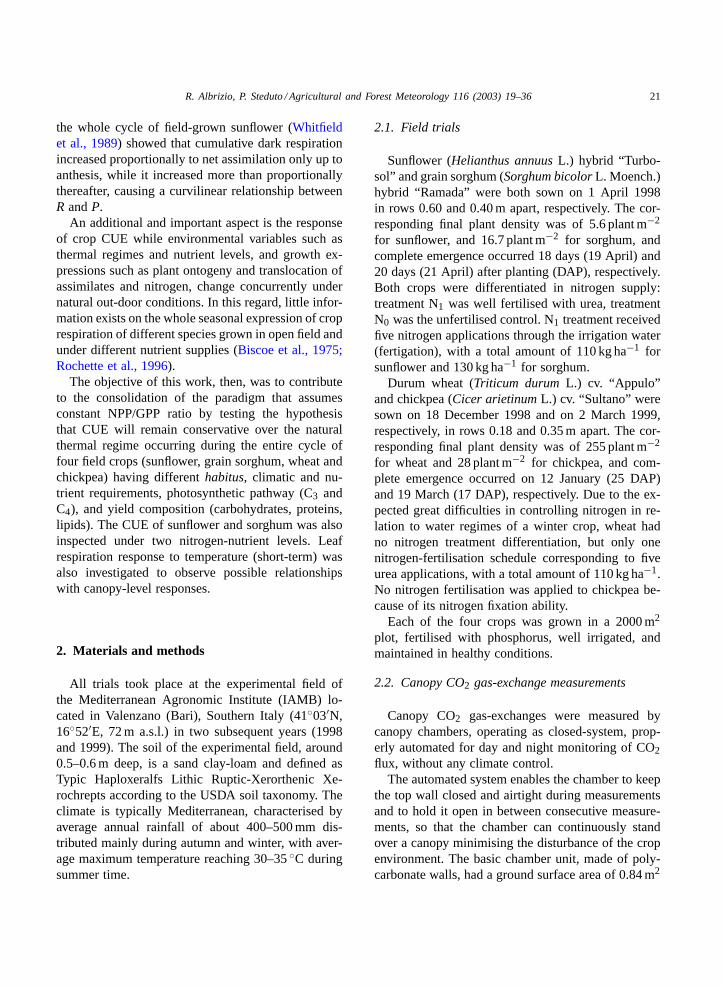
Fig. 2. Regressions between cumulative day-time photosynthesis (∑
P ) and night-time respiration (∑
R) over the crop cycle of (a) sunflower,(b) sorghum, (c) wheat and (d) chickpea. In (a) and (b), open and closed symbols represent nitrogen treatments N0 and N1, respectively.
9% higher than N0), chickpea1 (2.34 kgCO2m−2) and
wheat (1.97 kgCO2m−2). In terms ofRt, instead, sun-
flower of treatment N0 ranked first (2.52 kgCO2m−2,
5% higher than N1), followed at a certain distanceby sorghum of treatment N1 (2.16 kgCO2
m−2, 17%higher than N0), chickpea1 (0.83 kgCO2
m−2) and
1 Chickpea season ended at the pod-filling stage.
wheat (0.59 kgCO2m−2). It is interesting to observe
that while sorghumRt of N1 was higher than N0, thesituation was reversed, though slightly, in the case ofsunflower withRt of N0 about 5% higher than N1.Most likely, this was due to increased biochemicalactivity during post-anthesis of sunflower, induced byaccelerated senescence in the N0 treatment.
Although∑
P versus∑
R is just an alternativeway of expressing the relationship of cumulative net

R. Albrizio, P. Steduto / Agricultural and Forest Meteorology 116 (2003) 19–36 27
Fig. 3. Regressions between biomass and cumulative night-time respiration (∑
R) over the crop cycle of (a) sunflower, (b) sorghum, (c)wheat and (d) chickpea. In (a) and (b), open and closed symbols represent nitrogen treatments N0 and N1, respectively.
primary productivity (∑
NPP) against the cumulativegross primary productivity (
∑GPP), with NPP= P
and GPP= P + R, we prefer to retain the plot∑P versus
∑R because of its higher resolving
power. Taking sunflower as an example, when plotting∑NPP versus
∑GPP (Fig. 4), both slope differences
between pre- and post-anthesis and between N0 andN1 treatments, become less evident than when plot-
ting∑
P versus∑
R (Fig. 2), althoughr2 remainthe same (0.99). In the case ofFig. 4, the slope differ-ences between pre- and post-anthesis are 0.16 for N0and 0.11 for N1, while in the case ofFig. 2 they are0.98 and 0.74, respectively. The graphical resolutionbecomes even worse when plotting NPP versus GPPon daily basis (Fig. 5). In this case, the slope changebetween pre- and post-anthesis, and the difference

28 R. Albrizio, P. Steduto / Agricultural and Forest Meteorology 116 (2003) 19–36
Table 2Total seasonal day-time photosynthesis (Pt ), total seasonal night-time respiration (Rt ), and correspondingPt /Rt ratio, of the investigatedcrops and nitrogen treatments
Crop Treatments Pt (kgCO2m−2) Rt (kgCO2
m−2) Pt /Rt ratio
Sunflower N0 3.90 2.52 1.55N1 4.24 2.39 1.77
Sorghum N0 4.16 1.81 2.30N1 4.94 2.16 2.29
Wheat – 1.97 0.58 3.40Chickpeaa – 2.34 0.83 2.82
a Chickpea season ended at the pod-filling stage.
between N treatments, completely disappear, with anoverall single slope value of 0.66 andr2 = 0.93. Thisexample draws the attention on the risks in interpret-ing various types of graphical data processing.
3.3. R response to temperature at canopy andleaf scales
The canopy-scale variation of∑
P /∑
R ratiowith the variation of daily average air temperaturemeasured inside the canopy chamber (Tin), throughthe seasonal cycle of the four crops, is shown in
Fig. 4. Regressions between cumulative net primary productivity (∑
NPP) and cumulative gross primary productivity (∑
GPP) over thecrop cycle of sunflower, distinguished between pre- and post-anthesis stages. Open and closed symbols represent nitrogen treatments N0
and N1, respectively.
Fig. 6. Three different cases are evident: (i) a constant∑P /
∑R ratio (slope not significantly different from
zero) in sunflower at pre-anthesis and in both N treat-ments, in sorghum over the whole season and in bothN treatments, and in chickpea over the whole season.The
∑P /
∑R ratio had an average (avg) value of
2.58 and a standard deviation (S.D.) of±0.30, overthe measuredTin range between 16.0 and 34.2◦C;(ii) a constant
∑P /
∑R ratio (slope not significantly
different from zero) in sunflower at post-anthesis andin both N treatments. The
∑P /
∑R ratio was lower
(avg = 1.77, S.D. = ±0.16) than the pre-anthesis

R. Albrizio, P. Steduto / Agricultural and Forest Meteorology 116 (2003) 19–36 29
Fig. 5. Regressions between daily net primary productivity (NPP) and daily gross primary productivity (GPP) over the crop cycle ofsunflower. Open and closed symbols represent nitrogen treatments N0 and N1, respectively.
Fig. 6. Canopy-scale variation of cumulative day-time photosynthesis to cumulative night-time respiration (∑
P /∑
R) ratio with variationof daily average air temperature inside the canopy chamber (Tin), for all the crops and treatments.
value, over the measuredTin range 23.6–28.9◦C; (iii)a decreasing
∑P /
∑R ratio, from 4.92 to 3.41, in
wheat over theTin range 11.0–21.0◦C.When observing the response, at leaf scale, of dark
respiration (Rl ) to increased leaf temperature (Tl ) for
all crops (Fig. 7), the curves are almost exponential,at least until the leaves remained rich in nitrogen (Ncontent >3%). In fact, toward the end of the grow-ing season, when leaves were losing their N content(N < 2%), Rl rates varied only slightly and remained

30 R. Albrizio, P. Steduto / Agricultural and Forest Meteorology 116 (2003) 19–36
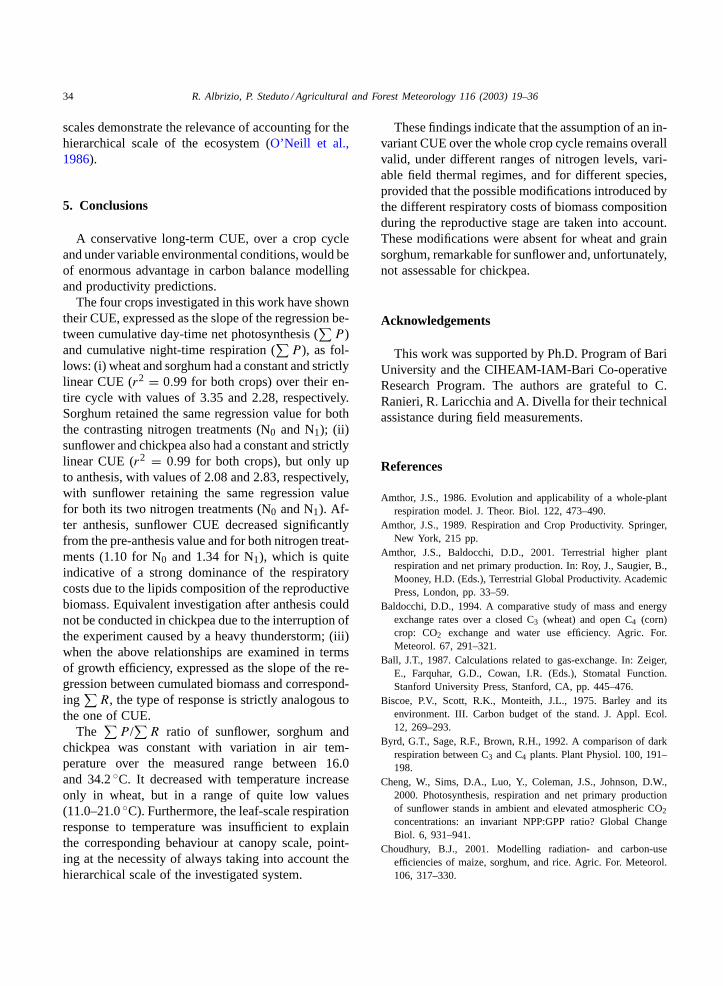
Fig. 7. Leaf respiration (Rl ) response to leaf temperature (Tl ) of (a) sunflower, (b) sorghum, (c) wheat and (d) chickpea. Responses referto different dates and leaf nitrogen content (N).

R. Albrizio, P. Steduto / Agricultural and Forest Meteorology 116 (2003) 19–36 31
about constant. Sunflower (C3 plant) and sorghum (C4plant) had similarRl response over the same temper-ature range (25–28◦C) and nitrogen content (Fig. 7aand b). Wheat (Fig. 7c) did not show any response toTl ranging between 16.0 and 27.2◦C, most likely dueto the low leaf N content, while over a similar range oftemperatures chickpea (Fig. 7d) doubled its respirationflux from about 50–100�g m−2 s−1. TheRl versusTlresponses reported inFig. 7 are examples of manydifferent measurements made throughout the crop cy-cles, all showing similar trends to those reported here.Unfortunately, noRl versusTl responses curves wereavailable before flowering of wheat and chickpea.
4. Discussion
The four species examined in the present work cov-ered a relatively wide range of field-crops commonlygrown in agriculture systems, including the two majorphotosynthetic pathways (C3 and C4), different yieldcomposition (carbohydrates, proteins, lipids) and vari-able climatic requirements in terms of radiation andthermal regimes. The two N levels compared, althoughonly for two crops, further extended the investigationgiving a better understanding of the CUE behaviour.
4.1. Photosynthetic assimilation
Canopy photosynthetic assimilation is evaluated asa result of the compounding effect of total leaf areaand photosynthetic rate per unit surface of leaf area,representing, respectively, the “sink size” and the “sinkintensity” for CO2. In all crops, seasonal net assim-ilation trends (Fig. 1) closely followed leaf area de-velopment, with peak values of leaf area index (LAI)of 2.7 and 3.5 for N0 and N1 treatments of sunflower,respectively; 5.5 and 7.0 for N0 and N1 treatments ofsorghum, respectively; 6.2 for chickpea and 3.0 forwheat.
Both N treatments of sunflower had higher dailyP peak values than the corresponding N treatmentsof sorghum (Fig. 1), while the situation was reversedwhen the total seasonal values (Pt), along the wholecrop cycle, were considered (Table 2). The higherPtof sorghum, as compared to sunflower, resulted fromgreater leaf area duration of sorghum. The superior-ity of sunflower on sorghum, in terms of dailyP peak
values, was also evident through photosynthetic mea-surements made at leaf scale. Leaf photosynthetic rate(Al ), at theP peaks, was 39 and 30�mol m−2 s−1 forsunflower and sorghum, respectively. No significantAldifferences between the two N treatments were foundin both crops; it may be explained on the ground thatAl was measured only in the leaves of the upper canopylayer fully exposed to sunlight.
Although there is large evidence of the greater pho-tosynthetic capacity of C4, as compared to C3 species(e.g. Sage and Pearcy, 1987), it is not surprising tofind higher photosynthetic values for sunflower thanfor sorghum, at both canopy and leaf scales, due tohigher activity of Rubisco enzyme, associated with itsmore efficient electron transport (Ranty and Cavaliè,1982) and higher stomatal conductance (Körner et al.,1979), all conferring to sunflower the exceptional pho-tosynthetic ability under optimal water status (Connorand Sadras, 1992; Connor and Hall, 1997).
The N treatment had only a mild effect on canopygas-exchange of sunflower, as compared to sorghum.Around anthesis, N0 reduced the leaf area of sunflowerin terms of both expansion (about 30%) and duration(about 28%), while maintaining nitrogen concentra-tion and photosynthetic activity per unit leaf area al-most constant. These findings are consistent with thewidely accepted view that leaf expansion for sunflowerrepresents the most important adaptive mechanism toenvironmental stress, including nitrogen (Hocking andSteer, 1983; Connor and Sadras, 1992), and that theprimary impact of nitrogen fertilisation is via leaf areagrowth rather than via leaf nitrogen content (Garciaet al., 1988).
Among the four crops, chickpea ranked third interms of daily peak values ofP (Fig. 1), immediatelyfollowing N1 treatments of sunflower and sorghum.Because of the ability of its rooting system to fix nitro-gen, chickpea can be considered as a fertilised crop. Itsgood photosynthetic capacity was confirmed throughthe Al value, which followed sorghum at very shortdistance, reaching about 27�mol m−2 s−1 around an-thesis. Unfortunately, we cannot fully compare thePtof chickpea with the other crops because its crop cy-cle was not completed (Table 2). Wheat ranked at thelast position in terms of both daily peaks andPt val-ues, as a consequence of its relatively low LAI andlow leaf photosynthetic rate, the latter never exceed-ing 20�mol m−2 s−1.

32 R. Albrizio, P. Steduto / Agricultural and Forest Meteorology 116 (2003) 19–36
It is interesting to notice that satisfactory consis-tency between peaks of dailyP andAl was observedfor all crops, even if the N effect was not observed interms ofAl measured at the upper canopy layer. Thisseems to indicate that the sink intensity at leaf scaleis a valid indicator of the assimilation rate at canopyscale, although observations done at lower hierarchi-cal levels (leaf scale) do not allow to easily extrapolateinformation to higher levels of organisation (canopyscale).
4.2. Dark respiration
Total dark respiration determinations along the en-tire growing season have been of significant impor-tance as little information exists in the literature onthe seasonalR pattern of crops grown in open field(Amthor, 1989; Loomis and Connor, 1992).
Sunflower had the highest dark respiration eitherin terms of daily peak (R) or total seasonal (Rt) val-ues, followed by sorghum, chickpea and wheat (Fig. 1,Table 2). The effect of N fertilisation on respirationwas analogous to the effect on photosynthesis. TheRtvalue of sunflower in N0 was slightly higher than inN1 (Table 2) as a consequence of lower CUE duringpost-anthesis (Fig. 2, Table 1). Even if such superi-ority of N0 was not statistically significant, it can bethe result of accelerated senescence due to the strongtranslocation of N from the leaves to the reproduc-tive organs. This indicates that the nitrogen effect atcanopy scale does not always follow the same patternexpected at leaf scale, and that higher N content doesnot necessarily mean higher respiration, as already re-ported in some studies carried out either in controlledenvironments (e.g.Pavlik, 1983) or in the field (e.g.Mitchell et al., 1991).
The amount of carbon lost through dark respirationin comparison to that fixed through net photosynthe-sis, along the whole season, was about 60% for sun-flower, while it was approximately 45, 35 and 30% forsorghum, chickpea and wheat, respectively, withoutshowing significant differences between the N treat-ments (Table 2). The largestRt value of sunflower isconsistent with the higher energy demand for produc-ing oily seeds than chickpea in producing proteinsand sorghum and wheat in producing carbohydrates.
These findings indicate to what extent the carboncost for respiration is much more dependent on the
composition of biomass (Penning de Vries, 1975) thanon other factors, such as N content and photosyntheticpathway (Byrd et al., 1992). Consequently, if chick-pea had finished its growing cycle, we would havelikely found a higher post-anthesis respiratory cost forchickpea than for sorghum.
4.3. Constancy of carbon use andgrowth efficiencies
Similarly to radiation and water use efficiencystudies reported in the literature (e.g.Sinclair andMuchow, 1999), we prefer to use the “cumulativeapproach” of the variables to regress for determin-ing both carbon use and growth efficiencies. In fact,it has been largely shown (e.g.Monteith, 1994;Steduto and Hsiao, 1994) that the mechanism be-hind the correlation between cause/effect variables,or strongly linked processes, dominantly overwhelmsthe statistical weakness of the regression operated oncumulative values (Demetriades-Shah et al., 1992),with the additional advantage of conferring robust-ness to the linearity of these relationships. Dependingon the variables and time-scales considered in theanalysis, the resolving ability of some relationshipsmay disappear, as shown inFigs. 4 and 5where thegraphical interpretation of the results is substantiallydifferent from the one corresponding to the results ofFig. 2. For these reasons, we prefer to stay with the“cumulative approach” in discussing our results.
A first outstanding outcome of this study is the lin-earity observed between
∑P and
∑R (Fig. 2) and
between biomass and∑
R (Fig. 3), demonstratingthat both carbon-use and growth efficiencies were in-variant throughout the whole crop cycle of sorghumand wheat, and up to anthesis for chickpea and sun-flower. These findings imply that, whatever the envi-ronmental conditions occurring during the crop cycle(e.g. radiation and temperature regimes), the growthprocesses (e.g. growth and maintenance respiration,translocation of assimilates, ontogeny evolution andcrop ageing, etc.), and the nitrogen supply (in the caseof sorghum, and in sunflower up to anthesis), therewas a concerted action among all these occurrences, sothat the overall resulting CUE (and growth efficiency)at canopy scale remains unaffected.
A second remarkable outcome is the rupture of thelinearity in CUE (and growth efficiency) for sunflower

R. Albrizio, P. Steduto / Agricultural and Forest Meteorology 116 (2003) 19–36 33
at anthesis. This finding demonstrates that respiratorycosts due to biomass composition strongly dominatecarbon balance. In chickpea, due to the interruptionof the cycle during the early pod-filling stage, wecannot demonstrate whether CUE would change inpost-anthesis (protein production), similarly to whatobserved in sunflower (lipid production).
According toGifford (1995), there are no obviousreasons to predict that CUE would be invariant alonga crop cycle, and possible mechanisms responsiblefor this conservative behaviour need to be further ex-plored. Some theoretical support to explain constancybetween photosynthesis and respiration has been pro-vided by some experiments (Farrar and Williams,1991), modelling studies (Dewar, 1996; Dewar et al.,1999) and some theoretical discussions (O’Neill et al.,1986; Cheng et al., 2000). However, most of the stud-ies do not include modifications due to internal cropprocesses (biotic processes), such as the appearanceof the reproductive organs with associated differentenergy demand depending on the biomass compo-sition. This occurrence can significantly modify theproportion betweenP andR in mature ecosystems.
Unfortunately, studies aimed at investigating theconstancy of CUE under different environmental con-ditions (Gifford, 1994; Tjoelker et al., 1999; Chenget al., 2000) have been conducted only during theearly stages of plant life and under controlled environ-mental conditions, without including the reproductivestage. We are aware only of the research carried outby Whitfield et al. (1989)who investigatedR and Pover the entire crop cycle of field-grown sunflower.They showed that the relationship between the cumu-lative dark respiration and gross assimilation was lin-ear before anthesis, while it became curvilinear duringpost-anthesis in both well-irrigated and water-stressedtreatments, as a consequence of the increased respira-tory load due to heads. When considering the differ-ences betweenWhitfield et al. (1989)experiment andours, the estimated numerical values of CUE are com-parable and, of even greater significance, is the com-mon conclusion shared, i.e. the highlighted importanceof monitoring all the phenological stages, especiallyfor crops having high lipids and proteins content. Ourresults, though, confirm the constancy of CUE for ce-reals like wheat and sorghum.
Wheat and chickpea showed higher CUE valuesthan sorghum and sunflower. This might be explained
on the ground that those crops are generally welladapted to cool seasons and maintain a relatively highphotosynthetic rate at low temperature. This higherassimilation capacity is enhanced also by the lowand more diffused radiation regimes occurring duringwinter and spring seasons. These conditions favour alarger penetration of light inside the canopy (Denmeadet al., 1993), while photosynthesis proceeds mostlyin non-saturated light conditions, thus leading to anoverall increase in radiation use efficiency (Lawlor,1995) and highP values of the canopy. Since dur-ing night-time, canopy, roots and the soil microbialpopulation, would be exposed to cool temperature,maintaining low R values, the overall result mightwell be an increase in CUE as well.
A third significant outcome is the apparent absence,or limited impact, of the temperature influence on∑
P /∑
R ratio of crops (Fig. 6).The average
∑P /
∑R ratio was constant at 2.58,
with temperature variation between 16.0 and 34.2◦C,for sorghum, sunflower (at pre-anthesis) and chick-pea, independently of the N content, ageing, and plantsize. Post-anthesis sunflower continued to hold a con-stant
∑P /
∑R ratio, although with a lower value than
pre-anthesis as a consequence of biomass compositionrather than temperature. Only in wheat the
∑P /
∑R
ratio tended to decrease with temperature increase,probably due to the low temperatures occurred duringmost of its crop cycle, also associated with diffuse ra-diation conditions. Indeed, our temperature range wasquite lower than the one utilised in a controlled exper-iment byGifford (1994), where a constant
∑P /
∑R
ratio was found. Therefore, such an issue calls for fur-ther investigation.
In terms of absolute values, after converting photo-synthesis from net to gross, the
∑P /
∑R ratio found
in our crops is comparable to that reported byGifford(1994, 1995)and predicted byDewar (1996).
The behaviour of CUE to increasing temperature,observed in this work at canopy scale for most of thecrops (Fig. 6), does not match the most common wayto conceive respiration as exponential function of tem-perature observable at leaf scale. The idea that plantrespiration is strictly temperature-dependent is indeedbased on short-term experiments, as largely explainedby Gifford (1994), Amthor (1989), and confirmed inour study (Fig. 7). The contrasting results of dark res-piration response to temperature at canopy and leaf
34 R. Albrizio, P. Steduto / Agricultural and Forest Meteorology 116 (2003) 19–36
scales demonstrate the relevance of accounting for thehierarchical scale of the ecosystem (O’Neill et al.,1986).
5. Conclusions
A conservative long-term CUE, over a crop cycleand under variable environmental conditions, would beof enormous advantage in carbon balance modellingand productivity predictions.
The four crops investigated in this work have showntheir CUE, expressed as the slope of the regression be-tween cumulative day-time net photosynthesis (
∑P )
and cumulative night-time respiration (∑
P ), as fol-lows: (i) wheat and sorghum had a constant and strictlylinear CUE (r2 = 0.99 for both crops) over their en-tire cycle with values of 3.35 and 2.28, respectively.Sorghum retained the same regression value for boththe contrasting nitrogen treatments (N0 and N1); (ii)sunflower and chickpea also had a constant and strictlylinear CUE (r2 = 0.99 for both crops), but only upto anthesis, with values of 2.08 and 2.83, respectively,with sunflower retaining the same regression valuefor both its two nitrogen treatments (N0 and N1). Af-ter anthesis, sunflower CUE decreased significantlyfrom the pre-anthesis value and for both nitrogen treat-ments (1.10 for N0 and 1.34 for N1), which is quiteindicative of a strong dominance of the respiratorycosts due to the lipids composition of the reproductivebiomass. Equivalent investigation after anthesis couldnot be conducted in chickpea due to the interruption ofthe experiment caused by a heavy thunderstorm; (iii)when the above relationships are examined in termsof growth efficiency, expressed as the slope of the re-gression between cumulated biomass and correspond-ing
∑R, the type of response is strictly analogous to
the one of CUE.The
∑P /
∑R ratio of sunflower, sorghum and
chickpea was constant with variation in air tem-perature over the measured range between 16.0and 34.2◦C. It decreased with temperature increaseonly in wheat, but in a range of quite low values(11.0–21.0◦C). Furthermore, the leaf-scale respirationresponse to temperature was insufficient to explainthe corresponding behaviour at canopy scale, point-ing at the necessity of always taking into account thehierarchical scale of the investigated system.
These findings indicate that the assumption of an in-variant CUE over the whole crop cycle remains overallvalid, under different ranges of nitrogen levels, vari-able field thermal regimes, and for different species,provided that the possible modifications introduced bythe different respiratory costs of biomass compositionduring the reproductive stage are taken into account.These modifications were absent for wheat and grainsorghum, remarkable for sunflower and, unfortunately,not assessable for chickpea.
Acknowledgements
This work was supported by Ph.D. Program of BariUniversity and the CIHEAM-IAM-Bari Co-operativeResearch Program. The authors are grateful to C.Ranieri, R. Laricchia and A. Divella for their technicalassistance during field measurements.
References
Amthor, J.S., 1986. Evolution and applicability of a whole-plantrespiration model. J. Theor. Biol. 122, 473–490.
Amthor, J.S., 1989. Respiration and Crop Productivity. Springer,New York, 215 pp.
Amthor, J.S., Baldocchi, D.D., 2001. Terrestrial higher plantrespiration and net primary production. In: Roy, J., Saugier, B.,Mooney, H.D. (Eds.), Terrestrial Global Productivity. AcademicPress, London, pp. 33–59.
Baldocchi, D.D., 1994. A comparative study of mass and energyexchange rates over a closed C3 (wheat) and open C4 (corn)crop: CO2 exchange and water use efficiency. Agric. For.Meteorol. 67, 291–321.
Ball, J.T., 1987. Calculations related to gas-exchange. In: Zeiger,E., Farquhar, G.D., Cowan, I.R. (Eds.), Stomatal Function.Stanford University Press, Stanford, CA, pp. 445–476.
Biscoe, P.V., Scott, R.K., Monteith, J.L., 1975. Barley and itsenvironment. III. Carbon budget of the stand. J. Appl. Ecol.12, 269–293.
Byrd, G.T., Sage, R.F., Brown, R.H., 1992. A comparison of darkrespiration between C3 and C4 plants. Plant Physiol. 100, 191–198.
Cheng, W., Sims, D.A., Luo, Y., Coleman, J.S., Johnson, D.W.,2000. Photosynthesis, respiration and net primary productionof sunflower stands in ambient and elevated atmospheric CO2
concentrations: an invariant NPP:GPP ratio? Global ChangeBiol. 6, 931–941.
Choudhury, B.J., 2001. Modelling radiation- and carbon-useefficiencies of maize, sorghum, and rice. Agric. For. Meteorol.106, 317–330.

R. Albrizio, P. Steduto / Agricultural and Forest Meteorology 116 (2003) 19–36 35
Connor, D.J., Hall, A.J., 1997. Sunflower physiology. In: SunflowerTechnology and Production, Agronomy Monograph no. 35.American Society of Agronomy, Crop Science Society ofAmerica, Soil Science Society of America, Madison, USA,pp. 113–182.
Connor, D.J., Sadras, V.O., 1992. Physiology of yield expressionin sunflower. Field Crops Res. 30, 333–389.
Demetriades-Shah, T.H., Fuchs, M., Kanemasu, E.T., Flitcroft, I.,1992. A note of caution concerning the relationship betweencumulated intercepted solar radiation and crop growth. Agric.For. Meteorol. 58, 193–207.
Denmead, O.T., Dunin, F.X., Wong, S.C., Greenwood, E.A.N.,1993. Measuring water use efficiency of Eucalyptus trees withchamber and micrometeorological techniques. J. Hydrol. 150,649–664.
Dewar, R.C., 1996. The correlation between plant growth andintercepted radiation: an interpretation in terms of optimal plantnitrogen content. Ann. Bot. 78, 125–136.
Dewar, R.C., Medlyn, B.E., McMurtrie, R.E., 1999. Acclimationof the respiration/photosynthesis ratio to temperature: insightfrom a model. Global Change Biol. 5, 615–622.
Dugas, W.A., Fritschen, L.J., Gay, L.W., Held, A.A., Matthias,A.D., Reicosky, D.C., Steduto, P., Steiner, J.L., 1991. Bowenratio, eddy correlation, and portable chamber measurementsfrom irrigated spring wheat. Agric. For. Meteorol. 56, 1–20.
Farrar, J.F., 1985. The respiratory source of CO2. Plant CellEnviron. 8, 427–438.
Farrar, J.F., Williams, J.H.H., 1991. Control of the rate ofrespiration in roots: compartmentation, demand, and the supplyof substrate. In: Emes, M.J. (Ed.), Compartmentation of PlantMetabolism in Non-photosynthetic Tissues. Soc. Exp. Biol.Sem. Ser., vol. 42. Cambridge University Press, Cambridge,pp. 167–188.
Garcia, R., Kanemasu, E.T., Blad, B.L., Bauer, A., Hatfield, J.L.,Major, D.J., Reginato, R.J., Hubbard, K.G., 1988. Interceptionand use efficiency of light in winter wheat under differentnitrogen regimes. Agric. For. Meteorol. 44, 175–186.
Gifford, R.M., 1994. The global carbon cycle: a viewpoint on themissing sink. Aust. J. Plant Physiol. 21, 1–5.
Gifford, R.M., 1995. Whole-plant respiration and photosynthesisof wheat under increased CO2 concentration and temperature:long-term vs. short-term distinctions for modelling. GlobalChange Biol. 1, 385–396.
Held, A.A., Steduto, P., Orgaz, F., Matista, A., Hsiao, T.C., 1990.Bowen ratio/energy balance technique for estimating crop netCO2 assimilation, and comparison with a canopy chamber.Theor. Appl. Climatol. 42, 203–213.
Hocking, P.J., Steer, B.T., 1983. Distribution of nitrogen duringgrowth of sunflower (Helianthus annuusL.). Ann. Bot. 51,787–799.
Högberg, P., Nordgren, A., Buchmann, N., Taylor, A.F.S., Ekblad,A., Högberg, M.N., Nyberg, G., Ottosson-Löfvenius, M., Read,D.J., 2001. Large-scale forest girdling shows that currentphotosynthesis drives soil respiration. Nature 411, 789–792.
Hurlbert, S.H., 1984. Pseudoreplication and the design ofecological field experiments. Ecol. Monogr. 54, 187–211.
Körner, C., Scheel, J.A., Bauer, H., 1979. Maximum leaf diffusiveconductance in vascular plants. Photosynthetica 13, 45–82.
Lambers, H., 1985. Respiration in intact plants and tissues:its regulation and dependence on environmental factors,metabolism and invaded organisms. In: Douce, R., Day, D.A.(Eds.), Higher Plant Cell Respiration. Encycl. Plant Physiol.(NS), vol. 18. Springer-Verlag, Berlin, Germany, pp. 418–473.
Landsberg, J.J., Waring, R.H., 1997. A generalised model offorest productivity using simplified concepts of radiation-useefficiency. For. Ecol. Manage. 95, 209–228.
Lawlor, D.W., 1995. Photosynthesis, productivity and environment.J. Exp. Bot. 46, 1449–1461.
Loomis, R.S., Connor, D.J., 1992. Crop Ecology: Productivity andManagement in Agricultural Systems. Cambridge UniversityPress, Cambridge, 538 pp.
Lund, C.P., Riley, W.J., Pierce, L.L., Field, C.B., 1999. The effectsof chamber pressurization on soil-surface CO2 flux and theimplications for NEE measurements under elevated CO2. GlobalChange Biol. 5, 269–281.
Luo, Y., Sims, D.A., Thomas, R.B., Tissue, D.T., Ball, J.T., 1996.Sensitivity of leaf photosynthesis to CO2 concentration is aninvariant function for C3 plants: a test with experimental dataand global applications. Global Biogeochem. Cy. 10, 209–222.
Luo, Y., Hui, D., Cheng, W., Coleman, J.S., Johnson, D.W., Sims,D.A., 2000. Canopy quantum yield in a mesocosm study. Agric.For. Meteorol. 100, 35–48.
McCree, K.J., 1988. Sensitivity of sorghum grain yield to ontogenicchanges in respiration coefficient. Crop Sci. 28, 114–120.
Mitchell, R.A.C., Lawlor, D.W., Young, A.T., 1991. Darkrespiration of winter wheat crop in relation to temperature andsimulated photosynthesis. Ann. Bot. 67, 7–16.
Monteith, J.L., 1994. Validity of the correlation betweenintercepted radiation and biomass. Agric. For. Meteorol. 68,213–220.
O’Neill, R.V., De Angelis, D.L., Waide, J.B., Allen, T.F.H.,1986. Hierarchical Concept of Ecosystems. Princeton UniversityPress, Princeton, NJ, 253 pp.
Pavlik, B.M., 1983. Nutrient and productivity relations of thedune grassesAmmophila arenariaandElymus mollis. I. Bladephotosynthesis and nitrogen use efficiency in the laboratory andfield. Oecologia 57, 227–232.
Penning de Vries, F.W.T., 1975. The use of assimilates inhigher plants. In: Cooper, J. (Ed.), Photosynthesis andProductivity in Different Environments. Cambridge UniversityPress, Cambridge, NY, pp. 459–480.
Ranty, B., Cavaliè, G., 1982. Purification and property of ribulose1,5-bisphosphate carboxylase from sunflower leaves. Planta155, 388–391.
Rochette, P., Desjardins, R.L., Pattey, E., Lessard, R., 1996.Istantaneous measurements of radiation and water useefficiencies of a maize crop. Agron. J. 88, 627–635.
Ryan, M.G., 1991. Effects of climate change on plant respiration.Ecol. Applic. 1, 157–167.
Sage, R.F., Pearcy, R.W., 1987. The nitrogen use efficiency of C3
and C4 plants. I. Leaf nitrogen, growth, and biomass partitioningin Chenopodium album(L.) and Amaranthus retroflexus(L.).Plant Physiol. 84, 954–958.
Saigusa, N., Yamamoto, Y., Murayama, S., Kondo, H., Nishimura,N., 2002. Gross primary production and net ecosystem change

36 R. Albrizio, P. Steduto / Agricultural and Forest Meteorology 116 (2003) 19–36
of a cool-temperate deciduous forest estimated by the eddycovariance method. Agric. For. Meteorol. 112, 203–215.
Sinclair, T.R., Muchow, R.C., 1999. Radiation use efficiency. Adv.Agron. 65, 215–265.
Steduto, P., 1993. Water vapour and CO2 fluxes of post-anthesismaize in the field under two soil-water regimes: leaf vs. canopyscale. Ph.D. Dissertation, University of California, Davis, 180pp.
Steduto, P., Hsiao, T.C., 1994. Radiation use efficiency of maizeunder well watered and water deficit conditions: cumulativevs. finite increment approach. In: Proceedings of the 3rdEuropean Society of Agronomy Meeting, Abano-Padova, Italy,18–22 September 1994. ESA, BP52, Colmar Cedex, France,pp. 418–419.
Steduto, P., Çetinkökü, Ö., Albrizio, R., Kanber, R., 2002.Automated closed-system canopy-chamber for continuousfield-crop monitoring of CO2 and H2O fluxes. Agric. For.Meteorol. 111, 171–186.
Suyker, A.E., Verma, S.B., 2001. Year-round observations of thenet ecosystem exchange of carbon dioxide in a native tallgrassprairie. Global Change Biol. 7, 279–289.
Tjoelker, M.G., Oleksyn, J., Reich, P.B., 1999. Acclimation ofrespiration to temperature and CO2 in seedlings of borealtree species in relation to plant size and relative growth rate.Global Change Biol. 49, 679–691.
Wagner, S.W., Reicosky, D.C., Alessi, R.S., 1997. Regressionmodels for calculating gas fluxes measured with a closedchamber. Agron. J. 89, 279–284.
Waring, R.H., Landsberg, J.J., Williams, M., 1998. Net primaryproduction of forests: a constant fraction of gross primaryproduction? Tree Physiol. 18, 129–134.
Whitfield, D.M., Connor, D.J., Hall, A.J., 1989. Carbon dioxidebalance of sunflower subjected to water stress duringgrain-filling. Field Crops Res. 20, 65–80.
Top Related
Copyright © 2022 FDOKUMEN

