


Bahasa
Halaman
Hukum


,-f#'.· . . ·
PASSAGE PLANNING
GUIDELINES
2018 Edition
._, !

Passage Planning
Guidelines
2018 Edition

Fi lished in 1997 by Witherby Publishing
Frfth edition published 2018
ISBN: 978-1-85609-778-9
© Witherby Publishing Group Ltd, 1997-2018
British Library Cataloguing in Publication Data
A catalogue record for this book is available from the British Library.
Notice of Terms of Use
All rights reserved. No part of this publication may be reproduced, stored in a retrieval system, or transmitted in any form or
by any means, electronic, mechanical, photocopying, recording or otherwise, without the prior permission of the publishers.
While the advice given in this book (Passage Planning Guidelines) has been developed using the best information currently
available, it is intended purely as guidance to be used at the user's own risk. Witherby Publishing Group accepts no
responsibility for the accuracy of any information or advice given in the document or any omission from the document or for
any consequence whatsoever resulting directly or indirectly from compliance with or adoption of guidance contained in the
document even if caused by failure to exercise reasonable care.
This publication has been prepared to deal with the subject of Passage Planning Guidelines. This should not, however, be
taken to mean that this publication deals comprehensively with all of the issues that will need to be addressed or even,
where a particular issue is addressed, that this publication sets out the only definitive view for all situations.
THIS PRODUCT IS NOT TO BE USED FOR NAVIGATION
NOTICE: The UK Hydrographic Office (UKHO) and its licensors make no warranties or representations, express or implied, with respect
to this product. The UKHO and its licensors have not verified the information within this product or quality assured it.
This product has been derived in part from material obtained from the UK Hydrographic Office with the permission of the UK
Hydrographic Office and Her Majesty's Stationery Office.
© British Crown Copyright, 2018. All rights reserved.
Extracts from IMO Resolutions have been included with the kind permission of the International Maritime Organization. The quoted
material may not be a complete or an accurate version of the original material, and the original material may have subsequently been
amended.
Published by
Witherby Publishing Group Ltd
4 Dunlop Square,
Livingston EH54 8SB,
Scotland, UK
+44 (0)1506 463 227
, itherbys.com
Prin ed and bound in Great Britain by Trade Colour Printing, Penrith, UK

Contents
Chapter 1- Introduction
1 Effective Passage Planning
1.1 Need for a Comprehensive Passage Plan
1.1.1 SOLAS Regulation 34
1.1.2 STCW Code
1.1.3 Safety Management System
1.1.4 IMO Resolution A.893(21)
1.2 The Four Stages of Planning
1.3 Responsibility
1.4 Key to Symbols
Chapter 2 - Appraisal
2 Gathering Information
2.1 Carriage Requirements for Charts and Nautical Publications
2.2 Preliminary Research
2.2.1 Preliminary Research - Destination
2.2.2 Preliminary Research - Weather and Environment
2.2.3 Preliminary Research - Passage Planning Guides
2.2.4 Preliminary Research - Nautical Publications, Charts, Update and Review
2.2.5 Preliminary Research - Other Considerations
2.3 Appraisal Report
Chapter 3 - Passage Planning on Paper Charts
3 Planning
3.1 Voyage Overview
3.2 Chart Preparation
3.3 Tracks
3.4 Speed
3.5 Pilotage Stage
3.5.1 Pilotage Chart Preparation
3.5.2 Tracks
3.6 Port Approaches
3. 7 Coastal and Ocean Passages
3.7.1 Passage Charts
3.7.2 Distances to Clear Hazards
3.7.3 Tracks for Coastal and Ocean Passages
3.7.4 Tracks in Traffic Separation Schemes (TSS)
3.7.5
3.7.6
3.7.7
3.7.8
3.7.9
Mariners' Routeing Guides
Planning Particular to a Canal Transit
Ocean Passage Tracks
Additional Considerations for an Ocean Passage
Passage Planning Sheet
3.8 Risk Assessment
3.9 Completion of the Planning Stage
3.10 Coastal Passage - Example
3.10.1 Coastal Passage Example - Tidal Calculations
3.10.2 Coastal Passage Example - Speed and ETA Calculations
3.10.3 Coastal Passage Example - Preparing the Charts
1
1
2
2
2
2
2
3
4
5
7
7
8
9
10
20
28
30
43
47
49
49
49
50
53
54
55
55
56
57
58
58
58
58
58
60
61
61
62
62
63
64
65
67
68
69
iii

Passage Planning Guidelines
Chapter 4 - Passage Planning on ECDIS 81
4 Effective Use of ECDIS 81
4.1 ECDIS Functionality 84
4.2 Display Configuration 85
4.3 Route Creation 89
4.3.1 New Route 89
4.3.2 Adding Waypoints 91
4.3.3 Adjusting Waypoints 93
4.3.4 Multiple Route Options 100
4.3.5 Route Table 100
4.4 Supplementary Information 103
4.5 Manual Updates 107
4.6 Route Check 108
4.6.1 Configuration 109
4.6.2 Conducting the Route Check 111
4.6.3 Visual Check 113
4.7 Detailed Briefing 114
4.8 ECDIS References 115
Annexes 117
Annex A - Example Appraisal Report Format 117
Annex B - Passage Planning Checklists 119
Annex C - ECDIS Planning Checklists 125
Annex D - Parallel Indexing 131
Annex E - Example Passage Plan Worksheet Format 134
Annex F - Example of Passage Planning Notes 135
Annex G - Safety Depth and Safety Contours 136
Annex H - Learning from Incidents 139
Annex I - List of Useful Publications 144
iv

Abbreviations
ADC
AIO
ALRS
APC
ASL
ATT
CATZOC
CIR
COLREGS
DW
ECA
ECDIS
ECS
ENC
ETA
ETD
GC
GNSS
GPS
HAT
HO
HoT
HW
IALA
IHO
IMO
IRTC
LW
MARPOL
MOS
NATO
NM
NO
NOAA
NP
oow
PI
PL
PMN
PSSA
RCDS
RL
RNC
SECA
SENC
SMS
SOG
SOLAS
Admiralty Digital Catalogue
Admiralty Information Overlay
Admiralty List of Radio Signals
Appropriate Portfolio of Paper Charts
Archipelagic Sea Lanes
Admiralty Tide Tables
Category of Zone of Confidence in Data
Cross Index Range
International Regulations for Preventing Collisions at Sea
Deep Water Route
Emission Control Area
Electronic Chart Display and Information System
Electronic Chart System
Electronic Navigational Chart
Estimated Time of Arrival
Estimated Time of Departure
Great Circle
Global Navigation Satellite System
Global Positioning System
Highest Astronomical Tide
Hydrographic Office
Height of Tide
High Water
International Association of Marine Aids to Navigation and Lighthouse Authorities
International Hydrographic Organization
International Maritime Organization
Internationally Recommended Transit Corridor
Low Water
International Convention for the Prevention of Pollution from Ships
Margin of Safety
North Atlantic Treaty Organization
Notice to Mariners
Navigating Officer
National Oceanic and Atmospheric Administration
Nautical Publication
Officer of the Watch
Parallel Index
Presentation Library
Primary Means of Navigation
Particularly Sensitive Sea Area
Raster Chart Display System
Rhumb Line
Raster Navigational Chart
Sulphur Emission Control Area
System Electronic Navigational Chart
Safety Management System
Speed Over the Ground
International Convention for the Safety of Life at Sea
V

Passage Planning Guidelines
STCW
T&Ps
TRS
TSS
UKC
UKHO
USCG
VRM
VTS
XTD
XTE
XTL
International Convention on Standards of Training, Certification and Watchkeeping
Temporary and Preliminary Notices
Tropical Revolving Storm
Traffic Separation Scheme
Under Keel Clearance
United Kingdom Hydrographic Office
United States Coast Guard
Variable Range Marker
Vessel Traffic Service
Cross Track Dista nee
Cross Track Error
Cross Track Limit
Note that the following terms may also be used and are synonymous. Review of the chart will show the style that the navigator has
adopted:
vi
XTD Cross Tracie Distance
XTE Cross Track Error

1 Effective Passage Planning
Passage planning is a process that requires skill and meticulous research. It is not something that should be taken lightly as
it carries responsibility and accountability and the consequences of getting it wrong are all too evident. A passage planner
must be conscientious and seek to produce a comprehensive and detailed 'berth to berth' plan based on the fullest possible
appraisal, taking into account all possibilities and eventualities, while reducing navigational risk. An effective passage plan,
regardless of whether it is completed using paper charts or ECDIS, must:
• Clearly define a safe navigational route from berth to berth
• be comprehensive and detailed, reduce navigational risk and include contingency options
• take into account established safety margins
• satisfy a rigorous checking process
• be easy to follow, allowing safe execution and monitoring of the plan
• be economical.
1
Passage Planning Guidelines
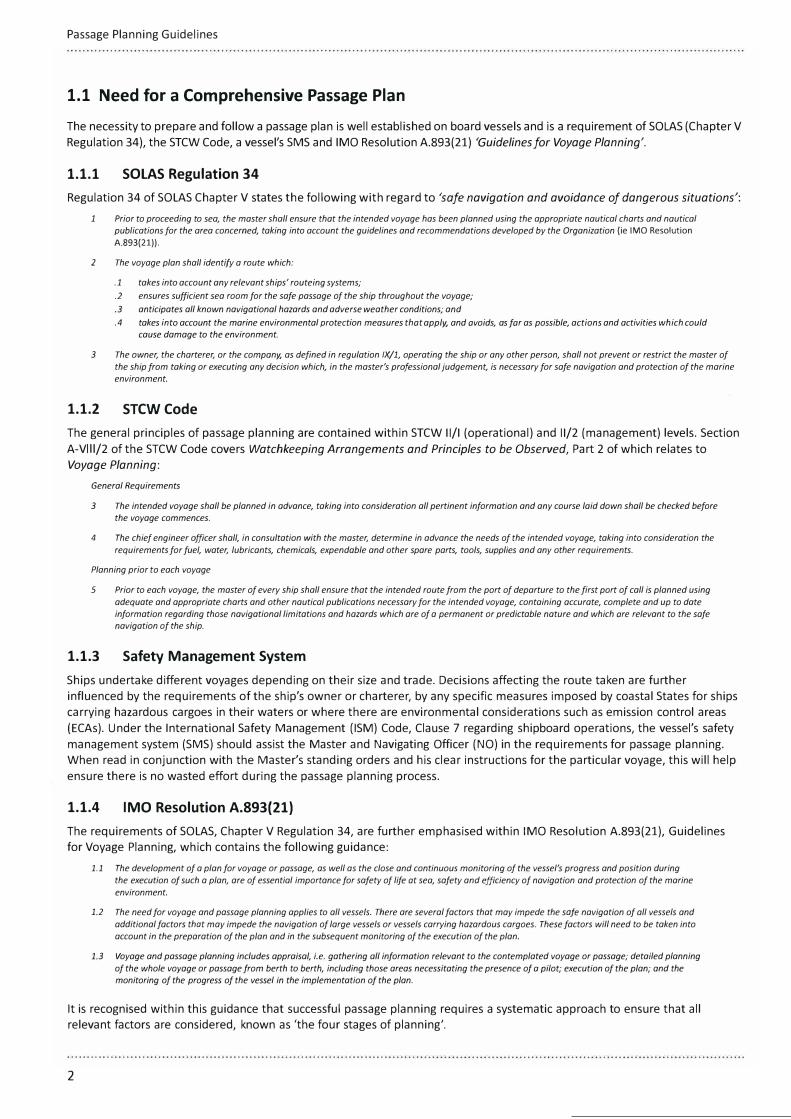
1.1 Need for a Comprehensive Passage Plan
The necessity to prepare and follow a passage plan is well established on board vessels and is a requirement of SOLAS (Chapter V
Regulation 34), the STCW Code, a vessel's SMS and IMO Resolution A.893(21) 'Guidelines for Voyage Planning'.
1.1.1 SOLAS Regulation 34
Regulation 34 of SOLAS Chapter V states the following with regard to 'safe navigation and avoidance of dangerous situations':
1 Prior to proceeding to sea, the master shall ensure that the intended voyage has been planned using the appropriate nautical charts and nautical
publications for the area concerned, taking into account the guidelines and recommendations developed by the Organization (ie IMO Resolution
A.893(21)).
2 The voyage plan shall identify a route which:
.1 takes into account any relevant ships' routeing systems;
. 2 ensures sufficient sea room for the safe passage of the ship throughout the voyage;
.3 anticipates all known navigational hazards and adverse weather conditions; and
.4 takes into account the marine environmental protection measures that apply, and ovoids, as for as possible, actions and activities which could
cause damage to the environment.
3 The owner, the charterer, or the company, as defined in regulation IX/1, operating the ship or any other person, shall not prevent or restrict the master of
the ship from taking or executing any decision which, in the master's professional judgement, is necessary for safe navigation and protection of the marine
environment.
1.1.2 STCW Code
The general principles of passage planning are contained within STCW 11/1 (operational) and 11/2 (management) levels. Section
A-Vlll/2 of the STCW Code covers Watchkeeping Arrangements and Principles to be Observed, Part 2 of which relates to
Voyage Planning:
General Requirements
3 The intended voyage shall be planned in advance, taking into consideration all pertinent information and any course laid down shall be checked before
the voyage commences.
4 The chief engineer officer shall, in consultation with the master, determine in advance the needs of the intended voyage, taking into consideration the
requirements for fuel, water, lubricants, chemicals, expendable and other spare parts, tools, supplies and any other requirements.
Planning prior to each voyage
S Prior to each voyage, the master of every ship shall ensure that the intended route from the port of departure to the first port of call is planned using
adequate and appropriate charts and other nautical publications necessary for the intended voyage, containing accurate, complete and up to date
information regarding those navigational limitations and hazards which are of a permanent or predictable nature and which ore relevant to the safe
navigation of the ship.
1.1.3 Safety Management System
Ships undertake different voyages depending on their size and trade. Decisions affecting the route taken are further
influenced by the requirements of the ship's owner or charterer, by any specific measures imposed by coastal States for ships
carrying hazardous cargoes in their waters or where there are environmental considerations such as emission control areas
(ECAs). Under the International Safety Management {ISM) Code, Clause 7 regarding shipboard operations, the vessel's safety
management system (SMS) should assist the Master and Navigating Officer (NO) in the requirements for passage planning.
When read in conjunction with the Master's standing orders and his clear instructions for the particular voyage, this will help
ensure there is no wasted effort during the passage planning process.
1.1.4 IMO Resolution A.893(21)
The requirements of SOLAS, Chapter V Regulation 34, are further emphasised within IMO Resolution A.893(21), Guidelines
for Voyage Planning, which contains the following guidance:
1.1 The development of a plan for voyage or passage, as well as the close and continuous monitoring of the vessel's progress and position during
the execution of such a plan, are of essential importance for safety of life at sea, safety and efficiency of navigation and protection of the marine
environment.
1.2 The need for voyage and passage planning applies to all vessels. There are several factors that may impede the safe navigation of all vessels and
additional factors that may impede the navigation of large vessels or vessels carrying hazardous cargoes. These factors will need to be taken into
account in the preparation of the plan and in the subsequent monitoring of the execution of the plan.
1.3 Voyage and passage planning includes appraisal, i.e. gathering all information relevant to the contemplated voyage or passage; detailed planning
of the whole voyage or passage from berth to berth, including those areas necessitating the presence of a pilot; execution of the plan; and the
monitoring of the progress of the vessel in the implementation of the plan.
It is recognised within this guidance that successful passage planning requires a systematic approach to ensure that all
relevant factors are considered, known as 'the four stages of planning'.
2

CHAPTER 1 Introduction
1.2 The Four Stages of Planning
The four stages of planning apply regardless of whether a passage plan is prepared for completion on paper charts or for
completion on ECDIS:
• Appraisal - the gathering of the information available, from all relevant sources, concerning the contemplated voyage
from berth to berth. To avoid wasted effort it should include an appraisal report to the Master before proceeding to the
planning stage.
• Planning - having made the fullest possible appraisal, this stage comprises the construction of the entire route from
berth to berth, together with supporting information.
The appraisal and planning stages provide a framework for the gathering, presentation and subsequent detailed planning and
are completed prior to sailing, while the execution and monitoring stages are completed during the passage.
• Execution - final adjustments to the passage plan prior to departure are made by the Officer of the Watch (OOW) using
the charts and supporting navigational information provided by the navigator.
• Monitoring- conducting the voyage in accordance with the plan from departure to arrival, monitoring the ship's
progress and adjusting the plan if required on passage.
Analysis is an optional fifth stage in the process, where on completion of a passage the plan and its completion are reviewed.
This provides an opportunity to discuss what was done well, what could have been done better and whether anything needs
to be amended to improve future voyages.
This book provides guidance on the appraisal and planning stages of a passage, whether using paper charts or ECDIS. As
elements of the appraisal are common to both paper charts and ECDIS, Chapter 2 contains guidelines for conducting this
stage with both. Chapter 3 covers passage planning with paper charts and Chapter 4 covers passage planning with ECDIS.
3

Passage Planning Guidelines
1.3 Responsibility
Passage planning is not an exact science. It is a skill that is developed with experience and it requires judgment. In all cases,
planning must be supported by comprehensive research and appropriate calculations. Although the ultimate responsibility
for a passage plan will always remain with the Master, it is customary on most deep sea ships for the Master to delegate
the initial preparation of the passage plan to the navigator. A detailed passage plan should be submitted for the Master's
assessment and approval prior to the commencement of any voyage. It is quite possible that there may be more than one
option for the passage plan between the same two ports, so the navigator should present the Master with an assessment
of the advantages and disadvantages to allow a decision to be made. Should the plan require modification or the final
destination be changed, to avoid severe weather for example, an updated version of the plan should be prepared for the
Master's approval.
4

CHAPTER 1 Introduction
1.4 Key to Symbols
The following symbols are used throughout this publication to draw attention to important information.
I •
I •
PL 4.0.0
Relates to cautionary information when passage planning on paper charts.
Important or cautionary information when passage planning on ECDIS.
Highlights important changes that came into force with edition 4.0.0 of the IHO ECDIS Presentation
Library (PL) on 1 September 2017.
Refers to common factors and considerations that need to be taken into account, regardless of whether passage planning on a paper chart or ECDIS.
5

2 Gathering Information
Before any passage plan is prepared there are a number of items to be considered regardless of whether planning is on a
paper chart or on an ECDIS. Research from appropriate references, charts and nautical publications must be undertaken and it
will be necessary to:
• Identify suitable routes after determining all areas of danger and likely environmental factors
• gather supporting details from the reference materials
• undertake an appraisal study
• brief the Master
• select the preferred route.
This stage is called 'appraisal' and it comprises of two steps:
• Preliminary research
• appraisal report.
Information gathered during this stage will be derived from a number of different sources, some of which will be factual and
some drawn from the collective experience of others. Some of the data may require subjective evaluation as to its reliability,
such as the age and quality of survey data used to compile the charts. This chapter provides guidance on the preliminary
calculations and checks that must be completed prior to commencing the 'planning' stage.
7
Passage Planning Guidelines
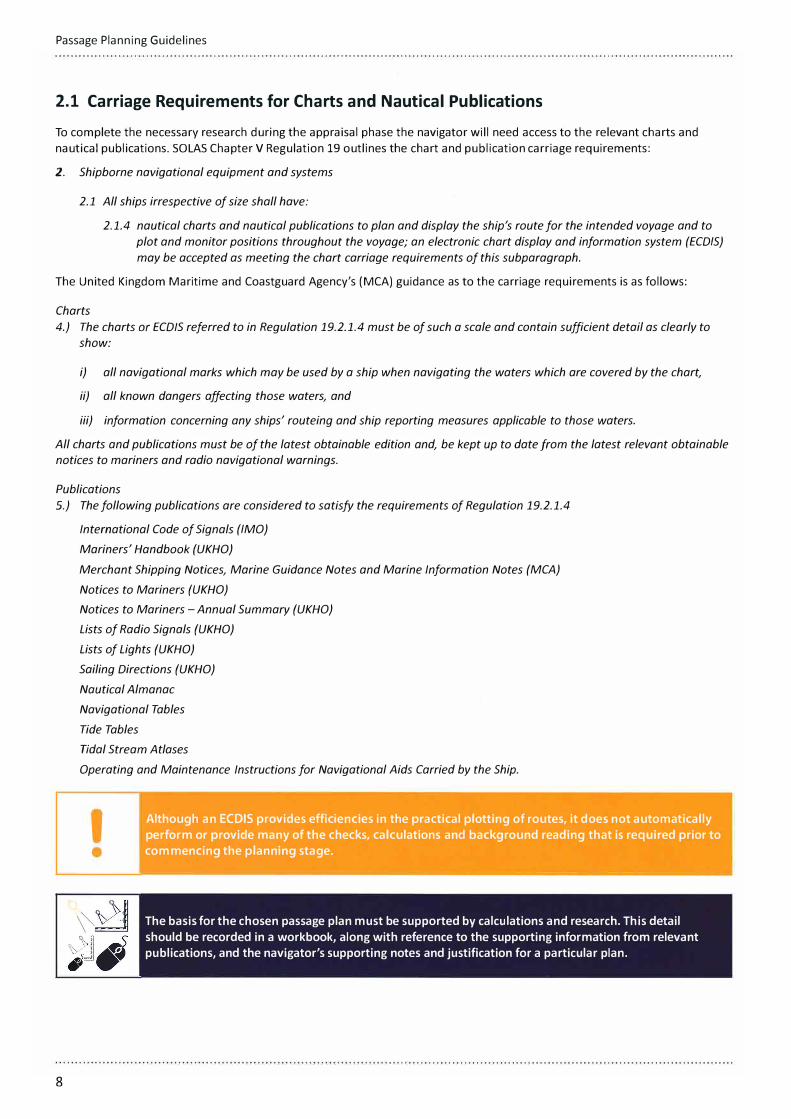
2.1 Carriage Requirements for Charts and Nautical Publications
To complete the necessary research during the appraisal phase the navigator will need access to the relevant charts and
nautical publications. SOLAS Chapter V Regulation 19 outlines the chart and publication carriage requirements:
2. Shipborne navigational equipment and systems
2.1 All ships irrespective of size shall have:
2.1.4 nautical charts and nautical publications to plan and display the ship's route for the intended voyage and to
plot and monitor positions throughout the voyage; an electronic chart display and information system {ECDJS}
may be accepted as meeting the chart carriage requirements of this subparagraph.
The United Kingdom Maritime and Coastguard Agency's (MCA) guidance as to the carriage requirements is as follows:
Charts
4.) The charts or ECD/S referred to in Regulation 19.2.1.4 must be of such a scale and contain sufficient detail as clearly to
show:
i} all navigational marks which may be used by a ship when navigating the waters which are covered by the chart,
ii) all known dangers affecting those waters, and
iii) information concerning any ships' routeing and ship reporting measures applicable to those waters.
All charts and publications must be of the latest obtainable edition and, be kept up to date from the latest relevant obtainable
notices to mariners and radio navigational warnings.
Publications
5.) The following publications are considered to satisfy the requirements of Regulation 19.2.1.4
8
International Code of Signals {!MO}
Mariners' Handbook {UKHO}
Merchant Shipping Notices, Marine Guidance Notes and Marine Information Notes {MCA}
Notices to Mariners (UKHO}
Notices to Mariners -Annual Summary (UKHO}
Lists of Radio Signals (UKHO}
Lists of Lights (UKHO}
Sailing Directions (UKHO}
Nautical Almanac
Navigational Tables
Tide Tables
Tidal Stream Atlases
Operating and Maintenance Instructions for Navigational Aids Carried by the Ship.
Although an ECDIS provides efficiencies in the practical plotting of routes, it does not automatically
perform or provide many of the checks, calculations and background reading that is required prior to
commencing the planning stage.
The basis for the chosen passage plan must be supported by calculations and research. This detail
should be recorded in a workbook, along with reference to the supporting information from relevant
publications, and the navigator's supporting notes and justification for a particular plan.

CHAPTER 2 Appraisal
2.2 Preliminary Research
Preliminary research is based upon the anticipated requirements for the forthcoming voyage.
The navigator must be allowed adequate time to conduct the necessary research. If insufficient information on the voyage
criteria has been provided, then the navigator should seek the Master's guidance.
In establishing whether or not the intended passage is achievable, the following constraining factors should be among those
considered:
• Destination
suitability
distance
time
tidal data
speed and endurance
• weather and environmental constraints
• availability of charts and nautical publications.
The aim is to identify all areas of navigational danger along with any restrictions or hazards associated with the passage,
including logistical factors and support facilities. If early study discovers that the destination is unsuitable for the vessel or the
intended passage is unachievable or hazardous, then planning time has been saved. This research should draw upon up to
date publications issued in printed or digital format by competent hydrographic or navigation authorities.
I •
Some ECDIS planning software can integrate with tide, current and weather databases to provide
specific tools that may aid in the preliminary research process. Information is also available to the
navigator from the relevant electronic navigational chart (ENC) using the 'cursor pick' function or by
reviewing chart notes from any installed raster navigational charts (RNC). However, the cursor pick
method can be time consuming and may not yield information in sufficient detail. Therefore, it is not
a substitute for the use of up-to-date publications issued in paper or digital format by a competent
authority.
Within any passage there will be distinct segments, ie pilotage waters, port approaches, coastal transits
and, possibly, ocean transits. The different segments require differing levels of information, which the
navigator will need to organise into a logical order to enable the Master to have a proper understanding
of the options.
9

Passage Planning Guidelines
2.2.1 Preliminary Research - Destination
Determine the correct destination, including the berth (if known).
2.2.1.1 Suitability
The suitability of the vessel for the destination must be considered by taking into account constraining factors, such as:
• Vessel
competent and well-rested crew
condition and state
draught (including air draught)
serviceability and state of equipment
manoeuvring data
operational limitations
restrictions and limitations
stability considerations
• cargo
• port
any special characteristics (especially if hazardous)
distribution, stowage and securing on board
correct name, latitude and longitude
available port information
restrictions and limitations
minimum charted depths and tidal information
overhead clearances
meteorological and climatological information
length of berths
availability of tugs
availability of shore-based emergency response arrangements and equipment
• up-to-date certificates and documents concerning the vessel, its equipment, crew, passengers or cargo.
Consultation with the 'Manoeuvring Booklet' and the relevant 'Sailing Directions' will help to determine whether any of the
above factors will affect the vessel's ability to enter port at the chosen destination.
10
-�-
Generalm/r,
�ConipubO!/
- - A11a,!abl<:
Actvrsablf,
Othe,
�.: ....
�ETAmessaqe
tslpo'1ofe,,1ry
DE--rill cerhl,r::ite
=. Salvaqe
Ass,o,t
-•-
1 :1
I
,lo
@
®
t: Main Dual AIS Advanced Planning Charts Config Log Book Man Corr Maps Monitoring Navigation Navtex Overlays Targets Tasks Tasks List (]

CHAPTER 2 Appraisal
Figures 1 and 2: Some ECDIS manufacturers provide port databases that contain information such as restrictions, facilities and
services. (Courtesy of Transas)
2.2.1.2 Distance
ENGLISH CHANNEL AND DOVER STRAIT • PASSAGE PLANNING
ISee Chart 5500 Manners Routeing Guide, Enghsh Channel and Southern North
Sea for routeing regulations, reporting requirements, ptlotage arrangements,
informat,on services and other nav1gat1onal advice
Figure 3: Cursor pick may reveal additional relevant planning information. (Courtesy of Transas)
The distances involved in the passage should be calculated to include the total distance berth to berth and the distance
between pilot stations (or recognised point of arrival). Where appropriate, a comparison between rhumb line (RL) and great
circle (GC) distances should be undertaken to establish the shortest route. There are several ways to determine distance and
these include:
• An official chart
• 'Sailings Formula' - whether calculated or tabulated
• 'Distance Tables' such as the 'Admiralty Distance Tables' - can be used to obtain the shortest distance between listed
ports (see Figures 4 and 5).
11

Passage Planning Guidelines
PLACE
Fort Will iam
Foyle, Lough
GALWAY
Holyhead
•1NISHTEARAGHT 15'Wofl
INISHTEARAGHT (5'Nof)
Kyle of Lochalsh
Lame
L iverpool
0LONGSHIPS (J'Wof)
LUNDY (10'W of)
Mallaig
I M ilford Haven I Mull of K intyre
(51/,' SWof) Oban
·ouESSANT, iLE d' (10'Wof)
Padstow
•PENTLAND SKERRIES (2%' W of)
Portmadoc
Portree
Preston
Rosslare
SHANNON, RIVER
SLIGO
•SEIN, RAZ de (2'5 of Pte du Raz)
0 u.
117
343
247 44
373
109
95
148 44
267 21,44
441 44
375 44
77
351 6,44
125 44
35
540 44
411 6,44
266 50
312 44
149 50
262 21,44
315 14.44
358
213
574 1,44
0 ..J
'" >, 0 u.
256
153 24
286
20
135
53 25
173 21.25
347 24
281 6,24
117
257 6.24
33 25
92
445 24
317 6,24
298 53
218 24
187 53
168 21,25
221 14,24
271
127
480 1.24
� I-:,:
� l
(!)
<( <(
(!) a: I-
i:'ic- :,:
0 (!) 395 :,:
I- 0 <( .c ili;: a: �
34 ;;; 94 301 �e �� .c
30 0 :,: z ..J
236 169 265 �in 0 ;;-
25 ., 349 266 378 122 �
46
305 102 335 69 167 30 25 46
425 53 357 189 286 21.25 30 21,25 21.46
326 205 232 363 461 6 25 46
349 140 255 297 395 6 6,25 6,46
330 248 360 104 21 46
332 114 238 272 370 6 6.25 6,46
285 122 314 49 144 26 26 26 46
317 221 347 84 77 44
400 303 306 461 559 6 25 46
346 174 252 333 430 6 6,25 6,46
492 434 522 280 159 53 53 53 53 53
388 70 294 234 331 30 7 25 46
380 323 409 169 21 53 53 53 53
420 60 363 184 281 21,25 30 21.25 21.46
307 92 213 237 335 30 14,24 14.45
66 351 50 250 363 30
161 275 191 107 220 25
438 338 344 496 593 1,6 1.25 1,46
WEST APPROACHES TO THE BRITISH ISLES -TABLE 1b
Note:Sm1lll!al1c f1gure■referlothenote■1tlhebeglnnlngo flhi stable. N ame■lncap!tal1lndicateth1tplacnereal so inildjacent tables. 'lndica1esthat theplaeel11l1o lntheLlnkTables
.,
rn � ..J "'
:i: c-124 "' 020or
�;: c-21 0
296 262 OM
�� 6 ,.,-231 195 90 :::,:::. Cl
..J � ., 6 6
� 1�
149 268 442 376 �� 46
Ell 46 6.46
206 1 100 28 351 �� 6 6 6,46
24 142 317 251 126 226 -se ; 21 6 46 6 .0
122 241 416 350 58 325 99 0 44 21,44 44 6,44 6,44 44
394 360 98 188 540 198 415 514 6 46 44
266 231 47 50 412 67 286 385 6 6 6,46 6 6,44
335 454 628 562 207 538 312 247 53 21,53 53 6.53 53 6.53 53 50
167 127 189 122 313 97 187 286 6 6 46 6 44
224 343 517 451 93 427 201 130 53 53 53 6.53 53 6,53 53 50
119 12 268 201 263 177 137 236 21 6 6 21,46 6 21 21,46
170 146 134 82 316 57 191 290 14 18 6 14,46 6 14 14,44
320 407 282 306 345 288 299 332 25 30
176 296 423 404 202 379 155 187 25 21,25 29 6,41 6,41 26
429 395 133 223 575 232 449 548 1 1,6 1 1,44 1 1 1,44
w ·= c-,_- 0 z c- ;: <( 0
& �;: �� "' ?- w
QC a:
145 w "' 726 598
53 6,53
287 157 499 6 6 53
615 487 150 53 6,53
366 237 449 6 6 21,53
233 114 502 14,53
357 302 506 53
497 439 369 38 53
38 180 761 1 1.53
a: w 388 QC
53 z
133 338 0 � 21,53 z a:
88 391 152 z ., , 14,53 "
<( ,,,, :,: 0
:,i £ 344 394 413 263 "' (!) 53 30 :J o::� 0
341 257 291 344 176 "' ZUJ
2 5 5 3 21.25 13,18,24 WN 322 650 401 267 394 535 '!'-
1,6 1,53 1,6 1
Figure 4: Example from 'Admiralty Distance Tables' of a passage between Milford Haven and Liverpool. The distance shown is for a passage to the east of Grassholm Island, where Note 6 applies (see Figure 5). Red boxes have been added to highlight relevant
information. (UKHO, NP350(1) - 'Admiralty Distance Tables Atlantic Ocean Vol 1'). (Courtesy of UKHO)
12
WEST APPROACHES TO THE BRITISH ISLES - TABLE lb
The Minches. Where routes pass through the Minches, the mean of the distances by the N-bound and S-bound recommended tracks have been used.
Menai Strait, Sound of Islay and Kyle of Lochalsh. No routes, except those to Port Dinorwic, Port Askaig and Kyle of Lochalsh, have been used which pass through these straits. If a distance is required by way of one of the straits, it may be obtained by working it through the tabulated place which lies in the strait. Caledonian Canal. Fort William to Moray Firth (North Sea Table (Id)) through Caledonian Canal is 68 miles.
Notes: I W of lie d'Ouessant. 2 W oflsles of Scilly. 3 E of Isles of Scilly. 4 N of Lundy. 5 S of Lundy.
I 6 E of Grassholm. ! 7 W of Bardsey Island. 8 W of The Smalls. 9 E of Anglesey.
Figure 5: Note 6 relates to the passage between Milford Haven and Liverpool. The red box has been added to highlight relevant information. (UKHO, NP350(1) - 'Admiralty Distance Tables Atlantic Ocean Vol 1')

CHAPTER 2 Appraisal
L\IH TY\KERS
I. The Smalls and Grassholm ( .'i 1 .J<, ·
5 .JO"\\). Laden tankers shnuld ,n nid the area
hel\\een The Smalls Tralfic Separation Scheme·
and The Smalls. Laden tankers O\Cr 10 000 C,Rl
should 1101 use the' channd het \\ccn Grasshnlm
and Skomcr Island unless 1110, ing bc1,, cm
S. Bri,k\ Ha� and \lilford H,l\cn.
Figure 6: Chart showing the route listed in the 'Admiralty Distance Tables' between Milford Haven and Liverpool (blue pecked line) passing east of Grassholm Island (that is not suitable for laden tankers over 10,000 GRT) and a longer route via The Smalls TSS.
Source: British Admiralty Chart 1121 (Courtesy of UKHO)
Distances obtained from distance tables provide the shortest distance between listed ports taking into account the normal
navigational constraints, such as headlands or offshore hazards for coastal passages (see Figure 6) and GC distances for
ocean passages. Any accompanying notes should always be consulted. However, the distance tables do not take into
account ocean currents and prevailing weather conditions, nor do they always route via traffic separation schemes (TSS).
Therefore, distances from the 'Admiralty Distance Tables' should be used in conjunction with advice from the relevant 'Sailing
Directions' or 'Ocean Passages for the World'. Distance tables can be integrated with some types of ECDIS software (see
Figure 7). Note that distances given in 'Ocean Passages for the World' are to the nearest 5 miles for passages of less than
1,000 nautical miles (nm) and to the nearest 10 miles for passages over 1,000 nm.
When undertaking ocean passages, consideration must always be given to the advantages (or otherwise) of selecting a
GC instead of an RL route. The difference in distance between RL and GC routes will be most significant on passages in a
predominately easterly or westerly direction at higher latitudes (see Tables 1 and 2).
Latitude RL Distance (nm) GC Distance (nm) Difference (nm) Difference {%) Difference of
Longitudes
3000 2965 35 1.17% 67°
30°
4000 3914 86 2.15% 87°
5000 4818 182 3.64% 105°
3000 2899 101 3.37% 80°
45°
4000 3748 252 6.30% 104°
5000 4476 524 10.48% 127°
3000 2705 295 9.83% 109°
60°
4000 3285 715 17.88% 142°
5000 3585 1415 28.30% 175°
Table 1: Comparison of RL and GC distances at various latitudes.
13

Passage Planning Guidelines
Passage RL Distance GC Distance Difference (nm) Difference (%}
Difference
Location A Location B (nm) (nm) (Longitudes)
Land's End New York 2925 2832 93 3.18% 68°
San Francisco Tokyo 4769 4523 246 5.16% 98°
Wellington Valparaiso 5429 5014 415 7.64% 116°
River Plate Cape Town 3726 3630 96 2.58% 74°
Durban Perth 4368 4244 124 2.84% 84°
Strait of Gibraltar New York 3242 3161 81 2.50% 68°
San Francisco Wellington 5860 5849 11 0.19% 63°
Land's End River Plate 5777 5765 12 0.21% 51°
Table 2: Comparison of RL and GC distances for various trans-ocean passages.
When referring to a geographical index, ensure the correct port has been selected as many ports have the same name.
Publications such as Norie's 'Nautical Tables' or the 'Ports of the World' contain a list of ports with their corresponding
latitude and longitude. It should also be noted that the latitude and longitude of a port listed in 'Admiralty Distance Tables'
is normally that for the pilot station or anchorages given in 'Admiralty Sailing Directions'. This could result in significant
differences to the overall distance berth to berth.
14
Regardless of the method used to determine distance, it is recommended that any distance calculation is
cross checked by another means.
From Port
Distance i 11 954,67
Routing Options Filter I ',-:---�
El Control
Kiel Canctl
Panama Cenal
Suez Canal
Maximum Draft 11 m, ship length 310 m and width 42 m.
la Auto Cale la Zoom to Route
J'J Zoom #) In fJ Out I X Pan 60° 07.992'N 142° 52.282'E
';.I � ..
OK Cancel I
Figure 7: Example of distance table integration with ECDIS planning software that allows the automatic generation of routes.
(Courtesy of Transas)
At this stage in the planning process, although a high level overview of the route may have been
identified, the final route can only be confirmed at the end of the appraisal stage.

CHAPTER 2 Appraisal
2.2.1.3 Time
The total amount of time (measured in hours) available to complete the passage must be calculated to confirm that it is ' elow the maximum speed of the vessel and, preferably, at an economical speed. Some allowance for delays should be made, especially when the overall passage speed is close to the vessel's maximum. For passages through several time zones, it is prudent to convert all times to a single common time zone (such as UTC) to avoid any ambiguity. Details of the local (legal) ime, including the periods of Daylight Saving Time, are listed in the 'Admiralty List of Radio Signals Vo/ 2'.
2..2.1.4 Tidal Data
- al conditions at the departure and destination ports should be ascertained in case it is necessary to achieve certain tidal., indows that may constrain the timing of departure and arrival. This will depend on the required minimum under keellearance {UKC), overhead vertical clearances, strength of tidal stream or current and any port regulations. Consulting 'Tide
- bles', 'Tidal Stream Atlases' and relevant 'Sailing Directions' will help to determine this. The following are considerations., it regard to the vessel conducting the passage:
• Tidal constraints
times and heights of tide {HoT) at high water (HW) and low water (LW), plus the% springs rates (see Figure 8) o charted depths and HoT from the 'Tide Tables' are referenced to the local datum of soundings (see Figure 9)required UKC, taking into account the vessel's draught, an allowance for squat, a safety margin and the predictedHoT (see Figure 10)overhead clearanceso vertical clearances are normally referenced to the highest astronomical tide (HAT), listed in 'Admiralty Tide
Tables', Table V, Part 1 for Standard Ports and Part 2 for Secondary Ports (see Figure 9)times and strengths of tidal stream or current (see Figure 13)
• port regulations and restrictions
draught/UKC permissible in fairways and port restrictions with regard to port sailing times availability of pilot and tugs.
(Tidal Range of the Day -Mean Neaps tidal range)% Springs Rate = . . . x 100
(Mean Spnng tidal range - Mean Neaps tidal range)
For example, Mean Spring tidal range= 4.7 m, Mean Neaps tidal range= 1.8 m and Tidal Range of the Day= 3.7 m (3.7 m -1.8 m) {1.9 m)
% Springs Rate= (4_7 m -1.8 m) = (2_9 m) x 100
=65%
Figure 8: Calculation of% Springs rate, to aid interpolation between the predicted Spring and Neap strength of tidal streams.
15

Passage Planning Guidelines
The relationships between the various tidal levels is shown in Figure 9.
clearance I Charted vertical
Highest Astronomical lide ..... . Mean High Water Springs ..... . Mean High Water.Neaps ...... .
Mean Sea Level
Mean Low .water Neaps ....... . Mean Low Water Springs Observed ········•······························· depth
Chart datum
seaoe6-------.U
Area without dredging regime
Charted depth (maintained or dredged depth)
t Overdredge
Area with dredging regime
Figure 9: Standardised depth terminology (UKHO, NP100 - 'The Mariners Handbook').
(Courtesy of UKHO)
The limits of safe water when leaving or entering a harbour should be calculated using the formula in Figure 10. This will allow the depth value for the 'no-go line' to be calculated prior to drawing tracks on a paper chart, or the 'safety depth' value that will be used prior to constructing a route in ECDIS.
Overhead Clearance = (Charted vertical clearance + (HAT -HoT)) -Air draught
eg Air Draught= 40 m, Charted vertical clearance = 39 m, HAT= 6.1 m, HoT = 2.2 m :. Vertical Clearance= 39 m + (6.1 m -2.2 m) -40 m = 2.9 m
�z�� Charted vertical clearance
Highest astronomical tide ♦
1 Overhead vertical clearance
I
t
Waterline
- - - - - - - - +_ -t Height of tide (HoT)
Chart datum
16
-----.------
No-go line/Safety depth= (Draught+ squat+ minimum UKC) -HoT eg Draught= 10.5 m, squat= 1.5 m, minimum UKC = 2 m, HoT = 4.3 m
:. No-go line/Safety depth= (10.5 m + 1.5 m + 2 m)-4.3 m = 9.7 m
Figure 10: The calculation of the no-go line, or safety depth, is used to define safe navigable water.
1 Charted depth ♦

CHAPTER 2 Appraisal
From the example calculation in Figure 10, charted depths of 9.7 m or less should be clearly marked on the chart as being
unnavigable and unsafe. If a no-go line of 9.7 m prevents the vessel from safely navigating for the HoT used in the calculation,
then the navigator should determine the times of the tidal window where the HoT will allow safe navigation, for the minimum
UKC and/or overhead vertical clearances, within the port and its approaches. The minimum UKC and overhead vertical
clearance should be agreed with the Master from the outset. To determine the minimum HoT to ensure sufficient UKC is
maintained over a shallow water area, the calculation in Figure 11 should be made:
Minimum HoT required = (Draught + squat + minimum UKC) - minimum charted depth
For example, draught= 10.5 m, Squat= 1.5 m, minimum UKC = 2 m and minimum charted depth is 8.2 m
Minimum HoT required = (10.5 m + 1.5 m + 2 m) - 8.2 m
=5.8m
Figure 11: Minimum HoT calculation to ensure sufficient UKC.
To find the maximum HoT to safely pass under a bridge or cable, the calculation in Figure 12 should be made:
Maximum HoT = (Charted vertical clearance+ HAT) - (Vertical clearance required+ air draught)
For example, air draught= 30 m, charted vertical clearance= 29 m, HAT= 5.3, minimum required clearance= 2.0 m
Maximum HoT = (29 m + 5.3 m) - (2 m + 30 m) = 34.3 - 32 m
=2.3m
Figure 12: Maximum HoT calculation to pass safely under a bridge or cable.
I •
Although horizontal datum within ENCs is standardised to WGS84, vertical and sounding datums
may differ between chart producers. For example, many European ENC producers use mean sea level
(MSL) for vertical and sounding datum, while others use mean high water springs (MHWS) for vertical
datum or lowest astronomical tide (LAT) for sounding datum. Where datums are not standardised,
values will equate to those used on the equivalent paper chart or source data.
Tidal calculation software is widely available as an alternative to traditional paper tide tables and tidal atlases.
! � � � � � 10Jµae2013141]
00' 00 O' N 000' 00 O' E G!<::> 0-0• oh· Filter X
+ ., Al ■ 0062 SOUTHAMPTON c::::i @] lX .� .:...".:�:'.':'.'.'.:::::.:::'.'.:'._ __________ __:::::::::::::===: • �B
• �c
• �c
. �c
.�c
. �c
• �c
• �c • �D
• �E
• �E
• �F
•J .,Fr
+J .,Fr
• �G
• �G;
• �G
• �G
• �G
.,�G
• �le
50"53'N1 °24'W 10/0612013 14:11 4.2m Zone +0000
Standard port �:��iM
jo.o Hours •!
� Graph � HWLW � Heights [ Levels
5_0 TidalHeight{Metres)
4.5
4.0
3.5
3.0
2.5
2.0
1.5
1.0
0.5
o.o+---+--+- -+--+-+- -+--+-+----11---+-+----I
12:00 14:00 16:00 18:00 20:00 22:00 00:00 02:00 04:00 06:00 08:00 10:00 12:00 11106/2013
No clearance heights or depths have been set Predicted heights are in metres above Chart Datum
■
Duration�
UT(GMT)"
--
---
111
..... _ ---
.. N Venlnor 1.Jm17:19+�
---
Figure 13: Official tidal databases such as 'Admiralty Tota/Tide (ATT)' can be used as a standalone application or integrated with ECDIS to assist with HoT and tidal stream predictions or for calculating times of astronomical events. (Courtesy of UKHO)
17

Passage Planning Guidelines
Figure 14: An example of ATT integrated with ECDIS. (Courtesy of OSI)
CALSHOTSPIT
I I
I I
I I
I I
I I by East Knoll
Thom Knoll/
I I
I I
I I
/ by Royal London
/ �
BRAMBLE BANK
Ll
East Knoll
Figure 15: An example of a tidal database provided by the ECDIS manufacturer. (Courtesy of Transas)
The calculations resulting from this research should identify relevant tidal windows and provide an estimated time of
departure (ETD) and arrival (ETA).
18

CHAPTER 2 Appraisal
2.2.1.5 Speed and Endurance
The overall speed required to achieve the ETA can now be calculated. Consider whether any of the following will affect the
calculated overall speed:
• Speed constraints
economical speed range and maximum speed
environmental factors
limits and restrictions
machinery limitations and defects
• endurance constraints
bunker capacity
fuel economy
minimum reserve of fuel
bunker availability
stability.
To conduct the majority of a passage at an economical speed, it may be necessary to proceed for a short period at a higher
speed. The formula shown in Figure 16 calculates the time necessary to proceed at higher speed to reduce to an economical
speed for the remainder of the passage.
0-HTt= 0-H
Where:
t =
D =
T =
0 =
H =
time required to proceed at higher speed
distance (nm) from start of passage to point of arrival
time (hours) from start of passage to required ETA at point of arrival
higher speed (kts) to be used
economical speed (kts)
For example: The navigator is planning a passage for a vessel with an economical speed of 10 kts and a maximum speed of
16 kts. There are 42 hours to complete the passage of 500 nms between departure and arrival points. The average speed
required overall is therefore:
500 nm/42 hrs = 11.9 kts
Therefore, the length of time to proceed at a higher speed (16 kts) in order to reduce to the economical speed (10 kts) for
the latter part of the passage is:
500 -(10 X 42) 500 -(420) 80 t = ------ = ----'---'- = - = 13.33 or 13 hrs 20 mins
Speed
16 kts
10 kts
Total:
16-10 6 6 Time
13 hrs 20 mins
28 hrs 40 mins
42 hrs
Distance travelled
213.33 nm
286.67 nm
500nm
The navigator should then compare the fuel consumption figures to see whether initially increasing the speed to complete
the majority of the passage at an economical speed will achieve an overall saving in fuel compared to proceeding at 11.9 kts
for the entire passage.
Figure 16: Calculation to determine the time remaining at a higher speed, prior to reducing to a lower speed for the latter part of a
voyage, while maintaining the required ETA.
I
I
If, by this stage, the voyage criteria is assessed to be unachievable, the Master should be advised at
the earliest opportunity.
19
Passage Planning Guidelines
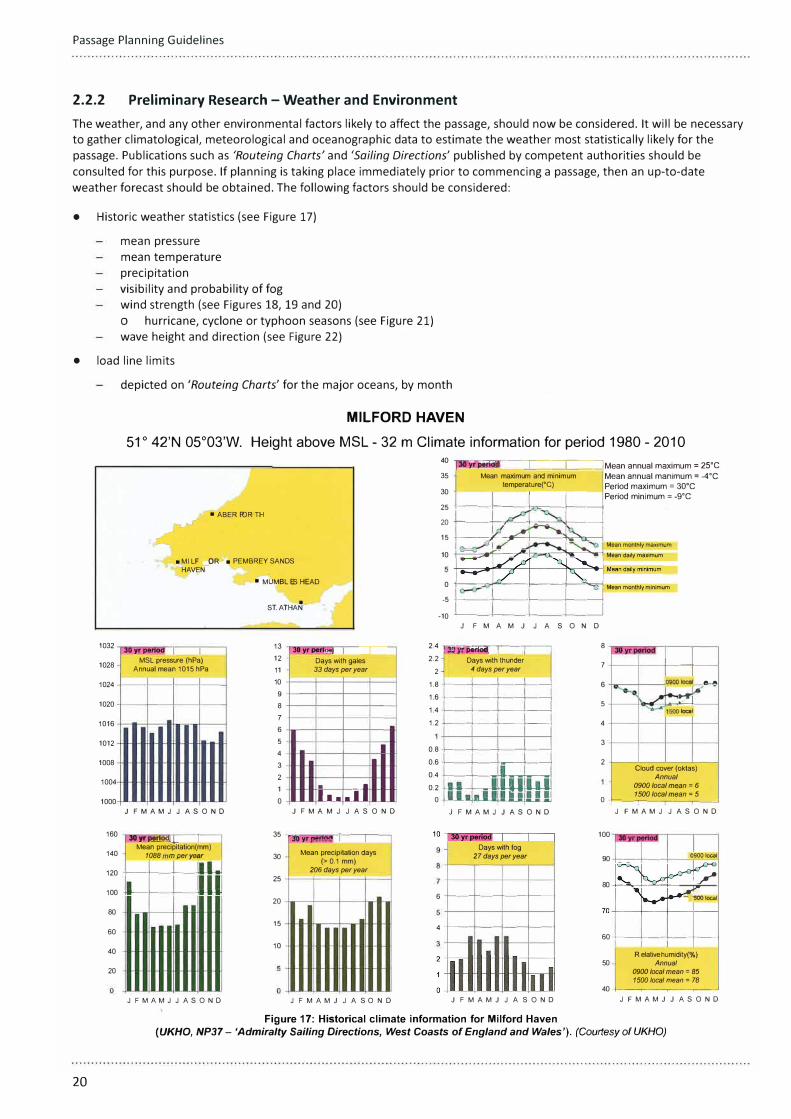
2.2.2 Preliminary Research - Weather and Environment
The weather, and any other environmental factors likely to affect the passage, should now be considered. It will be necessary
to gather climatological, meteorological and oceanographic data to estimate the weather most statistically likely for the
passage. Publications such as 'Routeing Charts' and 'Sailing Directions' published by competent authorities should be
consulted for this purpose. If planning is taking place immediately prior to commencing a passage, then an up-to-date
weather forecast should be obtained. The following factors should be considered:
• Historic weather statistics (see Figure 17)
mean pressure
mean temperature
precipitation
visibility and probability of fog
wind strength (see Figures 18, 19 and 20)
o hurricane, cyclone or typhoon seasons (see Figure 21)
wave height and direction (see Figure 22)
• load line limits
20
depicted on 'Routeing Charts' for the major oceans, by month
MILFORD HAVEN
51 ° 42'N 05°03'W. Height above MSL- 32 m Climate information for period 1980- 2010
■ ABE RPORTH
■ MILFORD ■ PEM B REY SANDS
1032
1028
1024
1020
1016
1012
1008
1004
1000
HAVE N
JO yrpe...,.. I I MSL pressure (hPa)
Annual mean 1015 hPa
J FMAMJ J ASOND
160 JO yr pertOCILk- I
Mean precipitation(mm) 1088 mper�o/.- _ 140
120 +--+--+------
100 -ta--+--+- ---
80
60
40
20
JFMAMJJASOND
■ MUMBLE S HEAD
ST.ATHAN
13 12 11 10
9
8 7 6 5 4 3 2 1 0
35
30
25
20
15
10
·JOyr��....!..,_..J..._ Days with gales
33 days per year
-
.d I■• JFMA MJJASOND
;JOyr-, I I
Mean precipitation days (>0.1 mm)
206 days per year
JFMAMJJA SOND
40 �filii@ir-J:::=C::::---7Mean annual maximum = 25°C
35
30
Mean maximum and minimum temperature(°C)
25 +-- -+----tn.c--+- ------i
20 +-- -+-=-+-==�-------i
15 +-----::,1'-----,L-+-- -'!..-¾�
Mean annual manimum = -4 °C Period maximum = 30°C Period minimum = -9°C
Mean monthly maximum 10 t-"'='.:'�"F---::7""'-+,-;'""'1:---="1-...,---""-....-1 Mean daily maximum
0 +-�-=---+---+-�- Mean monthly minimum -5 +-- -+-- -+-- -+--------<
-10 �--+---+-- -+--------< J F M A M J J A S O N D
2.4 -,..,,;;;-::<�-��--::_.r_-
_--,--,
2.2 2
Days with thunder 4 days per year
1.8 +---+- --+--+ ---I 1.6 +---+----+----+---; 1.4 +---+- ---+----+----l 1.2 +---+---+---+----I
0.8 +---+---+ --+ ---I 0.6 +---+- ----+,�--+---; 0.4 +---+----HO--..--+�--< 0.2 +-IIC-.--+-�--..... .-.-
0 +-_.._,-+-■._._--+-'L,0---+----...., J FMAMJ J ASOND
Days with fog 27 days per year
6 +---+----+----1----l
4 +---+----+----1----1
JFMAMJJA SOND
8
7
6
5
4
3
2
d ---l..d'
71 �l
Cloud cover (oktas) Annual
0900 local mean = 6 1500 local mean = 5
0 +--�-�-�-� J FMAMJ J ASOND
100
90 -t::--::-----t- ----t-- J§oo local
,-0� 80 -+-----<--�-+---..
,..
L�'
60 -+---<----+----+----1
50 Relative humidity(%)
Annual
0900 local mean = 85 1500 local mean= 78
40+--�-�-�----' JFMAMJJASOND
Figure 17: Historical climate information for Milford Haven
(UKHO, NP37 - 'Admiralty Sailing Directions, West Coasts of England and Wales'). (Courtesy of UKHO)

!
I
CHAPTER 2 Appraisal
Lql!Ude 5"WftllromG,..-,
WlnddistribulionMAYj1,112.2) Percentage frequency of winds BHulort fore• 7 or over MAY j1.11S.2) Swelldl1tribtJUonMAY{1.96.2)
Figures 18, 19 and 20: Wind direction and speed, and swell distribution for the west coast of the UK in May ( UKHO NP37 - 'Admiralty Sailing Directions, West Coasts of England and Wales'). (Courtesy of UKHO)
Area & Local name
North Atlantic. West Indies region (hurricane)
North-East Pacific (hurricane)
North-West Pacific (typhoon)
North Indian Ocean Bay of Bengal (cyclone)
North Indian Ocean Arabian Sea (cyclone)
South Indian Ocean W of SOE (cyclone)
Australia W. NW. N coasts & Queensland coast (hurricane)
Fiji, Samoa, New Zealand (North Island) (hurricane)
Table showing principal areas affected and months in which tropical storms normally occur
Jan Feb Mar Apr May Jun Jui Aug Sep Oct Nov Dec
I I I II ..
I/'
I If ,,
;
I/
1i//ll I L-
Iii/ I
II I_
II 1-II 1_
,,'' 1111/l I ·1-
StarVFinish of season Period of greatest activity Period affected when season early/late
Column A: Approximate average frequency of tropical storms each year Column B: Approximate average frequency of tropical storms each year which develop Force 12 winds or stronger
Tropical Storm Table
Figure 21: Historical information relating to tropical storm frequency ( UKHO, NP136 - 'Ocean Passages for the World').
(Courtesy of UKHO)
A B
10 5
15 7
25-30 15-20
2-5 1-2
1-2 1
5-7 2
2-3 1
7 2
21

Passage Planning Guidelines
22
goo
60°
go0 West
60°
SOUTH AMERICA
60°
30° oo30° 60° go•
ASIA
AFRICA
,.
-- Percent frequency of wave height 6 metres (20 feet) -- Percent frequency of wave height 3.5 metres (12 feet)
30° Meridian 0° of Greenwich 30° 60° East go•
Wave Heig
Figure 22: Percentage frequency of wave heights for July (NP136- 'Ocean Passages for the World'). (Courtesy of UKHO)

CHAPTER 2 Appraisal
)0 120° 150° 180° 150° 120°
goo
_I
---'--- -�-�-�-�-�-�-�-�-�-�-�-�-�-�-�-�-�-�---,
�
)
ASIA
120°
Y (1.25c)
150° Longitude 180° from Greenwich 150° 120° gQ0 West
23

Passage Planning Guidelines
• likely statistical environmental conditions
ice limits
ocean currents
tidal streams for coastal passages (see Figure 23).
8EFORE C,_UTION•D""IOU>everystrcngt1IHOl1idal11t .. m1,nM1me,
1 or lh• 1,01 cow,.., by 1h11 anu. many edd,.1 may o«�r WM,a pOH•ble-ind>C,111,onolltleJ.ee<ld .. 1hubetn.,cJW..,ln
::"Jn��::a!ha•• ii .,u, .. ..,..,,,.ICl<lnl "''°'"'"I""' Ol 1he eddfff 131 HIGH WATER DOVER
II ...:II
30' RE PU 8 L ! C
JO' , ,.
•. ,.
30'Loogi1ude $•was1 from Greenwieh 4° ,.
I 3 I HIGH ���R
OOVER
lo 1�h
�=� �L
�����H.\VEN
.. , .
'"-' \� ·-·.....,,,.,, 0 �
Bl,WastLo.,gh� •� ✓ �•,.,,.,o �\ \ -oe /
NORTHERN -� 21,37 15 E NG LAND
LoughSlrollfl/oro 1 ,....._21,31 ' IRE l AND
' 'o /'
So t ,CJ'
·ca,
/,/ �-, t .;f "
...: loui,l>Calllllgforn
t \ ,,-01,12
......... 06,11 ,,,o Os,18 - ,,,,.
SLACK ✓
JO' REPUBLIC
� 01,02 ...
JO'
�
JO'��,-. -�- -, ,.--,JO-.L .. -,..,-,-+i••-w,-,-lfrom�G-,...,..,,-. -, j'.--,30 - ' -�-�•JO
'
Figure 23: Predicted direction and rates of tidal stream shown in
tidal stream atlas (UKHO, NP256 - 'Tidal Stream Atlas Irish and
Bristol Channel'). (Courtesy of UKHO)
24
'Routeing Charts' provide information additional to that
given in 'Ocean Passages for the World' and 'Sailing
Directions' (see Figures 24 to 27).
_,, l "
, . .. ,
/ 'r- l"
' \, . .., �-
NORTH ATLANTIC OCE�N
11--; "''-<;-
Figure 24: North Atlantic Routeing Chart for July
(UKHO, Chart 5124(7)). (CourtesyofUKHO)
Figure 25: North Atlantic Routeing Chart for July
(UKHO, Chart 5124(7)). (Courtesy of UKHO)
I For��-Ocwl�bTheWoo1d{HP135)and�t191anceTeblellAdlsllleac-(NP36ClllD.
Figure 26: North Atlantic Routeing Chart for July showing
tropical storm tracks and percentage frequency of winds greater
than Force 7 (UKHO, Chart 5124(7)). (Courtesy of UKHO)
Figure 27: North Atlantic Routeing Chart for July showing
percentage frequency of fog (UKHO, Chart 5124(7)).
(Courtesy of UKHO)

CHAPTER 2 Appraisal
When appraising possible routes for an ocean passage, the effect of the expected currents, tidal streams and wind on a vessel's speed should be taken into account . The effect of the environmental factors will be greater on lower powered vessels. 'Ocean Passages for the World' recommends routes for power driven vessels as follows:
• Full powered vessels, able to maintain 15 kts or more, should normally be capable of following the shortest routebetween ports
• moderate powered vessels, typically proceeding at 10 kts, should follow the routes for moderate power vessels thattake into consideration the effects of currents and weather. Although the routes may be a greater distance thanrecommended for full powered vessels, they are expected to be of a shorter duration than the most direct route
• low powered vessels, or those hampered to 6 kts or less, are advised to consider the recommended routes for sailingvessels where the effects of currents, tidal streams and wind are described in greater detail.
'Ocean Passages for the World' uses the following colour convention for route diagrams (see Figure 28):
• Blue indicates routes in either direction
• red indicates north and east bound routes
• green indicates south and west bound routes
• pecked lines indicate moderate or low powered routes.
65° 60° 55°
. 1 Diagram 2.691
60°
55°
40°
35°
30°
50° 45° 40
° 35°
Lettered Position
BS 42°30' N, 50°00' W
A 57°50' N, 18°00' W
B 61°14' N, 6°40' W
30°
25°
20°
15°
100
�' ,.�.
50 oo
50
FRANCE
La Gironde
NORTH AFRICA
50°
45°
35°
30°
60° 55° 50
° 45° 40°
Lon itude 30°
West from Greenwich 10° 50
oo 50
10°
Position BS (42" 30'N. so• 00'W) +-----+ Europe (2.69)
Figure 28: Recommended routes between Europe and North America for full powered (blue coloured routes) and moderately powered vessels (green coloured west bound routes) (numbers refer to NP136 paragraphs).
(Courtesy of UKHO)
25

Passage Planning Guidelines
In addition to the use of printed publications for assessment of weather and environmental information, some ECDIS can
integrate with weather routeing services. Where this capability exists it may be necessary to construct a route in ECDIS,
although an approximate route is all that is required at this stage.
I
,/ /
1/ IJ
/1 : 1 s,oo_o,000
" ..
1 02-os-2013
104:oo I 01:00
---- --,-
-I I
Weather From 01-05-2013 To 10-05-2013.
Play Ahead
I I I I I I L�----4----�----�-----�----�-
I 57 I I I I I h.,
..I I I I I I I I I I
, .... , --·
[2] Weather Cursor
Options
w Weather Graphs
Options
Wind
I ,. I I nl
L---- m�1----� ..... -- 1
15
I I I I I I
, .... , 02-0&-13
Figures 29 and 30: Some ECDIS passage planning software facilitates the simulation of likely weather conditions, allowing optimal
routes that avoid certain weather patterns to be identified. (Courtesy of Transas)
26

CHAPTER 2 Appraisal
It is also possible to use ECDIS to display chart products that can help ascertain the existence or extent of ice. This is
particularly important when planning to use a GC route at high latitudes or when planning to travel through or near areas that
are prone to ice formation (see Figures 31 and 32).
149'00N 10nm
48'00N
47'00N
1: 3
72"00N
71"00N
10nm
70"00N
69"00N
136"00E 137"00E 138°00E
Ice charts
01-10-08 09:00
I .C\/ � '\__j
I ◄�
1� / j
\ 47'00N
) �\000,000
145°� 135°00E 136"00E 13rOOE 08'00 / 139"00E 140"00E 14!-oOE 144"00E �
Figure 31: An example of an ice chart overlay. (Courtesy of Transas)
SO"OOE 51'00E 64'00E 65'00E 66'00E
a ri_mo
72"00N
,UP
�
F�;,.
71'00N
3J
]
Figure 32: A satellite image that can be used to show ice formation relative to land mass.
(Courtesy of Transas)
70"00N
◄
69'00N�
27

Passage Planning Guidelines
2.2.3 Preliminary Research - Passage Planning Guides
These Guides, prepared by Witherbys, are updated on a two-year cycle to incorporate the latest guidance and practical advice
for ships transiting the areas that the guides cover, including:
Passage Planning Guide Passage Planning Guide G,,._...,tBurrc,Recfm,lTom S1ut Erigl,1h (hurn,cl Dove, Stro,t and Southcrr> Norlh Seo
Straits of Malacca and Singapore (SOMS) Great Barrier Reef and Torres Strait English Channel, Dover Strait and
Southern North Sea
The Guides bring together all the regional information required in the appraisal and planning stages and have been carefully
compiled with the assistance of navigating officers, shipmasters, deep sea pilots, marine advisors, navigation superintendents
and other appropriate organisations that have an interest in the respective regions.
�;:-.:;.'::,-;:..--:::!i':::i'.."C'""'" .. _ .. .,... .. _ .. ... -���- _.. .... -.-0... ...... -- ...... ..
:::s:E:::-:�=� ! .. _._....., .... __._.., __ ...,.....,_"" __ ...
� ... _ ........... _ .. _._°"""" ..... .....-'7--,;-'7":":= ..... "' .. '-�-si:-_.,_ __ .,_ ... _ _..,. __ .,_""'_. .. ___ .._.,......,__,., .... �..!!'.�i\i"._..°'" --- ................... ....i.,
, __ .. ,,_,o,,w., ·-- ... ,_,o,,im, U<- '-•-
l<ld1 '-"- ._,,_,,_,�
�---.... -.... �----�--...... ___ .__ .... _ .. ._
teg4
��- ··d-� "·.:·:·: .. :·•.•.·.·.··· ·.· ..·
,.·'-·.,,.1-.··.,,�.;:)'<
1
�_.t;_�.-.�-.1, .. /:..,,,,,.ifr:.;:;
•···•· .. •··
/><� ·_j/4· - ·--�--- I/ ,. . /· f. // ...j,. "'=- ··. ··... /
./ ��'-1 .,!,, . /' t -::-.!,c: .... .,,,/ .•· -� ...£- //
d= . 1=-=71 / b .,/ ...
. .L
_......,..,._,.. __ ..,. .. _ _ .., ______ ,. __ ,,..,...,_...,.,_,.. __
The Guides include full-colour pull-out chartlets that accompany detailed passage information for each leg of the voyage,
ensuring that they provide ongoing support and guidance as you complete your voyage through the area.
Watch for eastbound vessels, container ships in
particular, crossing over to Eastern Boarding Ground 'A'
Jerffes _,,,,, _,,,. (Heaviest frequency
✓.,,, ✓ during daylight hours)
� TRAFFIC CROSSING ....,. _ � Watch for eastbound vessels,
n fr\ container ships in particular, crossing
� �
o,ecoofo<em Boa
:
Grn,od:✓
: _.,,.,....---
.. �!!!!!!!!!l!!!!!!!!!!!!!!-�✓a:::./::::.....,� � Large vessels / Deep Draught to
21,
proceedatnomorethan 12
L knots over the ground from here.
2 ___..---..
71 5136
� A-r;y BERHANTI 0 I( I )W!�s I 6n\ I 3M
RA ON(B) j_FI 0
Key information, including the main traffic and ferry routes through the region and details of local craft such as tugs and tows,
and where they are currently found as their routes change with reclamation works, are also covered. Details of crossing traffic
and likely times of day when they may be encountered are given, as are the areas where concentrations of fishing vessels are
to be found along with any times of day, tide, season or their typical behaviour with regard to through traffic.
28

CHAPTER 2 Appraisal
1. 7 .15 Botu Berhonti and Tidol Streams in thot Areo
Port 1 Background and Supporting Notes
to the Guide
TheBatuBerhantibuoywas installedin1970bytheMalaccaStraitCoundl{MSC).
The purposeofthe8atu Berhantillghtbuoyls:
To identify the shallow water oreo in the eastbound TSS to ira:licole the outer border of the deep water route to mark the entrance to the East Keppel Fairway to irw:licole the western border of the precovtionory oreo.
The Botu Berhonti buoy is o steel-mode swift current light buoy that is anchored, using 8 tonnes of ballast, Of\ o relatively small plateau of rock about 20 metres below mean sealevel.
Prevoiling current at Botu Berhonli = 0.3 knots in direction 250·255°(T) Maximum tobulo!ed tidal stream at Botu Berhonti .. 5.6 knots in direction 058G{T)
Tidol range at Botu Berhonti""" MHHW 2.6m, MUW 0.6m, Tidal Range= 2.0m
' Tidal vo/UeJ bas«l on Polua Samba, located 2' SE
The Botu &emanti IM>loted Danger Sooy (In 1�onesion, Batu means stone o� llerhonti means slop) CourlMy Ma/o"oS1111r1Courx:,I
CroH Sectional Representation of the TSS ot Botu Berhonti (lmcJ9e bc.o-1 or, on original �ept by i/,c Mukim, Sfroir C01JtKil 2016/
Tidal Streams in the vicinity of Botu Berhanti
Port 1 Background and Supporting Notes
to the Gulde
Note/, The tidal stream charts shown below ore for md1cotive purposes only to show how the tidal !>tream builds up m the hours after HW, when the tide 1s on the maximum ebb Dunng Spnng tides, tidal streams m this area ore further mfluenccd by the nearby islands and will not always flow m the directions shown here
Singapore HW +Bhr. / -5hrs
AboutTideTech This sample of tidal stream data was prepared by Tide!ech who ore providers of tido! stream data and ocean currenls. Tidetech's data scientisn manage large scale meteorological and oceanographic data$etS, which allows them to provide accurate and validated metoceon data with a global coverage comprising of weather, wove doto and other meleo parameters based on their customers request.
www.ridetech.org
General information on tidal streams are detailed together with experience of how they are found to behave in specific areas
and their impact on ship manoeuvrability in those regions.
At constrained legs of the passage, details and particulars of UKC in the region and the impact of any other environmental
considerations on UKC, including their application to static and dynamic values of UKC, are taken in to account.
Annex 1 - SOMS Pre-Entry Bridge Team Meeting
---
eC°"'=' ...... ='-'="'=,-- -
----i TidatW...dc.wc.ak-OFI
=�- -+-----1 "'-�· =-=-=-�-f=-----i-----i i=-----<- -t------1 t-
'"~· ··--�- --+-- --,
t-'�_w_..,.�"---+------< r::::::=•=:.=.-.�..,. --F----,
Chedrut for SOMS Pre-Entry Bridge Team Meeting
n,..,.. _ _.,f,..,10.000,n.+o.....,ol ... _ol_...i ��,--. A'9""-_ol...,.,.,...-.:ho,_po,1�-;,,....,,....i..-.:ho,_.......,.Jo,onl,n,-,,..,..Jb, .. -..- ... __ .,__,_..,...,...i..,,o._ .. ,..i...,-.. .... ...... ,.,._,. n...-�-...,,. .. ..-,,,.. ........ ..., .. �...i ..... ..-.,.. ... ._.., ...... 1 ....... -. • ..i-;,,-i ____ ..., __ ""'.,..,.,,,.� w"""""---•-""'--·-.,J,-"""""'11...,.h50Ml--....... .w....1ouo111o-i,,..,__,'-id bo'""""'1olh_.,olo-..l;&,"""11 ... �....i;...1-i..,_. !.:..."'"::.:=r�--""'co,,,;,,g""'-" �--·--..... -,..i....,....,.__,.,� """"19'.p�oll,;c....,._l,onioo�..l.:l,i, ............ ,l;p, ..... ..-..... 1ss-i.._ __ .,.._155.,;o,""'-:I,,.. ... °""""""' ......., __ si,,p.""""-!;,,h1ss ... ___....i.,�v,s,..iw;1 1,o._...i.,,-� ... -
ulal,liJ, lhololoww,g:
a��=�.._ bndr,o _ - -� a�tl.,•_...._.....__,...._0-.,.,._�...t 0 :r�ti8�£"81;�..;�4-=-�::.t:',:..,.�
iadd,,...t,..._,poodoo�61.001>• □::..::;:-�--,_...-,...;o,. ........... ,.i-._
g ��=t"".,!::::.:�...:..rt.2. ..... _ .. � .... ....;._
□'"'""llol.,.ol....,._.lhool-od.odo,;,,d,,od""""oo ... □ :.':;�����!:::::, ... □;;:.::1�.,.r .... .-��,,.,,._,.,
���=�·
...,.., ....................... ....., .. --...... ..,..,..,-.....--b,-�---porio,I. □Ulna....d-.....ho....11 □=/�,..,.,��� '-0.fng ,:w 1•-a�o1-co1.,. _ □Uld,,d.._�_,bolo,.,__, □:::::-go,q-..;-
-.1
--�-
g;°;"R"!t.,,�.:;;7��=--□hridgo.,�Ulnool.odolpoog, ............. 50M5 □ut:r •. :l""l•---nnwou ......... _.,,.,...,.,... ac1o ...... ..,_, __ ,.i.."'9._..a ,,..o1i..;,A,,,-..i...,, abl.do.t�o .. ><vuood�,...Ul,.-,jbndr,o-g�-=::;-...:7".,•=""t..�:-U":',:
�.,._.....,..._ n.1-· 9,.;p·,.i-,;,, -�--��..,.., ....
l"'°"""'""'o-looct/levelolDilll'Oelion:
These Guides are respected, trusted and used by the deep sea pilots in each of the waterways that they cover and save
days of planning time for the navigator in preparing his passage through the areas. They are an essential briefing document
immediately before entering the area and a key reference for the OOW and all members of the bridge team as they prepare
for each leg of a voyage through it.
29

Passage Planning Guidelines
2.2.4 Preliminary Research - Nautical Publications, Charts, Update and Review
The likely routes should now start to present themselves. Section 2.1 outlined the charts and nautical publications that should
be held on board, in accordance with guidance, to fulfil the SOLAS V Regulation 19 carriage requirements. If the charts and
nautical publications required for the voyage are not on board, they should be identified and sourced from an approved chart
agent at the earliest opportunity.
Charts should be of an appropriate scale, up to date and assessed for content and quality. Where ECDIS is the primary means
of navigation (PMN) it is also necessary to ensure that ENCs are correctly installed.
2.2.4.1 Nautical Publications
Nautical publications are available in either paper or digital format and the following should be consulted when passage
planning:
• Nautical publications
'Admiralty Chart Catalogue' (NP131)
'Sailing Directions'
'The Mariner's Handbook' (NP100)
'Ocean Passages for the World' (NP136)
'List of Lights and Fog Signals' (NP74)
o printed version published in 13 volumes (Vols A-N) by geographic areas
'List of Radio Signals'
o printed version published in 6 volumes
'Vo/ 1 - Maritime Radio Stations' (NP281) (split into two parts by geographic area)
'Vol 2 - Radio Aids to Navigation, Differential GPS {DGPS}, Legal Time, Radio Time Signals and Electronic
Position Fixing Systems' (NP282)
'Vol 3 - Maritime Safety Information Services' (NP283)
'Vol 4 - Meteorological Observation Stations' (NP284)
'Vol 5 -GMDSS' (NP285)
'Vol 6 - Pilot Services, VTS and Port Operations' (NP286) (split into seven parts by geographic area)
'Admiralty Tide Tables' (NP201 - 208) (printed) or 'Admiralty Tota/Tide' (ADP)
o printed version published in seven volumes by geographic area
'Tidal Stream Atlases' (22 atlases for various parts of NW Europe)
'The Nautical Almanac' (NP314)
Notices to Mariners
o Annual Summary (NP247)
o weekly updates.
The navigator should identify the required nautical publications using either the 'Admiralty Chart Catalogue' for printed
versions or the 'Admiralty Digital Catalogue' (ADC) for both printed and digital versions.
I •
I •
Nautical publications require updates from the Annual Summary of Notices to Mariners and Weekly
Notices to Mariners.
Records of these updates should be maintained to provide evidence that the most up-to-date
information is used when planning.
2.2.4.2 Paper Chart Outfit
The navigator should identify and list the charts and publications required for the passage from a chart catalogue issued by an
official charting authority, such as the UKHO. The 'Admiralty Chart Catalogue' (NP131) lists all UKHO paper charts and shows
their limits of coverage (see Figures 33 and 34). The 'Admiralty Digital Catalogue' may also be used to select the paper charts
required for a route, in a similar manner to that used to select EN Cs for a route (see Figures 41 and 42).
30

CHAPTER 2 Appraisal
Figure 33: 'Admiralty Chart Catalogue' (UKHO, NP131). Figure 34: Limits of chart coverage (UKHO, NP131).
Charts should:
• Cover the entirety of the passage, at appropriate scales, for the pilotage, port approach, coastal and ocean passage
phases
• be updated from:
weekly Notices to Mariners (NM)
radio navigation warnings, see Figure 35 for Navarea regions.
30• 120 150• 1eo· 150• 120·
XXI � XVII
Russian
Federation � Canada
OQ:ll> c:,
so·
XII United States
35'50'S
VI Argentina
so· o"
30• o·
VII X
South Africa Australia
30• so· so· 120·
United States
XIV New Zealand
150•
Peru 18'21'$
xv Chlle
Figure 35: Navarea regions (UKHO, NP100- 'The Mariners Handbook1, (Courtesy of UKHO)
- 50•
31

Passage Planning Guidelines
2.2.4.3 ECDIS Chart Outfit
Where ECDIS is the PMN, it is important to ensure that all the relevant chart formats are installed. To meet SOLAS carriage
requirements, electronic charts used in ECDIS must be official, meaning they must be issued by or on authority of a
government authorised hydrographic office (HO), or other relevant government institution, and conform to IHO standards.
ENCs and RNCs are the only official formats sanctioned by the IMO for use in ECDIS when it is used as the PMN. If there
are insufficient EN Cs of an appropriate scale to cover the entire route, RNCs may be used to fill any gaps in ENC coverage.
However, due to the reduced safety features when using RN Cs in ECDIS, flag States may require documented risk assessments
to be conducted when using RNCs and an appropriate portfolio of paper charts (APC) may be prescribed.
Figures 36 and 37: Example of an ENC (left) and equivalent scale RNC (right)
for the same area. (Courtesy of PC Maritime)
An RNC is a raster representation of a paper chart and, when used in ECDIS, the system is in raster chart display system (RCDS)
mode. In RCDS mode the ECDIS safety contour is not available and no alarms will be triggered when the ship crosses the
safety contour value. Navigators should consider the use of mariner-added objects as well as the APC to mitigate the loss of
this safety feature in ECDIS, assuming the ECDIS fitted on board is IMO type approved.
Figure 38 can be used to ascertain whether a chart outfit is SOLAS compliant.
- Cover entire route - Appropriate scale
- Up to date
32
RCOS Mode
Paper Charts (APC)
,. ,. --
�
,. .,. --
Figure 38: SOLAS chart compliance diagram.

CHAPTER 2 Appraisal
I •
The required content of the APC varies between flag States. The relevant authority should always be
consulted.
The diagram in Figure 38 illustrates when official data formats are permitted for use in ECDIS and shows when vessels are
permitted to use RNCs and official paper charts where ENC coverage does not exist.
Although unofficial chart data may be used in ECDIS as a supplementary aid to navigation, such data does not meet SOLAS
chart carriage requirements when ECDIS is used as the PMN.
yCS2
�
----............ _________ _ / /
/
#
BA' ...
A_,/ ,'
URELLE
/ / .
///
cy'//
(D 4/ Zone , 1 ,
_,//
1, V E R G O Y E R
,,,,,,' -------------------------
'
� .3i ::. Tnipied .8
Figure 39: An example of unofficial Tx-97 data, produced to the 5-57 standard,
overlaid with an ENC. (Courtesy of Transas)
; lom .... �
I ltl
BA
.... SUR ELLE
,.--, / \
( (D ) '--✓
General Chart Information
FR7416 TRANSAS TX-97 Chart
Electronic Chart Edition: 12-2006
� □
:!!I
� . ·; -
d e I \VUS-84Corr. u1a1: 00°00.oocr Ulon: 000°00.000·
�
.105
M�.1_aa1n1.Af!ft"atel
• ..
La.<il update: 22.08.2014 (throug.h NM J4/2tl 14)
Projcction: Mercator
1-!orizonlal d,11um: \VGS-84
10.0 m 1111 20.0 m
Heights and dcpths in rvlctrcs
Paper chan. Number. 7416
FRANCE. ABORDS SUD DE BOULOGNE-SUR-MER. DU TREPORT A BOULOGNE-SUR-MER.
Edilion: 01 -2006 (2), printed: 01-2006. Published in France
Pro,icction: Mercator, IALA sys1em - Region A
Ellipsoid: WGS-84
Scale I :75000, depths in mc1rcs
ALL DISPLAYED CHARTS MUST BE USED IN CONJUNCTION \VITI! A RECOGNIZED N./\UTICAL PAPER CIIAR T OF A SCALE
APPROPRIATE TO THE AREA BEING NAVIGATED. THE DATA ON TIIE FULLY CORRECTED PAPER CIIART MUST ALWAYS BE
CONSIDERED TO BE MORE RELI./\BLE.
i;i SHOM :?002. Rcprnduit an:c rauturisation
du service hydrngraphique cl cicc:mographique de la marine• France -
Contrat n° E 64/2000
WARNING: No National Hydrographic Office has wrilied the inlOnn.ition in 1his product and none accepts liahility for the accuracy of reproduction nr
any mo<lilications made thereafter. No National I lydrogrnphic Office warrants that this product satisfies national or intcma1i,inal regulations regarding the
use of the appropriate products for na\'igalion.
Close
Unmar1c
[] Main Dual Info AIS Charts Config Log Book Man Corr Maps Monitoring Navigation Navtex Overlays Targets Tasks Tasks List t1
Figure 40: Cursor pick information from a Tx-97 chart showing associated warning message that such data should be used in
conjunction with official paper charts. (Courtesy of Transas)
33

Passage Planning Guidelines
I •
If an IMO compliant ECDIS is using unofficial chart data for navigation, the ECDIS is classified as an
electronic chart system (ECS) only and cannot be used as the PMN.
Chart catalogues, such as the 'Admiralty Digital Catalogue', are invaluable for quickly identifying the quantities and formats
of charts required for any given route. Gaps in ENC coverage, or areas where insufficient EN Cs of an appropriate scale exist,
can be identified, allowing RNCs, paper charts and relevant publications to be sourced. In Figure 42, relevant charts are
highlighted in red where they intersect with the route. Additionally, a 'buffer width' either side of the route can be added
to cater for adjustment during the planning phase and to cover contingency. Where a route is required to be inserted, an
approximation will be sufficient.
34

w
\J1
"C
.,,
C:
-·
.., cc
n
c:
::T
..,
Ill (I)
II>
II>
(I)
�
Ill_.
"C
Ill
"C
::I
..,
c.
0
�
°5l
N
[�
(I)
..,
n
o
::T c.
Ill
C:
��
II>
II>
-
· II>
::I
C:
Ill
C">
< ::T
Ill
Ill
:::!.
UJ
(I) -
�::T
(I)
!a.:i,;
o'
Q.
.., 3
� �-
--
_!I)'<
5
· t::,
n
-
· ci
C.
Ill
5 · 0
CC
Ill
-c
iil"
Ill 0
al
(Q
..,
c::
n
(I)
::T
-Ill
-�
�
!ll �
---iii
(")
0-0
-
C:
(I)
&0
(/)
:!.
'<::
-
· 0
::I
..,,
(I)
C:
�
2�
-9- ::T
(I)
C
"
::c
g
n
Ill
::I
0- (I)
C:
(I)
0 a: (I) ::I
J
Ill
::I
c.
lflli"11
E
File
V
iew
R
ou
te
Op
tio
ns
He
lp
Dis
pla
y In
ve
nto
ry
Ba
ske
t
Curre
nt C
atal
ogue
Onl
y
Activ
e Fo
lio T
ypes
Onl
y
Hide
Sele
cted
Prod
ucts
Fo
lio
s
Type
Tran
sit
Regio
nal
Port
Us
ag
e
Ove
rvie
w
Gene
ral
Coas
tal
Appr
oach
Harb
our
Berth
ing
Re
sto
re D
efa
ult
j
·11rrarm·
��
C
lnven
to!X_
(O
)
n
::c
l>
" --i
m
:,:,
N
l>
"O
"O
..,
Ill
.;;;·
Ill
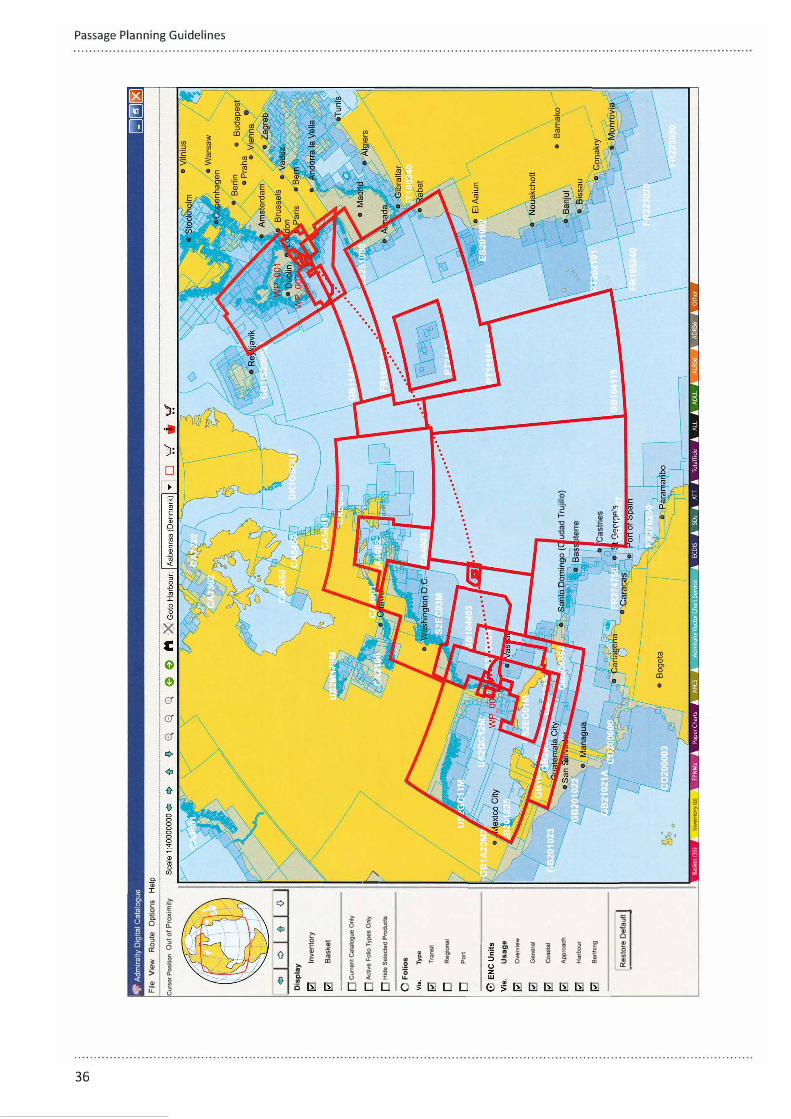
w
CJ')
File
V
iew
R
ou
te
Op
tio
ns
Cur
sor P
ositi
on O
ut
of
Pro
xim
ity
<:i
c::>
◊
Dis
pla
y In
ve
nto
ry
Ba
ske
t
Cur
rent
Cat
alog
ue O
nly
Act
ive
Fol
io T
ypes
Onl
y
Hid
e S
elec
ted
Pro
duct
s
Fo
lios Ty
pe
Tra
nsit
Reg
iona
l
Por
t
Us
age
Ove
rvie
w
Gen
eral
Coa
sta
l
App
roa
ch
Har
bour
Ber
thin
g
Re
sto
re D
efa
ult I ◊
�
��
lnve
nlo.!1'._
(O)
.... ud
ad T
rujil
lo)
,ter
re
'Cas
trie
s
•
Bam
ako
"'O
CJ
V,
V,
CJ
OQ
Cl)
CJ
::::,
::::,
::::,
OQ
G)
C
c..
Cl)
::::,
Cl)
V,

CHAPTER 2 Appraisal
2.2.4.4 ECDIS Chart Installation and Update
Once the necessary charts have been identified and sourced, they will need to be installed and updated in ECDIS prior to
being reviewed. The following are considerations when installing and updating chart data:
• Chart installation
permits and licence
o relevant ENC and RNC permits held
o permits are up to date and valid for the duration of the voyage
relevant base discs are held on board
the length of time it takes to procure and receive chart data
the length of time it takes to install chart data in ECDIS
• chart updates
I •
charts are up to date on all ECDIS to the latest
o notice to mariners (NM) (note that the IHO abbreviates this to NM and not NTM)
o temporary and preliminary notices to mariners (T&Ps)
o local NM
o radio navigational warnings (NAVAREAS)
the latest NM update is held on board
use of the Admiralty Information Overlay (AIO)
the length of time it takes to update chart data in ECDIS.
It must be appreciated that chart installation and update times can be considerable. Recording the
time it takes to complete this process will allow more accurate estimates to be used in future.
Failure to renew chart subscriptions will result in a permanent warning message whenever an expired
cell is displayed, stating that the cell may be out of date and must not be used for primary navigation.
In addition, it will not be possible to update expired cells with official updates until the subscription
has been renewed, and until that time the vessel will be in direct contravention of the chart carriage
requirements.
;J ChartAss1stant o=== =
= @j J:(
Table Ship Collection Network !ra!Pemwiin!ol
Format S.S7iSENC UµrJate lns:ai1 l,cense Repor!s • CrE:a'.e TX97 De•f':!eTX97
I - �::�S57/SENC Internal collect,on
EdLl,on Issue d al(, L asl \,pca te Upda ted to Updaleava,1 License
GB52103A
GB52134A
GB52134C
GB52253A
GB522538
GB52268A
G652268B
GB52268C
GB52282B
GB52282C
GB522820
GB52345A
GB52399A
GB52399B GB52399C
G8524728
G852474A
GB524740
GB524940
GB52495A GB52495B
G8524%C
GB52524A
GB525248 GB52524E
GB52528A GB52550C
GB52566C
G852566Y
GB52618A
G852618B
GB52618C
G852711A
433 2 GB fre e
09-05-2012 SENC CO WK22-14 ,.WF 64):27-05-20141 No 11-01-2010 22-04-2013 SF.Ne CD WK22-14 \\VF 64,(27-05·20141 No 22·04·2010 22-04-2013 S[NC CO WK22•14 (W= 641(27•05-2014, No 22•11-2013 SENC CD WK22·14 iW;: 64)127-05 2014_1 No 22·11-2013 SENC CD WK22·14 1WF 64):27-05-2014) No 19-03-2010 07-10-2013 SENC CD WK22- 14 1WF 641{27-05-20141 No 19-03-2010 19-08-2013 SE.NC CD VVK22-14 iw= 641(27•05-20141 No 19-03·2010 07- 10·2013 SENC CD WK22-14 i W;; 64Ji27-C5-20141 No 14-04·2014 SENC CD WK22-14 ,w-;: 64)l27-05-2014) No 1 4 ·04-2014 SENC CD WK22-14 1WF 64)127-05-2014) No 14 04-2014 SENG CD WK22-14 1\·\I=-641(27-05-2014: No 16-08-2013 SENG CD WK22-14 1w.:: 64;(27-05-20141 No 12-04-2013 21•05 ·2014 SENG CD WK22-14 Iw;: 641127-05-2014) No 11-04-2013 21-05-2014 SENG CD WK22·14 ,Wf 641127•05-2014) No 11·04-2013 21-05-2014 SENC CD WK22-141WF 641{27-05-2014: No 09-04-2013 31-07-2013 SENC CD WK22-14 (W;:: 641i27-05·201•P No 09-04·2013 SENG CD WK22-14 (W;: 64)127-05-20141 No 13- 12-2012 2 9·04-2013 SENG CO WK22-14 1WF 64)127-05-2014) No 2 5 -03-2011 22-04-2013 SENG CO WK22•14 tWF 641127-05-2014_1 No 31-01-2014 SfNG CO WK22·14 (\·Vr:: 641(27-05-20141 No 17•01-2014 SENG CD WK22-14 (WF 641027-05-20141 No 31-01-2014 SENG CD WK22-14 ,WF 64Jf27-C5-2014) No 07 09-2[09 SENG COWK22-14 1.WF 641127-05-2014) No 07•09·2(09 SENG CO WK22- 14 (VVF 64 1(27-05-2014, No 07-09-2C09 05-03-2010 SENG CD WK22-14 iWF 641\27-05-2014i No 30-04-2C14 30-07-2(09 12·08-2013 09-11·2012 07-02-2C14 24·04·2014 19-03·2C12 31·03-2014 29- 10-2C12 05-09·2013 29- 10·2(12 27-08-2013 17-03-2C08 27·06-2013
SENC CD WK22-14 1WF 641127-05-2014) No SENG CD WK22-14 1Wf 641127 05 -2014) No SENG CD WK22- 14 1WF 541r27-05·20141 No SENC CD WK22-14 1WF 64J(27-05-2014) No SENG CD WK22 14 1WF 641127-05-2014) No SENG CD WK22-14 1WF 641127-05-2014) No SENC CD WK22-14 \WF 64){27•05·2014) No SfNC CD WK22-14 ;WF 64:i(27-05-20141 No
20141·01 20141·01 20141·01 20141·01 2014,.01 20141·01 20141·01 20141·01 20141·01 20141'01 20141'01 20141"01 20141'01 20141'01
20141"01 201.::1·01 20141'.01 20141'01 20141'01 20141101 20141101 20141101 20141101 20141101 20141101 20141101 20141101 20141101 20141101 20141101 20141101
ii1, 1] I
E�terna l stora ge
Source of ch art perm1 1s
• lns1 a l l fro mt.le
Manu al permits entry
Remove old permits
Organisa tionof or1gmcode 1s 2: To select another RENC sc an 9
l/, ewperm,ts 1nfo
i l!c �- -- - ·
IN62 0 5 1 S IN62060P !N62060P !N62106P !N62106P IN62107 W !N62 107 W PE 100100 PE 100200 PE 1 00300 PE200 1 2 0PE2 00120 PE300111 PE300112 PE300112 PE300 1 1 3PE300 1 1 3PE300 1 2 1PE300 1 2 1PE300 1 2 2PE300 1 2 2PE300 1 2 3PE300 1 2 3PE3001 2 3PE300 1 2 4PE3001 2 5 PE3001 2 6PE3001 2 6PE3002 1 1PE3002 12 PE3002 1 3PE3002 1 4PE3002 1 4
lnstallnewSAcer1'f1ca!e
Cancel
-. . - --- ------- - -- -- - - - --
2 0 141001 subscription 2 0 1 4 1001 subscription 2 0 1 4 1001 subscription 2 0 1 4 1001 subscription 20141001 subscription 2 0 1 41001 subscription 2 0 1 4 1001 subscr1pt1on 2 0 140801 subscription 2 0 1 40801 subscription 2 0 1 40801 subscription 2 0 1 40801 subscription 2 0 1 40801 subscription 2 0 1 40801 subscription 2 0 1 40801 subscr1pt1on 20140801 subscription 2 0 1 40801 subscription 20140801 subscription 2 0 1 40801 subscr1pt 1on 20140801 subscription 2 0 1 40801 subscr1pt1on 20140801 subscr1pt1on 2 0 1 40801 subscription 2 0 140801 subscription 2 0 1 40801 subscription 2 0 1 40801 subscription 2 0 1 40801 subscription 2 0 1 40801 subscr1pt1on 2 0 1 40801 subscription 2 0 1 40801 subscription 2 0 1 40801 subscription 2 0 1 40801 subscription 2 0 1 40801 subscription 2 0 1 40801 subscription
V,ew installed SA cer1'/,cale
1exp1red) (expired) (expired) (expired) (expired) (expired) (expired) (expired) (expired) (expired) (expired) (expired) (expired) (expired) (expired) {expired) (expire d) (expired) (expired) (expired) (expired) (expired) (expired) {expired) (expired) {expired)
Figure 43: It is important to competently manage chart subscriptions and permits to ensure that they
do not expire during the passage. (Courtesy of Transas)
37

Passage Planning Guidelines
10nm
Sabu1'
Q� TheBr� Shoaep
Raas Caseyr (cape Guardafui) summit
Figures 44 and 45: Warning messages will be displayed if a chart permit has expired and 30 days before the subscription service is
due to expire. These are displayed whenever an affected cell is loaded. (Courtesy of Transas)
Chart installation and updating can be a time consuming process, particularly when installing encrypted data or when errors
are encountered. When installing encrypted data from chart providers that are signatories to the IHO S-63 Data Protection
Scheme, it is important that ECDIS software is up to date to ensure compatibility with the latest edition. It is also important to
ensure that the correct scheme administrator (SA) and chart producer certificates are installed to facilitate chart installation.
Sufficient knowledge of the process and the specific ECDIS in use is essential for successful chart installation.
38

CHAPTER 2 Appraisal
n�trator C(trtlficate ���T-�\
Close E-Ma1I Export Print
Issuer: IHO S-63 Scheme Administrator, International Hydrographic Organization (IHO), Monaco, MC
Validity: Not Before: 06 February, 2013
Not After: 03 March, 2033
Public key:
963F 14E3 2BA5 3729 28F2 4F15 B073 OC49 D31B 28E5 C764 1002 564D B959 95B1 5CF8
BOOE D54E 3548 67B8 2BB9 597B 1582 69EO 79FO C4F4 926B 1776 lCCB 9EB7 7C9B 7EF8
Figure 46: Encrypted EN Cs require the correct SA and chart producer certificates to be installed. (Courtesy of Transas)
II II I
Complete list
Chart Number
gb340020
gb54002c
gb44002a
de521350 gb40184a
de316003
de316004
de416050 de421030 de421040
Scale
: 90.000
: 12.000
: 45.000 : 12.000
1 : 22.000
: 45.000
: 90.000
: 22.000
: 22.000 : 22,000
n
qb410300 •
Last upd.:
Updated to:
■ Last upd
23-05-2014
23-05-2014 23-05-2014
23-05-2014 23-05-2014
23-05-2014 23-05-2014
23-05-2014
23-05-2014 23-05-2014
��
Find
. Updated to Format
WK22-14 ENC
WK22-14 ENC
WK22-14 ENC
WK22-14 ENC
WK22-14 ENC
WK22-14 ENC
WK22-14 ENC
WK22-14 ENC
WK22-14 ENC
WK22-14 ENC
,;, -
��
General
Load Chart Chart autoload � OFF FIX
Chart autoscale � OFF
Scale ratio: 0 .
Show only libraries for ONC charts
Chart Assistant
None
ENC
4,
�
N ,UP
TM
�
�
1 ·1
X
I] Main Dual AIS Advanced Planning Charts Config Log Book Man Corr Maps Monitoring Navigation Navtex Overlays Targets Tasks Tasks L,st [I
Figure 47: The date and number of the latest update affecting chart cells in use should be available. (Courtesy of Transas)
2.2.4.5 Review of ECDIS Chart Data
A review of installed data should be undertaken to identify its accuracy and to ensure that it is of an appropriate scale and
that there are no gaps in coverage. The following are considerations when reviewing chart data:
• Official chart formats
the entire route is covered by ENCs of an appropriate scale and accuracy
o areas of ENC overlap are identified
o areas of low chart accuracy (CATZOC) are identified
o areas of unknown datum are identified
o areas of poor GNSS coverage are identified
sufficient chart provision in case of diversion and contingency
where ECDIS supports RCDS mode
o the relevant flag State allows RCDS mode
o gaps in ENC coverage are filled by appropriate scale RNCs
o an APC is available
o RCDS mode risk assessment is conducted
where ECDIS does not support RCDS mode
o gaps in ENC coverage are filled by appropriate scale paper charts.
39

Passage Planning Guidelines
When conducting the review, the navigator should have visibility of installed ENC data to assess whether better scale charts
are available and identify gaps in coverage (see Figure 48). This function may also be useful during route construction. The six
available 'navigational purpose bands' are explained in Section 4.3.1- New Route.
H---10NM1------1
- - - - - !.'!! - -ToWPT... TTG·•·•····· ETA·•-·•···· XT □·•··•···· m XTLP•••••s•••••
Next WPT ··• CRS ··• • 2 Alarms 2 Warnings
Figure 48: An example of a graphical index, classified by navigational purpose,
of all installed ENC data. (Courtesy of Japan Radio Company)
When reviewing the accuracy of installed data, it should be noted that ENCs do not contain a source data diagram as depicted
on paper charts. Instead, the quality of the ENC is displayed using 'category of zone of confidence in data', (CATZOC). The
understanding of these symbols is critical to interpreting the accuracy of presented survey data. Explanations of the six
CATZOC symbols are provided in Figure 49.
40

1
zoc
A1
A2
B
C
D
u
I •
CHAPTER 2 Appraisal
2 3 4 5 6
Position Depth Accuracy Seafloor Coverage Typical Survey Characteristics Symbol
Accuracy
Full area search Controlled, systematic survey, = 0.50 + 1%d undertaken. All significant high position and depth
seafloor features detected accuracy achieved using
wDepth (m) Accuracy (m)
and depths measured. DGPS or a minimum three high quality lines of position (LOP)
± 5 m and a multibeam, channel or
10 ± 0.6 mechanical sweep system. 30 ± 0.8
100 ± 1.5 1000 ± 10.5
= 1.00 + 2%d Full area search Controlled, systematic survey undertaken. All significant achieving position and depth
VDepth (m) Accuracy (m)
seafloor features detected accuracy less than ZOC A 1 and depths measured. and using a modern survey
± 20 m echosounder and a sonar or 10 ± 1.2 mechanical sweep system. 30 ± 1.6
100 ± 3.0 1000 ± 21.0
= 1.00 + 2%d Full area search not Controlled, systematic survey achieved; uncharted achieving similar depth but
wfeatures, hazardous to lesser position accuracies
Depth (m) Accuracy (m) surface navigation are not than ZOC A2, using a modern ± 50 m expected but may exist. survey echosounder, but no
10 ± 1.2 sonar or mechanical sweep 30 ± 1.6 system.
100 ± 3.0 1000 ± 21.0
= 2.00 + 5%d Full area search Low accuracy survey or data not achieved, depth collected on an
Depth (m) Accuracy (m) anomalies may be opportunity basis such
(* *) ± 500 m expected. as soundings on
* 10 ± 2.5 passage. 30 ± 3.5
100 ± 7.0 1000 ± 52.0
Worse Full area search not Poor quality data or data that
worse than Than
achieved, large depth cannot be quality assessed
(* *) zocc zocc
anomalies may be due to lack of information. expected.
Unassessed - The quality of the bathymetric data has yet to be assessed ( u )Figure 49: CATZOCs provide an indication of ENC accuracy. (Courtesy of /HO)
Despite advances in hydrographic technology, many ENCs are still derived from the source data
of the equivalent paper chart and are no more accurate. Navigators must be mindful that there is
always potential for error and the presence of undetected dangers. Therefore, it is recommended that
where possible, all work is manually checked by a second navigator. Safety margins should always be
applied and extended whenever practical.
41

Passage Planning Guidelines
CHART ACCURACY
SOUTH EQUATOFMAL CURRENT
Owing to the age and quality of the source 1nformat1on. some of the charted detail may not be pos1t1oned accurately Particular caution 1s advised when nav1gat1ng in the v1c1mty of dangers, even when using an electronic postttoning system such as GPS
111 111
urve reliab11i M SREL , area
Hi hli ht
Quality of position (QUAPOS): 3 (inadequately surveyed) Survey Type (SURTYP): 5 (passage survey)
D
SOUTH EQUATORIAL CURRENT
SOUTH PACIFIC OCEAN
SOUTH SUB-TROPICAL CURRENT
�
�
,UP
TM
�
E\
1 :1
i
�
.A
@l =
(l r1;1a,n Dual Info AIS Advanced Piann,ng Charts Conf1g Log Book Man Corr l\.1aps fl.1onitoring Navigation Navtex Overlays Targets ► Tasks list I]
Figure 50: Old source information displayed in a modern format. (Courtesy of Transas)
Figure 51: Many ENCs are no more accurate than the equivalent paper chart and are corrected as new information becomes available.
(Courtesy of Transas)
PL 4.0.0
42
The operator must be able to display automatic chart corrections made to the ENC when required to
do so for inspection.
Weekly updates to ECDIS data is recorded automatically by the system and navigators should be
familiar with checking this information and presenting it for inspection.

CHAPTER 2 Appraisal
2.2.5 Preliminary Research - Other Considerations
The final stage of preliminary research is to consider any additional factors that may influence the route before actual
planning can commence. As a minimum, the following should be given due consideration:
• Routeing
anchorage(s)
areas to be avoided
bridge manning at the different phases of the passage
canals
danger areas
day or night transit of critical points
deep water routes (DWs)
ephemeral data
o times of sunrise and sunset
o times of morning and evening civil twilight
o times of moonrise and moonset
environmental protection
o emission control areas (ECA)/sulphur emission control areas (SECA)
o 'International Convention for the Prevention of Pollution from Ships' (MAR POL)
o marine environmental protection measures/particularly sensitive sea areas (PSSA)
IALA buoyage systems
military/naval weapon practice areas
navigation methods
o GNSS coverage (including any planned service outages)
o conspicuous charted features for visual fixing
o radar detection ranges, taking into account the nature of the coastline
o the use of parallel index techniques
pilotage embarkation, disembarkation and exchange of information
piracy and criminal risk areas
o use of internationally recommended transit corridor (IRTC) in the Gulf of Aden
precautionary areas
shipping lanes
stability of the seabed
o coral
o sandwaves
o underwater volcanic activity
survey data (see Figure 52 for paper charts, and Figure 49 for EN Cs)
territorial waters
time zones and time zone changes
traffic density and likely concentrations of fishing vessels
traffic separation schemes (TSS)
vessel traffic services and ship reporting systems (VTS)
a 2004 C 1980-90 e 1965-72 g 1945-51
SOURCES British Government Surveys
Full Bottom Coverage b 1994-98 1 :10 000-1 :25 000 d 1960-74 1 :5000-1 :20 000 f 1958-60
1 :12 500-1 :18 200
4°
40' 3'
1:10 000-1:25 000
1 :25 000-1 :50 000
1 :2500-1 :5000
c&f-£]
4°
20' 10'
so·
10'
50'
00'
Figure 52: Example of a Source Data Diagram, as found on most Admiralty paper charts. (Courtesy of UKHO)
43

Passage Planning Guidelines
Figure 53: Routeing measures as depicted on a paper chart (US Chart 1, NOAA).
Figure 54: Routeing measures as depicted on an ENC (US Chart 1, NOAA).
44

CHAPTER 2 Appraisal
• Delays
likelihood of a change in orders
operations such as gas freeing, purging, cargo grade change, ballast water exchange.
This list is not exhaustive and will depend upon the type of vessel and geographic area through which the passage is planned.
For example, piracy is found in several parts of the world and becomes a concern when transiting areas such as the Gulf
of Aden, Malacca Straits, Indian Ocean and the Gulf of Guinea off West Africa. There are numerous sources of information
available to aid the navigator, including the NATO Shipping Centre and the P&I Club websites, some of which are available
within ECDIS passage planning software (see Figure 55).
Maps
Tide/Current
I Anti-piracy Data Layer j
Piracy
Request
Incidents
View
1: 60,000,000
Armed Robbery
Golden Avenue
Vessel type:
Vessel flag: Liberia
ISC 13-012
Date (yyyylmmldd): 2013-06-14
Time (UTC): 20:15
Location: Bangladesh
Source of Data: 1MB
Incident Description:
4---e','---+-"-f----+-m About 20 robbers armed with axe and machetes, in three wooden boats, approached and boarded a chemical tanker during anchoring operations. Alarm raised and crew mustered. Master informed Port control and Coast
Figure 55: Anti-piracy databases are useful when considering the risk of viable routes.
(Courtesy of Transas)
A' B
Critical to the success of the planning phase and safe execution and monitoring of the route using an ECDIS is that all
operators have received adequate, approved generic ECDIS training and have also undertaken type specific training in order
to operate the specific equipment fitted on board. It is also essential for the safety of navigation that the manufacturer's
software within the ECDIS works fully in accordance with the latest IHO presentation library (PL) and data protection
standards, as only then will the ECDIS be capable of displaying all the relevant digital information contained within the ENC.
Failure to update the software may mean the ECDIS fitted on board does not meet the carriage requirements set out in SOLAS
and may result in the following equipment shortfalls:
• Significant features are not displayed
• appropriate alarms and indications may not be activated
• the latest charted features, such as archipelagic sea lanes (ASL) or PSSAs, are not displayed
• ENCs may fail to install or load.
It will be necessary for the navigator to know the state of software update, although this information should also be available
within the system.
45

Passage Planning Guidelines
<:@> jNavigation & Planning
<9 Chart Portfolio
0 Playback
Coler Pattern
Gray Scale
<< Hide I
Port Set
Software Update
Software Restoration
Create License
Backup Option
Hard Disk Initialization
Software/Data Path
Utility Software
Figure 56: Manufacturers will normally provide instructions on
how to perform the update. (Courtesy of Japan Radio Company)
110n :'I. --· - · · .. ········ ··-
--·- "=ils-S7/C-MAP Chart Information
·-------------------------------------------
chart Legend
chart Type Name Agency code PL version Edition. Update Number Format Number Issue Date Navigation Purpose Compilation Scale Horizontal Datum vertical Datum Sounding Datum Projection
557 GB120NW1 540 (UK) 4.0 1.0 3.1 14/06/2006 OVERVIEW l/20000000 0 (WGS-84) 3 (Mean sea level 23 (Lowest astron MERCATOR
"'l: GB007_09.TXT�
Figure 57: The version of the PL installed should be readily
available to the operator. Here, it is stated in the chart legend
within the pick report. (Courtesy of Japan Radio Company)
Known anomalies within an ECDIS are usually rectified by the manufacturer with software patches. It is, therefore, important
that the latest patch is installed in ECDIS and that the most recent IMO guidance on ECDIS anomalies has been read. In
addition, any anomalies encountered during use should be fed back to the appropriate authority.
I•
46
All potential hazards and dangers identified during the appraisal should be noted for reference
during the planning phase.

CHAPTER 2 Appraisal
2.3 Appraisal Report
Once a thorough appraisal of the intended voyage has been completed, and relevant information documented, the navigator
should be ready to brief the ship's Master about the passage in order to gain approval prior to the detailed planning. This
briefing will also provide a convenient opportunity for the Master to make any inputs with regard to the intended plan. The
navigator should present the various route options on a small-scale chart, as well as all relevant information obtained during
the research. A standard briefing pro forma (see Annex A for an example) prepared by the navigator will help ensure the
brief is presented in a logical and concise manner, ensuring the key points of the passage are covered and highlighting areas
where the Master's decision is required before the outline plan is agreed and the detailed planning commences. The use of a
passage graph will also help to ensure the key positions and timings are readily at hand at the brief (see Figure 58).
220
200
180
-
:E 160
z -1400
(!) 120 0
100
C: 80
60 ·-
40
20
0
Passage Graph - Milford Haven to Liverpool Tidal Stream With
Tidal Stream Against
St Ann's Buoy Milford Haven
Sunset
EARLY
Ni ht
Tidal Stream Against Tidal Stream 'i"fith
�14kts � "-12kts �10kts
8 kts
Liverpool
Bar Lt Buoy
LATE
1600 1800 2000 2200 0001 0200 0400 0600 0800 1000
23 May Time (GMT) 24 May
Figure 58: Example of a passage graph.
No two passages are the same. Even when the proposed route between two ports has been
undertaken before, there will be changes that need to be considered before deciding on the detailed
plan. Each and every voyage should be regarded as a separate undertaking, requiring the same
methodical approach and research before any detailed planning can commence.
In particular, when using ECDIS with a reverse waypoints option, a full review of the passage plan
must be undertaken to ensure the track follows the correct routeing measures.
47

3 Planning
CHAPTER
Passage Planning on Paper Charts
Having briefed the Master on the details collected at the appraisal phase and received approval to commence the detailed
planning, the navigator can start to prepare charts and supporting information to enable the safe execution and monitoring of
the passage. The passage plan should be from berth to berth, and may include some or all of the following separate phases:
• Pilotage
• port approaches
• coastal passage
• ocean passage.
3.1 Voyage Overview
Once the Master has selected the route to be followed, the navigator can plot the route and add supporting information and
detail on appropriate scaled charts that will be used by navigators during the monitoring stage of the passage. The level of
detail to be added to the charts will depend on which of the passage stages the chart will be used for.
49

Passage Planning Guidelines
3.2 Chart Preparation
Prior to plotting the track, the navigator should prepare the paper charts to be used during the monitoring stage using the
information gathered during the appraisal stage. The navigator should:
• Identify and mark off shallow water and navigation hazards to ensure the track is plotted in safe water
• identify and check the depth of wrecks charted along the intended route as dangerous or non-dangerous
• identify and highlight any areas of lower accuracy survey data
refer to the source data diagram on the chart (see Figure 59)
Date Survey method
Before 1935 lead line or wire drag survey
1935 to 1972 echo sounder survey
Post 1972 side scan sonar
(Note that hydrographic surveys prior to the 1980s did not use DGPS. Therefore, even side scan sonar data gathered before
the 1980s may have poor positional accuracy).
a
b
C
g
SOURCE DATA
Admiralty Surveys
1961-83 1:10 000-1:25 000
1976-83 1 :50 000
1964-71 1 :50 000-1 :75 000
Admiralty Surveys (Leadline)
d 1908-20 1 :21 120-1 :22 750
e 1838-98 1 :20 800-1 :73 000
f 1843-46 1:91 200-1:125 000
Local Authority Surveys
1979-88 1 :9000-1 :36 000 h 1962-73 1 :22 750-1 :81 000
7' ,,. -tt+,----.._..__��-�-...w+---i-���'"--11'-1'1
so
8LACKSTAIRS § MOUNTAINS i
., l
, .. ,_ ..
g CJ"'j· , <i> Q;' : ___ ' C) :
,, iI I I
c:, ! !
7f
I I
f-., :-•'
7t -
-
s
W A L E S
S•bm•rooc, cut.IX bach ,,nfo«d dl'o4. 10 lh< •"• 1,od;..,1«! A kN\oo, .. ,o be \<PI ro, 111, ..
ha=- -�---t---,<+--E�:t::,:,:;.-�.;;:::r'i:;;��-
Figure 59: Example source data diagram showing survey data within the limits of the chart. Source: British Admiralty Chart 1121 (Courtesy of UKHO)
... 4mir•h, L,.,ufR•d"'S;1ul>. AMEA ro B� AVO!OED BETWE[
THfiSMI\LL'ilSl"ON,5"•011, AM) GllASSIIOUI 1wu s. s•1Q
'4.11 ,....,1, lade� •Uh u1I. J•• Of D ,
;:r.:f j�'.:o•t�a•;d,h�!!1:'�::.; ��:

CHAPTER 3 Passage Planning on Paper Charts
• highlight areas of possible seabed changes, where the charted depth may have significantly changed since the last survey
due to, for example:
sandwaves
coral growth
volcanic activity
• identify areas of dense shipping traffic and potential areas of convergence
• identify and highlight conspicuous charted features (and annotate, when known, a description of their appearance) that
are suitable for:
visual and/or radar fixing
parallel indexing
• annotate the chart with tidal data
time(s) of high water at relevant standard port(s) (see Figure 60)
direction and strength of tidal streams at tidal diamonds (see Figure 60)
al Streams referred to HW at MILFORD HAVEN 51 °43'·93
Hours
T U)
Q) � 5 Q)
i U)
,ES: 4 Ol 0
Q) ..c: 3 Q) C: C:
co .!2> 2 2- � �I en
en en
E Q) Q) 'O
(ll :;:::, 'O
High :;:::, !!! Ol c..
Water U) C: (ll
0 .§. Q)
en C:
Q) 2 en ro ro
�� 3 C: 0 en
en
<( ..c: 4 u 2 2
!!! (ll (ll .!2> 5 0::: 0::: I 0 6
)6'
4
'.15s
24
A 51°40'·23N �
51°39'·90 N
127
122
074
003
322
310
300
296
288
264
131
128
126
115
5 11·08 W 5 10·53 W 2.1 0.9 118 1.8 0.8 2.0 0.9 122 1.6 0.7 0.8 0.3 083 0.9 0.4 0.6 0.3 009 0.6 0.2 1.1 0.5 321 0.6 0.2 1.3 0.6 300 0.8 0.3 1.6 0.7 292 1.4 0.6 1.8 0.8 292 1.5 0.6 1.5 0.6 288 0.3 0.6 0.6 0.3 273 0.8 0.3 0.9 0.4 156 0.5 0.2 2.4 1.0 121 1.8 0.8 2.3 1.0 115 1.9 0.8
122 ;
23/09)56
27
,..I"
�51°41'·13 N
5 08·86 W �51°41'·83 N
5 05·56 W0.0 0.0 003 0.3 0.2
013 0.3 0.1 060 0.6 0.3 023 0.8 0.4 086 1.2 0.6 027 1.1 0.5 088 1.7 0.8 023 1.0 0.5 087 1.5 0.7 017 0.7 0.3 084 0.9 0.4 354 0.3 0.1 017 0.1 0.0 214 0.5 0.2 0.4 207 0.9 0.4 207 1.1 0.5 200 1.1 0.5 187 0.6 0.3 120 0.1 0.1
74
�51°41'·83 N
5 04·36 W 051°41'·93 N
5 01-76W 310
073
085
089
097
098
083
294
272
263
257
263
278
0.4 0.2 100
0.4 0.2 097
1.0 0.5 095
1.5 0.7 095
1.3 0.6 097
1.1 0.5 102
0.3 0.2 100
0.4 0.2 285
1.0 0.5 280
1.1 0.5 278
1.3 0.6 276
1.2 0.6 270
0.7 0.3 258
116
M.fS.P.bkS
0.1 0.0 0.7 0.31.0 0.4 1.1 0.51.4 0.60.9 0.40.1 0.0 1.1 0.51.2 0.51.1 0.50.9 0.40.5 0.20.2 0.1
-6-5-4-3-2-10
+1+2+3 +4 +5 +6
Figure 60: Time of HW at standard port, annotated beside the tidal data table and tidal strength and direction, annotated for a tidal
diamond (predicted strength interpolated between predicted Spring and Neap strength for the calculated % Springs Rate). The red circles and arrow have been added to highlight relevant information. Source: British Admiralty Chart 3274 (Courtesy of UKHO)
51

Passage Planning Guidelines
• highlight areas of meteorological concern
tropical revolving storms (TRS) anticipated and forecasted
likelihood of fog
ice limits and type of ice, depending on ship Classification
monsoons, depending on the region and time of year
• highlight marine environmental/MARPOL restrictions
garbage discharge
discharge of oil or oily water residues
ballast water exchange
local and special area requirements
compliance with emission control area (ECA)/sulphur emission control area (SECA) regulations
o North Sea and Baltic
o East and west coasts of Canada and USA
o USA coast of Gulf of Mexico
o Hawaii
• security restrictions
war zones
areas of known piracy, including East and West Africa and the South China Sea
naval/military exercise area.
Once these initial chart preparations have been completed, the navigator can plot tracks for the various phases of the
passage.
52

CHAPTER 3 Passage Planning on Paper Charts
3.3 Tracks
When plotting the track, the following points are common to all phases (pilotage, harbour approach, coastal or ocean) of the
passage:
• Tracks should be plotted on the most appropriate scale charts for each leg
• the true course direction should be shown using 360° notation
• manoeuvring characteristics of the vessel
show the wheel over position for the planned speed
• ensure the minimum UKC is maintained along the entire track
identify any areas where the UKC may decrease, due to the effects of squat or heel when turning
• ensure adequate overhead clearance under bridges and cables is maintained
• use of head or stern marks, where available, to enable continuous monitoring of position in relation to track when in
close proximity to navigational hazards and shallow water
• compliance with the COLREGS
• conforming to the general direction of traffic flow in an area
• tidal conditions
height of tide
strength and direction of tidal stream
• likely weather and environmental conditions
prevailing weather and direction of wave travel
heavy weather and swell
adjust track to avoid beam seas
visibility.
53

Passage Planning Guidelines
3.4 Speed
The speed along each leg of the passage should be planned to ensure a timely arrival at the destination. The appraisal stage
will have determined the overall speed required, but detailed planning may have to take account of:
• The need to meet a tidal window at the departure and/or destination port or at navigationally critical sections along the
route, due to either minimum UKC requirements, vertical overhead clearances or to avoid strong tidal streams
• speed restrictions due to:
port regulations
the need to avoid a decrease in UKC due to squat in areas of shallow water
• adjusting speed as per charterer's requirements or as required by weather and other restrictions
• expected speed made good due to the effects of tidal stream or current
• the need for day or night time transit of some areas, either for navigational or for security reasons
• that spare time should be allowed for unexpected delays. The use of a virtual ETA, a short distance before the planned
point of arrival (such as a pilot boarding place), will allow for final adjustment of speed to meet the required ETA.
54

CHAPTER 3 Passage Planning on Paper Charts
3.5 Pilotage Stage
3.5.1 Pilotage Chart Preparation
During the pilotage stage the vessel will be passing in close proximity to shallow water and navigational hazards. The
navigator should prepare the largest scale charts available with sufficient detail to ensure the vessel can follow the intended
track, continuously monitor its position and be kept in safe water at all times. These preparations include:
• Hatching off shoal water, at or shallower than the calculated depth of the no-go line, for the time of transiting pilotage
waters
the lowest predicted HoT for the period of the transit should be used in the calculation (see Chapter 2, Figure 9)
• description of prominent marks, structures or features
text or photographs in sailing directions (see Figure 61) or the description of light structures from the lists of lights
and similar publications are useful sources for this detail (see Figure 62)
Principal marks 8.78
Landmarks: Crosby Beacon (red ball over diamond topmark,
22 m in height) (53°31 '·36N 3°04'·69W). North Inner Mark (diamond topmark) (53°29'·78N
3°03'·63W). Port Radar Station (white, 25 m in height)
(53°27'·95N 3°02'·44W), conspicuous from most directions. Six wind turbines are situated along the dock wall SE of the Radar Station.
Rock Lighthouse (white granite tower) (53°26'·66N 3°02'·54W), disused.
Figure 61: Example of description of marks from 'Sailing Directions' (NP37 - 'West Coasts of England and Wales PilotJ_ (Courtesy of UKHO)
A5976 NORTH CHANNEL. BELFAST LOUGH. APP ROACHES. M EW ISLAN□---- Mew Island. NE End 5441.92N Fl(4)W30s 35 (IE:Ctl) 5 30.81 W
-- Fog Detlt VQW Racon AIS
(ll0.7, ec4.3)x 3. f/0.7, ec 14.3
Vis341·5°
ALRS Vol 2 Station 53660 MMSI No 992351109
Figure 62: 'List of Lights' description of lighthouse structure. (Photograph courtesy of David Goddard)
• clearing bearings to provide visual means of ensuring the vessel remains in safe water
based upon prominent charted objects or marks
a brief notation on the chart describing the marks will assist with their identification during the monitoring phase
55

Passage Planning Guidelines
• displaying the predicted strength and direction of tidal stream or current (see Figure 63)
tidal data sources include
o tidal diamonds printed on the chart
o tidal stream atlases
o digital prediction software, such as 'Admiralty Tota/Tide'
o local sources of tidal data and local nav warnings of tidal surges
• highlighting radio reporting points and annotating the charts with details of the VHF channel and station to call.
3.5.2 Tracks
Figure 63: Example of detail for a pilotage phase chart. Source: British Admiralty Chart 3274
(Courlesy of UKHO)
Once all of the information has been added to the chart, the track can be plotted using leading marks, head marks or stern
marks, as appropriate.
I •
Where recommended tracks are printed on charts or described in sailing directions, they should be
used with caution as there is the possibility of meeting other vessels following a reciprocal track.
Distances marked along the track to the vessel's berth during entry into port will help monitor the vessel's progress and any
necessary adjustments of speed.
If intending to use parallel indexing (PI) techniques, the cross index ranges (CIR) for the track, margin of safety and wheel
over lines should be drawn on the chart to ensure these are correctly positioned on the radar display. See Annex D for further
details.
56

CHAPTER 3 Passage Planning on Paper Charts
3.6 Port Approaches
hen approaching port it is more likely that there will be an increased frequency of risk of collision situations. In these areas,
here are greater numbers of vessels proceeding at slow speeds and reduced manoeuvrability, combined with vessels at
anchor or berthed at offshore terminals or moorings.
he chart should be prepared in a similar manner as for the pilotage phase. The scale of the chart is likely to be smaller and,
o avoid clutter, annotated detail should be limited to the key marks and points that the vessel expects to pass near.
To assist with planning in the vicinity of port approaches, the UK Hydrographic Office publishes 'Port Approach Guides'
planning charts (British Admiralty 8000 chart series), which contain information from several different sources such as
'Sailing Directions', 'Tide Tables' and the 'Admiralty List of Radio Signals'. Consideration should be given to following the
recommended routes printed on the port approach charts or described in the 'Sailing Directions'.
The tracks for both arrival and departure should take into account the position of pilot boarding places, follow the general
traffic pattern in the area, avoiding where possible encounters between inbound and outbound traffic, and allow a safe
margin from anchorages or offshore terminals/moorings where large vessels may be berthed. The use of suitable head or
stern marks and Pls will help with monitoring the vessel's position in relation to the planned track .
If a pilot is to be embarked or disembarked at a pilot boarding station, the navigator should prepare an approach that allows
sufficient room for the vessel to adjust her course and speed to provide a lee for the pilot transfer.

Passage Planning Guidelines
3. 7 Coastal and Ocean Passages
Once clear of the port and in open water the passage plan will normally be monitored by the OOW, using the passage charts
prepared by the navigator.
3.7.1 Passage Charts
The scale of the charts should be sufficiently detailed to allow the navigator to identify any navigational hazards and plot a
track that avoids them by an adequate margin of safety. Navigational charts should depict all known dangers, TSSs and aids
to navigation in sufficient detail for coastal passages. Larger scale charts should be prepared if passing close to navigational
hazards.
Charts intended for ocean passages are typically at a scale of 1:3,500,000, but larger scale charts, if available, should be
reviewed and prepared if conducting a passage in the vicinity of offshore hazards.
The navigator should prepare the coastal and ocean passage charts with annotations of all relevant information (see
Section 3.2 - Chart Preparation).
3.7.2 Distances to Clear Hazards
The passage plan should identify the nearest danger at every point along the route. Tracks should be plotted at a safe
distance from hazards to navigation. The definition of a safe distance must be decided on a case by case basis and may
require a documented risk assessment. One definition of a safe distance is determined by the passage speed and the method
of position fixing available, such that the navigator should be able to plot two position fixes in the time taken to reach the
nearest hazard.
3.7.3 Tracks for Coastal and Ocean Passages
The navigator should annotate the track on coastal and ocean passage charts with:
• True course to steer for each leg and the distance to run
• distances (at regular intervals) to run to the point of arrival
• ETAs at:
waypoints
predicted positions of making landfall
regular intervals along legs
• highlight radio reporting points and annotate with details of the VHF channel and station to call (refer to 'Admiralty List of
Radio Signals {ALRS)' Vol 6).
3.7.4 Tracks in Traffic Separation Schemes (TSS)
TSSs adopted by the IMO are set out in the latest edition of the IMO publication 'Ships' Routeing' and in the Annual Summary
of Notices to Mariners. Rule 10 of the COLREGS applies to the conduct of all vessels in and near TSSs that have been adopted
by the IMO.
When following a TSS traffic lane, where there is likely to be a heavy density of traffic crossing the TSS, consider positioning
the track to the left of the centre of the lane. This will allow additional sea room when manoeuvring to starboard as the give
way vessel in a crossing situation, rather than leaving the right hand limit of the traffic lane (see Figure 64).
When crossing a TSS, vessels should plan to do so on a heading that is as nearly as practicable at right angles to the direction
of traffic flow. This minimises the time a crossing vessel is in the lane, regardless of the tidal stream, and allows vessels
crossing or following a lane to assess the situation as a crossing encounter and take action in accordance with the COLREGS. It
is prudent to plan as large an area as possible to cross a TSS to allow maximum sea room in which to avoid other vessels (see
Figure 65). Unless permitted by the COLREGS, vessels should remain clear of TSS inshore traffic zones.
58

CHAPTER 3 Passage Planning on Paper Charts
Figure 64: Track biased to port in TSS traffic lane. Source: British Admiralty Chart 323 (Courtesy of UKHO)
..
Raffles Reserved
tki �l(�;;s 20M '<J.. Racon(O)
� F1(2)R
Helen Mar Reef Fl.6s 13M Racon(M)
Gusong Boarding Ground
u,
",
($_->i '<1/
FI.Y Shell SBM
Figure 65: Area for crossing the TSS south of Singapore, for vessels bound for the
'Shell' tanker mooring buoy. Source: Witherby Publishing
59

Passage Planning Guidelines
3.7.5 Mariners' Routeing Guides
The British Admiralty 5000 series of Mariners' Routeing Guides are charts specifically designed to assist with planning
passages through constrained waterways. These include:
• BA 5500
• BA 5501
• BA 5504
• BA 5503
• BA 5506
• BA 5507
• JP 5510
• JP 5511
• BA 5520
• BA 5521
• BA 5522
• BA 5524
• BA 5525
English Channel and Southern North Sea (see Figures 66 to 69)
Gulf of Suez
Approaches to the Panama Canal
Baltic Sea
Turkish Straits - Strait of Istanbul
Turkish Straits - Strait of <;:anakkale
Tokyo Wan
lse Wan
Gulf of Mexico
Irish Sea
West Coast of Scotland to Pentland Firth
Singapore Strait and Approaches
Malacca Strait.
PASSAGE PLAN
I .....,.,.,. __ ..r ,.··---- '. INING CHARTS Jtical charts and pub!icat1om;
I
� E 1A _,__._.,__ -� .. , �
t -··
./ ; ,, ·"i J ,
l,._,../.
! ./;_, ... /
BELGIUM
foe 11 •n �n11.>0c1,oc . ,.,.,in , .,
.,, ,,
\
MARITIME RADIO SERVICES l I
�-,u".";;--···•··· ��-,--... �-·
---;:--� UOl.<:111.U.tu.a11tNmDQ'1-.U&""'l>IIIAT'ln-rn:l,ll(U<IIAI hu",� �4 �������:::��!���::��
Rt:��
:.,- � =�=-= ::.-:....-:-:: .. �:.:::.-:::.-:. "=:-... , ... -____ .... ob�--c:-™,, ........ .,,.� ...... ,--... # __ , • ., ..
..;: ""'"""" .... �- •1-.H\'--� On,.,fftC-�C9.fft,1'1011�-=--il.lll>IK"0._.l._l1QIO�
::."'!:",�..!::"sw,.-,�..-.$•'"-11o�..,:..�·,-;.,t-;;;;;.:..;,._,.,
Figures 66 to 69: Chart 5500 - 'Mariners' Routeing Guide - English Channel and Southern North Sea'. Example of information content.
(Courtesy of UKHO)
60

CHAPTER 3 Passage Planning on Paper Charts
Further information can also be found in the following Witherby Publishing publications:
• 'Passage Planning Guide - English Channel, Dover Strait and Southern North Sea'
• 'Passage Planning Guide - Straits of Malacca and Singapore {SOMS}'
• 'Passage Planning Guide - Great Barrier Reef and Torres Strait'.
3.7.6 Planning Particular to a Canal Transit
A canal transit plan should be developed that contains all the relevant route information, requirements, logistics and
alternative courses of action, according to defined principles and methodology. The date and time of the transit should be
booked early to avoid delays. Check the local regulations issued by the canal authority to ensure the vessel is compliant and
that required equipment, facilities and documentation is prepared and available.
3.7.7 Ocean Passage Tracks
The options for an ocean passage route should have been considered during the appraisal stage and presented at the
appraisal report for the Master's decision on which route to follow. If intending to follow a GC or composite GC route, a series
of Rls between waypoints that describe the GC must be drawn.
The distance between the waypoints for RL legs along a GC may be determined either by drawing legs of a standard length
(ie 200 nm legs) or a difference in longitude (ie every 5°
of longitude). Once the RL segments of the GC route have been
determined (see Figures 70 and 71), they should be transferred to appropriate scale charts for the passage.
The navigator should ensure that any dangers are highlighted in the same manner as for a coastal passage and that the track
clears them by a safe distance, taking into account the availability and accuracy of the navigation methods to be used during
the monitoring stage.
Figure 70: Gnomonic chart to determine GC tracks. The black line annotation has been added separately.
Source: British Admiralty Chart 5095 (Courtesy of UKHO)
61

Passage Planning Guidelines
Figure 71: RL segments of a GC track between New York and Land's End. The black line annotation has been added separately.
I •
3.7.8
Source: British Admiralty Chart 4011 (Courtesy of UKHO)
The possibility of positional inaccuracies of remote islands and reefs as a result of survey methods
used should be considered. The high positional accuracy of GNSS may have not been available at the
time of the survey, especially if the route is not one regularly used by shipping. The use of relative
navigation techniques, such as visual and radar fixing or PI, will help to ensure the vessel remains a
safe distance off land (see Annex D).
Additional Considerations for an Ocean Passage
Ocean passages, due to their long duration and distance from land, require careful evaluation prior to their commencement.
A vessel about to undertake an ocean passage should be as well prepared as possible.
The predicted weather will have been considered when the route was approved by the Master at the appraisal stage. Any of
those factors that have subsequently changed, either prior to commencing the passage or during it, should be re-evaluated by
the navigator and the Master to ensure the ocean passage plan remains safe.
The participation in ship routeing systems, including the USCG Automated Mutual-Assistance Vessel Rescue System (AMVER),
may provide additional assistance should the vessel encounter difficulties. It is important that voyage data submitted to
AMVER is kept up to date throughout the voyage.
3.7.9 Passage Planning Sheet
Details of each leg should be recorded in a passage planning notebook for reference during both the current and any future
voyages between the same ports (see Annex E).An example of the information for a leg of a passage plan sheet is shown in
Annex F. The following notes should be considered:
• Method and frequency of position fixing, including primary and secondary methods and areas where maximum position
fixing accuracy is required
• contingency plans to place the vessel in deeper water or identify the nearest safe anchorage that can be utilised in the
event of an emergency arising
• checklists, as appropriate (see Annex B)
• watch keeping manning levels for both the bridge and engine room are often included for the different degrees of
navigational status, usually including coastal, pilotage and/or TSS passage.
62

CHAPTER 3 Passage Planning on Paper Charts
3.8 Risk Assessment
At the passage planning stage it is vital that consideration is given to potential problems, including the possibility of
equipment failure. This is known as contingency planning and can be aided by proper risk assessment.
Risk assessment should follow a predetermined format in line with the ship's SMS and be appropriate to each stage of
the voyage. It should identify the likely hazards and the potential harm of each, evaluate the risks and specify the control
measures required to manage those risks.
A risk assessment for contingency planning should consider the following:
• Damage to the vessel or cargo
• crew injury or medical emergency
• engineering restrictions
• failure of navigation equipment
• failure to achieve the planned passage speed
• adverse weather conditions.
The control measures should take into account:
• The vessel's range and endurance
• available speed
• available navigation methods
• weather forecast and sea state
options to minimise rolling and pitching
• places of safety
distance and direction
• alternative routes to avoid weather, navigational or security restrictions.
63

Passage Planning Guidelines
3.9 Completion of the Planning Stage
(Photograph courtesy of Duncan Bruce)
Once the navigator has completed detailed planning, the Master should be briefed and review the overall plan to ensure that
no navigational dangers or planning details have been overlooked. Any changes from the details discussed at the appraisal
report should be brought to the Master's attention.
The Master's review is an essential part of the passage plan. Adequate time should be allowed to
ensure it is properly considered and for any amendments the Master may require to be completed
before sailing.
On completion of the brief the Master should approve the plan.
64

3.10 Coastal Passage - Example
CHAPTER 3 Passage Planning on Paper Charts
A laden product tanker, length 126 m and draught on sailing of 9 m, is to make passage from Milford Haven (Valero Terminal No. 3 berth) to Liverpool (Tranmere Oil Terminal north pier) between 23 and 24 May. The vessel's maximum speed is 16 kts; the economical speed is 10 kts. The ship will be ready to sail from the berth at Milford Haven at 19:00 on 23 May and the Master wishes to proceed at an economical speed for as much of the passage as possible.
The 'Admiralty Distance Tables' show the distance between Milford Haven to Liverpool as 171 nm but, after reading Note 6, (see Chapter 2, Figure 5) the navigator found this distance was for a route to the east of Grassholm, which the 'Sailing Directions' and notes on the chart (see Chapter 2, Figure 6) highlighted should not be used by laden tankers. The navigator, therefore, calculated the distance for a route via The Smalls and the Off Skerries TSSs, as 195 nm between the points of departure and arrival.
"j. - ..;;..1/. :; �:;:,:;-;;:-_---'---:=.--;.._. _;_ ;• �:: :: ::_:::::�:::_:2 �_1
·,. t
I • ., ,::_ • • SAINT aov:.:its HEAD TO
. . -- :
.! SAINT DAVID'S HEAD
- I
I
-r
� - . · 1 �
' '
... j
f Grassholm ··
-- . l ! .... -... ---·-•-,
. . -- ·- �
,,,., .. .. ' ; -� �=----=-.=. . .:!E
Route used in the
Distance Tables - 171 nm
BUT should not be used by
laden tankers
Route via Smalls TSS
7
. . .. •. � -1' • • -
Figure 72: Passage options in the vicinity of Grassholm.
Source: British Admiralty Chart 1478 (Courtesy of UKHO)
The distances are as follows (see Figure 73 overall passage):
From To Distance (NM)
Valero No. 3 berth Milford Haven point of departure (St Ann's Buoy) 6.4
Milford Haven (St Ann's Buoy) Liverpool point of arrival (Bar Light Buoy) 195
Liverpool (Bar Light Buoy) Tranmere Oil Terminal berth 18.2
Total Distance 219.6
65

Passage Planning Guidelines
66
BRITISH ISLES
. IRISH SEA
// WITH ISAINT GEORGE'S CHANNEL
AND
NORTH CHANNEL
DEPTHS IN METRES
SCALI! 1:500000.i i.1.5.5"00'
TR,fF1(' SlP,.MAflOt< SC-IIP-\0:S SATELL!T1!-l>fillVfiD POJITIOt<, OIL AIIDO.U fl�LOS I.ADE'<TAN�t•�
��ll�c:���f:¥:�:�·.:: �f.iJ�!:�i!sYl�fil ��I�:itlt;;ii�]� ��,����Jt;;g� -�-�.-- ---+-�.,-,,--ffit�)!}l{tf:�!.� ��ffll1\fif��: ti{� fft�f;�[fi1Il�
11 .... ,,,.,, ......................... 1
.• , ... . ., .. ,,,., .... ,, .. , 0 .. ,, ... .
..... ,, .. ,, .. , .. " ...... , .... , ...... ' nplmlao, '"" ol • .,_,., """'"<)"' S<pu.,.,,s,.,.,,,,011>,
c-2,�-=.-.:=-il'------'_ ;;:=:·:.;:"':�. '" :: ::::�.� ;i����'.���:·;::�;�'.�� �-"�;::;·,;�:.:�::.·�,"" ..

CHAPTER 3 Passage Planning on Paper Charts
3.10.1 Coastal Passage Example -Tidal Calculations
The times and HoT of HW and LW at Milford Haven, Liverpool and Seacombe are as follows:
Milford Haven: Liverpool Bar: Seacombe:
23 May (All times GMT) 24 May (All times GMT) 24 May (All times GMT)
LW 00:55 1.1 m HW 00:01 8.8 m HW 00:20 9.0 m
HW 06:56 6.6 m LW 06:38 1.6 m LW 06:54 1.4 m
LW 13:11 1.2 m HW 12:16 8.5 m HW 12:40 8.8 m
HW 19:13 6.7 m LW 18:56 1.7 m LW 19:08 1.5 m
HW Dover: Note: Seacombe is the
(All times GMT) % rate of springs calculated nearest tidal reference to
23 Ma'i: 24 Ma'i: as 80%
11:53 00:03 and 12:19 Tranmere Oil Terminal.
The Master requires a minimum UKC of 2 m at all times and an additional allowance of 1 m for squat. The minimum charted
depth of the channel in Milford Haven is 16.5 m. There are no HoT restrictions for the departure from Milford Haven,
although the Master wished to be clear of Milford Haven prior to sunset (20:18 GMT) on 23 May and to conduct the majority
of the passage at economical speed.
At Liverpool the minimum charted depth in the River Mersey is 5.9 m, found in the Crosby Channel. Therefore, the minimum
HoT to transit from the Bar Light Buoy to the berth is:
HoT required =(Draught+ Minimum UKC + Squat) -Min Charted Depth
= (9 m + 2 m + 1 m) -5.9 m
= 12 m-5.9 m
= 6.1 m
The earliest time the HoT reaches 6.1 m is 10:30 GMT on 24 May. The 'Sailing Directions' advise that berthing at Tranmere Oil
Terminal normally takes place on the outgoing tide, up to 1 hr 30 mins after HW (see Figure 74).
Docking at the terminal is normally carried out on the out- going tide up to 1 ½ hours after HW. Undocking takes place 4 hours before HW up to HW; on occasions undocking can be after HW according to tide and weather. All vessels swing before proceeding down river.
Figure 74: Advice for docking at Tranmere Oil Terminal from 'Sailing Directions'.
The tide at Seacombe starts to ebb 20 mins after HW. As HW is at 12:40, the tide will therefore start to ebb at 13:00. As
docking/berthing is carried out on the outgoing tide, the earliest that this can occur at is 13:00 and the latest is at 14:10. As it
will take 1 hr 50 mins for the product tanker to transit from the river entrance to the berth at 10 kts, the window to enter the
river is between 11:10 and 12:20 to achieve the calculated berthing window of 13:00 to 14:10.
67

Passage Planning Guidelines
3.10.2 Coastal Passage Example - Speed and ETA Calculations
The navigator expected to pass St Ann's Buoy (the point of departure from Milford Haven) at 19:50 on 23 May. The navigator
then reviewed the ETA options at Liverpool Bar buoy, a distance of 195 nm from St Ann's Buoy.
ETA at Liverpool Bar Time Speed to make good
24 May 10:30 Option 1 14 hrs 40 mins 13.5 kts
(earliest time to pass over the Bar with min UKC)
24 May 11:10 Option 2 15 hrs 20 mins 12.5 kts
(to be off Tranmere berth at start of ebb)
24 May 12:20 Option 3 16 hrs 30 mins 11.8 kts
(to be off berth at latest recommended berthing time)
The navigator then considered the option of proceeding faster for the earlier part of the passage to complete the remaining
part at economical speed. Using the formula in Chapter 2 (see Figure 16), the following options for the speed plan were
calculated:
Times (GMT) Speed Duration Distance (nm)
23/19:50-24/03:53 16 kts 6 hrs 37 mins 66.1
Option 1 24/03:53-24/10:30 10 kts 8 hrs 3 mins 128.9
Total 14 hrs 40 mins Total 195
23/19:50-24/02:47 16 kts 6 hrs 57 mins 111.1
Option 2 24/02:47-24/11:10 10 kts 8 hrs 23 mins 83.9
Total 15 hrs 20 mins Total 195
23/19:50-24/00:50 16 kts 5 hrs O mins 80
Option 3 24/00:50-24/12:20 10 kts 11 hrs 30 mins 115
Total 16 hrs 30 mins Total 195
The navigator should consider the strength and direction of the tidal stream, which would be with the ship from departure at
Milford Haven until midnight, against the ship until approximately 06:00 on 24 May and then with it for the remainder of the
passage to Liverpool. These options were discussed with the Master.
Option 1: the vessel would proceed at maximum speed for longer than the economical speed and arrive at the earliest time
the vessel could enter the river with the minimum required UKC, but would result in the vessel either transiting from the river
entrance to the Tranmere berth at a relatively slow speed or arriving at the berth before the recommended berthing window.
Option 2: the vessel would proceed at the economical speed for a longer period than the maximum speed, arriving at the
berth at the start of the recommended berthing window and allow time in hand before the last recommended berthing time.
Option 3: the vessel would proceed at economical speed for the longest period and be the most economical for fuel
consumption, arriving at the berth at the end of the recommended berthing window, but allowing no margin for any delay.
The Master selected Option 2 and approved the navigator's recommendation to plan the track via The Smalls and Off
Skerries TSS.
68

CHAPTER 3 Passage Planning on Paper Charts
3.10.3 Coastal Passage Example - Preparing the Charts
The navigator prepared the charts, passage graph (see Figure 79) and supporting planning sheets accordingly (see
Figures 76 to 80).
220
200
180
160
140
0 120 (!)
0 100 -
80
-
60 C
40
20
0
--1-
t
Passage Graph - Milford Haven to Liverpool II( f 1 � T T Tidal Stream With1
Jll l Tidal Stream Against +--+---+-�--+-
, I 1
........,....__------,-----,--,--,I'
..( i
� t I t
L
19:00 20:00 21:00 22:00 23:00 00:00 01:00 02:00 03:00 04:00 05:00 06:00 07:00 08:00 09:00 10:00 11:00 12:00 23 May Time (GMT) 24 May
Figure 75: Passage graph - Milford Haven to Liverpool.
69

Passage Planning Guidelines
45
42
5 10'
Figure 76: Example of port approach chart (not all clearing bearings have been fully annotated).
Source: British Admiralty Chart 3274 (Courtesy of UKHO)
70
41 38 35
OQ'

,
14,
,
,
. ,
!{j,' "'
..... �/ �1/
10,
14
9, R 10;
mSh 145
138
27
29 29
S.G G.15.bkSh.R
305
31
31 29
NOT TO BE USED FOR NAVIGATION
22
29
25
07'
CHAPTER 3 Passage Planning on Paper Charts
M.S.bkSh
23
Air Ii e
(dis us
R
All times noted in UTC.
71
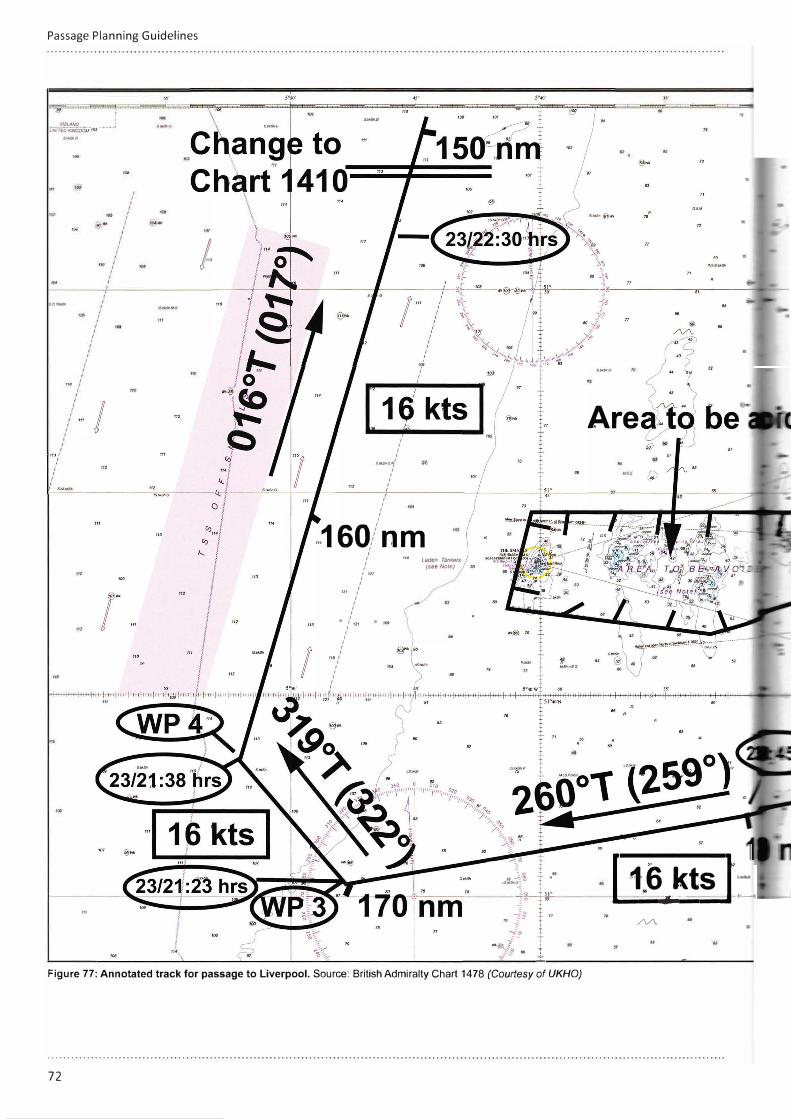
Passage Planning Guidelines
' uN,;;�1:,'/:;oo;.(1ro-�-- J
J,
I I I I
t
Are $.f/l,SIIG.P,' ®
I I
I I
I I I
I I
... 160/nm I I
I I
I Im
I I
I 121
I
I I I I
R ,' 121 R 109 I
I I
I I I
111I I
I I I
I I
114 Laden Tankers
(see Note)
�--�:➔.:· 11.6, kts t �ro ;; t,r," - - ------.iiiiiiiiii/V\,iiiiiiiiiiiiiliiiiiiiiiiiiiiiiiiiiiiii..-'''----4
�Q
t �@__ft -... /
� OIi
+
Figure 77: Annotated track for passage to Liverpool. Source: British Admiralty Chart 1478 (Courtesy of UKHO)
72

Adjoining Chari 1973
Movement of Shipping (see Nots)
... , \
" \
\
l7 \"!'
'9 \
NOT TO BE USED FOR NAVIGATION
CHAPTER 3 Passage Planning on Paper Charts
s0
10·
St•,, 5"17 M 51 25 IH
51 U 515 6,2 ,, 2-6 Cl-3
51"6 506 5-9 , .. 2-3 0.7 515.2 512 s-5 ,.2 2-3 1).7 51 � 19 5-1 31 22 1).7
3,r.,,,,.,._0.,....,.0.,.,1� ,- ... -�O....p,o,,,o,,,j J•o..-�O&n,("""""'I z __ Od>....,.D&m("'-¥>1
WA
All times noted in UTC.
73

Passage Planning Guidelines
74
BRITISH ISLES
GEORGE'S CHANNEL DEPTHS IN METRES
SCALE I; 200 000 at 111 58"00'
1od .,. rcclKtd LO Chn 0.1 ••. •·ic·luclo(Lo•cal ,..,,...,omic1ITid.e.
Vowluli-.1 fi1••,.. ,,., d•1•1 1>e11bu 1Uc>ti..,11c,1•uorcabowcMu•H•P
N1.tpua.l -b: IALA Mari1ln,c 810111< S711em -Rc1iooA(Red10-o . ..... jo,ctio,o, w ..... , ... S.-: Tbc oria••· OClllc.. dale ud b .. ,.. of Ilic •1c1roanpluc ialormolloa mcd 10 compik 1k cban ueJIM)w1 i. lk So,,ru Dia&n•. Tb<e IOf'Otraplly ii Mrift<I cbldly hom 11,e Ordu.u Suny of Great Brhaio ud Orda1..,cS..r•cyorlrcl&11d.
td u, th WGS 14 •-p,,•iblo. da11m. I Rcfttcacc s,....,., 19" 0.11111 {""' llOPOSITIONSoCMCl.
DBUOYS
��!���� , ... ";!.;..;.i ..........
•�• lhl>J< M•rioe ,-. Akr-rll. Sec
,f.:��.:=1
STALDATIJMS , ............. , l>c
SOlTTIIWARDalHI Obc(..,cpJ011io1,.. o,t .. _ s., •• , of SGB:1610.1 ... .,.
ZlllON,OIWJO'"·JCIW
2:�:�. oos- ���
$_,..,
SATELUTE-DERIVEO l'OSmoss
l'o&i•-- oll,tai- ,,_ .. ,.u,u .... ipi-.,.... ..... c1, .. U1o< G�l ...... ,ioo,,.,S,....-atCl"Sl,uc-c1Uy«fcne<ILotl,c Wo,lcl G-.tlc S)'>lc• I"" Ot.<••· S.c, ��'.""'•--•p1oo, ... ,n,oc:11, .... t11.io
IIANJc:S OFF nrP. TRISII COASTCIIAlTl!l> l>EPT115 UNREUAIILI!
l)ep, ... o .. t•lllm•hhc1w<e•T...,•• Rod ur1ni. 6·11·w1 •"" Wkuow lfeo4(ST,.'N. 6"'0Cl'W) .,. -•UF <llt.&•J1•IO..n ... cl<.p0• &1• - ,.li•bi..
AMI.A TO II( AVDll>EO ll�T"'l!F.N THL SMALLS jjJ'HN. s·,o .... ) A/,D
GIIASSllO!.M (Sl'H N S'l� W) fo ... ,d 11>< ,.,k of pollohOG d•• lo •lfHdlaJ, ,....,1, l•dn ,nb o,I. J•• ur
�:fi::;�:,:::!�:t.7·i�1��:1:
TllAITICSEPAIIATIOl',SC:110f(J
���-:��r::i:.:';.\��·i:·=::t::.���: 1� lMO-oa.;p,ed ,.a ,o<lude, o, ... , «k••··
MR!',OPIIA("T!CEARF.AS ;� "•""•�_,,,.., .... ,., ..... ,1 •. ,a.,.,-•,�
:.::.:·�:",::,:� �:::� �r::�.:: .. �:� r �or><I y<llo• 11•pur hlhlSot< d10pl•l•d 10 1nliu1< tUI n oru ., ,o 01< 111< fmoJ P"<li<< •«n OI< op<t•"d �"•K a <lnr , .. ,, p«>«d.,., hum<• .. d fmoJ <>017 lol<P�•• •bc■tb<1<<Hll<<<>twd<1<dlo b<dcor<>f a!l.b1ppt•J tor lur1ltcrdcto,I,
u,·.1.��--� .. ;,";�«
-�� �·::�:.:: \",.?. ,d' (p�)[AJ ,j,,or1, •nd Admu,111 l.i .. ,.f Ro<h<1S11n•l
1
M'"
' -,,
Figure 78: Annotated track for passage to Liverpool. Source: British Admiralty Chart 1410 (Courtesy of UKHO)

NOT TO BE USED FOR NAVIGATION
CHAPTER 3 Passage Planning on Paper Charts
A L
UNITED KINGDOM TERRITORIAL SEA AND flSHERY ZONES
12M1leLim1t ---- -><::>-- -•~-
E
1972
s
All times noted in UTC.
75

Passage Planning Guidelines
Figure 79: Example of annotated passage chart. Source: British Admiralty Chart 1977 (Courtesy of UKHO)
76

CHAPTER 3 Passage Planning on Paper Charts
"! •5�l
- . _) .-
" t l • @ ... t
......... ,,pi .,
=df-- - - -..-===;;L
�,;----::--:::---;::- --"""""'----- - - --'l
't;,F'."-"- - - - - -----'"-----:-:,�- - ----f--��- - -�- ��- - - - - - - - --.!lt .... � �@,_. 1'2
<S"4S»(l 311 �
4d --ij
-J� 4d
·f�@- ��
43�-- � .'i'
t t .t
,,
NOT TO BE USED FOR NAVIGATION All times noted in UTC.
77

Passage Planning Guidelines
3"50"
J:- -- ----+�t•�,M�- - -�Q--�-"- --- - - - - --@•-+- - - - - - - ----- ,- -��--'-' .. J8
-
''"SOI.Sn •1463
,.
,.
,,
,,
"· n, ..s..s,,,.
,�,
089°
,,T
,,
Figure 80: Example of annotated passage chart. Source: British Admiralty Chart 1978 (Courtesy of UKHO)
78

ORMES HEAD TO
LIVERPOOL
NOT TO BE USED FOR NAVIGATION
CHAPTER 3 Passage Planning on Paper Charts
' 9 .• ,,...,,,. � !
\
All times noted in UTC.
79

4 Effective Use of ECDIS
Almost every ship now carries an ECDIS. They have become a mandatory addition to ship's bridges because they have proven
effective at reducing the likelihood of groundings and other navigation accidents. However, the improper use of ECDIS has
been identified as a contributing factor in numerous incident reports.
While the equipment used on ship's bridges continues to increase in complexity and sophistication over time, those
comfortable with the core principles of ECDIS can always ensure high standards of navigation. ECDIS is now a mature
technology, and has been supported by continuous improvement in manufacturing, ENC production and evolving IHO and
IMO performance standards. ECDIS operators must familiarise themselves with a basic understanding of these developments
to ensure they operate effectively.
Effective and complete passage planning is a process that requires skill and meticulous research. In planning the passage,
navigators must be conscientious and seek to produce a comprehensive and detailed 'berth to berth' plan based upon the
fullest possible appraisal, taking into account all possibilities and eventualities while reducing navigational risk.
It is the responsibility of the navigator to fully understand his ECDIS. When using ECDIS, each navigator must invest his
personal time in reading the manuals, attaining expertise in the limitations of the ECDIS (and its associated equipment)
and learning how to optimise the system to its fullest extent. ECDIS is mandatory for carriage because, when it is properly
configured, it will improve the safety of navigation. It should be appropriately configured, both prior to the planning phase
and then again for execution and monitoring.
This section covers the planning phase of a passage when using ECDIS as the Primary Means of Navigation (PMN). The
content should be used in conjunction with other, more detailed, publications on ECDIS. As the principles of passage planning
are the same as when planning on paper charts, the content of Chapter 3 should also be consulted.
Once the appraisal report is complete and the high level plan has been approved by the Master, detailed planning can take
place. The planning phase is made up of five stages:
• Display configuration
• route creation
• supplementary information
• route check
• detailed brief.
Where databases containing relevant information for planning are integrated within ECDIS passage planning software, this
allows relevant information to be displayed while the plan is being constructed. Ultimately, this makes planning a less time
consuming task, while also reducing the potential to overlook important information or steps in the planning process.
81

Passage Planning Guidelines
Effective planning, execution and monitoring of a passage plan, conducted on ECDIS, must take into account the following:
• The reliability and condition of navigational equipment
• the height of tide and rate of tidal streams
• meteorological conditions and the availability of weather routeing information
• traffic conditions and areas of traffic density
• navigational focal points
• night-time versus daytime passing of danger points
• continuous monitoring of the vessel's position and progress along the route
• factors that may impede the safe navigation of the vessel, including ship characteristics
• protection of the marine environment
• actions to be taken on receipt of new navigational warnings
• circumstances that introduce an unacceptable hazard to the safe conduct of the voyage
• specific points of the voyage where additional personnel are required
• changes to the plan should be made in accordance with the safety management system {SMS) and be clearly marked and
recorded
• the plan should be readily available on the bridge at all times.
Configuration of ECDIS involves review of the:
• Sensors
• safety parameters
• display parameters.
Not all ECDIS can integrate with digital publications or additional databases.
� Loadedmutos 81� )( loaded-� --,--}a--}-~}a-_, ___ }
- � -�- � � � 1'._ ... � �Iii Create route Edit
--TG
·ma--"'!""���
Figure 81a: Some ECDIS passage planning software can facilitate multiple planning functions within a single application, including
access to weather forecasts, distance tables and tidal databases. (Courtesy of Transas)
82
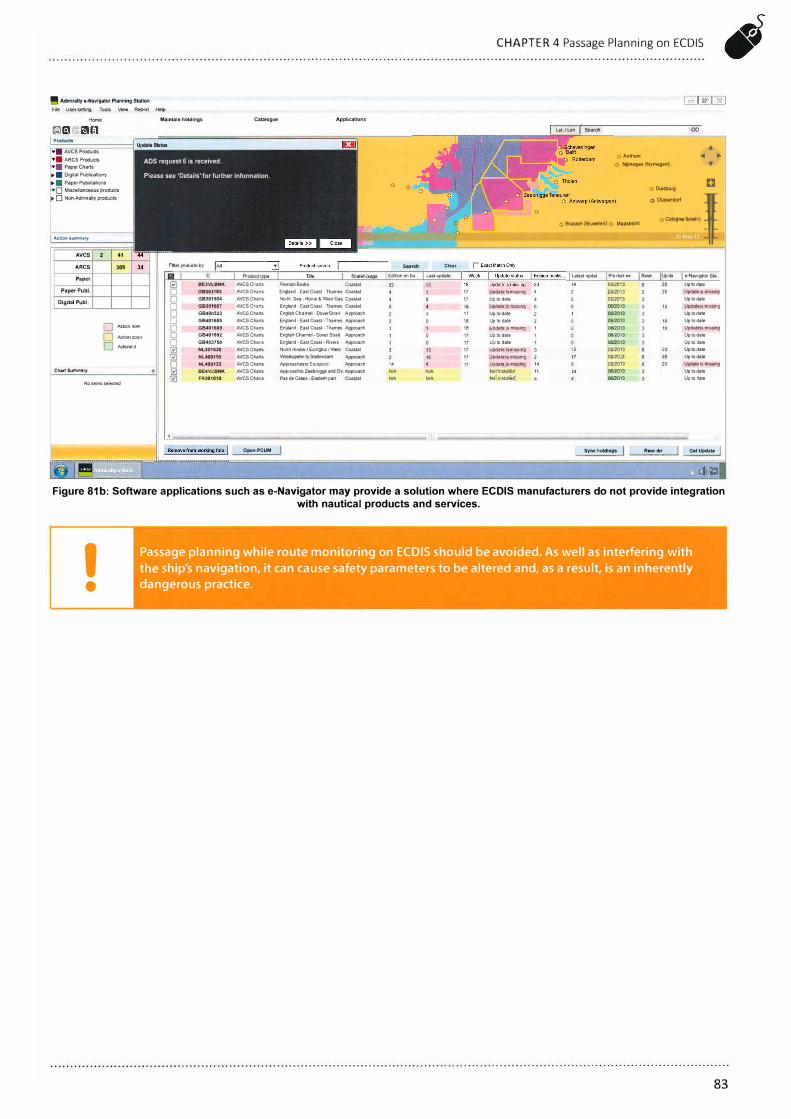
g Admiralty a-Navigator Planning Station File User setting Tools V,ew R eport Help
Home Maintain holdings Catalogue
.... AVCS Products
ADS request 6 is received. "'■ ARCS Products •■ PaperCharts ►■ Digital Publications Please see 'Details' for further information. ► ■ Paper Publications •OMiscellanceousproducts ► 0 Non-Admiralty products
Actlonsumm�ry
AVCS 2 41
ARCS 309
Paper
PaperPubl.
DlgitalPubl.
O Action n ow
□ Action soon
□ Actioned
ChartSuml'IHlry
No�ems seleded
10
0 BEJVLBNK AVCSChans D GB301183 AVCSCharts
D GB301504 AVCSCharts
D G8301607 AVCSChans D GB400323 AVCSCharts
D GB401605 AVCSCharts
D GB401609 AVCSCharts
D GB401892 AVCSChans
D GB4037SO AVCSCharts
0 NL301630 AVCSCharts
0 Nl400110 AVCSCharts
D NL400122 AVCSCharts
0 BE4VLBNK AVCSCharts
0 FRl01010 AVCSCharts
Open PCUM
Applications
Flemish Banks Coastal England-EastCoast•Thames Coastal North Sea -Home & Wren Gas Coastal England -EastCoas1-Thames Coastal EnglishChann el•DoverStrai1 Ap proach England-EastCoas1•Thames Approach England . East Coas1 - Thames Approach Engl1shChannel-Dove1Stralt Approach England •Eas!Coas1-Rivers Approach NorthHinder/EutO(leul/West Coastal Westkapelle to Stellendam Approach Approache&toEuropoort Approach ApproachtoZeebrugge aodOc Approach PasdeCalais-Ea&tem p art Coastal
0 0
0
Clear
Edition onbo ... Lastupdate ...
,.
NIA NIA
.
NIA NIA
"
"
"
"
"
"
17
CHAPTER 4 Passage Planning on ECDIS
0
Update!smissing 4 Up to date Update is missing Up!odate Up to date Update is missing 1 Up toda1e Up to date Updatefsmlssing Update ls missing Updatef8misslng 14 Not!n staUed 11 N_otin stalled
j Lat/Lon. j Search
oArnhem
GO
"
O Nijmegen (Nymegen) ◄ ►
.,
O Brussel {Bruxelle5) o Maastricht
Latest u pdat ...
"
2
"
Product ex ...
05r..!013 05/2013 05/2013 06!2013 06/2013 06/2013 06f2013 06/2013 06/2013 05/2013 0512013 0512013 06/2013 06/2013
oDuisburg C
ooo,�s,rt ioCok>g.,.(koolo)
��
Base ... Upda ...
20 20
20 20 20
e-NavigatorS\a ...
Up1oda1e Update ls missing Up 1odale Updaleis misslng Up to date Up to date Upda1els misslng Up to date Up to date Up to date Up to date Update ls missing Up to date Up to date
Syneholdlngs --•-�-''-"-�
GetUpdate I
Figure 81b: Software applications such as e-Navigator may provide a solution where ECDIS manufacturers do not provide integration
with nautical products and services.
I •
Passage planning while route monitoring on ECDIS should be avoided. As well as interfering with
the ship's navigation, it can cause safety parameters to be altered and, as a result, is an inherently
dangerous practice.
83

Passage Planning Guidelines
4.1 ECDIS Functionality
Although the IMO sets out minimum performance standards for ECDIS, the functionality of equipment will vary. For example,
some ECDIS designed to provide the route planning and route monitoring function within integrated navigation systems (INS)
will possess additional functionality to meet the requirements of IMO MSC.252(83) Revised Performance Standards for INS,
such as:
• Route Planning
having the route checked against hazards based on the planned minimum UKC as specified by the navigator
checking of the route plan against manoeuvring limitations, based on parameters such as turning radius, rate of turn
(ROT), wheel over and course alteration points, speed, time and ETAs
drafting and refining the route plan against meteorological information
• Route Monitoring
84
overlaying radar information on the chart to indicate navigational objects, restraints and hazards to own ship in order
to allow position monitoring evaluation and object identification
determination of deviations between set values and actual values for measured UKC and initiating a UKC alarm
display the present values of latitude, longitude, heading, COG, SOG, STW, UKC and ROT
AIS reports of aids to navigation.

CHAPTER 4 Passage Planning on ECDIS
4.2 Display Configuration
ENCs provide a layering of information, much of which can be turned on or off by selecting the relevant display category.
To ensure that all relevant information for planning the passage is shown, display settings must be configured prior to
constructing the route.
ECDIS Planning Settings
First, configure the ENC settings to enable fast and efficient planning. The following should be considered:
• Unload all routes
• unload all mariner-added objects
• select full screen by hiding the sidebar
• select day white palette
• select ENC as chart priority
• allow automatic chart loading
• allow automatic chart scaling.
Unloading all routes and supplementary information and selecting full screen, where available, will provide the navigator with
a clear display. ENC settings (such as chart autoload, autoscale and priority, or equivalent functions) should be optimised to
facilitate the efficient automatic loading of charts in the chosen format, at their respective compilation scales, in the cursor
position and when zooming.
Safety Contour
Values for the safety contour calculated during the appraisal should now be entered into the ECDIS (refer to Annex G - Safety Depth
and Safety Contours).
It is possible on some systems to set the safety contour value as O m. It is also possible to set the safety depth as a larger
value than the safety contour. Values should be carefully entered and checked prior to planning.
ENC Display
ECDIS can be configured to have multiple display settings, which may be termed as 'user profiles'. Companies should develop
in their SMS designated display settings appropriate to the stages of the voyage.
When passage planning and route checking, these profiles may obscure or hide potential hazards to navigation. Therefore, all
features should be displayed at this stage.
Be aware that your route check function will not check for items that are not included in your display settings.
Some systems may provide a more detailed ability to configure the ENC display, by allowing the navigator to select display
layers from a list of display categories (see Figure 83).
ENC symbols must be adequately understood. Symbols that have no equivalent in paper charts, such as simplified
symbols, plain boundaries and new symbols, may be found within ECDIS Chart 1, installed in ECDIS for use offline during
route planning.
85

Passage Planning Guidelines
rt�
Display Category
., Base
., Standard
Other
Area Boundary
Plane
• Symbolized
Depth Alarm
Shallow Contour
Safety Contour
Safety Depth
Deep Contour
TWO Coler Depth
Shallow Pattern
Show Isolated Danger In Shallow Water
Redraw
Border Range .SC· %
Margin (Chart Rotat,on) 0, 0 '
Chart Symbol • Paper Chart
Simplified
Full Light Line
Consider Scale Minimum
C-MAP Ed 3 Database
Chart Setting
Layer
::,� [S] urif.no•!ir. ot.:er:t __ [S] Generic obier,t
Text Size
Large
Small
.,_ [S] Cha•t scale oouwJ.:::iry U✓E::r':>:ale rJat,1 ., [S] Lar:d reg,o:-: Sea area namP.rJ ·:.a!E::r area .,_ [S) C3dSe:1a1 Darr, DJkE:- Gr.1!E: -� [S] D 1,,.� S:-:.e,E:: t-:.e,::.-:>: h:av/'. 8:�::d1:'.g c,:;1g:r:: Crc1r:e Lan1rnarf ., [S) S-:.eµ: area ·;,- [S! SarirJ :1a•;e T:J'::'•f.:! Cabi<:: SufJfTlar,r:e ., [Sj Na;:�a:io"' :;r,e ·:,,- [S] R:1;::c:rr.1::0::nCej track ., [Sj Ferry r,:,,_.:te
:r:-,1,:,r:ar,1. te..<t '/f:-niu:i! CtE:¥8ri,J: br1rJJr� 0·18rh8;:iij -�;;ibll':: so rJn 1 N�;;-'.>;::·:,,.iu�t,f::' :.f JVJ/S t)>;:;:ir,,:in<, ·,c, Jn
-__, �- · -:L"' .. ,;:;t .,r� :,c.:.':: 'J· c�:,a� ::Jcl\8 ,.,, �.a.__,t:r,:;1: i:,ur.:,c,.::it:r,r,
Figures 82 and 83: Examples of ENC display options that are selectable by the navigator.
It is important to understand exactly what information is displayed when certain settings are chosen for display, as only then
will the navigator know whether or not they are relevant. It may be that additional information is required when planning
different parts of the route. The display may then need to be reconfigured throughout the process. For example, the display
of submarine cables and pipelines may only be relevant when planning an anchorage. However, the navigator must ensure
that all features are displayed again prior to performing the route check.
Figures 84 and 85: Four-colour shading.
""''"" """'
-
Deep water
-�
Approximate depth contour
Approximate safety depth contour
""' '"""" -
Medium
"'' ""h
The utility of four-colour depth shading will depend on the individual vessel and circumstances, but its use is encouraged as it
visually highlights the onset of shallow water in advance. Numerous accident reports have shown that the use of four-colour
depth shading provides a good visual indication to enhance situational awareness.
Four-colour depth shading is dependent upon the availability of the desired depth contour within the ENC. If using four-colour
depth shades during the planning phase, ensure that adequate shades are then selected for route monitoring.
The display of auxiliary layers provided by integration with other software or equipment should be considered such as:
• Admiralty Information Overlay (AIO)
• NAVTEX
86

CHAPTER 4 Passage Planning on ECDIS
• satellite imagery
• weather data.
The AIO enables additional information that may affect the passage to be quickly identified, allowing the navigator to plan the
route accordingly (see Figure 86). Where NAVTEX is integrated with ECDIS, the navigator can benefit from displaying the latest
navigational warnings (see Figure 87).
Figure 86: The AIO provides important T&P information relevant to the voyage. (Transas)
@ CD PSSA @
Figure 87: NAVTEX integration with ECDIS allows the display of the latest navigational warnings.
Configuration of the ENC display is a delicate balance between displaying too little information, where important safety
information may be omitted, and too much, where information can overlap and be obscured. The degree of detail depends
largely upon the display category chosen. For example, the base display provides the minimum information, while the
all other display category may show more than is required. What is important is that careful consideration is given to the
relevance of displayed information, with regard to the environment and specifics of the vessel that will be conducting the
passage. The documentation of such settings will add consistency to planning, as will the ability to save the customised chart
display, which is available on some systems.
87

Passage Planning Guidelines
PL4 mandates the inclusion of a date-dependent object function. This facilitates the display of certain objects and provides
the navigator with visibility of objects, such as a new TSS, before they come into force. This is important because route
execution may coincide with the entry into force date.
Route Options
The amount of route information available for display will depend on the ECDIS fitted and may include:
• Route options
XTD
distances
planned speed
true courses
turn radius
waypoint names
wheel over lines.
Certain display options, such as planned speed, may not be available for display until a value is entered by the navigator in the
route table (see Section 4.3.5 - Route Table).
Turn radii and XTDs must be appropriate for each leg of the route.
Some ECDIS will only safety check within the XTD corridor.
?/) �PT i Ref (q Focus � Show • & Monitoring
(l)" Load • ie: Save ., Waypomt names NONAME01*
Edit Options Schulule calcul;1t1011 Advanced Cursors
90.0 l] *
270.0 r (t,,
Ctieck rouk
0.10 NM
99.9 NM
Voy;·i\J[.: plan
Operations
V• Reverse
-:::.. Link .
v Turns
., Cross track distances ., Reference points
., Wheel over lines ., Remarks ., Rises & Sets
Quick Distance Calculator
Y.-- Shift From WPT 0 .
ToWPT 0 .
X Delete• Distance
Position Leg
-·
&;,
�
,UP
TM
�
X
X
Total XTO Turn
I] Main Dual AIS Advanced Planning Charts Config Log Book Man Corr Maps Monitoring Navigation Navtex Overlays Targets Tasks Tasks List []
Figure 88: An example of route display options. (Transas)
88

CHAPTER 4 Passage Planning on ECDIS
4.3 Route Creation
Detailed planning should cover the entire passage from berth to berth, including pilotage areas. The objective is to use all information obtained during the appraisal to create the safest possible route. The IMO PS require that it should be possible to do the following on ECDIS:
• Carry out route planning including rhumb lines and great circle sailings
• adjust a planned route alphanumerically (route table) and graphically (on screen) including:
adding waypoints to a route deleting waypoints from a route changing the position of a waypoint
• plan one or more alternative routes in addition to the active route
• distinguish the active route from the other routes.
4.3.1 New Route
Open the route planning function and select 'new route' or equivalent. Some systems will allow the route to be named at this stage. If so, name the route clearly in the format: from, to, date of planned passage, so it can be found easily when it comes to executing the route. Prior to adding waypoints, it is important to understand the difference between the various ENC usage bands (also known as navigational purpose bands), as the scale of the ENCs when planning the route should be appropriate (see Table 4.1 and Figures 89 to 94).
The scales chosen for ENC usage bands will depend on a variety of factors. For example, coastal ENCs must take into account the availability of source data, the nature of the area and density of traffic. Approach, harbour and berthing EN Cs must additionally consider the size of the harbour and the extent of the port area. As these factors vary from port to port, chart coverage and scales within usage bands will also vary.
Usage Band or Navigational Purpose Band
1 -·� �-- --- - ---
Cell Type
Overview
Scale Range
<1:1,499,999 -�---
- - --
2 General . 1:350,000 -1:1,499,999
3 Coastal 1:90,000 -1:349,999 - -- ----
4 . Approach 1:22,000 -1:89,999 � ---- - - - -----·- - - - - -�-- ------- ----+----- - - --- - -- - - -�
5 Harbour 1:4,000 -1:21,999
6 Berthing >1:4,000---------------""'-- - - --
n 'x1
c:::•)11<S1'1 • ON
Las· u:xi :.s-r2 20"J
uo-:la'ed •:i 'AK22 u __
!l!!lll"l
1 : 1500,000
Table 4.1: Definition of usage bands. (IHO)
Figure 89: Usage band 1 - Overview. Note that the first number of the chart refers to the usage band. (Transas) (Band: 1, Cell Type: Overview, Scale: <1:1,499,999)
89

Passage Planning Guidelines
90
'
/J I I
----7 / \ I / I I I I
--lliA ,T,J • .I �--�,
--ao
---
I I I I� � I�
I
.1JM1i I
Figure 90: Usage band 2 - General. (Transas) (Band: 2, Cell Type: General, Scale: 1 :350,000-1 :1,499,999)
Figure 91: Usage band 3 - Coastal. (Transas) (Band: 3, Cell Type: Coastal, Scale: 1 :90,000 -1 :349,999)
Figure 92: Usage band 4 - Approach. (Transas)
(Band: 4, Cell Type: Approach, Scale: 1 :22,000 - 1 :89,999)

4.3.2
�I ,,,. Ip✓-/ --- I I
/ -,,, I 0 / ! ''-4,
/ I I ',
CHAPTER 4 Passage Planning on ECDIS
/ I I ', \. I I I \ 7- I I I
I ',....._ I I ., .. ./ I ,, I -1-----/ ------,---1
/ ,1. C:::01 I I � c::::.':J1 I
I <::,I) I /
// <'.) a � I // I
/ a� / / I
// � /
/
/ cJ ~ /
// 0 //
/ /
I I I // fl // / ; 17 I (.__/ // ; I I /�
/
� ;:�/ I
/ A: spil)' -45.
Adding Waypoints
Figure 93: Usage band 5 - Harbour. (Transas)
(Band: 5, Cell Type: Harbour, Scale: 1 :4,000 - 1 :21,999)
Figure 94: Usage band 6 - Berthing. (Transas) (Band: 6, Cell Type: Berthing, Scale: >1:4,000)
Prior to constructing the route, you will require a start and end location and should check the latitude and longitude.
This is necessary as many world ports have the same or similar names. Some ECDIS provide a database of world ports to
facilitate this.
Using small scale EN Cs, begin by adding a waypoint in the vicinity of the start location using the cursor. When two waypoints
are inserted, the system automatically joins them together to form legs, which are rhumb lines by default. Remaining on small
scale ENCs, and utilising the knowledge acquired during the appraisal, construct the route by adding successive waypoints,
completing the route by adding a waypoint in the vicinity of the destination. Waypoint positions need only be approximate at
this stage as they will be adjusted later. The method described is a graphical method of constructing a route using the cursor
to enter waypoints.
An alternative method is to use the tabular method, where the latitude and longitude of waypoints are entered manually in
the route table . Leg details, such as true course and distance, can be viewed in the route table or chosen for display, where
available, along the route itself.
91

Passage Planning Guidelines
;
()
10nm
i270.0°
92
[J I
L
Figure 95: Approximation of the route using small scale charts. (Transas)
I
I
I
I //
I / 1/
/ I
I
I
I -I_
,,
--r', ✓�- I
,_ - - - - - - - - - - - -3
I I I I I I I I I �--
--
/
--------------------------------------
----------
------
Figure 96: Example of the graphical method of waypoint entry using the cursor. (Transas)
/

4.3.3
II.love Wc1ypo:n!
FromWP 3 :oWP
Ports1de XTO 0.10 Nl\1
Slarbo,1rd XTO 0.10 NM
Turn RJd1us 0.10 Nr.·I
Anc Brg
Anc Rng
Course
Distance
000 0
0 OU
49"43.36TN
006"45.621'W,
270.0
Tot,11 Distance 239 3tJ NM
ell Ill
?/WPT a Rd
1270.0°1 4
[/
CHAPTER 4 Passage Planning on ECDIS
11 11 11 11 11 I /1 l
ij I
/ 11 I / ;!.l\ I / •� I Ci11 _1--
1,-- I I I / I )/ I / I 1,/ I
'
\
0 LL,,1:1 �:: S;1ve NONAME0J• X j
(] Main Dual AIS Advanced Planning Charts Conf1g Log Book r...ian Corr t.1aps t\1orntoring Nav1gaticn Navtex Overlays Targets Tasl-.s Tasks List [I
Figure 97: Example of the graphical method of waypoint entry using the cursor, (Transas)
Adjusting Waypoints
Once an approximation of the entire route has been achieved on small scale charts, it is necessary to return to the start
position and conduct more accurate planning by refining waypoints using appropriate large scale charts.
A detailed check is essential where ENCs overlap, to ensure no critical data has been obscured.
Waypoints should be placed as accurately as possible. The following are considerations when adjusting waypoints:
• With particular regard to the vessel
draught in relation to the available depth of water and minimum UKC
effect on vessel draught and turning circle during course alteration
o planned speed
o effect of expected tidal stream
o effect of expected current
o increase in draught due to squat and heel effect
• with particular regard to the route
adequate XTO
alterations of speed en route
avoidance of danger areas
considerations relating to the protection of the marine environment
contingency/emergency planning
o deep water
o place of refuge or safe anchorage in the event of an emergency
o shore-based emergency response arrangements and equipment
depth of water
limitations of night passage
location of course alterations
method and frequency of position fixing
o primary and secondary fixing options
o availability of visual and radar fixing to cross-check accuracy of GNSS
93

Passage Planning Guidelines
o radar image overlay
o parallel index lines
o astronomical observation
safe speed and proximity of navigational hazards
piracy and security
tidal restrictions
use of ships' routeing, reporting systems and vessel traffic services.
The relevance of the considerations above will depend upon the situation through which the route is being planned. For
example, pilotage planning will require a different mindset to planning in open ocean. The manufacturer may provide tools to
facilitate planning in this regard, such as:
• Pilotage
advance and transfer
anchorage planning
blind pilotage planning
clearing line
distance to wheel over marks
headmark, sternmark and beammark
tidal stream adjustment for wheel over
wheel over bearings
• coastal
nominal range of lights
parallel index lines
• open ocean
great circle lines (mandatory manufacturer requirement).
Figure 98: Example of pilotage planning using a headmark and beammark tool. (Transas)
94

I
CHAPTER 4 Passage Planning on ECDIS
Figure 99: Example of detailed anchorage planning.
0 3
110.0 knl
W/0 Mouai Pt 0.839 NM
I
'
'
'
'
'
' I Mo '
Moua! iJt N '
'
'
PI iouat
'
Figure 100: Use of Pls in coastal waters to monitor a course alteration to 004°(T).
95

Passage Planning Guidelines
10nm
//
/ '
'
'
'
'
'
'
'
'
'
'
'
Figure 101: Example of route planning taking into account the nominal range of lights. (Transas)
By default, ECDIS will create legs as rhumb lines, but this can be changed to a great circle line for ocean passages by adjusting
leg properties. When doing so, great circle lines can usually be divided into a series of individual rhumb lines for ease of
navigation, either by longitude or a set distance. Some ECDIS manufacturers also provide the ability to restrict the latitude
of a great circle line by entering a limiting latitude. If required, a combination of rhumb lines and great circles can be used to
form a composite track.
96
Figure 102: Rhumb lines and great circle lines can be used to form a composite track. Here, a great circle line is divided into a
series of rhumb lines for ease of navigation (Note: The figure shows CATZOC U (Unassessed), but at this scale you would not expect to have highly detailed quality).

CHAPTER 4 Passage Planning on ECDIS
Checks should be conducted for quality control throughout route planning, using the following sources of information:
• Visual check of ENC
ENC accuracy and quality (CATZOCs)
gaps in ENC coverage
isolated dangers
• cursor pick
unknown object symbol
objects and areas where more information is required
• digital publications
list of lights
list of radio signals
• other warnings
T&P NM information
navigation warnings.
The cursor pick function can be used to access useful additional information contained within the ENC. This may include
diagrams, images and text documents to assist the navigator (see Figures 103 to 108).
Although useful information may be present in the ENC pick reports, publications and NTMs must be used to verify this
information as they may be more up to date than the ENC.
IJ
Brid e BRIDGE , area
!:ti9b!i9!ll
Pie orial re resentatio Category of bridge (CATBRG): 1 (fixed bridge)
D Istanbul Bo(jazi D
Object name in national language (NOBJNM): Fatih Sultan Mehmet KOprDsU Object name (OBJNAM) : Fatih Sultan Mehmet Bridge Vertical clearance (VERCLR) : 64
ISTANBUL BOOAZl KITALARARASI FATIH SULTAN MEHMET K0PR0S0
STRAIT OF ISTANBUL INTERCONTINENTAL FATIH SUL TAN MEHMET BRIDGE
(41"05'.50N-29.03'.50E) ..,_flR q.
ro" �"1' F�
·�Jlii�ll••liil�·. __ ., :...'- � II
1• rn1 •:• znn •:• 200 •:• 1w •:
Information (INFORM) ; Maximum variation in the sea level is ± 35 cm. from Mean Sea Level (MSL) depending upon meteorological conditions Information in national language (NINFOM) : Deniz seviyesi meteorolojik sartlara bagli olarak Ortalama Deniz Seviyesi (MSL)' ne g6re en fy()k ± 35 cm. degi�mektedir. Pictorial representation {PICREP): TR292182.TIF
I] Main Dual i Info AIS Advanced Planning Charts Config Log Book !\,1an Corr Maps Monitoring Navigation Navtex Overlays Targets ► Tasks List � i I]
Figure 103: Pick reports can contain useful information displayed graphically, such as clearance information. (Transas)
97

Passage Planning Guidelines
�
� '
m l! .
'
•
Beacon shapo IBCNSHPJ 5 {pile beacon) Category of cardinal mark (CATCAM) 2 {east cardinal mark) Colour (COLOUR). 2 (black), 6 (yellow): 2 (black) Colour pattom (COLPAT): 1 (horizontal stripes) Object narno (OBJNAM) : Jong Pictorlal representation (PICREP) SGJONGBM TIF Scala minimum (SCAMIN) 59099
Sourco dato (SORDAT) 20130926 Source Indication (SORIND) · SG.SG.graph.4035E 14
:n··
Figure 104: Images of beacons. (Transas)
Figure 105: Images of ports and harbours. (Transas)
98
P�ouret ....
Otiontallon (ORIENT) : 26
Tankersormore than600dWlcanyingheavy crude oil. hoavyluel oiJorbitumonand tar and thoiromulsionsareroquiredlo participatomthe Western European Tanker Reporting System [WETREP]. SC!O Admiralty list of Radio Signals for further details
1,i
Traffic flow (TRAFIC): 4 (1wo-way) lnfonnatlon (INFORM): WESTERN EUROPEAN TANKER REPORTING SYSTEM Scare nilnlmum (SCAMIN): 999999 Textual description (TXTDSC): GBWETRP2.TXT
NORTHAJ OCEAN
COCKBURN BANK
Figure 106: Textual information. (Transas)
LsbadieBank
CELTIC SEA
•X �
�
,UP
TM
C£l.
� 1:1
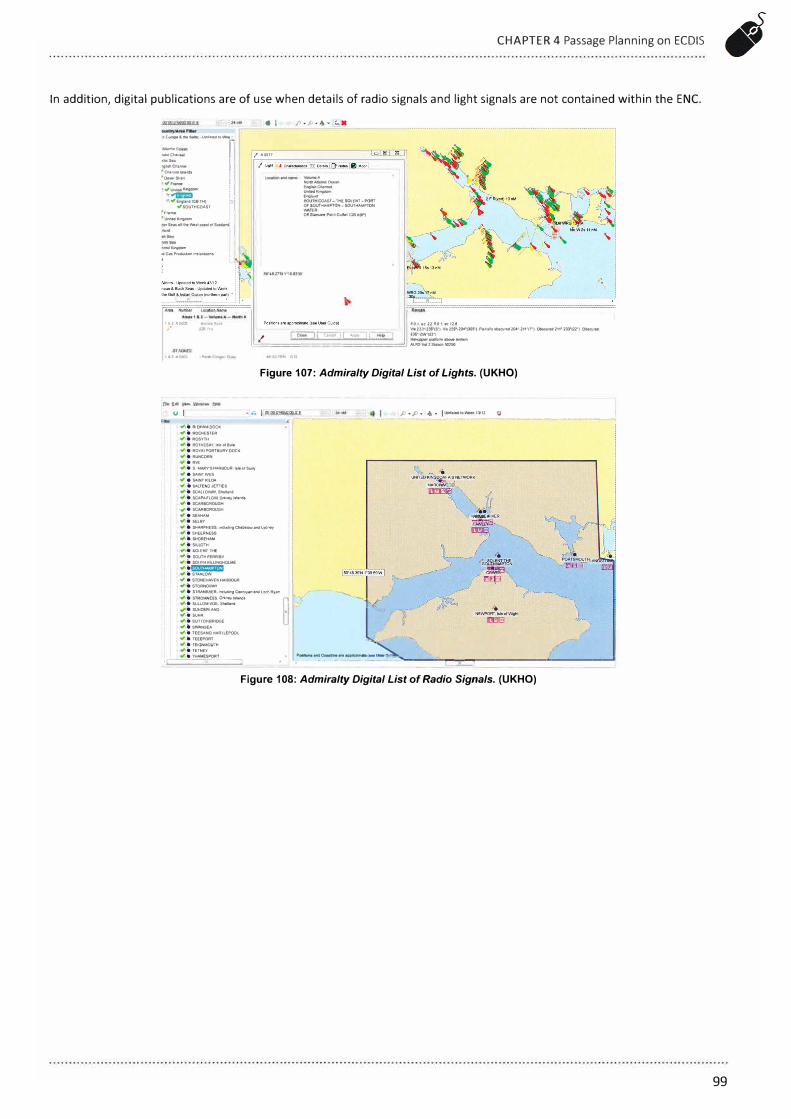
CHAPTER 4 Passage Planning on ECDIS
In addition, digital publications are of use when details of radio signals and light signals are not contained within the ENC.
:::·N- ,��--l·:!I. ,gnhCNIMei 'c....,,nei..--. •�SlrM �.,F.....,. t.,��
•.-mm 5.,Engllncl[G8TH)
.,SOUTHCO,.ST 'F,1..,. 'Un\ledKwlgdom :1 "81Senolltt<1WH!DDH10!Sconancl: -
--
!CIG nProdUCbDnlnllalabClnS i , l L._,\
1&2,oom Bta<,��Rodt ,• !GBr,.i
ul
., •• RIDHAMOOCK .,,. ROCHESTER .,,. ROSVTH .,.ROTHESAY,laleoflkM ., •• ROVAI.PORTBURYDOCK .,,.RUffCORJI .,.RYE
•I
/ A05TT
p.p.,.. '-X
-· �Allanbr;Ocean EnglisllCNMel --, .....
W���To"!'� ����;i w.t.TER O"StanoorePolr1!0uttaijGB.ABP)
WOl,.c22,WO!,tc!2d V• 23l"-236'(3'). Vil 259"-2(),1"(305°) Paitiao..,. obKur..i 2°''•211"(7"). ObKur9d 211"•233"(22') ObKureG
/ �I ca�:.c,I !�C�-=.J ::=:(:•:,.,.,,,_ .. nlarn l!================'.J ALRSVol2SIMIClll50250
Figure 107: Admiralty Digital List of Lights. (UKHO)
• •. I � _j) • ,i:) • " • I Updalad IO - 13112 <g
.!J ·-· ··· ···-�·------- - - ·· ···· ·--····-·--··· ----------------;
., it S.MARY'SHARBOURlll&ofSQay .,.SAlNTMS ., .SAINTKllOA .,.,.S,.,LTENDJETTIES ..,,.SCALLOWAY.She11ancl ¥'Ii, SCAPA FlOW,ON,eyl""'°" .,,it SCAA90HOUGH ..,:it SCAA90ROVGH ., e SEAHAM .,.it SELBY .,, • SHARPNESS. inclull,ng Chep1t1:1w - tp,e'f .,,itSHEERJ.ESS .., ... SHOREHAM
, .,.,. SILLOTH .,,.50!.ENT.THE
-91'rit SOUTH FERRI BY .,.,. sount KllllNGHOLME
., .. �.,,.STAHi.OW ., e STONEHAVEN HARBOI.Jfil .,..STORNOW«V
r1
., •• STRANRAER,.-,dud,ngCaun,y•naMLod\Ryan r• ·--·�--. -•---=-...-. ---- . .,,.STROMNESS,0ru>e'l'l""M• ..._/ �
:., .• .,,w .. -.,-
�·,· ·:{I
"" .,• .. SVNOERLANO ., ��i'{1-• .,,itsvNK
.,. SUTIONBRIOGE "'•ii SWANSEA
,.,, 9 TEESANO HARTLEPOOI.
·::t;:�=lfltt.,,. TElNEV 1'rit THAMESPORT -
--�
. C:::::�-c=:=::J ·-"·=�-��-����----'·------·=---··=-----------.i..�-------'1
L...�J
Figure 108: Admiralty Digital List of Radio Signals. (UKHO)
99

Passage Planning Guidelines
4.3.4 Multiple Route Options
While all ships are expected to create a 'berth to berth' passage plan, in many cases you may not know exactly which berth
you are destined for until approaching the pilot station. In such cases, it is prudent to prepare multiple routes in advance from
the pilot station to each possible berth. You may also construct multiple routes as part of contingency planning.
The navigator should be aware that certain ECDIS associate the safety contour/safety depth to the route, while on other
systems the safety contour/safety depth is controlled independently. The navigator must understand which method
their particular system uses. When changing routes, you must be able to verify that the safety depth value has remained
appropriate.
4.3.5 Route Table
Once the detailed planning has been completed, elements of the route can be refined by editing the route table. Doing so will
provide essential detail with which speed, time and distance calculations can be made. For example, ECDIS cannot accurately
calculate the ETA without the provision of a planned speed, or the overall speed required without an ETD and ETA. These
calculated values will be used by the navigator to manage speed and ETAs, both at waypoints and the final destination, during
the monitoring phase. Values for the following can normally be manually entered for individual legs:
•
•
•
•
•
•
•
•
•
•
•
•
•
Course
distance
ETA
ETD
leg sailing type (RL or GC)
planned speed
rate of turn
remarks
time zone
turn radius
waypoint name
waypoint latitude and longitude
XTD (port and starboard) .
Route Name 20052015 Comment Southampton to Miami 20May2015
Route Check
Close
WPT No.
3
4
5
6
7
8
9
10
11
12
13
14
New... Open ...
Position
LAT LON
50'50.546'N 1'19.634'W
50'48.994'N 1'17.563'W
50'48.380'N 1'17.357'W
50'47.095'N 1'19.180'W
50'46.778'N 1 '18.651 'W
50'45.902'N 1'14.095'W
50'45.529'N 1'07.717'W
50'43.453'N 1'02.112'W
50'42. 738'N 0'58.535'W
50'42.403'N 0'57.427'W
50°40.604'N 0'56.248'W
50'34.206'N 0'59.269'W
XTL
PORT STBD
0.10 0.10
0.10 0.10
0.10 0.10
0.10 0.10
0.10 0.10
0.10 0.10
0.10 0.10
0.10 0.10
0.10 0.10
0.20 0.20
0.20 0.20
0.20 0.20
Insert Delete
ARR SPD Sail
RAD [Kn] RL/GC
0.50 10.0 RL
0.50 10.0 RL
0.50 10.0 RL
0.50 10.0 RL
0.50 10.0 RL
0.50 10.0 RL
0.50 10.0 RL
0.50 12.0 RL
0.50 12.0 RL
0.50 15.0 RL
0.50 15.0 RL
0.50 20.0 RL
Divide Default
ROT Turn [0/min] RAD
019.1 0.50
019.1 0.50
019.1 0.50
019.1 0.50
019.1 0.50
019.1 0.50
019.1 0.50
022.9 0.50
022.9 0.50
028.7 0.50
028.7 0.50
038.2 0.50
Type Normal
View SYNC
Time CRS DIST
Zone ['] [NM]
+00:00 130.2 5.2
+00:00 139.8 7.3
+00:00 168.0 7.9
+00:00 221.9 9.6
+00:00 133.4 10.1
+00:00 106.9 13.1
+00:00 095.3 17.1
+00:00 120.3 21.3
+00:00 107.5 23.6
+00:00 115.5 24.4
+00:00 157.4 26.4
+00:00 196.7 33.1
Graphic Editor
Safety Check
Total
ETA
[DATE HH:MM]
15-05-20 09:31 &
15-05-20 09:43
15-05-20 09:47
15-05-20 09:57
15-05-20 10:00
15-05-20 10:18
15-05-20 10:42
15-05-20 11 : 03
15-05-20 11 :15
15-05-20 11 :18
15-05-20 11 :26
15-05-20 11 :46 �
Figure 109: The route table offers an alternative to plotting waypoints graphically and allows route elements such as course, speed
and distance to be adjusted manually.
100

CHAPTER 4 Passage Planning on ECDIS
Once the route table is complete, elements of the planned route such as speed, time, distance and likely fuel consumption (see Figure 110) can be checked against those calculations made during the appraisal. At this point, any significant differences can be highlighted and the plan changed if required. For example, it may be necessary to refine the ETD, ETA or overall planned speed. Of particular importance is the value entered for XTD, as it is this value that defines the boundaries for the route check. This must be carefully considered to provide adequate sea room to allow for leeway and alterations of course for collision avoidance.
�
�
�
1:1
/}
i
i2l
\) a ■
(&
�
1 : 30,000,000 ./4
Fuel Consumpllons
kg/h��� ......... ��--.�����������������������....-�-�-�-
J. J_U .Llt Uj_ 1i>JJk Li.!l1.it.J 1- LI 1-LI 1-U LU LIJ.Ll..1 Ll..1 lJ..L Li ..L LJ 1- LJJ_Lf!z£.�_:U,_L:Ud..iduh.leUub.84 I I I J I I I I I I I I I I I I I I I I I I I I I I I I I I I I I I I I I I I I I I I I I I I I I I I I I I I I I I I I I I I I I I I II I 11 I I I I 11 I 11 I I I I 11 I I I I I 11 11 I 11 I I 11 I 11 I 11 I 11 11 11 I 11 I 11 I 11 I I 11 11 I 11 I II I 11 I I I I 11 I 11 I I I I 11 I I I I I 11 11 I I I I I I I I I I I 11 I 11 11 11 I 11 I 11 I 11 I I 11 I I I 11 I II ' � I I I I I I I I I I I I I I 17
1111112P2t,�¥¥ I I I I I I I I I I I I I I 14P"'1 I I I 14f!4i74/l I I I I I I I I I I I I I I I I I I I
1111111111111111111111111111111111111111114f2kl I I I I I I I I 111111111111111I I 11 I I I I 11 I 11 I I I I 11 I I I I I 11 11 I I I I I I I I I I I 11 I I, 11 11 I I I I 11 I 11 I I I I I I I I I I I• I I I I I I I I I I I I ,b* I I I I I I I I I I ���1 • .!s:ti�:ti��••:H1� I I I I 4i; I I 14'� I I I I I I I I I I I I I I I I II I I I I I I I I I I I I I I I I I I I I I I I I I I I I I I I I I I I I I I I I I I I I I I I I I I 5.1 I I I I I I I I I I I I I I I I
74
Figure 110: Example of ECDIS passage planning software being used to predict fuel consumption during a planned passage.
(Transas)
When satisfied with the plan and its associated elements, name the route and save it, if this has not already been done. If the ECDIS is connected to a printer, details of the planned route can now be printed (see Figure 111).
There is always a chance of hardware or software failure resulting in the loss of route data (not just for the current route
but including all saved routes). It is therefore recommended that the route is saved regularly during the planning phase,
including a back-up to an external USB drive.
101

Passage Planning Guidelines
r.!Print Preview
I◄ ◄ I Page 1 of 19 _!J!lJ
PASSAGE PLAN CHECKLIST
1. GENERAL
Voyage No. I Ship's Name I Call Sign I MMSI I Master's Name
12 I KOLA I UCKB I 273130500 I H. Morgan
2. DISTANCE AND TIME
FROM: St-Petersburg TO: Hamburg VIA: Skagen ETD: 23-12-13 22:00 ETA: 29-12-13 00:31
Barth to PIiot PIiot to PIiot PIiot to Barth Totsl
Distance 13.92 NM 1305.24 NM 79.49 NM 1398.65 NM
Distance (RL) 13.92 NM 1305.24 NM 79.49 NM 1398.65 NM
Distance (GC) 0.00 NM 0.00 NM 0.00 NM 0.00 NM
Time 00 d 01 h 09 m 04d 12h44m 00d06h37m 04 d 20 h 31 m
Average speed 12.0 kn 12.0 kn 12.0 kn 12.0 kn
Fuel Consumption 501.89 kg 4326.27 kg 2785.37 kg 7613.53 kg
Figure 111: Details of the planned route can be printed. (Transas)
102

CHAPTER 4 Passage Planning on ECDIS
4.4 Supplementary Information
Inserting a 'danger highlight', notes and features using mariner-added objects ensures that the navigator is informed and
reminded of potential dangers and actions to be taken at various points during the passage. The quantity of additional
information should be limited to that which is necessary to safely and efficiently execute the route, although this will depend
upon the complexity of the plan, the environmental conditions and the proximity of dangers. The following list provides
examples of additional information:
• Areas of danger
• areas of EN Cs known to be of poor quality
• areas of overlapping ENC data
• areas of poor GNSS coverage
• areas of RCDS mode
• areas of special interest or concern, such as anti-piracy measures to be taken
• areas where accuracy of position fixing is critical {determine cross-checking interval)
• areas where marine environmental protection considerations apply {MARPOL, SECA)
• changes in !ALA systems of buoyage
• contingencies
• head marks, points of interest, fixing points
• international regulations, codes and guidelines
• manoeuvring characteristics
• no-go lines
• pilotage information
• planned alterations of speed
• planned changes of safety depth and safety contour values
• planned time zone changes
• positions where a change in machinery status is required
• positions where additional bridge or engine room manning is required
• reporting points
• ships' routeing and reporting systems with instructions
• sunrise and sunset times
• tides and currents
• vessel traffic services {VTS)
• where multiple routes are used, planned loading of routes.
When adding information to the passage plan, it should be carefully checked to ensure that it does not obscure important
charted information and that it is prominent in the night palette.
103

Passage Planning Guidelines
I I
.;. I I I -----r-
10nm I I I
f) I
C) II I I I I I I
r .... .
= ......... i
(�)
(�)
�- Route
C)
{ .... ..J
#
\ I / 'i-----/
C)
/ ·• .. • ..... /
I I )··-,
l-'
10 I I I I
(�_-_) 1=
·\ -----
No Go! Ongoing subma imf·e:iiercise
c·.-_) . ... )
CD Beware high speed craft cr?ssing
(�'.l C f�:t�:3 Portland Bill LtHse visible 330 CJ
C)
C)
I I I I I I I I I I
[J Main Dual AIS Advanced Planning Charts Conf1g Log Book Man Corr Maps Monitoring Navigation Navtex Overlays Targets Tasks Tasks List !'. []
Figure 112: Example of mariner-added objects being used to highlight dangers and add navigational and cautionary information. (Transas)
Figure 113: It is always worth checking that mariner-added objects are prominent in the night palette, particularly if that
area will be transited at night. (Transas)
A key feature of mariner-added objects is the ability to add a danger highlight. Points and areas inserted using this feature
will trigger an alarm during route monitoring when they interact with the detection area. This is a useful tool for manually
constructing no-go areas on RNCs that can be alarmed, or on ENCs where specific contours do not exist (see Annex G - Safety
Depth and Safety Contours).
104

10nm
by 41048
1 :3,000,000
CHAPTER 4 Passage Planning on ECDIS
Figure 114: Example of danger highlight being used to indicate no-go areas.
Muir Seamount
BERMUDA RISE Siboney Seamount
NORTH AMERICAN BASIN
George Seamount
---
-----'-,1"--Jr-..,,
/'"'-../
-------
Figure 115: Example of ECDIS being used to calculate and display rising and setting times of astronomical bodies
based upon estimates of ship position. (Transas)
105

Passage Planning Guidelines
Ensure that inserted notes are positioned where they can be clearly seen by the navigator. Where a SCAM IN value is required
to be attributed to an inserted mariner-added object, ensure it is visible at appropriate scales to avoid it being hidden when
the route is executed.
When complete, all supplementary information files should be named appropriately, to ensure the correct files are loaded
during the monitoring phase, and saved.
106

CHAPTER 4 Passage Planning on ECDIS
4.5 Manual Updates
Where the ENC requires updating manually, the manual update function can be used to insert symbols, lines and areas. This
may be required, for example, where information relevant to the planned route is received in the form of a navigational
warning and the sailing date precedes the inclusion of such information within an automatic update. To replicate ENC
symbols, the navigator should have access to any of the chart symbols contained within the PL. In addition, an ECDIS is
capable of sensing indications and alerts related to any manual updates inserted in the ENC, as it does for automatic ENC
updates.
Figure 116: Deleted manual update. Figure 117: Inserted manual update.
107

Passage Planning Guidelines
4.6 Route Check
The route must now be checked for potential dangers in case any have been overlooked. When the ECDIS route check is
performed, charted dangers, unsafe depths and potential hazards will be identified. The navigator should be aware that
this check may only be conducted within the confines of the specified XTO, depending on the particular ECDIS.
The route check will detect the following danger to navigation parameters within the user-specified XTD, generating an
indication when it does so:
• If a route is planned across the safety contour
• if a route is planned closer than a user-specified distance from the boundary of a prohibited area or a geographic area for
which special conditions exist, such as:
anchorage area
areas to be avoided
caution area
inshore traffic zone
marine farm/aquaculture
military practice area
offshore production area
PSSA
restricted area
seaplane landing area
submarine transit lane
TSS
user-defined areas to be avoided
• if a route is planned closer than a user-specified distance from a point object, such as
a fixed or floating aid to navigation
isolated danger.
The user-specified distance stated above refers to the width of the XTD. The capabilities of ECDIS with regard to the route
check vary considerably and some ECDIS may have additional functionality within the route check, such as:
• Configuration of route check criteria
prohibited areas
geographic areas for which special conditions exist
• detection of soundings equal to or less than the safety depth value
• detection of additional layers, such as
anti-piracy
NAVTEX
• draught and UKC checked against charted depths within the XTD
• turning data to ensure that planned turns are achievable
• detection of abnormalities in route construction (eg two waypoints in a single location).
108
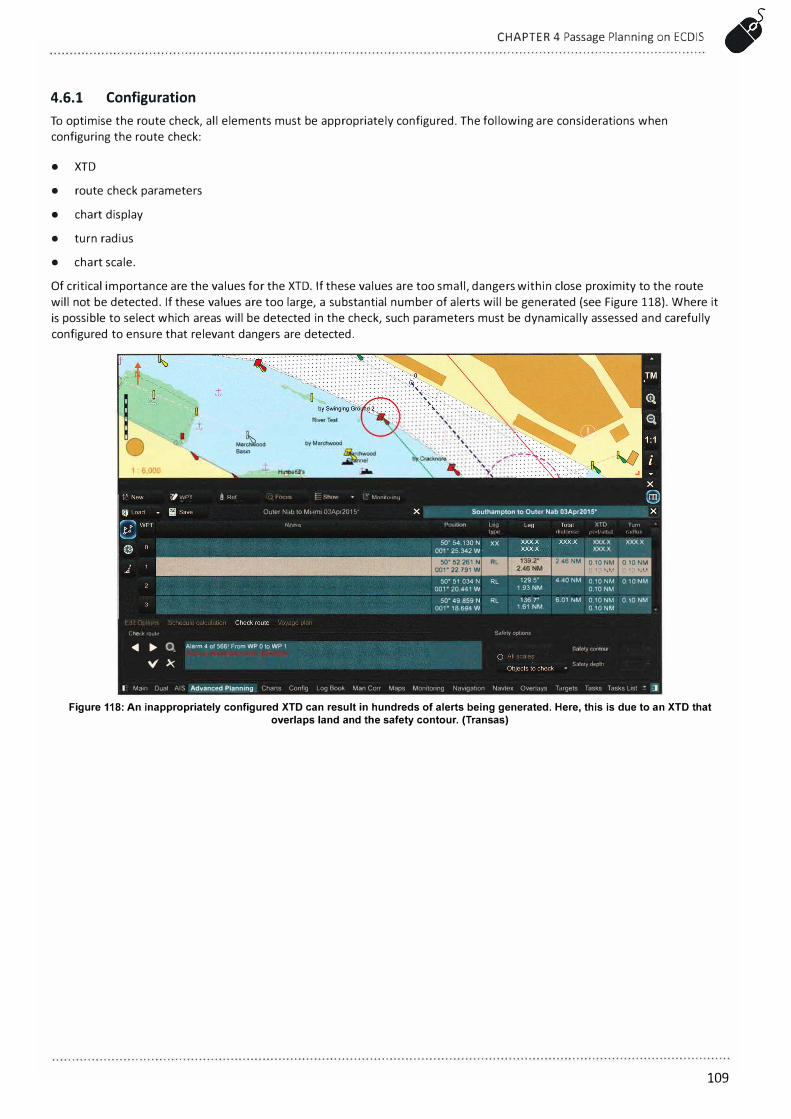
CHAPTER 4 Passage Planning on ECOIS
4.6.1 Configuration
To optimise the route check, all elements must be appropriately configured. The following are considerations when
configuring the route check:
• XTO
• route check parameters
• chart display
• turn radius
• chart scale.
Of critical importance are the values for the XTO. If these values are too small, dangers within close proximity to the route
will not be detected. If these values are too large, a substantial number of alerts will be generated (see Figure 118). Where it
is possible to select which areas will be detected in the check, such parameters must be dynamically assessed and carefully
configured to ensure that relevant dangers are detected.
?/vvPr
!;t .. !,.k,out•.!
Mar�ood Basin
8 l�,,f
Outer N,1l.J to M1,1rn1 03Apr20 1 �i"
N,11l1t'
◄ ► Q Alarm 4 of 566! From WP Oto WP 1
Mn1111,ir111,1
Southampton to Outer Nab 03Apr201s•
50"54.130N XX
001 • 25.342 W ·
,li·,l.111,,• ,,,,·t•;tlh! Turn
r,1duh
1111• lillllllll so· 51.034 N RL 129.5" 4 40 NM 0.10 NM 0.10 NM
001"20.441 W 1.93NM 0.10NM
so· 49.859 N RL
001" 18.694 W
136.7°
6.01 NM 0.10 NM 0.10 NM 1.61 NM 0.10 NM
Sah:ty uption�
S,lfely <l<'plh
M,1111 Dual AIS Advanced Planning Charts Conft(J Lug Bnok Man Corr M.-1ps Mo111\ormg N;iv1gat1on Nav!<:x Overl;-iys Tc11gets fasKs Tasks Lisi [)
Figure 118: An inappropriately configured XTD can result in hundreds of alerts being generated. Here, this is due to an XTD that overlaps land and the safety contour. (Transas)
109

Passage Planning Guidelines
_; For.us !:� Show
· load • � Save o· load • � Save Outer Nab to Miami 03Apr2015
Check route
Check route
X X -XX-XX X X -XX-XX XX:XX XX:XX
03-04-15 08,59
03-04-15 09,18
03-04-15 0928
&,
�
,UP
,™
�· �
Southampton to Outer Nab 03Apr2015*
Total tirm_•
Speed Average speed
03-04-15 XX-XX-XX XX-XX-XX XXX.X
08,35
03.04.1.c;, OOdOOh OOdOOh 6.0kn 0 AIDS lo Navigation
03 Anchorage area 0 AreHs to be avoided
03 Caution c1rea 0 D<mger Area
Env Sens Area Ice cirea l11shorc traffic lone Land tfonger Marine F<1rm Culture
ObJects to check
6.0 kn 6.0 kn
10.0 kn 10.0 kn
--'""'"'Y depth
[_ Main Dual A!S Advanced Planning Charts Config Log Book Man Corr Maps Monitoring Navigation Navtex Overlays Targets Tasks Tasks List [I
Figure 119: Configuring which areas the route check detects is critical to safe route checking. (Transas)
The chart display must also be configured so that potential dangers detected by the route check are shown. Selection of the
all other display category is recommended. Another factor that must be considered is the ability, on some ECDIS, to select
between conducting the route check on all scales or on the best scale ENCs only. Although a route check conducted on only the
best scale charts will undoubtedly be quicker and highlight fewer errors, it will not detect inconsistencies between different ENC
scales of the same area. Consequently, dangers and errors can easily be missed (see Figures 120 and 121).
It is recommended that the route check incorporates all ENC scales.
110
•
• = -� ,. I'�
I'�
·":�
� Rt>'. .I Fon1s �� Show ::,· Monitminn
o· Load ,,,. � Save' Outer Nab to Miami 03Apr2015 X Southampton to Outer Nab 03Apr2015'"
Name ETA St;iy Time ETD TTG Tot;il SreNl (1111\'
03-04-15 03-04-15 00 d 00 h 00 d 01 h 10.0 kn 10.0 kn 09,58 09'58 10m 23m
lilllllllllllllllllllllllll 03-04-15 03-04-15 00 d 00 h 00 d 01 h 10.0 kn 10.0 kn
m31 10,31 14m 56m
03-04-15 03-04-15 OOdOOh 00 d 02 h 10.0 kn 10.0 kn 10:49 10:49 18m 14m
Check route
Check route Safety options
◄ ► Q Alarm 458 of 565! From WP 6 to WP 7 Safety contour
0bJ£'C!S to Chf!ck Safety dep1h
1; Main Dual AIS Advanced Planning Charts Config Log Book Man Corr Maps Monitoring Navigation Navtex Overlays Targets Tasks Tasks List [I
Figure 120: Checking a route on all ENC scales can highlight discrepancies. Here, an isolated danger that is a
danger to own ship has been identified on a band 5 chart (red circle). (Transas)

------,
I
I
I
I
CHAPTER 4 Passage Planning on ECDIS
.. ______ _ _ ..... ___ ----------
Figure 121: On inspection of the band 6 ENC, the object is no longer displayed as a danger to own ship, but an isolated danger
deemed not dangerous to navigation. This illustrates the need to conduct a route check on all ENC scales. (Transas)
Supplementary information can be loaded for the route check, although it should be noted that any mariner-added objects
containing the danger attribute will be highlighted during the check, where it meets the XTD.
4.6.2 Conducting the Route Check
Load the planned route and activate the route check function on all chart scales. ECDIS will now check, within the XTD of the
entire route, for potential dangers on all installed ENCs for the voyage. When the check is complete, all potential dangers will
be available for viewing. Some systems may list this information according to the relevant leg affected. It should be possible
to view each individual danger, which in turn will be highlighted by the system so that it can be differentiated from other
dangers (see Figures 122 and 123). You must interrogate the highlighted dangers to ascertain further information. Some
detected dangers can be disregarded, while others will require revision of the route, which is normally facilitated within the
route check function itself.
When editing is complete, the modified passage plan will need to be route checked again. Some systems may provide the
ability to check individual legs for this purpose, but it may be necessary to conduct a check of the entire route again where
this function does not exist. The check is complete when all dangers have been analysed and disregarded, or if the route has
been amended and rechecked.
111

Passage Planning Guidelines
<' "' I
' ' : \:
( I
( : ( I i' I :
I!
t}evice1(FAD) Southeast Buoy � D\ �\ 't ...
r New
I I I I 1' ' I
?,"}PT ) Foc:us i� Shnw
15· Lo.1rl .. � S;wn Outer Nab to Miami 03Apr201 s•
N<'lrne
Check route
Check route
◄ ► Q Alarm 187 of 1004! From WP 5 to WP 6
:?' Mo111tnr111q
05-04-15 10:50
11-04-15 16:08
Southampton to Outer Nab 03Apr2015
Tot,il 11Jllf•
Speerl
05-04-15 01 d 10h 01 d22h 20.0kn 20.0kn 10:50 58 m 16 m
11-04-15 06 d 05 h 08 d 03 h 20.0 kn 20.0 kn 16:08 17 m 34 m
--------11-04-15
23:55 11-04-15 00 d 05 h 08 d 11 h 20.0 kn 20.0 kn
23:55 07 m 21 m
Safe;ty options
Safety contour
ObJer:ts to r:her:k Srtfe!y depth
IJ Main Dual AIS Advanced Planning Charts Config Log Book Man Corr Maps Momtonng Navigation Navtex Overlays Targets Tasks Tasks List [I
Figure 122: The border of a restricted area has been highlighted. (Transas)
, area
l:l!9!1!!W! Textual descri lion Restriction (RESTRN) : 14 (area to be avoided Information (INFORM) : Prohibited area
)
Scale minimum (SCAMIN) : 259999 Textual description (TXTDSC): US5FL21H.TXT Source date (SORDAT): 20021005 Source indication (SORIND): US,US.graph,Chart 11465
Proh1b1ted Areas (Areas to be Avoided)
IUnder the Florida Keys National Manne Sanc-tuary and Protection Act Pub L 101-605 and IMO advisory SN/C1rc 145, these areas are to be avoided by tank vessels and vessels greater than 50 meters m length
North Atlantic Ocean
Close
Unmark
(j Main Dual Info AIS Ad vanced Planning Charts Config Log Book Man Corr M arge s • Tasks List .: l1 aps Monitormg Navigation Navtex Overlays T t
Figure 123: The reason for the restriction is available via cursor pick. The route may need to be edited around this area. (Transas)
The number of parameters that the automatic route check detects means that even the shortest of routes may result in
a large number of detected dangers. If the route check does not list any detected dangers, this may be an indication that
settings have not been configured correctly. The most likely cause is that no value has been set for XTO, but it may also be
that the check has failed to scrutinise all ENC scales available. If this occurs, set the XTO to an appropriate value and, where
112

CHAPTER 4 Passage Planning on ECDIS
available, set the scale of ENCs to be checked to cover 'all scales' and run the check again. A route check should be performed
prior to departure and on the following occasions:
• Following modification of a route
• following an ENC update
• following a change in the safety settings.
4.6.3 Visual Check
Careful visual inspection of the entire planned route must also be conducted. This should be undertaken using appropriate
scale ENCs and the all other display category to confirm that the route, and any likely deviations, are clear of danger. Once the
visual check has been completed, save any necessary changes to the route.
113

Passage Planning Guidelines
4.7 Detailed Briefing
The detailed passage plan can now be presented to the Master for consideration and approval, prior to the commencement
of the passage. The Master's scrutiny of the detailed plan is an essential additional safety check and modifications may be
required as a result. Good use of ECDIS or a planning terminal should be made to brief the Master, so that any critical phase
of the passage can be better explained. Key points that may be appropriate in the Master's brief are as follows:
• Overall speed, time (ETD, ETA) and distance
any elements that have changed significantly from the appraisal
changes to speed en route
estimated fuel consumption
• route and any alternatives
areas where it is planned to cross the safety contour
areas of high traffic density
marine environment protection measures
MARPOL/SECA
no-go lines
• other
anti-piracy
change of time zones and locations
known meteorological data
predicted currents with their likely strength and direction
sunrise and sunset times
territorial sea boundaries
areas where bridge watchkeeping levels may need to be increased.
On completion of the brief, the approval of the plan by the Master should be recorded and all documentation retained for
port State inspections and ISM audits.
Although some changes to the plan are inevitable, never underestimate the value of sound planning. The more complete
the preparation, the easier the monitoring.
114

CHAPTER 4 Passage Planning on ECDIS
4.8 ECDIS References
Organisation Source
IHO 5-32 Hydrographic Dictionary, Appendix 1, Glossary of ECDIS Related Terms
S-52 Specifications for Chart Content and Display Aspects of ECDIS
S-52 Annex A, IHO Presentation Library for ECDIS Edition 4.0.0
S-52 Appendix 1, Guidance on Updating the Electronic Navigational Chart
5-52 Appendix 2, Colours and Symbols Specifications for ECDIS
5-57 Maintenance Document No. 8
5-57 Transfer Standard for Digital Hydrographic Data
S-63 IHO Data Protection Scheme
IEC IEC 61174 ECDIS - Operational and Performance Requirements, Methods of Testing and Required Test
Results Edition 4.0
IMO Resolution MSC.232(82) Revised Performance Standards for ECDIS
Resolution MSC.252(83) Revised Performance Standards for INS
Circular MSC.1/Circ.1503/Rev.1, ECDIS - Guidance for Good Practice
Circular SN.1/Circ.255, Additional Guidance on Chart Datums and the Accuracy of Positions on Charts
NOAA US Chart 1
Note: Circular MSC.1/Circ.1503/Rev.1, ECDIS- Guidance for Good Practice has revoked and replaced: MSC.1/Circ.1391,
MSC.1/Circ.1503 and Corrigenda 1, SN.1/Circ.207 /Rev.1, SN.1/Circ.266/Rev.1, SN.1/Circ.276, SN.1/Circ.312, STCW.7 /Circ.10
and STCW. 7 /Circ.18.
115

Annex A - Example Appraisal Report Format
Appraisal Report
General Information
From: ...................................... To: ......................................... .
Distance: ........................... (RL/GC/Composite GC)
Planned time of departure: .................. (local) ............ (GMT)
Planned time of arrival: .................. (local) ............ (GMT)
Time required: ..................... (hrs)
Speed overall: ..................... (kts)
Estimated fuel consumption: ...................................................... ..
Fuel on departure: ...................................................................... ..
Estimated fuel remaining on arrival: .......................................... ..
Bunkering required to complete passage: Yes/No
Predicted HoT on departure: .................................................. (m)
Time of HW: .................. (time zone) HoT at HW: .................... (m)
Time of LW: ................... (time zone) HoT at LW: ..................... (m)
Time of sunrise/sunset at departure port: ........................ (local)
% rate of springs: ....................................................................... ..
Squat allowance: .................................................................... (m)
Minimum UKC: ....................................................................... (m)
No-go line/safety depth: ........................................................ (m)
117
References/Remarks
Distance determined using:
a . ............................ .
b . ............................ .

Passage Planning Guidelines
Predicted HoT on arrival: ........................................................ (m)
Time of HW: .................. (time zone) HoT at HW: .................... (m)
Time of LW: ................... (time zone) HoT at LW: ..................... (m)
Time of sunrise/sunset at destination port: ....................... (local)
% rate of springs: ..........................................................................
Squat allowance: .................................................................... (m)
Minimum UKC: ....................................................................... (m)
No-go line/safety depth: .................................... (m) .......................
• Outline route(s) on a small scale chart, highlight any routeing information Explain the advantages/disadvantages
from 'Sailing Directions' or 'Ocean Passages for the World', ie TSS, deep water of alternative routes
routes, areas to avoid etc.
• Highlight any navigational hazards along the route that require specific
consideration, ie areas of coral, poor survey data, restricted sea room etc.
• Relevant port information such as minimum charted depths in fairways/ Source of information:
channels, pilot boarding position, availability of tugs, berths and their charted
depths, port regulations etc.
• Weather/climatological information: Source of weather information: - Statistical weather or climatological information- Forecast weather (if available at time of briefing).
• Predicted tidal streams or ocean currents, whether assisting or hampering Source of tidal/current information:
progress.
• Name of weather routeing service (if applicable) .
• Highlight any MARPOL restrictions along the route .
• Highlight any ballast water exchange requirements along the route .
• Highlight any advisories from flag State that relate to the route .
• Confirm that all necessary charts and publications to support the passage are
held and their update (NM) status.
• Highlight the available navigation methods/aids available along the route .
• Have different route options been prepared and presented to the Master?
• Has the Master finalised the route choice?
• Advise whether ship has been to the destination port(s) in the past? (If so, the Dates of voyage/copy of previous
navigator can draw upon the record of previous passage to identify the route passage plan
selected and any comments made either at the appraisal or post passage ....................................
analysis stages).
• Advise whether any officer on board has experience relevant to that area/ Officer's name
port? ....................................
Record of information obtained
....................................
118

Annex B - Passage Planning Checklists
Checklist A: Questions I I References/Remarks
General Information
1. Name of the destination port(s) and confirmed by the
Master?
2. Ship's draught and stability confirmed by Chief Officer?
3. Ship's condition; loaded or in ballast?
(For ship's manoeuvring data)
4. Bunkering requirements confirmed by Chief Officer?
5. Are there any port/pilot/agent/charterer's instructions
for the intended passage?
6. Does the company have any special instructions
pertaining to the route?
7. Has the Master given any particular instructions?
➔ Name .................................... ..
➔ Lat/Long ............................... ..
➔ Confirmed Draught:
Fwd ................................. m/ft
Aft ................................. m/ft
➔ Loaded/In ballast
➔ Bunkers on departure
............... m3 .................... %
Predicted bunkers on arrival
............... m3
.................... %
➔ Yes/No (If YES, Sheet No.)
➔ Yes/No (If YES, Sheet No.)
➔ Yes/No (If YES, Sheet No.)
8. Is the vessel required to use weather routeing? Name of
service.
➔ Yes/No (If YES, name of weather routeing service).
9. Are there any MARPOL requirements applicable to this
passage?
10. Are there any ballast water exchange applicable to this
passage?
11. Are there any advisories from the flag State or task
forces?
12. Have different route options been prepared and
presented to the Master?
13. Has the Master selected the route choice? Chosen
option?
14. Has the ship been to the destination port(s) in the past?
(If so, the record of previous passage can help identify
the route and the navigation officer can construct a new
route with amendments).
15. Has any deck officer on board previously visited this
area/port?
➔ Yes/No (If YES, Sheet No.)
➔ Yes/No (If YES, Sheet No.)
➔ Yes/No (If YES, Sheet No.)
➔ Yes/No (If YES, Sheet No.)
➔ Yes/No (If YES, which route option selected?)
➔ Date of voyage/Copy of previous passage plan
➔ ............................................. ..
➔ Name of officer/Record of information obtained
➔ .............................................. .
119

Passage Planning Guidelines
Checklist B: Questions I I References/Remarks
a) Vessel
1. Is there any bunker port diversion to consider ➔ Yes/No (If YES, Name of port, Sheet No.)bunkering?
..................................................
Are charts held for diversion port?
2. Has the pilot card been updated? (If possible, obtain a ➔ Yes/No (If YES, Sheet No.)
copy and attach with passage plan). . .................................................
Does the ship have sufficient UKC throughout passage? ➔ Planned minimum UKC:
3. .. ......................................... m/ft
4. Has room been planned to allow the ship to manoeuvre ➔ Yes/No (If YES, Location and Chart No.)
in the pilot boarding area to provide a lee for pilot boat? ..................................................
5. Are there any overhead cables/bridges in the passage ➔ Yes/No (If YES, Location and Chart No.)
for consideration of air draught? ..................................................
6. Are there any special cargo condition/requirements that ➔ Yes/No (If YES, Sheet No.)
may affect the passage plan? ..................................................
b) Weather ➔ Source of weather data:
1. What meteorological conditions are expected en route? ..................................................
2. Does the plan take meteorological conditions into ➔ Yes/No (If YES, Sheet No.)
account? ··················································
3. Have the latest weather forecasts/warnings been ➔ Time of most recent forecast:
obtained, checked and allowed for? ······················ · · · · · · ·········· · · · · ·· · · ····
4. Does the ship follow advice from any weather routeing ➔ Yes/No (If YES, Sheet No.)
service? ··················································
c) Watchkeeping and Other Personnel
1. Have OOW/lookout doubling up watches been ➔ Yes/No (If YES, Sheet No.)
considered with respect to adverse weather/restricted ..................................................
visibility/critical approaches?
2. Have the crew calling points for anchor/berthing➔ Yes/No (If YES, Sheet No.)
stations, piracy watches been established and noted on
chart/passage plan?..................................................
3. Have the rest hours for watch keepers been considered?➔ Yes/No (If YES, Sheet No.)
. .................................................
d) Passage ➔ Yes/No (If YES, Location(s) Sheet No.)
1. Are there any mandatory ship reporting schemes? . .................................................
2. Has the position of pilot boarding/disembarkation points ➔ Yes/No (If YES, Position Sheet No.)
been established? ..................................................
3. Has clock adjustment with respect to local times been➔ Yes/No (If YES, Position(s) and Dates Sheet No.)
considered and times/positions noted on chart to
advance/retard clocks?..................................................
4. Has location, suitability and availability of anchorage
berths been considered? ➔ Yes/No (If YES, Position(s), Sheet No.)
..................................................
Are suitable charts held for anchorage berths?
5. Has a risk assessment been carried out for predicted ➔ Yes/No (If YES, Position(s), Sheet No.)
areas of danger? ..................................................
120

Publications
Checklist C: Questions I I References/Remarks
Annexes
1. Are all the correct scale charts and publicationsnecessary to plan and execute the passage held onboard?
➔ Yes/No (If No, list missing charts or publications)
If additional charts are required will they be receivedbefore sailing?
2. Are there any local charts or publications required fordeparture and destination port?
Have they been ordered/will they be received prior todeparture?
3. Are the following publications held on board andcorrected up to date?
4.
a. Chart Catalogue (NP131)
b. Navigational Charts - including largest scaleavailable
c. Routeing Charts
d. Mariner's Routeing Charts
e. Port Approach Guide Charts
f. - Admiralty Weekly Notices to Mariners- Annual Summary Notice to Mariners
g. Admiralty/other Distance Tables
h. Sailing Directions
i. Tide Tables
j. Tidal Stream Atlases
k. List of Lights and Fog Signals
I. List of Radio Signals
m. Guide to Port Entry
n. The Mariner's Handbook (NPlO0)
0. Ocean Passages for the World (NP136)
p. Ships' Routeing (IMO)
q. Load Line Chart
r. Other ..........................
Additional Publications
a. MSNs, MGNs, MINs
b. Manuals for all the navigational equipment
c. International Code of Signals
d. Chart Correction Log (NP133A)
e. IALA System of Buoyage (NP735)
f. Symbols and Abbreviations (BA Chart 5011)
g. Additional ....................................................
➔ Yes/No (If Yes, list local required charts orpublications) ............................ .
➔ Edn ........................................... .
➔ Corrected to NM
➔ Edn ........................................... .
➔ Latest NTM on board
➔ Edn ........................................... .
➔ Latest NM on board
➔ ··················································
➔ Edn ... ... ... Corrected to NM ... .
➔ Edn ........................................... .
➔ Edn ........................................... .
➔ Edn ... ... ... Corrected to NM
➔ Edn ... ... ... Corrected to NM
➔ Edn ........................................... .
➔ Edn ... ... ... Corrected to NM
➔ Edn ... ... ... Corrected to NM
➔ Edn ........................................... .
➔ Edn ........................................... .
➔ Edn ........................................... .
➔ Latest number held ................. .
➔ Location on bridge .................. .
➔ Edn ........................................... .
➔ Edn ........................................... .
➔ Edn ........................................... .
➔ Edn ........................................... .
➔ ................................................. .
121

Passage Planning Guidelines
Plan
Checklist D: Questions I I References/Remarks
1 ....... f:iav�.�l1ef()ll()V:J.ir1g.be�11.1T1arked/dra.V:J..n .. ()n.�11.e .. c.h.a.�t .. . . .... .......... . .... .............. ............ ··➔·· Yes/No.(if YES, Sheei: No:)··· a. Margins of safety as required by the Master/Company.
b. Predicated areas of danger and no-go areas. ····················································· ··· ··· ············ · ➔ ves/No.(itvi:sisheei:.No:)······
c. ··· MinimumUi<c·i-eciufred·tor eac h.ieg ofi:he .. passage;·pa rticulariv in ··· shallow waters.
d. Courses as recommended by local/international regulations,···················· ......... ... ➔ Yes/No(ifYES, Sheei:NoT .
.
company and the Master's instructions. References ................................. .
e. Waypoints and wheel over points.··· ················································· ············ ··➔ ves/No.(ifves;·Leg Na:l···
t. ···••WitPCii rif •n urn.6.e.r o.rie.��h· 0.�vPo.irif .viithv.ibe.e.i.o.v.e.r irito:•· ................. .. ··········· . ➔ Yes/N o·ma rkeci·o ;;·charts······............
g, ... Ba q a r. C() n s pi c lJ ()us.() �Je cts, . �g . . c.1 iffs, .. h iJ.1.?, . Rf\C() t\l.? ! . . . �.t.�.·.
... . .... . .....
..••.• . ➔ . y e.s./N o . •rn� r ke.� • o.ri . � h � rts •
h. J�arisi�s, clearingbec1�i11gs, �IE!arjng r11a�k.s. ➔··Yes/No marked on charts
2.
i. Points for and cross index range (CIR) for.
········ ➔ Yes/No (lfves, Chart No(sif .paralle!Uriclexi ngJPI) _.
j. Position on chart where additional navigation aids are required to be switched on.
· ·· ·➔··Yes/No (1t·ves;marked on. charts Na(sii
···
k. Abort points and points of no return.··············································································· ············ · ➔··Yes/No(it ves;·ina rked. ori. char
ts· No(slf ··
I. Tidal streams and currents.
m. Sequence of charts for the passage.
· ······ ··························· ············ · ➔· ves/No iit ves;·marked on chari:s .. Na(sll···
································· ...... .. . ...... . . ➔ Yes/No marked on charts Total number of charts ............... .
n. Position from where to move onto next chart along with chart number. ➔ Yes/No marked on all charts
o. ·· vrsor o ther· reporting.points marked. on the.chartancinoi:ed in· i:he · ············ ··➔· Yes/No(1t ·ves,.ina rked oii charts No(slf ··
pa.s?a.g� plan sl1��t. p. Pilot boarding position and alternate pilot boarding position in case
. ..........
. . ➔ Yes/No (ifves, markedoii charts No(sffof adverse weather. ····· · · ➔··ves/No.(if ves,· ma rked. oiicharts· Na(sll
···
q. Speed reduction points. New Speed(s) ............................. . Time ........................................... .
r. Notices to engine room.················································································································ ············ · ➔Yes/No.(1t ·ves, mirked.on.s heei: No(s))···
·· ·························································································································· ··· ·· ······· ··➔ · Yes/N o·(i t ·ves;· marked.on. charts· N a(sn···
s. Point where call is given to ship's crew for anchor/berthing stations.
t. Specific meteorological information related to any area, eg haze, dust storms, areas of restricted visibility, ice.
u. T&P corrections from Notices to Mariners?
v. Areas of special marine environmental protection en route?
··········· ........... Ti .. lll�{?J. .'..'..".'..".'..'..".'..".'..'..".'..".'..'.:.'..".'..'..".'..".'..'.:.'..".'..'.:.'..".'..".'..'.." ................. .➔ Yes/No (If Yes, marked on charts No(s))
References ................................. . ··········· · ➔· ves/No(it ves;·markecion charts· Na(slf..
To NM No ................................... . To NavArea ................................. . ToWZ ......................................... . · · ··➔·· Yes/No.(it ·ves,· ma rkecloii. cha rts· N a(sl i ...
References ................................. . Recorded on leg passage plan sheet
· · ·· · ·· ············ ➔ Yes/No (ifves, markeclon chai-i:s Na(sffHave the latest navigational warnings been taken into account? To NavArea ................................. .
ToWZ ......................................... . 3. ···· Have t he.primarv an d· secori,:iarvmeans of positio n fixin g been agreed ··· ·· ······· · · ➔ ·Yes/No···Record ed ari ieg passagepiari sheet·
4. Have the fixing interval been agreed with the Master for each leg? ············ ··➔··Yes/No···Recorded·ari··iegpassagepiaii
·sheet·
s. ······is there adatum.shift co rrectiorita ·a ppiv i:o.wGss4.positioris· befo re· ········ ············ · ➔··Yes/No···Recorded· ari .. ieg .passage piaii. sheet·
122
lottin on an of the assa e charts? .................................................... .

Annexes ································································································•·············································•···· ···•···················
Checklist E: Questions I I References/Remarks
Contingency Plans
1. Are there contingency plans available for the following?. ·· · · · · · · · · · · · · · · · · · · · · · · · · · · · · · · · · · · · · · · · · · · · · · · ········· ······· · · · · · · · · · · · · · ·· · · · · · · · · · · · · · · · · · · · · · · · · · · · · · · · · · · · · · · · · · · · · · · · · · · · · · · · · · · · · · · · ·· · · · · · · · · · · · · ·
a. Man overboard
b. Fire
c. Flood
d. Steering gear failure
e. Main engine failure
f. Distress or emergency in own ship
..................................................
➔ v��/N�· ···sMs·p�� ��d·�·��· ·��i���·�· �·�···
..................................................
➔ v��;N; · sMs P�;��d·�·��··��i���·�·�·�···
. . .............. .... ............ : .' . :.: .'. _._ :.�.·- '..' ...................................... .
g. Piracy/armed robbery/terrorist activity
h. Failure of electronic navigational aids
i. Radar/ARPA failures
i- . R���ipt �f � ci1�1:���� �����g�t��� ���1:h�� �����i....................... or shC>�E! st�tiC>�
k. Helicopter operations
I. Adverse weather/visibility/ice/TRS
m. Unavailability of pilot/OOW /lookout/helmsman
. .......... ::.:.:.::.:.:.".'..""'''"'"'"'''''''''''''''''''''''''''''
....... :: .. ·.: :. :.: .: .-.:.�.-. :. '. .-.:: ................................ .
123

Passage Planning Guidelines
Briefings and Approval
1.
2.
3.
4.
124
Are all officers and crew fully familiar with relevant
bridge equipment and procedures?
Have OOWs and crew been briefed about the
passage plan?
Have all OOWs seen, understood and signed the
passage plan?
Has the Master reviewed and approved the plan?
➔ Yes/No (If not, reference to company procedure)
➔ Yes/No Signature on passage plan sheet
➔ Yes/No Signature on passage plan sheet
➔ Yes/No Signature on passage plan sheet

Annex C - ECDIS Planning Checklists
Official chart formats
RCDS mode
Contingency chart provision
Time to procure and receive
Time to install
Safety notices
Chart permits and licence
ECDIS
ECDIS software
SOLAS compliant
ENCs of an appropriate scale and accuracy
Appropriate RNCs
Appropriate folio of paper charts
Risk assessment
B. UPDATES
Notices to mariners (NM) ··········· ................................................................................................................. .
Temporary and preliminary notices (T&P NM, AIO)
Local NM
Radio navigational warnings (NAVAREAS and WZs) ........... ..................................................................................................................
Time to update all ECDIS
Relevant ENC and RNC permits held on board
Chart permits up to date
Chart permit expiry
ECDIS licence expiry
Latest software
Generic and type specific training
C. SOFTWARE CONFIGURATION
Latest manufacturer's software patch is installed
Latest presentation library (IHO S-52)
Latest data protection standards (IHO S-63)
Read the latest IMO guidance on ECDIS anomalies
Report ECDIS anomalies to the appropriate authority
125

Passage Planning Guidelines
Display mode
Display set-up
Chart settings
Safety settings
Route settings
Safety values
Other values
126
D. DISPLAY CONFIGURATION
Unload all routes
Unload all manual constructs
Full screen (hide sidebar)
Day white palette
Display mode 'all other'
Chart priority ENC ........... ..................................................................................................................
Chart autoload ON
Chart autoscale ON
Scale minimum ON
AIO layer ON
Shallow pattern ON
Full light lines ON
Show correction ON
Chart boundaries ON
Show isolated dangers in shallow water ON
Traditional chart symbols or simplified
Traditional areas or symbolised
Two or four-colour shades
Safety depth (see below for guidance)
Safety contour (see below for guidance)
Shallow contour
Deep contour
Display of XTL
Display of distances
Display of true courses
Display of waypoint names
Display of turn radius
Safety depth
Safety contour ........... ..................................................................................................................
Safety height
Shallow contour
Deep contour

New route
Adding waypoints
Berth to berth
Areas where the services of a pilot will be used
Name the route
Locate start and end points
Add waypoint at start location
Construct route on small scale
Define leg properties as RL or GC
If GC, divide leg into Rls
Annexes
B. ADJUSTING WAYPOINTS
Regarding the vessel
Draught, available depth of water and
minimum UKC
Manoeuvring characteristics
Effect of course alteration on draught and
turning circle Planned speed
........... ..................................................................................................................
Effect of expected tidal stream ........... ··························································································· ... , ...................
Effect of expected current ........... ······························ .. ··············· .. ·······················································•oo••·····
Decrease in UKC due to squat or heel effect
Positions where change in machinery status is
required
Positions where additional manning is required
Regarding the route
Safety and efficiency of navigation
Depth of water
Safe speed and proximity of navigational
hazards
Use of ships' routeing, reporting systems and
VTS
Protection of the marine environment
Avoidance of danger areas
Alterations of speed en route
Location of course alterations
Limitations of night passage
Tidal restrictions
Adequate XTL
127

Passage Planning Guidelines · · · · · · · · · · · · · · · · · · · · · · · · · · · · · · · · · · · · · · · · · · · · · · · · · · · · · · · · · · · · · · · · · · · · · · · · · · · · · · · · · · · · · · · · · · · · · · · · · · · · · · · · · · · · · · · · · · · · · · · · · · · · · · · · · · · · · · · · · · · · · · · · · · · · · · · · · · · · · · • · · · · · · · · · · · ·
Contingency planning
Method and frequency of position fixing
Save route
Cursor pick
AIO layer
Route table
128
........... . ��.�P. .. �.�.�.e-�·-························································································
........... . �.?.r.� .. ?�.��f.��.�.?.�.?�:.� .. �.n.��.?.r�-�� .. i.n.. �.r:.1-�r.��-��.Y. .................. . Shore-based emergency response arrangements
........... ··················································································································
Nature of the cargo and of the emergency itself
........... ·�·�·i·�·�·�.Y..�.n.? .. �.��.<?.�.?�.�.Y..!!.�.i.�.� .. ?P�.!?.n.� ..................................... . Areas where accuracy of position fixing is critical
........... ··················································································································
Areas of maximum reliability of position fixing ........... ..................................................................................................................
Availability of relative navigation technique visual and
........... . ��?.��.:_i.�!�.?. ......................................................................................... . □ Radar image overlay
........... ···········································································"·"····················"·············
□ Parallel indices
□ Astronomical observations
Isolated dangers outside of safety contour
Gaps in ENC coverage
CATZOCs and accuracy of ENC
Comparison of equivalent RNC where possible
Interrogate symbols
Interrogate objects and areas for more information
T&P NM information
Latitude and longitude of waypoint
XTL (port and starboard)
Arrival radius (for use with track control systems)
Planned speed
Leg property (RL or GC)
Rate of turn
Turn radius
Time zone
Course
Distance
ETD
ETA
Name waypoints where necessary
Draught (provided on some systems)
UKC (provided on some systems)

Occasions for check
Configuration
Detected dangers
Route crosses own ship's safety contour
Point objects
Boundaries of a prohibited or geographic area
After route planning
After modification of a route
After a chart update
All other display mode
Fixed or floating aid to navigation
Isolated danger
Traffic separation zone
Inshore traffic zone
Restricted area
Caution area
Offshore production area
Areas to be avoided
User-defined areas to be avoided
Anchorage area
B. ACTIONS FOLLOWING CHECK
View listed dangers
Use cursor pick to view additional information
Modify route to avoid listed dangers
Disregard dangers deemed not relevant
Re-check relevant legs following modifications
If gaps in ENC coverage visually check RNCs
Visual check of entire route on appropriate
scale charts
Save route
Annexes

Passage Planning Guidelines
Highlight
Detailed briefing
Overall speed, time (ETD, ETA) and distance
Route and alternatives
Other
130
Planned changes of safety depth and safety contour
No-go lines
International regulations, codes and guidelines
'Ships' Routeing', reporting systems and VTS ........... ..................................................................................................................
Planned time zone changes
Tidal diamonds
True direction of the planned route
All areas of danger
Areas of limited data
Areas of special interest and concern
Areas of marine environmental protection
Points of 'no return' and contingencies
Changes in IALA systems of maritime buoyage
Areas where accuracy of position fixing is critical
Areas of maximum reliability of position fixing
Weather concerns and measures to be taken
Significant changes from the appraisal report
Changes to speed en route
Passage graph
No-go lines
Likely concentrations of fishing vessels
Main shipping routes impinging on planned route
Marine environment protection measures
MARPOL
Sunrise and sunset times and locations
Change of time zones and locations
Predicted currents, likely strength and direction
Known meteorological data
Territorial sea boundaries
Anti-piracy areas
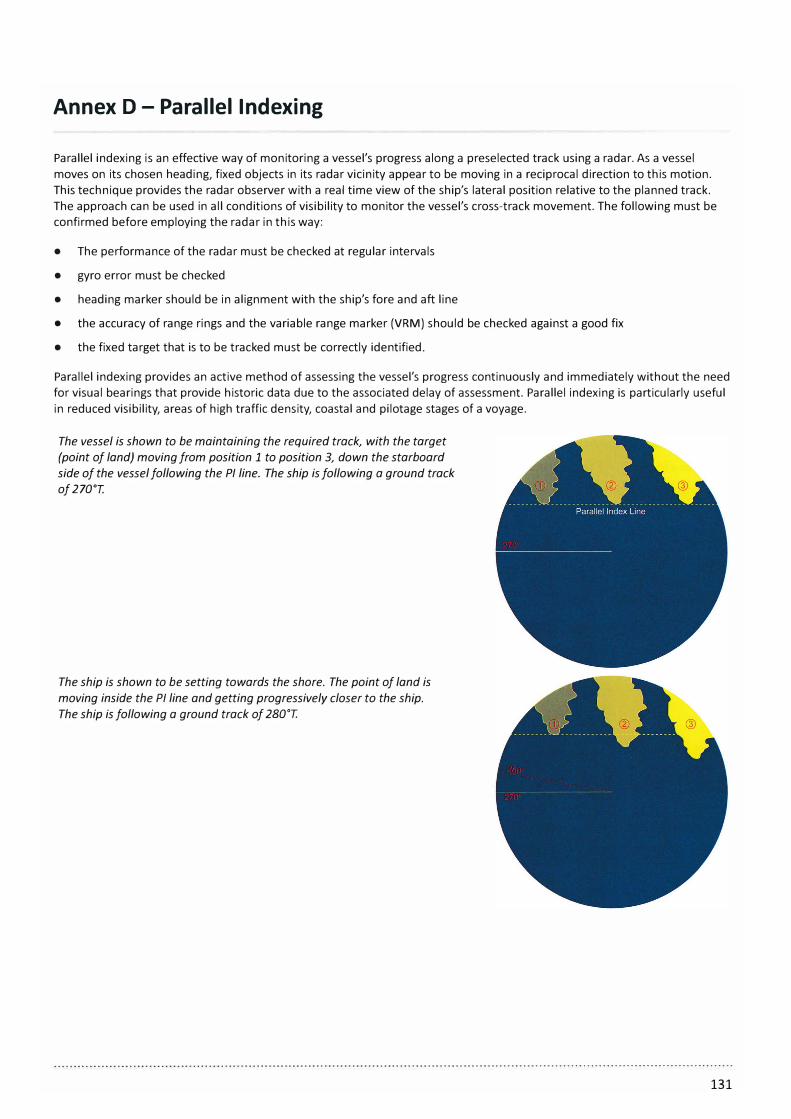
Annex D - Parallel Indexing
Parallel indexing is an effective way of monitoring a vessel's progress along a preselected track using a radar. As a vessel
moves on its chosen heading, fixed objects in its radar vicinity appear to be moving in a reciprocal direction to this motion.
This technique provides the radar observer with a real time view of the ship's lateral position relative to the planned track.
The approach can be used in all conditions of visibility to monitor the vessel's cross-track movement. The following must be
confirmed before employing the radar in this way:
• The performance of the radar must be checked at regular intervals
• gyro error must be checked
• heading marker should be in alignment with the ship's fore and aft line
• the accuracy of range rings and the variable range marker (VRM) should be checked against a good fix
• the fixed target that is to be tracked must be correctly identified.
Parallel indexing provides an active method of assessing the vessel's progress continuously and immediately without the need
for visual bearings that provide historic data due to the associated delay of assessment. Parallel indexing is particularly useful
in reduced visibility, areas of high traffic density, coastal and pilotage stages of a voyage.
The vessel is shown to be maintaining the required track, with the target
(point of land) moving from position 1 to position 3, down the starboard
side of the vessel following the PI line. The ship is following a ground track
of 270°
T.
The ship is shown to be setting towards the shore. The point of land is
moving inside the PI line and getting progressively closer to the ship.
The ship is following a ground track of 280°
T.
131

Passage Planning Guidelines
The ship is shown to be setting away from the shore. The point of land is
moving outside the PI line and getting progressively further from the ship.
The ship is following a ground track of 262°
T.
Cross Index Range (CIR)
This is based on the lateral distance of the planned track from a selected object. It can be used with parallel indexing to
provide a safe 'channel' when the ship needs to move from the charted course line. The following method can be used:
• Identify the hazards and mark the limiting danger lines and tracks
• select a suitable charted object
• draw a line on the chart parallel to the planned track on the inner edge of the selected object
• mark maximum margins of safety (MOS) on either side, or on the side with off-lying dangers
• measure the perpendicular distance from track to this line (this distance is the CIR)
• measure distances for the MOS.
The MOS port distance is treated as a 'not less than' (NLT) distance from the danger and MOS starboard as a 'not more than'
(NMT) distance from the Pl . Mark these three lines on the radar screen as index and MOS lines, either electronically or on the
plotter using VRM and cursor.
Radar display with track, CIR and MOS index lines.
By using additional PI lines, alterations can be incorporated and include the use of wheel over positions marked on the chart.
132

Integration with ECDIS
. -
"'.\· •· . '"\
, ..
PI lines incorporating the next course line. Source: British Admiralty Chart 2500
Annexes
Where the radar display is integrated with an ECDIS, the practice of parallel indexing continues to enable the navigator to
monitor the ship's position relative to the planned track and, additionally, provides a means of continuously monitoring the
positional integrity of the ECDIS system.
Precautions
It is important to remember that PI lines drawn on reflection plotters apply to one range scale only. In addition to all other
precautions necessary for the safe use of radar information, particular care must, therefore, be taken when changing range
scales.
The use of parallel indexing does not remove the requirement for position fixing at regular intervals, using all appropriate
methods available including visual bearings, since parallel indexing only indicates whether the ship is on or off track and not
its progress along the track.
133

I-"
w
.i:,.
Vess
el:
Vo
yag
e N
o:
Fro
m:
Bert
h:
To
:
Bert
h:
(Nam
e o
f be
rth
/wh
arf
/an
cho
rag
e)
Dra
ug
ht
Fwd
:
Aft
:
Way
po
ints
No
. C
ou
rse
Nam
e La
t/
TR
UE/
{C
TS)
Lon
g
Spee
d
Eng
Ord
er
kts
kts
kts
Pas
sag
e P
lan
Pre
par
ed
by:
(Nav
igat
ing
Off
icer)
Dat
e:
Ap
pro
ved
by
:
(Mas
ter)
Dat
e:
m
OO
Wl
:
m
OO
W2
:
Dis
tan
ce a
nd
Tim
es
Nex
t W
ayp
oin
t To
Des
tin
atio
n
Dis
tan
ce
Tim
e D
ista
nce
Tim
e re
mai
nin
g
Re
fere
nce
s: (
Pub
lica
tio
n N
P N
o./
Vo
l N
o./
Pag
e N
o.)
Up
date
Sta
te:
Dat
e:
NM
No
.:
Sai
lin
g D
irect
ion
s:
Oce
an
P
assa
ges
for
the
W
orl
d:
AL
RS
:
ATT
:
ALL
FS
:
NA
VTE
X S
tati
on
s:
VH
F C
han
nels
:
Fixi
ng
Ref
eren
ce M
arks
Freq
uen
cy
Curr
ent
Para
llel
Wh
eel
Tid
al
Ch
arts
In
dex
O
ver
Pri
mar
y St
ream
No
s D
atu
m
CIR
B
eari
ng
Seco
nd
ary
x R
ange
Rem
arks
l>
:::::,
:::::,
n,
><
m
I
m
><
tu
3
"CJ
- n,
""CJ
tu
"'
"'
tu
n,
""CJ
- tu
:::::,
� -s
""
"'
:::r
n,
n,
,....
-n
0
-s
3
tu
,....

Annex F - Example of Passage Planning Notes
Passage: Milford Haven to Liverpool
Leg 6 From Waypoint 6 {53 29.4N 004 52.05W) to
Waypoint 7 {53 30.7N 004 24.35W)
Course True: 035 Course to steer: 034
Tides and Currents Time of HW: 24/0001 Direction: 228
GMT at: Liverpool
% Springs: 78% Strength: 1.6 kts
Minimum Predicted Height of Tide: 1.1 m Minimum predicted UKC: 30 m
Distance On Leg 12.3 nm
Times: At start of Leg: 0510 At end of Leg: 0623
Primary Fixing Method and Marks Visual/Radar
• South Stack Lighthouse (FI 10 s) (28 m white round tower) (Visual and Radar)• Radio Mast (113) (53 15.55N 004 40.lW) (Visual) • Holyhead Breakwater Light (Fl{3)10 s) (19 m white square stone tower, with black band) (Visual)• Mynydd y Garn monument {168) (53 23.14N 004 32.lW) (Visual) • The Skerries Lighthouse (Fl{2) 15 s) (23 m white round tower with red band) (AIS- MMSI 992351121
and Racon (T)) (Visual and Radar) • North Stack headland (Radar) .
BA Chart(s) BA 1977
Fixing Frequency 12 mins
Cross Checking GPS and Parall el Indexing
Parallel Indexing South Stack Headland {5.32 nm to starboard)
Margin of Safety (to remain within traffic lane): 4.32 nm starboard/ 6.32 nm port
Skerries Lighthouse {3.95 nm to starboard)
Margin of Safety (to remain within traffic lane): 2.95 nm starboard/ 4.95 nm port
Safe Water To Port: In excess of 10 nm To Starboard: To edge of TSS 1 nm
Position/ Track approaches and enters to the Skerries TSS. It is positioned in the centre of the NE bound traffic lane of
Lining Up the TSS. Width of the lane is 2 nm. To port lies the TSS separation zone and to starboard the edge of the TSS.
Traffic The port of Holyhead lies 8 nm to starboard. This is a ferry port for Dublin and at the start of Leg 6 it may be
busy with crossing ferry traffic, including high speed craft.
Traffic in the TSS is expected to follow the traffic lanes. Small craft, sailing vessels and fishing vessels may be
encountered both in the approaches to the TSS and in the TSS itself.
NOTE: LADEN TANKERS SHOULD AVOID THE AREA BETWEEN THE TSS AND THE COAST.
Commercial traffic bound for Liverpool and the ports in Liverpool Bay, fishing vessels and recreational craft
following the lane may be encountered. A good lookout using all means available (visual, radar, AIS and
VHF radio information) needs to be maintained to watch for unusual craft, recreational and fishing vessels
operating in or in the vicinity of the TSS.
Reporting There are no reports points on this Leg.
Monitoring Holyhead Port Control Ch 16 and 14
Holyhead Coastguard on Ch 16 and 67
Weather forecasts on Ch 23 and 86: 0150 / 0450 / 0750 / 1050 / 1350
NAVTEX: Portpatrick (0)
Bridge Manning and Engine Availability As per ship's passage plan
Contingencies Anchorage may be found in Holyhead Bay, however laden tankers should not navigate between the TSS and
the coast.
Notes Sunrise occurs at 0505 GMT
35
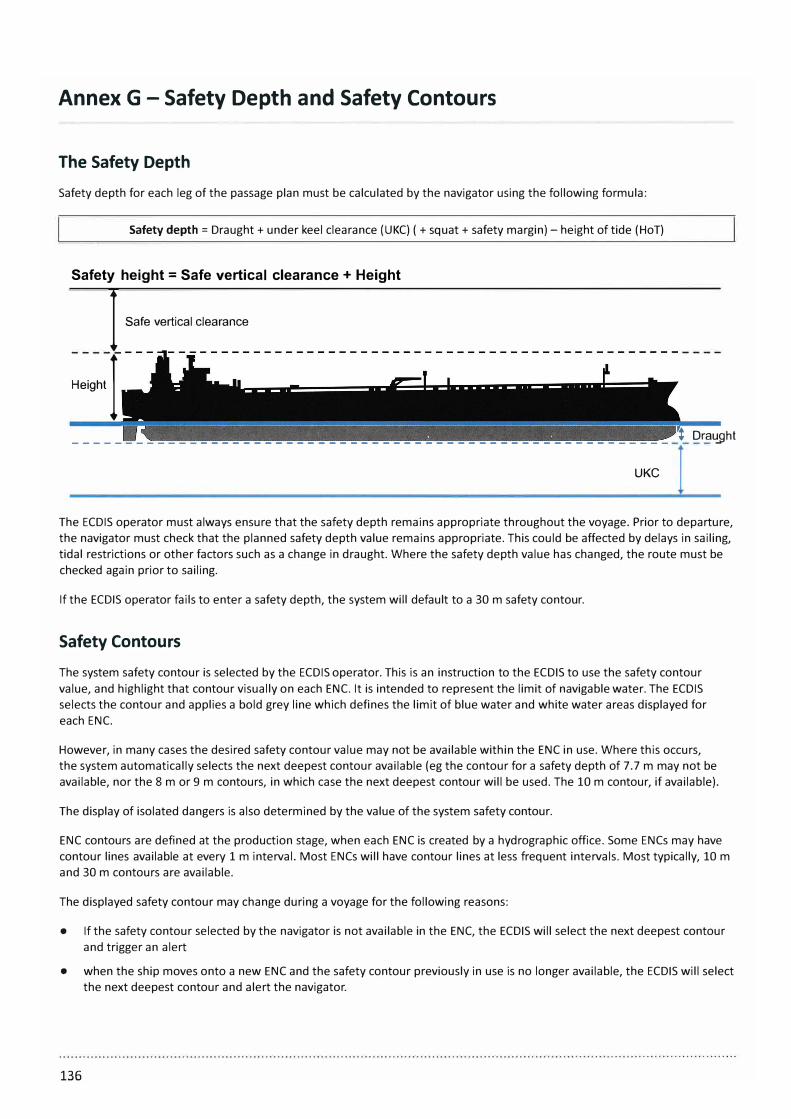
Annex G - Safety Depth and Safety Contours
The Safety Depth
Safety depth for each leg of the passage plan must be calculated by the navigator using the following formula:
Safety depth= Draught+ under keel clearance (UKC) (+squat + safety margin) - height of tide (HoT)
Safety height = Safe vertical clearance + Height
I Safe vert;ca1 clearance
He;ght I _ _ _ _ _ _ _ _ _ _ _ _ _ _ _ _ _ _ _ _ _ _ _ _ _ _ _ _ _ _ _ _ _ _ _ _ _ _ _ _ _ _ _ _ _ _ _ _ _ _ _ _ _ _ _ _ i Dral!9ht
UKC
The ECDIS operator must always ensure that the safety depth remains appropriate throughout the voyage. Prior to departure, the navigator must check that the planned safety depth value remains appropriate. This could be affected by delays in sailing, tidal restrictions or other factors such as a change in draught. Where the safety depth value has changed, the route must be checked again prior to sailing.
If the ECDIS operator fails to enter a safety depth, the system will default to a 30 m safety contour.
Safety Contours
The system safety contour is selected by the ECDIS operator. This is an instruction to the ECDIS to use the safety contour value, and highlight that contour visually on each ENC. It is intended to represent the limit of navigable water. The ECDIS selects the contour and applies a bold grey line which defines the limit of blue water and white water areas displayed for each ENC.
However, in many cases the desired safety contour value may not be available within the ENC in use. Where this occurs, the system automatically selects the next deepest contour available (eg the contour for a safety depth of 7.7 m may not be available, nor the 8 m or 9 m contours, in which case the next deepest contour will be used. The 10 m contour, if available).
The display of isolated dangers is also determined by the value of the system safety contour.
ENC contours are defined at the production stage, when each ENC is created by a hydrographic office. Some ENCs may have contour lines available at every 1 m interval. Most ENCs will have contour lines at less frequent intervals. Most typically, 10 m and 30 m contours are available.
The displayed safety contour may change during a voyage for the following reasons:
• If the safety contour selected by the navigator is not available in the ENC, the ECDIS will select the next deepest contourand trigger an alert
• when the ship moves onto a new ENC and the safety contour previously in use is no longer available, the ECDIS will selectthe next deepest contour and alert the navigator.
136

Annexes
Spot Sounding Depths
Soundings equal to or less than the safety depth selected are displayed in bold type when the display of spot sounding depths
is turned on, making them slightly more conspicuous than deeper soundings. This is important because the safety depth value
is intended as an aid when no appropriate safety contour is available in the ENC.
,,
'• ..'•
....
,, ,.s '•
,;;,
· ,, '•
.,,,
�,, ,,.. ,,
,,"�·., ..
.,
.. ..
., ..
Figure G.1: Safety depth value is 11 m and the safety contour is 15 m. Passage plan crosses safety contour, isolated danger
switched off, bold soundings show limit of navigable water. Bold soundings are less than the safety depth indicating the limit of navigable water. (Transas)
Figure G.2: Safety contour value set at 11 m with additional mariner-added objects that initiate an alert. (Transas)
' ,, ..
.. ..
1, Ila 13 2(1
'• ,, 14�6211
'•
t
Figure G.3: Safety contour value reduced to 10 m with additional mariner-added objects that can be set to alert. (Transas)
Be aware that ECDIS will only alert when crossing the safety contour and not for individual depths.
137

Passage Planning Guidelines
Crossing the Safety Contour
Where the safety contour defaults to a value deeper than that specified by the navigator, the safety contour may not
represent the limit of navigable water. In such cases, the navigator may be forced to navigate in these waters and the limit of
navigable water will be represented by the spot sounding depths in bold type.
This decision should be thoroughly risk assessed and discussed with the Master. This will particularly affect vessels navigating
in restricted sea areas .
If a vessel must cross the safety contour to continue along the planned route, the following factors should be considered:
• Confirm that isolated dangers are displayed in shallow waters
• turn on the display of spot sounding depths
• suitably scaled ENCs are available
• assess CATZOC quality.
To mitigate the risks of navigating within the safety contour, ECDIS operators should use the following techniques:
• Define 'no-go' areas through the use of mariner-added objects and activate danger alerts
• monitor the echo sounder
• use additional bridge manning (ie the Master)
• increase frequency of position cross-checking
• clearly mark in the passage plan whenever the vessel will cross the safety contour.
When navigating within the safety contour, the navigator must ensure that isolated dangers are displayed.
When monitoring an active route, ECDIS will alert the navigator prior to crossing the safety contour. However, during
planning, ECDIS may not alert and may only give a minor indication during the route check function.
Mariners should not rely on the automatic route check function to replace detailed verification of the route conducted by the
navigator and the Master.
RNCs do not contain contour vector data, and ECDIS operators should mark the limit of navigable water using mariner-added
objects .
138

Annex H - Learning from Incidents
a. Nawabshah
In August 1984, the 'Nawabshah' approached the western entrance to the Malacca Strait, from the Bay of Bengal, while on
passage to the Far East. Landfall was before noon, local time, with fine weather but frequent heavy showers. During the
approach the 3/0 had been plotting positions using the satellite system only and, very late into the approach, effort was
made to fix the ship using radar and visual means. By now the vessel had set reasonably north. The Master was summoned o
the bridge at the very last moment. In a final attempt to turn, a late avoiding action was of no use and the ship hit the rocks
south of Rondo Island, flooding the engine room and 2 cargo compartments. The ship sank rapidly, but fortunately there was
no loss of life.
In this case the passage plan was no more than a set of lines and waypoints, with no clear guidance as to which charted
objects should be used at which stage for fixing or how to employ Pl. There was also no guidance from the Master, either as
a set of instructions on the chart or as bridge orders. It would have been useful for the plan to include clear guidance, with
distances, where radar detection, echo sounder use and visual bearings should have commenced, along with PI and cross
checking. It would also have been useful to draw attention of the watch keepers to the possible set and effect of the wind and
the necessary actions required when in doubt.
b. Rena
The 'Rena' ran aground on the Astrolabe Reef while approaching Tauranga, in New Zealand, in 2011. The watch officers
were instructed by the Master to deviate from the plan to gain advantage of the current and to cut the distance to reach the
Tauranga pilot station in time. The deviations from the plan were not charted and position fixing was irregular and used GPS
only. There was limited application of PI and, in the final stages before grounding, the Master took the Pls off to declutter the
radar.
It is important to chart all intended deviations, after careful appraisal and risk assessment, before executing them.
Assumptions should never be made that the vessel will remain safe as a result of a deviation. The watchkeepers should
use a variety of methods to determine and check positions and use the echo sounder to good effect. Similarly, continuous
monitoring techniques like PI should be employed to monitor the safety of the vessel. At critical stages the work of
watch keepers should be cross checked. All of this should be clearly documented in the passage plan.
c. COSCO Busan
The container vessel 'Cosco Busan' was navigating from the berth to the sea, with a pilot on board, in restricted visibility. At
08:30, local time, the vessel collided with one of the base towers supporting the San Francisco-Oakland Bay Bridge. It has
been reported that the Master/pilot exchange (MPX) before leaving the dock was not carried out properly and that there
was no effective communication between the pilot and rest of the bridge team. It has also been reported that the condition
and the actions of the pilot were not monitored effectively and that the Master was not assertive enough when it came to
challenging the pilot. There was no effective monitoring of the ship's position or progress.
It is very important that the bridge team ensures that the passage plan (as agreed with the pilot) is being executed and that
the monitoring techniques in the plan are in use. Similarly, all manoeuvres and alterations should be as per the plan. The
general principles of bridge team management (BTM) should be applied at all times.
d. Ben-My-Chree
A RoRo passenger ferry, after leaving Heysham, grounded on a shallow patch of sand in the navigational channel. The
grounding occurred nearly 1 hour before low water of the spring tides. Although the charts were up to date, changes to the
seabed because of silting were not discovered or promulgated regularly by the relevant authorities.
When navigating in waters where depths are uncertain, it is better to undertake the transit at reasonable higher le els
so that any discrepancies in depths can be compensated for.
139

Passage Planning Guidelines
e. COSCO Hong Kong
On passage from Xia men to Nansha, steaming at 21 kts, the 'COSCO Hong Kong' encountered a large number of fishing
vessels. The OOW's workload increased significantly and the ship was manoeuvred south of the track using the autopilot. The
ship started heading for a well marked reef, which had been highlighted as a danger in the passage plan. Because of workload,
this marking was completely ignored by the OOW and the vessel ran aground over it.
It is important that the passage plan not only highlights the dangers, but that there are instructions relating to approach
limits/margins of safety, manning levels and the actions required when the OOW is under stress due to conditions or traffic.
The need to call the Master when the OOW is finding it difficult to keep control over the vessel or keep it safe should also be
emphasised through passage plan instructions, the Master's standing orders and the company's SMS.
f. Douwent
The 'Douwent', a general cargo vessel, grounded on the Haisborough Sand in the North Sea in February 2013. The vessel was
refloated approximately one hour after grounding, but lost its rudder as a result of the grounding.
Douwent was on passage from Boston, UK to Amsterdam, and the vessel regularly undertook this passage. The passage had
been planned the previous day by the Chief Officer, using waypoints saved in the library of the vessel's GPS receiver. The
selected waypoints from the library were entered as a route in the GPS receiver. The passage plan was signed by the Master
and Chief Officer. The waypoints and tracks for frequently undertaken passages were inked in the paper charts. The Master
did not check the paper charts before approving the passage plan.
The charts were worn and it was not the normal practice to plot fixes, relying instead on the GPS position in relation to the
route entered in the GPS receiver. It appears a waypoint had been omitted when entering the route and, as a result, the
route in the GPS was not the one the vessel normally followed while transiting the Haisborough Gat. The OOW was therefore,
monitoring the position relative to the incorrectly entered route in the GPS receiver, which was taking the vessel to the north
and towards the Haisborough Sand. As the vessel's position was not was plotted on the paper chart, the OOW remained
unaware that the vessel was diverging from the track and heading towards shoal water.
g. Navigator Scorpio
In January 2014, the liquefied gas carrier 'Navigator Scorpio' grounded on the Haisborough Sand in the North Sea. The
'Navigator Scorpio' was given three days' notice that its schedule had been changed and after initial onboard passage
appraisal it was found additional charts would be required, which were received the day prior to sailing from Le Havre. Paper
charts were the primary means of navigation. The newly delivered charts were not corrected and the passage plan, which was
incomplete, was not checked by the Master prior to sailing.
During the morning of the day after departing Le Havre, the Master and navigator checked the passage for the remainder of
that day. The Master initially wished to reposition the track in the Haisborough Gat further away from the shoal water of the
Haisborough Sand, but after further discussion with the navigator agreed to leave the track as it was, but reduce the fixing
interval from 15 to 5 mins and reduce the speed from 15 to 11 kts to the meet the ETA at their next port.
The navigator was the OOW for the passage through the Haisborough Gat, during which he was updating the recently
received charts and continuing to plan the final stages of the passage. As a result he was distracted and altered course late
on the leg that passed close to the Haisborough Sand and then took insufficient action to bring the vessel back onto the
intended track. In addition, he failed to fix at 5 mins intervals and did not appreciate the vessel was being set off track onto
the Haisborough Sand, where it subsequently grounded.
h. Unnamed Panamax Sized Vessel
A panamax vessel was transiting from one Chinese port to another. There was a military exercise taking place between the
two ports. The deviation to seawards of the exercise area would have increased the distance significantly so the Master
decided to deviate inwards towards the shore. Unknown to the Master, there were a number of fish farms on the deviation
and, although the ship's charts were believed to be corrected and up to date, there was no indication of fish farms on the
charts. The agent was asked, but no reply was received. During the deviated transit a number of fish farms were damaged.
140

An exes
It is important to carry out a risk assessment every time a deviation is undertaken. Where there is any uncertainty,
information should be obtained from all possible (but reliable sources), including the agent. If it is not possible to receive
actual charts, scans or pictures of the chart would be useful at least to identify items not otherwise on the BA or other
international charts.
i. An Unnamed Product Tanker
A product tanker, equipped with all required navigational aids and on a regular run to a routine port, ran aground while full
loaded with a draught of 12 m. There was a detailed passage plan available and positions were being fixed every 10 mins
using radar, visual and other means. The Master had amended the passage plan to marginally reduce the steaming distance
from 6 to less than 2 nm from a significant fixing point. The watch was handed over to an inexperienced OOW who had
to carry out quite a few arrival procedures, including calling the pilot and communicating with engine and deck teams, in
addition to normal navigation. At a course alteration point, hand steering was used to alter course rather than the autopilo·,
but the ship's actual location was not correctly monitored. A short while later, after the Master took the con, the vessel ran
aground.
The passage plan should state the manning levels required at all stages. Any amendments to the passage plan should be
charted for effective monitoring. Risk assessment should be undertaken to assess changes to margins for safety or error.
j. Royal Oasis
The bulk carrier 'Royal Oasis' weighed anchor off Port Talbot in August 2010. The vessel commenced a substantial turn to
port as part of a manoeuvre to reach the pilot station. A strong tidal stream of 3 kts was present, causing 'Royal Oasis' to hit
another anchored bulk carrier, the 'Berge Atlantic'.
The passage plan should include the details of tidal streams, the manoeuvres to be executed in differing conditions and ho
these will be influenced by wind and/or tidal stream.
k. Patricia
An 80 m long vessel was on passage in an area where sandbanks were common. The vessel began passage well north of the
intended passage plan to compensate for a strong southerly tidal stream. The vessel was in autopilot at a speed of 9 kts while
navigating over the charted depths of 8 to 9 m. At this stage the echo sounder was showing a depth of 10 m. Once the echo
sounder started to show depths of 20 m or more, the Master increased the speed, assuming the vessel was in clear water. A
few minutes later the vessel ran aground.
It is important to detail the speeds required on all legs of the passage, state the effects of wind or tidal stream and the
minimum UKC requirements. The chart should have been annotated with warnings about likely hazards and the necessary
safeguards.
I. Blackfriars
A small product tanker was on a ballast passage from Loch lnver to Pembroke. Due to inclement weather, the Master chose
to pass through Kyleakin Sound to avoid the area to the west of the Isle of Skye. During this deviation the vessel grounded on
Eileanan Dubha Island.
Investigations revealed that there were numerous safety issues, including passage planning and navigational techniques.
All deviations should be charted with a revision of guidance to watch keepers through the passage plan, in line with the risk
assessment.
m. Vanguard
A seagoing tug was taking a familiar passage on the north coast of a Scottish island to rendezvous with a vessel. During the
passage, where time was not an issue, the skipper unnecessarily deviated to an inshore route between the island and some
rocks and shoal patches. The skipper was unaware of the precise position of the vessel and it grounded on a submerged rock.
The engine room flooded, the vessel was put on a gently sloping area, the crew evacuated and the vessel listed heavily and
was declared a constructive total loss.

Passage Planning Guidelines
Any deviation should have been made after a risk assessment and should have been fully charted/documented as a passage plan. The manning levels, especially a proper lookout, should have been stated in the plan, along with monitoring techniques to be employed.
n. Sea Fox
This general cargo vessel was carrying packaged timber cargo on deck. The vessel's planned course had taken her downwind of shallow water. During heavy weather, the vessel encountered an exceptional wave from her starboard beam. The lashings parted and resulted in the loss and shifting of some of the deck cargo, with the vessel taking a list of 30°. Later, more cargo had to be jettisoned to improve the situation and to be able to proceed to a safe haven, where the vessel was able to resecure the remaining cargo.
It is important to employ some of the principles of weather routeing even during coastal transits, clearly warning all watch keepers of the effect of wind and sea state on a vessel's safety.
o. lsamar
The 'Isa mar', a large power driven super yacht, grounded off the south France in August 2013, while navigating on an electronic chart system (ECS). No paper charts were carried on board, nor had a passage plan been prepared. The charts in the ECS had not been updated for ten years. The Master of vessel was navigating by eye and intended to pass between two shoals approximately half a mile apart. No track or waypoints were entered in the ECS. A very large scale was selected on the ECS, which resulted in the chart being zoomed in to a very small area that appeared to contain no hazards. While passing between the shoals, a violent lurch and vibration was felt throughout the vessel. The Master stopped the vessel and checked below decks for damage. While he was doing this another member of the crew reduced the ECS chart scale and noticed a shoal patch was shown in the vessel's vicinity that had not been apparent when zoomed in to a larger scale. Although the shoal was shown on the electronic chart there were no soundings, although the official paper chart for this area did show them. Passengers and crew was transferred to other vessels in the vicinity and the 'Isa mar' later sank.
An ECS is not a suitable substitute for an ECDIS. A vessel using an ECS should use paper charts as the primary means of navigation. The chart used on the ECS had not been updated and did not display the same depth information that was available on the paper chart for the area. The Master was not following a planned track and therefore had not conducted a proper appraisal and risk assessment of the passage.
p. Jongleur
This vessel's mast struck the Gata Alvbron Bridge at Gothenburg. The passage plan should clearly state the times when transits should be made for safe UKC and air clearance.
q. Unidentified Tanker
A chief mate on a tanker arrived on the bridge to report to the Master about securing the vessel for sea. He noticed from the chart that the vessel was taking the same outward channel as was used to arrive in to the port, which had a depth of 10.7 m. The navigating officer had negligently reversed the courses on the inbound plan. The vessel's current draught after loading was 12 m and a timely change of course saved the vessel from definite grounding.
All work on passage plans should be double checked by another person.
r. Ovit
The chemical tanker 'Ovit' grounded on the Varne Bank in the Dover Strait in September 2013. The vessel's primary means of navigation was ECDIS. The passage had been planned by the third officer in preparation for him assuming the duties of navigator when the second officer left at the end of the voyage. There was no formal handover of navigation responsibilities between the second and third officers, nor did Master advise the ship's manager of the reallocation of responsibilities. The passage plan was prepared two days prior to commencing the passage, while the ship was at anchor off Rotterdam. The Master did not give the third officer any direction or guidance and no reference was made to previous similar passages. Neither the second officer nor the Master checked the plan prior to sailing, nor was there a pre-departure brief.
142

Annexes
The third officer prepared the track on small scale EN Cs and checked the route by zooming in to see whether it was clear of
navigation hazards. The third officer placed the track over the Varne Bank, passing between east and west cardinal buoys
that marked the east and west edges of the bank respectively. The larger scale EN Cs contained additional depth information,
but were not installed. As a result it was not realised the depths over the Varne Bank were less than the vessel's draught.
Furthermore the route checking functions of the ECDIS were incorrectly understood and, although the ECDIS did warn the
route was unsafe, the third officer did not interpret the warnings as meaning the track was unsafe.
While transiting the Dover Strait, the 'Ovit' was following the track shown on the ECDIS. The audible ECDIS alarm was
inoperative and, while the crew were aware of this defect, they had not reported it. The MAIB investigation following
grounding concluded that the deck officers were not sufficiently trained to operate the onboard ECDIS effectively. The OOW
and lookouts sighted the buoys marking the Varne Bank but did not consider whether they were being passed correctly, ie
to the west of a west cardinal mark. Soundings were not displayed on the ENC at the time of the grounding and the chart
was overscale, ie zoomed in beyond its intended scale. The bridge team was, therefore, unaware that they were approaching
water shallower than their draught.
'Ovit' grounded as a result of following an unsafe passage plan, prepared by an inexperienced junior officer, who was not
given proper guidance by either the Master or the ship's navigator. In addition, there was no appraisal report after the initial
research and no passage brief to the Master for approval. The ship's officers did not use the planning or monitoring tools
within the ECDIS correctly. While approaching the Varne Bank, the OOW did not cross check whether the vessel would pass to
the side indicated by the cardinal buoys.
143

Passage Planning Guidelines
Annex I - List of Useful Publications
Admiralty Guide to ENC Symbols used in ECDIS
Admiralty Guide to the Practical Use of ENCs
Admiralty Manual of Navigation
Annual Summary of Notices to Mariners
Anti-Piracy Planning Chart
Bridge Procedures Guide
Distance Tables
ECDIS Procedures Guide (Witherby Publishing, 2018)
IALA Buoyage System
IMO Resolution A.893(21) Guidelines for Voyage Planning
List of Light and Fog Signals
List of Radio Signals
Mariner's Handbook (UKHO, NPlO0)
Nautical Almanac
Navigation Advanced Mates/Masters (Witherby Publishing, 2015)
Navigation for Masters (Witherby Publishing, 2012)
Norie's Nautical Tables
Ocean Passages for the World (UKHO, NP136)
Passage Planning Guide: English Channel, Dover Strait and Southern North Sea (Witherby Publishing, 2017)
Passage Planning Guide: Straits of Malacca and Singapore (SOMS) (Witherby Publishing, 2017)
Passage Planning Guide: Great Barrier Reef and Torres Strait (Witherby Publishing, 2017)
Passage Planning Practice (Witherby Publishing, 2006)
Passage Planning Principles (Witherby Publishing, 2006)
Peril at Sea and Salvage: A Guide for Masters (ICS/OCIMF, 5th Edition, 1998)
Routeing Charts
Routeing Guides
Sailing Directions
Ships' Routeing (IMO, 2017)
The ECDIS Manual (Witherby Publishing, 2016)
Tidal Stream Atlases
Tide Tables
UKHO Maritime Security Charts ('Q Charts')
144
Top Related
Copyright © 2022 FDOKUMEN

