


Bahasa
Halaman
Hukum

Jou
rnal
of P
hysi
olog
y
The largest cells in the vertebrate body are the muscle
fibres. In mouse limb muscle fibres, in vivo injection of
cytosolic dye has revealed a typical cellular volume of 5 nl
(Utvik et al. 1999). In larger animals, volumes can be much
greater. Thus a cylinder with a diameter of 50 mm and a
length of 0.5 m, dimensions not unrealistic in larger
mammals, has a volume of about 1 ml. Most other
mammalian cells are more spherical in shape, with
diameters in the range 5–20 mm and volumes thus ranging
from 10_5 to 10_3 nl. Thus, even in small animals like mice,
the muscle fibres have a volume that is almost five orders of
magnitude larger than that of small uninucleated cells.
Muscle cells, however, possess multiple nuclei and
constitute one of the few syncytia in the mammalian body,
other examples being osteoclasts and some large
macrophages. There is an old concept that states that a
certain volume of cytoplasm is required to serve a certain
volume of karyoplasm (e.g. Strassburger, 1893). Although
modern biologists rather envisage the nucleus as
supporting the cytoplasm, the ‘karyoplasmic-ratio
hypothesis’ is still relevant, and it is argued that the link
between DNA content and cell volume is a fundamental
principle in biology (Gregory, 2001). The mechanistic
background for such correlations remains obscure. It is
possible that each nucleus has only a limited synthetic
capacity, or that there are some other rate-limiting steps
(e.g. the number of nuclear pores could be limiting the
passage of RNA from the nucleus to the cytoplasm;
Cavalier-Smith, 1978, 1980).
As a mechanistic substrate for the karyoplasmic ratio
hypothesis in muscle, it is believed that each nucleus serves
a certain domain. Some proteins are localized to the site of
expression (Hall & Ralston, 1989; Ralston & Hall, 1992),
most notably, but not exclusively, at the synapse (Merlie &
Sanes, 1985; Sanes et al. 1991; Gundersen et al. 1993).
Thus, mRNA does not diffuse far from its nucleus of
origin. In addition to having a voluminous cytoplasm,
muscle cells span vast geometrical distances. The only
other cells reaching further are some types of neuron. In
axons, however, there are specialized mechanisms for
axonal transport. Similar systems have not been described
in muscle, and proteins might rely mainly on diffusion to
get from where they are synthesized to where they are
needed. Consequently, not only the number, but also the
spatial distribution of nuclei might be crucial in order to
minimize the transport problem. To our knowledge, the
distribution of nuclei in muscle fibres has not previously
been addressed quantitatively.
Number and spatial distribution of nuclei in the muscle fibresof normal mice studied in vivoJ. C. Bruusgaard, K. Liestøl*, M. Ekmark, K. Kollstad and K. Gundersen
Department of Biology and *Department of Informatics, University of Oslo, PO Box 1051, Blindern, N-0316 Oslo, Norway
We present here a new technique with which to visualize nuclei in living muscle fibres in the intact
animal, involving injection of labelled DNA into single cells. This approach allowed us to determine
the position of all of nuclei within a sarcolemma without labelling satellite cells. In contrast to what
has been reported in tissue culture, we found that the nuclei were immobile, even when observed
over several days. Nucleic density was uniform along the fibre except for the endplate and some
myotendinous junctions, where the density was higher. The perijunctional region had the same
number of nuclei as the rest of the fibre. In the extensor digitorum longus (EDL) muscle, the
extrajunctional nuclei were elongated and precisely aligned to the long axis of the fibre. In the
soleus, the nuclei were rounder and not well aligned. When comparing small and large fibres in the
soleus, the number of nuclei varied approximately in proportion to cytoplasmic volume, while in
the EDL the number was proportional to surface area. Statistical analysis revealed that the nuclei
were not randomly distributed in either the EDL or the soleus. For each fibre, actual distributions
were compared with computer simulations in which nuclei were assumed to repel each other, which
optimizes the distribution of nuclei with respect to minimizing transport distances. The simulated
patterns were regular, with clear row-like structures when the density of nuclei was low. The non-
random and often row-like distribution of nuclei observed in muscle fibres may thus reflect
regulatory mechanisms whereby nuclei repel each other in order to minimize transport distances.
(Resubmitted 23 April 2003; accepted after revision 12 June 2003; first published online 17 June 2003)
Corresponding author K. Gundersen: Department of Biology, PO Box 1051, Blindern, NO-0316 Oslo, Norway.Email: [email protected]
J Physiol (2003), 551.2, pp. 467–478 DOI: 10.1113/jphysiol.2003.045328
© The Physiological Society 2003 www.jphysiol.org
Jou
rnal
of P
hysi
olog
y
Here we describe a new technique in which nuclei are
labelled in intact mice by intercellular injection of labelled
DNA. This offers three important advantages compared to
previous studies: (1) living cells are studied directly in vivo,
(2) single cells can be followed over time, and (3) all of the
nuclei within a cell are visualized but, importantly, the
nuclei in satellite cells are not labelled. We report that invivo muscle nuclei are stationary and seem to be spatially
distributed as if to minimize transport distances. The
number of nuclei increases with fibre calibre, but in
distinctly different ways in the EDL and soleus muscles.
METHODSAnimal operation proceduresFemale NMRI mice, 7–15 weeks old, were anaesthetized with anintraperitoneal injection of 5 ml (g body weight)_1 of Equithesin(Ullevål Sykehus, Norway; 42.5 mg of chloral hydrate and 9.7 mgpentobarbitone per ml). The mice were placed on a heated platethat was designed to keep the body temperature stable throughoutthe experiment. The leg was pinned out and the EDL or soleusmuscle was exposed by pulling the overlaying muscles to one side.The exposed muscle was covered with Ringer-lactate and held inplace with a coverslip mounted 2 mm above the muscle. In somemuscles, the neuromuscular junction was visualized by applyingrhodamine-conjugated a-bungarotoxin (1 mg ml_1; MolecularProbes, Eugene, OR, USA) to the surface of the muscle for 2–3 min.This allows good visualization, but is not sufficient to blockneuromuscular transmission (Balice-Gordon & Lichtman, 1990).
Some mice were re-sutured and allowed to recover for 1–4 days,and then re-anaesthetized to allow a second observation of thesame fibres. After the experiments, the mice were killed by neckdislocation while still under deep anaesthesia.
These animal experiments were approved by the NorwegianAnimal Research Authority and were conducted in accordancewith the Norwegian Animal Welfare Act of 20 December 1974(no. 73, chapter VI, sections 20–22), and the Regulation onAnimal Experimentation of 15 January 1996.
In vivo imagingThe heated animal platform was placed on the specimen stage ofan upright, fixed-stage fluorescence microscope (OlympusBX50WI, Norwood, MA, USA) and the muscle surface was viewedby in vivo imaging techniques similar to those pioneered byLichtman and collaborators (Lichtman et al. 1987; Balice-Gordon& Lichtman, 1990). During and after injections, muscles wereviewed through water-immersion objectives with long workingdistances. An adjustable 12 V, 100 W halogen lamp was used forepi-illumination, and precautions were taken to minimize thetime and intensity of light exposure (the lamp was operated at3–5 V) in order to avoid phototoxicity. The muscle was viewedwith a SIT camera (Hamamatsu C2400-08) coupled to an imageprocessor (Hamamatsu ARGUS-20) and a Macintosh computerrunning Adobe Photoshop and NIH Image software. All of thepictures shown are from living muscles in vivo.
Intracellular injectionsThe labelled DNA injections were performed essentially asdescribed previously (Utvik et al. 1999). Borosilicate 1.0/1.5 mmglass micropipettes with a filament (World Precision Instruments,Sarasota, FL, USA) were pulled on a laser-heated puller (P2000,Sutter Instruments, Novato, CA, USA) and bevelled on an
audiocassette tape moving at playing speed, to a resistance ofabout 100 MV. The pipette was filled by capillary forces bydipping its base into a solution containing phosphorothioated5‚-Oregon Green-labelled oligonucleotides (5.0 w 10_4
M;Biognostik, Göttingen, Germany) mixed with 2 g l_1 of CascadeBlue dextran (Molecular Probes). The DNA was dissolved in abuffer containing 10 mM NaCl, 10 mM Tris (pH 7.5), 0.1 mM
EDTA and 100 mM potassium gluconate. The filled pipettes wereplaced in a micromanipulator (Sutter Instruments) and used topenetrate the cells. To verify the penetration, the membranepotential was recorded on a Duo 773 electrometer (WorldPrecision Instruments). The solution was ejected by pulses ofpressurized nitrogen (100–150 hPa) lasting 20 ms and delivered at500 ms intervals by a PV820 pneumatic pico-pump (WorldPrecision Instruments). A constant holding pressure of about1 hPa was also applied to prevent the solution from moving backinto the pipette between pulses.
The injected oligonucleotides were rapidly taken up by themyonuclei, probably by active transport (Hartig et al. 1998). Thelabelled DNA was never seen to leak out of the fibres or to labelmore than one fibre, thus only the nuclei confined within oneplasma membrane were labelled. Importantly, injected DNA didnot label nuclei in satellite cells. Thus, both ultrastructural(Schmalbruch, 1978) and electrophysiological evidence (Bader etal. 1988) indicates that there are no gap junctions between thesatellite cells and their muscle fibres.
Fibre typingAfter the in vivo analysis, the muscles were frozen and sectionedfor immunohistochemistry. The injected fibres were identified bythe injected fluorescent dyes, and the fibre type was determinedwith the following monoclonal antibodies: type 2a, SC-71; type 1,BS-D5; and type 2b, BF-F3 (gift from Stefano Schiaffino;Schiaffino et al. 1989). In the EDL the surface fibres are generallytype 2b, and all of the injected fibres were identified as type 2bfibres. In the soleus, nine fibres were identified as type 2a, whilefor five fibres the fluorescent dye was not detectable. All of theinjected fibres in this muscle were located on the dorsolateralsurface of the muscle, and in this region the majority of the fibresare type 2a and the rest are type 1.
Reconstruction of fibre segmentsMost of the data were derived after allowing the labelledoligonucleotides to diffuse over a 400–600 mm stretch of eachfibre. A diffusion time of 2 h was typically required, during whichthe animal was kept anaesthetized.
Some fibres were studied after longer time periods in order toreconstruct longer stretches (Fig. 1) or to study single cells overtime (Fig. 3). In the latter case, some fibres were re-injected toensure that the original injection would also label new nuclei. Nonew nuclei were ever revealed after re-injection (data not shown).
After diffusion of the oligonucleotides, pictures of fibre segmentswere taken at focal planes spaced 5 mm apart. The pictures wereexported to the program NIH Image in which the x and ycoordinates were determined. The plane in which a given nucleuswas in focus determined the z coordinate for that nucleus.
Once the coordinates for each nucleus were obtained, thenumbers were exported to the program MacSpin (AbacusConcepts, Berkeley, CA, USA). This program depicts data in athree-dimensional coordinate system and allows them to beviewed from different angles. MacSpin was used to proofread thedata and to check whether the nuclear positions were reasonably
J. C. Bruusgaard, K. Liestøl, M. Ekmark, K. Kollstad and K. Gundersen468 J Physiol 551.2
Jou
rnal
of P
hysi
olog
y
well confined to a tubular surface. After they had been proof read,the coordinates were transposed to a new coordinate system. Thistransposition was done in such a way that the fibre was virtuallyaligned with two of the axes. This simplified the furthergeometrical and statistical analysis.
Statistical and geometrical analysisSince nuclei are usually distributed close to the surface of the fibre,the statistical evaluation of the distribution was based on aprojection of the nuclei onto an idealized surface. When selectingan idealized form, flexibility has to be weighted against robustnessand the danger of over-fitting. We selected a form that in a cross-sectional view is elliptical. Along the fibre, the axes of the ellipsemay vary linearly and proportionally. Although fibres may havemore irregular forms, with the exception of a few, the distributionof nuclei around this form appeared as random variations ratherthan systematic deviations. The optimal fit was defined as thatwith the smallest squared distance from the nuclei to the idealizedsurface measured along radians from the fibre centre. The idealsurface was subsequently found in the following way: if the centreand the tilting of the fibre are known, non-linear regression maybe used to find the parameters defining the ellipse and its cross-sectional variation. We thus searched over a grid of possiblecentres and different degrees of tilting, carried out the regressionfor each centring/tilting-combination, and used the overall resultcorresponding to the smallest squared distance from the nucleusto the surface.
To reveal whether or not the actual distributions of nuclei wereconsistent with random distributions, we used Monte Carlo tests.As a test statistic, we used the average of the distance from eachnucleus to its nearest neighbour, measured either along thesurface or directly (see Results). The test then compared theaverage of the nearest neighbour distances for the fibre underconsideration with the average obtained for a large number ofsimilarly sized artificial fibres in which the same number of nucleiwas distributed randomly. If the actual positioning of the nuclei ismore regular than random, nearest neighbour distances will belonger; if nuclei are clustered, the distances will be shorter than inthe random case. Thus, the test will detect and identify both kindsof deviation from random positioning.
In general, it is difficult to determine the optimal positioning ofnuclei to minimize transport distances. In a certain mathematicalsense, positioning nuclei at the corners of equilateral triangles (sothat a nucleus and its six neighbours form a hexagon) is optimal.In tubes, the optimal positioning will depend upon the number ofnuclei per area (or volume) unit. With low densities, positioningthe nuclei at equal distances along the fibre, with neighboursshifted 180 deg around the fibre will be optimal (still in a certainmathematical sense). On a foldout of the fibre, this will appear astwo rows of nuclei. With high densities of nuclei, distributionsapproximating the above-mentioned hexagons will be optimal,while at intermediate densities the optimal distributions may becomplex. If one considers direct distances (through thecytoplasm) rather than surface distances, the optimal positioningwill be more difficult to determine since the solutions will dependon the cross-sectional form
To study near-optimal distributions for the idealized fibres thatwere fitted to our real fibres, we used a stochastic relaxation type ofoptimization procedure, where nuclei were assumed to repel eachother (Geman & Geman, 1984). When optimizing with respect todirect distances, we assumed a cylindrical form for the fibre.
To describe the eccentricity of the ellipsoid nuclei, an index e wascalculated, which satisfied the equation: b2 = a2 (1 _ e2), where aand b are the semi-major and semi-minor axes. For a circle, e = 0and for an ellipsis, 0 < e < 1.
Non-linear least-squares regression was used when modelling therelationship between nucleic density and cross-sectional area.
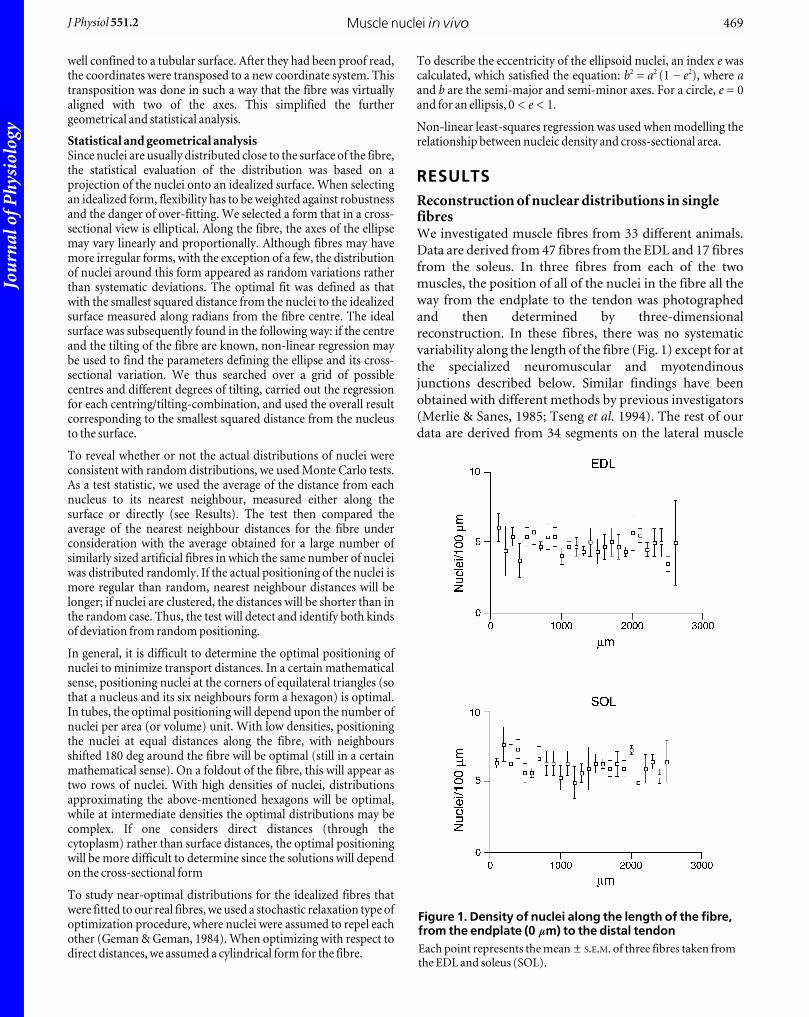
RESULTSReconstruction of nuclear distributions in singlefibresWe investigated muscle fibres from 33 different animals.
Data are derived from 47 fibres from the EDL and 17 fibres
from the soleus. In three fibres from each of the two
muscles, the position of all of the nuclei in the fibre all the
way from the endplate to the tendon was photographed
and then determined by three-dimensional
reconstruction. In these fibres, there was no systematic
variability along the length of the fibre (Fig. 1) except for at
the specialized neuromuscular and myotendinous
junctions described below. Similar findings have been
obtained with different methods by previous investigators
(Merlie & Sanes, 1985; Tseng et al. 1994). The rest of our
data are derived from 34 segments on the lateral muscle
Muscle nuclei in vivoJ Physiol 551.2 469
Figure 1. Density of nuclei along the length of the fibre,from the endplate (0 mm) to the distal tendonEach point represents the mean ± S.E.M. of three fibres taken fromthe EDL and soleus (SOL).
Jou
rnal
of P
hysi
olog
y
surface either distal (EDL) or proximal (soleus) to the
endplate. These choices were dictated by anatomical
accessibility. In the EDL the fibres had a nuclear density of
30–57 nuclei mm_1, while in the soleus fibres nuclear
density ranged from 35 to 77 nuclei mm_1. Given a fibre
length of 4–6 mm, this gives a total of one- to a few
hundred nuclei per cell.
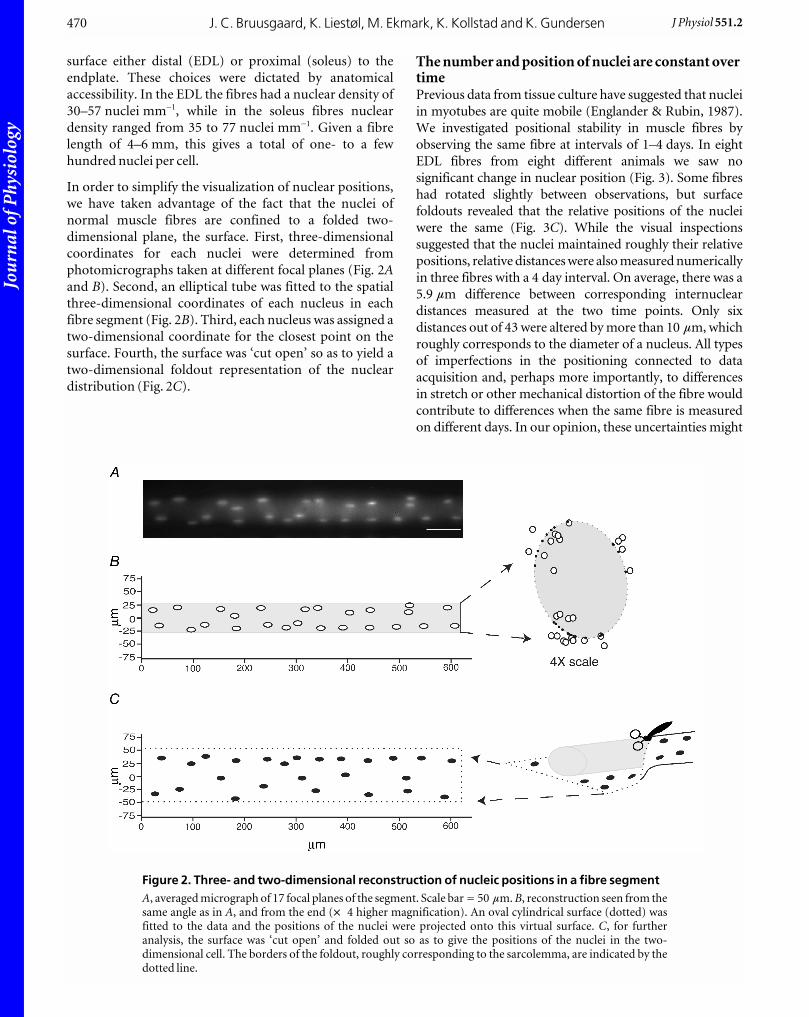
In order to simplify the visualization of nuclear positions,
we have taken advantage of the fact that the nuclei of
normal muscle fibres are confined to a folded two-
dimensional plane, the surface. First, three-dimensional
coordinates for each nuclei were determined from
photomicrographs taken at different focal planes (Fig. 2Aand B). Second, an elliptical tube was fitted to the spatial
three-dimensional coordinates of each nucleus in each
fibre segment (Fig. 2B). Third, each nucleus was assigned a
two-dimensional coordinate for the closest point on the
surface. Fourth, the surface was ‘cut open’ so as to yield a
two-dimensional foldout representation of the nuclear
distribution (Fig. 2C).
The number and position of nuclei are constant overtimePrevious data from tissue culture have suggested that nuclei
in myotubes are quite mobile (Englander & Rubin, 1987).
We investigated positional stability in muscle fibres by
observing the same fibre at intervals of 1–4 days. In eight
EDL fibres from eight different animals we saw no
significant change in nuclear position (Fig. 3). Some fibres
had rotated slightly between observations, but surface
foldouts revealed that the relative positions of the nuclei
were the same (Fig. 3C). While the visual inspections
suggested that the nuclei maintained roughly their relative
positions, relative distances were also measured numerically
in three fibres with a 4 day interval. On average, there was a
5.9 mm difference between corresponding internuclear
distances measured at the two time points. Only six
distances out of 43 were altered by more than 10 mm, which
roughly corresponds to the diameter of a nucleus. All types
of imperfections in the positioning connected to data
acquisition and, perhaps more importantly, to differences
in stretch or other mechanical distortion of the fibre would
contribute to differences when the same fibre is measured
on different days. In our opinion, these uncertainties might
J. C. Bruusgaard, K. Liestøl, M. Ekmark, K. Kollstad and K. Gundersen470 J Physiol 551.2
Figure 2. Three- and two-dimensional reconstruction of nucleic positions in a fibre segmentA, averaged micrograph of 17 focal planes of the segment. Scale bar = 50 mm. B, reconstruction seen from thesame angle as in A, and from the end (w 4 higher magnification). An oval cylindrical surface (dotted) wasfitted to the data and the positions of the nuclei were projected onto this virtual surface. C, for furtheranalysis, the surface was ‘cut open’ and folded out so as to give the positions of the nuclei in the two-dimensional cell. The borders of the foldout, roughly corresponding to the sarcolemma, are indicated by thedotted line.

Jou
rnal
of P
hysi
olog
y
have led to similar deviations without any nuclear
movement. However, although the data suggest that nuclei
are fixed at their exact positions, we cannot exclude the
possibility that a certain wobbling takes place within a
confined territory for each nucleus.
One of the eight fibres studied over time displayed one
extra nucleus at the second examination, but apart from
this, the number of nuclei was the same for the first and
second observation in all the fibres. The near absence of
new nuclei is consistent with the view of muscle as a
permanent tissue with a turnover of less than 1–2 % per
week (Schmalbruch & Lewis, 2000).
The shape and orientation of nuclei varies betweenfibre typesFigure 4A shows micrographs of 30 randomly selected
nuclei from EDL and soleus fibres that could be
photographed en face. The EDL nuclei had a long axis of
18 ± 2 mm and a short axis of 5 ± 1 mm (mean ± S.D.). The
corresponding numbers for soleus fibres were 14 ± 2 mm
and 8 ± 1 mm, respectively. Thus, EDL nuclei were rather
elongated, with their eccentricity index (see Methods)
averaging 0.96 (Fig. 4B). The EDL nuclei were also strictly
aligned parallel to the long axis of the fibre, with an average
deviation of only 4 deg between the long axis of the nuclei
Muscle nuclei in vivoJ Physiol 551.2 471
Figure 3. The position of nuclei observed with an intervalof 24 h to 4 daysA and B are micrographs of two different fibres observed with aninterval of 24 h and 4 days (4 d), respectively. Correspondingnuclei are connected by lines. Scale bar = 50 mm. C, surface foldoutof a third fibre; corresponding nuclei are given the same numberdesignation. Note the constancy of nuclear positions. Grey symbolsindicate synaptic nuclei.
Figure 4. The shape and orientation of single nuclei insoleus and EDLA, micrographs of 30 nuclei from both the EDL and soleus (eachsquare is 20 mm wide). B, eccentricity indices (see Methods) of thesame nuclei as depicted in A, and of synaptic (end plate, EP) nucleiin the EDL. C, orientation of the long axis of the non-synapticnuclei relative to the long axis of the fibre for the EDL and soleus,and for EP nuclei from an EDL fibre.
Jou
rnal
of P
hysi
olog
y
and that of the fibre (Fig. 4C). In contrast, soleus nuclei
varied more in shape, and in general were less oval, with an
eccentricity index of 0.83 (Fig. 4B). They were also less well
aligned, with some nuclei even deviating more than 45 deg
from the long axis of the fibre (Fig. 4C).
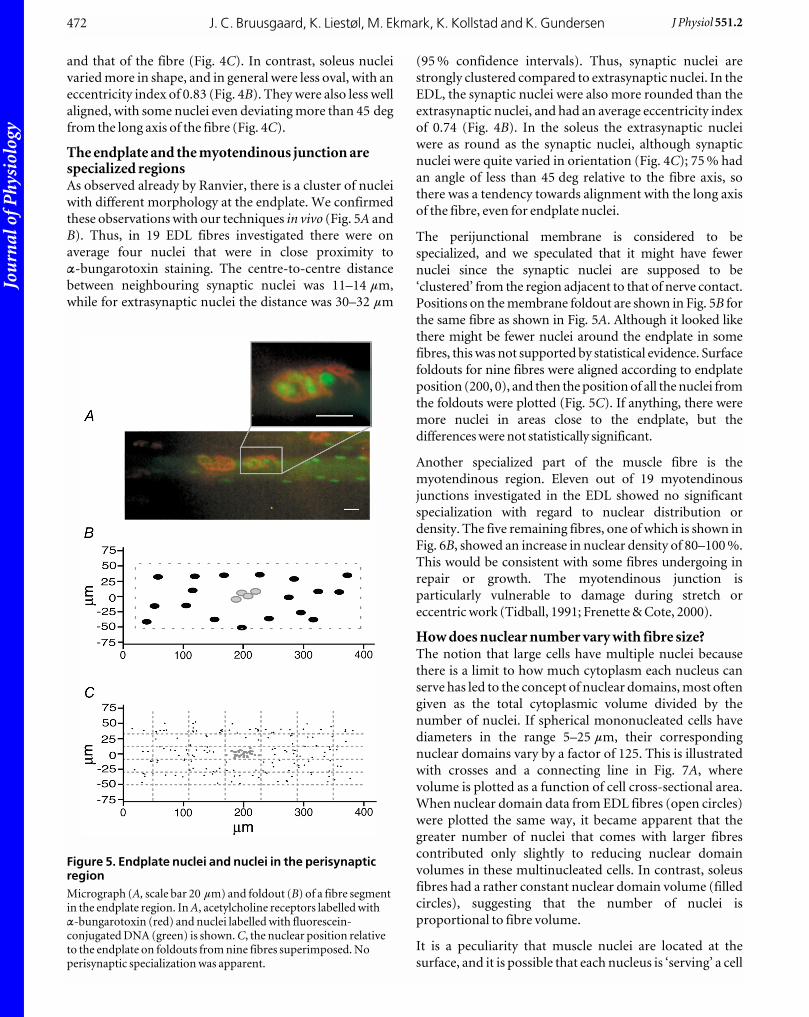
The endplate and the myotendinous junction arespecialized regionsAs observed already by Ranvier, there is a cluster of nuclei
with different morphology at the endplate. We confirmed
these observations with our techniques in vivo (Fig. 5A and
B). Thus, in 19 EDL fibres investigated there were on
average four nuclei that were in close proximity toa-bungarotoxin staining. The centre-to-centre distance
between neighbouring synaptic nuclei was 11–14 mm,
while for extrasynaptic nuclei the distance was 30–32 mm
(95 % confidence intervals). Thus, synaptic nuclei are
strongly clustered compared to extrasynaptic nuclei. In the
EDL, the synaptic nuclei were also more rounded than the
extrasynaptic nuclei, and had an average eccentricity index
of 0.74 (Fig. 4B). In the soleus the extrasynaptic nuclei
were as round as the synaptic nuclei, although synaptic
nuclei were quite varied in orientation (Fig. 4C); 75 % had
an angle of less than 45 deg relative to the fibre axis, so
there was a tendency towards alignment with the long axis
of the fibre, even for endplate nuclei.
The perijunctional membrane is considered to be
specialized, and we speculated that it might have fewer
nuclei since the synaptic nuclei are supposed to be
‘clustered’ from the region adjacent to that of nerve contact.
Positions on the membrane foldout are shown in Fig. 5B for
the same fibre as shown in Fig. 5A. Although it looked like
there might be fewer nuclei around the endplate in some
fibres, this was not supported by statistical evidence. Surface
foldouts for nine fibres were aligned according to endplate
position (200, 0), and then the position of all the nuclei from
the foldouts were plotted (Fig. 5C). If anything, there were
more nuclei in areas close to the endplate, but the
differences were not statistically significant.
Another specialized part of the muscle fibre is the
myotendinous region. Eleven out of 19 myotendinous
junctions investigated in the EDL showed no significant
specialization with regard to nuclear distribution or
density. The five remaining fibres, one of which is shown in
Fig. 6B, showed an increase in nuclear density of 80–100 %.
This would be consistent with some fibres undergoing in
repair or growth. The myotendinous junction is
particularly vulnerable to damage during stretch or
eccentric work (Tidball, 1991; Frenette & Cote, 2000).
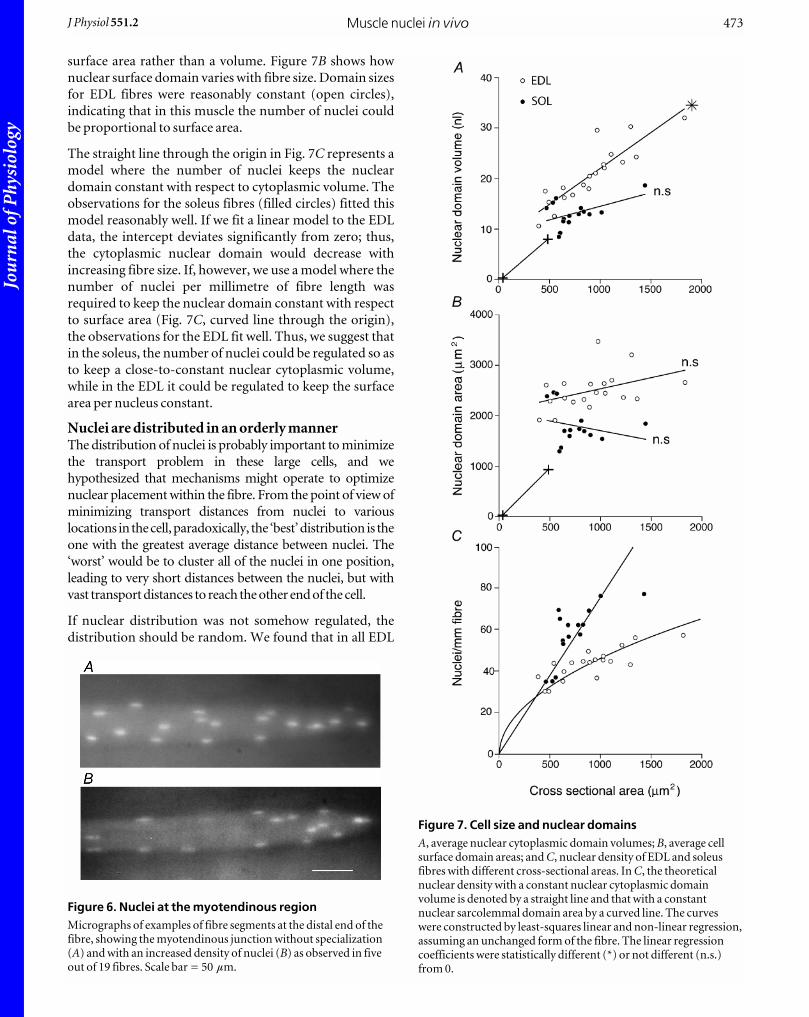
How does nuclear number vary with fibre size?The notion that large cells have multiple nuclei because
there is a limit to how much cytoplasm each nucleus can
serve has led to the concept of nuclear domains, most often
given as the total cytoplasmic volume divided by the
number of nuclei. If spherical mononucleated cells have
diameters in the range 5–25 mm, their corresponding
nuclear domains vary by a factor of 125. This is illustrated
with crosses and a connecting line in Fig. 7A, where
volume is plotted as a function of cell cross-sectional area.
When nuclear domain data from EDL fibres (open circles)
were plotted the same way, it became apparent that the
greater number of nuclei that comes with larger fibres
contributed only slightly to reducing nuclear domain
volumes in these multinucleated cells. In contrast, soleus
fibres had a rather constant nuclear domain volume (filled
circles), suggesting that the number of nuclei is
proportional to fibre volume.
It is a peculiarity that muscle nuclei are located at the
surface, and it is possible that each nucleus is ‘serving’ a cell
J. C. Bruusgaard, K. Liestøl, M. Ekmark, K. Kollstad and K. Gundersen472 J Physiol 551.2
Figure 5. Endplate nuclei and nuclei in the perisynapticregionMicrograph (A, scale bar 20 mm) and foldout (B) of a fibre segmentin the endplate region. In A, acetylcholine receptors labelled witha-bungarotoxin (red) and nuclei labelled with fluorescein-conjugated DNA (green) is shown. C, the nuclear position relativeto the endplate on foldouts from nine fibres superimposed. Noperisynaptic specialization was apparent.
Jou
rnal
of P
hysi
olog
y
surface area rather than a volume. Figure 7B shows how
nuclear surface domain varies with fibre size. Domain sizes
for EDL fibres were reasonably constant (open circles),
indicating that in this muscle the number of nuclei could
be proportional to surface area.
The straight line through the origin in Fig. 7C represents a
model where the number of nuclei keeps the nuclear
domain constant with respect to cytoplasmic volume. The
observations for the soleus fibres (filled circles) fitted this
model reasonably well. If we fit a linear model to the EDL
data, the intercept deviates significantly from zero; thus,
the cytoplasmic nuclear domain would decrease with
increasing fibre size. If, however, we use a model where the
number of nuclei per millimetre of fibre length was
required to keep the nuclear domain constant with respect
to surface area (Fig. 7C, curved line through the origin),
the observations for the EDL fit well. Thus, we suggest that
in the soleus, the number of nuclei could be regulated so as
to keep a close-to-constant nuclear cytoplasmic volume,
while in the EDL it could be regulated to keep the surface
area per nucleus constant.
Nuclei are distributed in an orderly mannerThe distribution of nuclei is probably important to minimize
the transport problem in these large cells, and we
hypothesized that mechanisms might operate to optimize
nuclear placement within the fibre. From the point of view of
minimizing transport distances from nuclei to various
locations in the cell, paradoxically, the ‘best’ distribution is the
one with the greatest average distance between nuclei. The
‘worst’ would be to cluster all of the nuclei in one position,
leading to very short distances between the nuclei, but with
vast transport distances to reach the other end of the cell.
If nuclear distribution was not somehow regulated, the
distribution should be random. We found that in all EDL
Muscle nuclei in vivoJ Physiol 551.2 473
Figure 6. Nuclei at the myotendinous regionMicrographs of examples of fibre segments at the distal end of thefibre, showing the myotendinous junction without specialization(A) and with an increased density of nuclei (B) as observed in fiveout of 19 fibres. Scale bar = 50 mm.
Figure 7. Cell size and nuclear domainsA, average nuclear cytoplasmic domain volumes; B, average cellsurface domain areas; and C, nuclear density of EDL and soleusfibres with different cross-sectional areas. In C, the theoreticalnuclear density with a constant nuclear cytoplasmic domainvolume is denoted by a straight line and that with a constantnuclear sarcolemmal domain area by a curved line. The curveswere constructed by least-squares linear and non-linear regression,assuming an unchanged form of the fibre. The linear regressioncoefficients were statistically different (*) or not different (n.s.)from 0.
Jou
rnal
of P
hysi
olog
y
fibres and in 12 out of 14 soleus fibres investigated, the
positions of nuclei were significantly different from those
that would be expected if they were positioned randomly
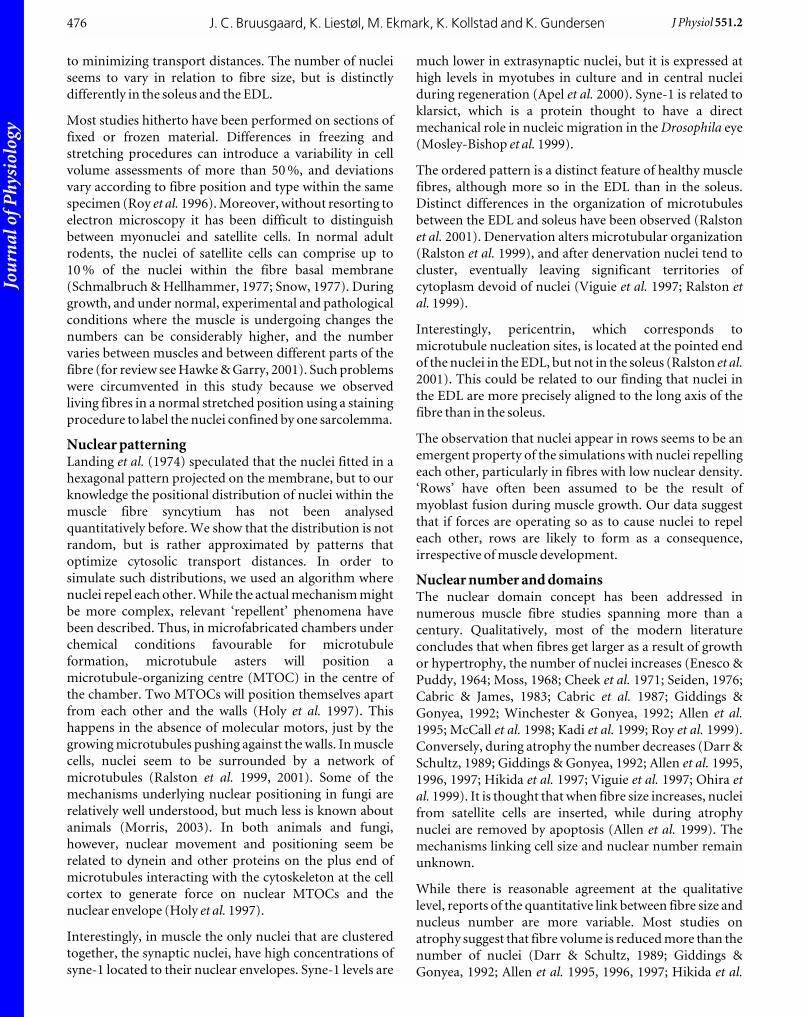
on the surface (P < 0.05). In all of the fibres, the average
distance between the nuclei and their nearest neighbour
was longer than obtained by a random distribution,
indicating that the nuclei are more evenly distributed than
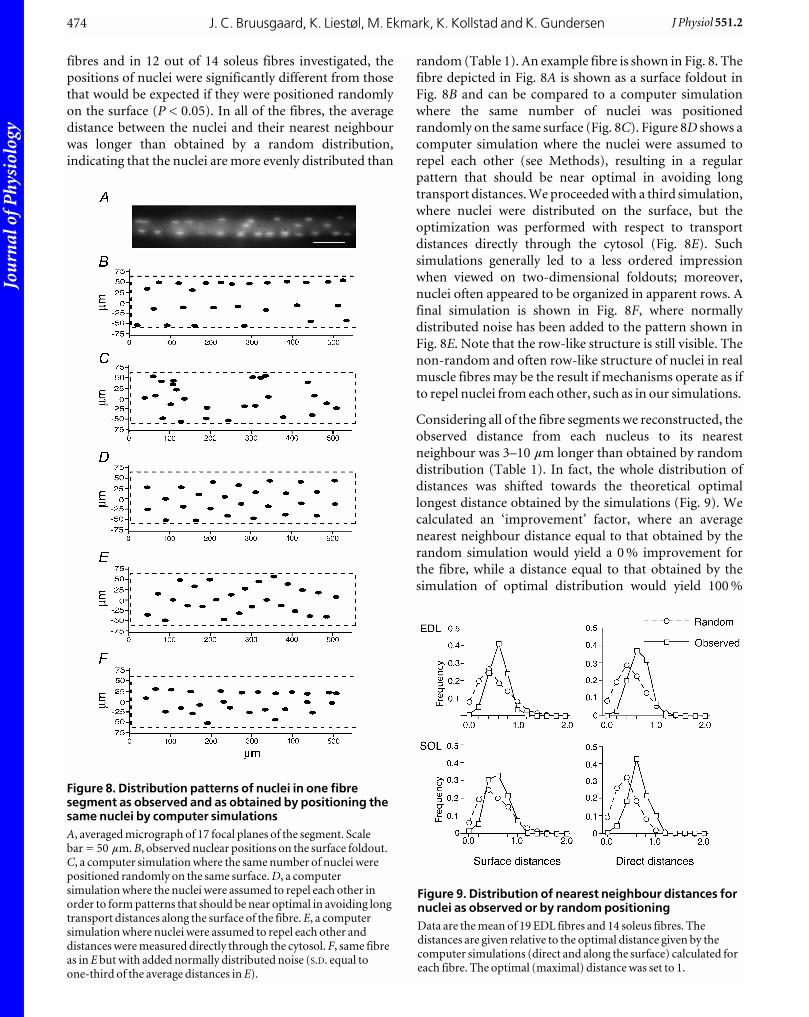
random (Table 1). An example fibre is shown in Fig. 8. The
fibre depicted in Fig. 8A is shown as a surface foldout in
Fig. 8B and can be compared to a computer simulation
where the same number of nuclei was positioned
randomly on the same surface (Fig. 8C). Figure 8D shows a
computer simulation where the nuclei were assumed to
repel each other (see Methods), resulting in a regular
pattern that should be near optimal in avoiding long
transport distances. We proceeded with a third simulation,
where nuclei were distributed on the surface, but the
optimization was performed with respect to transport
distances directly through the cytosol (Fig. 8E). Such
simulations generally led to a less ordered impression
when viewed on two-dimensional foldouts; moreover,
nuclei often appeared to be organized in apparent rows. A
final simulation is shown in Fig. 8F, where normally
distributed noise has been added to the pattern shown in
Fig. 8E. Note that the row-like structure is still visible. The
non-random and often row-like structure of nuclei in real
muscle fibres may be the result if mechanisms operate as if
to repel nuclei from each other, such as in our simulations.
Considering all of the fibre segments we reconstructed, the
observed distance from each nucleus to its nearest
neighbour was 3–10 mm longer than obtained by random
distribution (Table 1). In fact, the whole distribution of
distances was shifted towards the theoretical optimal
longest distance obtained by the simulations (Fig. 9). We
calculated an ‘improvement’ factor, where an average
nearest neighbour distance equal to that obtained by the
random simulation would yield a 0 % improvement for
the fibre, while a distance equal to that obtained by the
simulation of optimal distribution would yield 100 %
J. C. Bruusgaard, K. Liestøl, M. Ekmark, K. Kollstad and K. Gundersen474 J Physiol 551.2
Figure 8. Distribution patterns of nuclei in one fibresegment as observed and as obtained by positioning thesame nuclei by computer simulationsA, averaged micrograph of 17 focal planes of the segment. Scalebar = 50 mm. B, observed nuclear positions on the surface foldout.C, a computer simulation where the same number of nuclei werepositioned randomly on the same surface. D, a computersimulation where the nuclei were assumed to repel each other inorder to form patterns that should be near optimal in avoiding longtransport distances along the surface of the fibre. E, a computersimulation where nuclei were assumed to repel each other anddistances were measured directly through the cytosol. F, same fibreas in E but with added normally distributed noise (S.D. equal toone-third of the average distances in E).
Figure 9. Distribution of nearest neighbour distances fornuclei as observed or by random positioningData are the mean of 19 EDL fibres and 14 soleus fibres. Thedistances are given relative to the optimal distance given by thecomputer simulations (direct and along the surface) calculated foreach fibre. The optimal (maximal) distance was set to 1.
Jou
rnal
of P
hysi
olog
y
improvement. Measured this way, EDL fibres exhibited a
43 % improvement with respect to both direct and along
the surface distances. The factors of 31 and 35 % found for
the soleus were lower, and the analysis therefore
confirmed the impression that the nuclei of EDL fibres
have a more even, and thus ‘better’ distribution than in the
soleus. Interestingly, in the soleus, the observed
improvement was better with respect to optimal direct
distances than with respect to optimizing along the surface
distances for 11 of the 14 fibres investigated (P = 0.05,
Wilcoxon signed-rank test). This could hint that whatever
mechanism is operating, it is optimizing direct distances
rather than along the surface distances in this muscle.
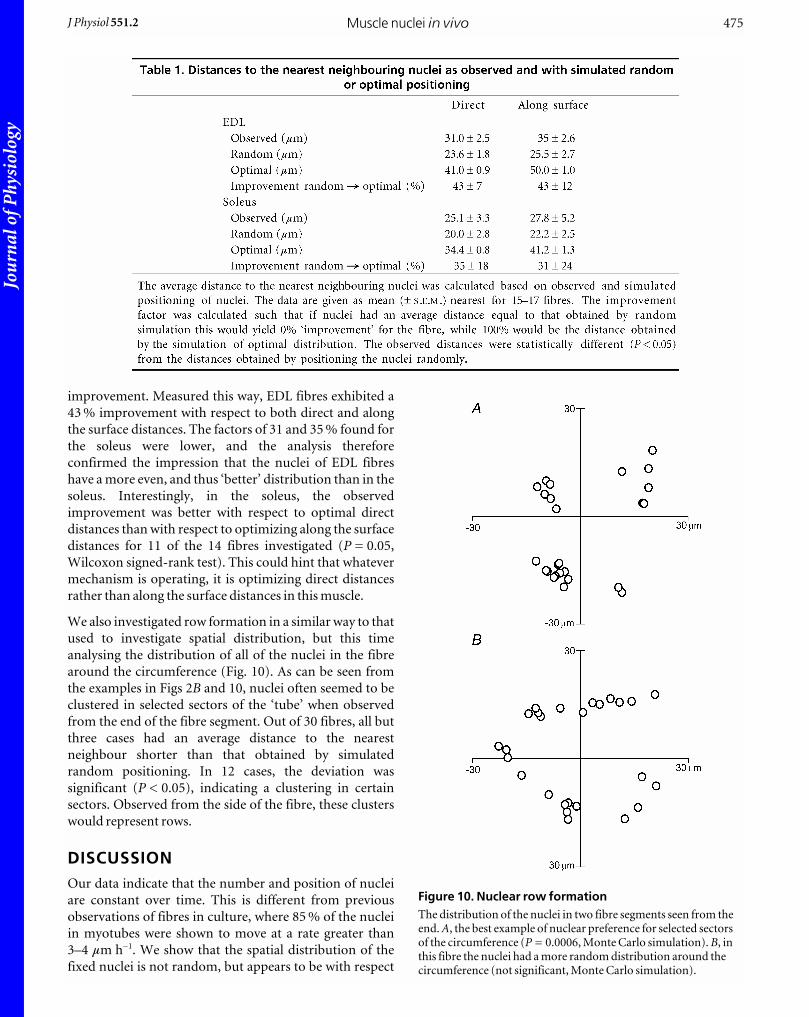
We also investigated row formation in a similar way to that
used to investigate spatial distribution, but this time
analysing the distribution of all of the nuclei in the fibre
around the circumference (Fig. 10). As can be seen from
the examples in Figs 2B and 10, nuclei often seemed to be
clustered in selected sectors of the ‘tube’ when observed
from the end of the fibre segment. Out of 30 fibres, all but
three cases had an average distance to the nearest
neighbour shorter than that obtained by simulated
random positioning. In 12 cases, the deviation was
significant (P < 0.05), indicating a clustering in certain
sectors. Observed from the side of the fibre, these clusters
would represent rows.
DISCUSSIONOur data indicate that the number and position of nuclei
are constant over time. This is different from previous
observations of fibres in culture, where 85 % of the nuclei
in myotubes were shown to move at a rate greater than
3–4 mm h_1. We show that the spatial distribution of the
fixed nuclei is not random, but appears to be with respect
Muscle nuclei in vivoJ Physiol 551.2 475
Figure 10. Nuclear row formationThe distribution of the nuclei in two fibre segments seen from theend. A, the best example of nuclear preference for selected sectorsof the circumference (P = 0.0006, Monte Carlo simulation). B, inthis fibre the nuclei had a more random distribution around thecircumference (not significant, Monte Carlo simulation).
Jou
rnal
of P
hysi
olog
y
to minimizing transport distances. The number of nuclei
seems to vary in relation to fibre size, but is distinctly
differently in the soleus and the EDL.
Most studies hitherto have been performed on sections of
fixed or frozen material. Differences in freezing and
stretching procedures can introduce a variability in cell
volume assessments of more than 50 %, and deviations
vary according to fibre position and type within the same
specimen (Roy et al. 1996). Moreover, without resorting to
electron microscopy it has been difficult to distinguish
between myonuclei and satellite cells. In normal adult
rodents, the nuclei of satellite cells can comprise up to
10 % of the nuclei within the fibre basal membrane
(Schmalbruch & Hellhammer, 1977; Snow, 1977). During
growth, and under normal, experimental and pathological
conditions where the muscle is undergoing changes the
numbers can be considerably higher, and the number
varies between muscles and between different parts of the
fibre (for review see Hawke & Garry, 2001). Such problems
were circumvented in this study because we observed
living fibres in a normal stretched position using a staining
procedure to label the nuclei confined by one sarcolemma.
Nuclear patterningLanding et al. (1974) speculated that the nuclei fitted in a
hexagonal pattern projected on the membrane, but to our
knowledge the positional distribution of nuclei within the
muscle fibre syncytium has not been analysed
quantitatively before. We show that the distribution is not
random, but is rather approximated by patterns that
optimize cytosolic transport distances. In order to
simulate such distributions, we used an algorithm where
nuclei repel each other. While the actual mechanism might
be more complex, relevant ‘repellent’ phenomena have
been described. Thus, in microfabricated chambers under
chemical conditions favourable for microtubule
formation, microtubule asters will position a
microtubule-organizing centre (MTOC) in the centre of
the chamber. Two MTOCs will position themselves apart
from each other and the walls (Holy et al. 1997). This
happens in the absence of molecular motors, just by the
growing microtubules pushing against the walls. In muscle
cells, nuclei seem to be surrounded by a network of
microtubules (Ralston et al. 1999, 2001). Some of the
mechanisms underlying nuclear positioning in fungi are
relatively well understood, but much less is known about
animals (Morris, 2003). In both animals and fungi,
however, nuclear movement and positioning seem be
related to dynein and other proteins on the plus end of
microtubules interacting with the cytoskeleton at the cell
cortex to generate force on nuclear MTOCs and the
nuclear envelope (Holy et al. 1997).
Interestingly, in muscle the only nuclei that are clustered
together, the synaptic nuclei, have high concentrations of
syne-1 located to their nuclear envelopes. Syne-1 levels are
much lower in extrasynaptic nuclei, but it is expressed at
high levels in myotubes in culture and in central nuclei
during regeneration (Apel et al. 2000). Syne-1 is related to
klarsict, which is a protein thought to have a direct
mechanical role in nucleic migration in the Drosophila eye
(Mosley-Bishop et al. 1999).
The ordered pattern is a distinct feature of healthy muscle
fibres, although more so in the EDL than in the soleus.
Distinct differences in the organization of microtubules
between the EDL and soleus have been observed (Ralston
et al. 2001). Denervation alters microtubular organization
(Ralston et al. 1999), and after denervation nuclei tend to
cluster, eventually leaving significant territories of
cytoplasm devoid of nuclei (Viguie et al. 1997; Ralston etal. 1999).
Interestingly, pericentrin, which corresponds to
microtubule nucleation sites, is located at the pointed end
of the nuclei in the EDL, but not in the soleus (Ralston et al.2001). This could be related to our finding that nuclei in
the EDL are more precisely aligned to the long axis of the
fibre than in the soleus.
The observation that nuclei appear in rows seems to be an
emergent property of the simulations with nuclei repelling
each other, particularly in fibres with low nuclear density.
‘Rows’ have often been assumed to be the result of
myoblast fusion during muscle growth. Our data suggest
that if forces are operating so as to cause nuclei to repel
each other, rows are likely to form as a consequence,
irrespective of muscle development.
Nuclear number and domainsThe nuclear domain concept has been addressed in
numerous muscle fibre studies spanning more than a
century. Qualitatively, most of the modern literature
concludes that when fibres get larger as a result of growth
or hypertrophy, the number of nuclei increases (Enesco &
Puddy, 1964; Moss, 1968; Cheek et al. 1971; Seiden, 1976;
Cabric & James, 1983; Cabric et al. 1987; Giddings &
Gonyea, 1992; Winchester & Gonyea, 1992; Allen et al.1995; McCall et al. 1998; Kadi et al. 1999; Roy et al. 1999).
Conversely, during atrophy the number decreases (Darr &
Schultz, 1989; Giddings & Gonyea, 1992; Allen et al. 1995,
1996, 1997; Hikida et al. 1997; Viguie et al. 1997; Ohira etal. 1999). It is thought that when fibre size increases, nuclei
from satellite cells are inserted, while during atrophy
nuclei are removed by apoptosis (Allen et al. 1999). The
mechanisms linking cell size and nuclear number remain
unknown.
While there is reasonable agreement at the qualitative
level, reports of the quantitative link between fibre size and
nucleus number are more variable. Most studies on
atrophy suggest that fibre volume is reduced more than the
number of nuclei (Darr & Schultz, 1989; Giddings &
Gonyea, 1992; Allen et al. 1995, 1996, 1997; Hikida et al.
J. C. Bruusgaard, K. Liestøl, M. Ekmark, K. Kollstad and K. Gundersen476 J Physiol 551.2
Jou
rnal
of P
hysi
olog
y
1997; Viguie et al. 1997; Ohira et al. 1999). Similarly,
during hypertrophy, some studies suggest that the increase
in the number of nuclei is less than sufficient to keep
constant volume domains (Cheek et al. 1971; Giddings &
Gonyea, 1992; Winchester & Gonyea, 1992; Kadi et al.1999), while others suggest that the number of nuclei
increases in proportion to volume (Enesco & Puddy, 1964;
Moss, 1968; Seiden, 1976; McCall et al. 1998; Roy et al.1999). Only a few studies suggest that the number of nuclei
increases more than the volume (Cabric & James, 1983;
Cabric et al. 1987; Allen et al. 1995).
Some of the controversy regarding the relationship
between fibre size and nucleus number could be related to
methodological imperfections, but also to the fact that
most of the studies focus on muscle undergoing changes.
During the dynamic phase of adaptation, loss or gain in
cytoplasm might be disproportionate to the rate of loss or
gain of nuclei. In the present study we have focused on the
correlation between size and nucleus number under stable
conditions. We find that for the normal size distribution in
freely moving mice, oxidative soleus fibres display nucleus
numbers that seem to vary in proportion to volume. In
glycolytic EDL fibres this seems not to be the case, and the
number of nuclei is more closely related to surface area. In
support of these conclusions, it has been reported that in
fibres from oxidative muscles the number of nuclei is more
dependent on fibre size than in fibres from fast muscles
(Tseng et al. 1994; Dupont-Versteegden et al. 2000). This
might be related to the fact that the EDL is a much more
stable structure than the soleus, with an average protein
half-life of more than 14 days, about twice that of the
soleus (Goldberg, 1967; Kelly et al. 1984). We speculate
that in at least some muscles the interior is rather stable,
containing proteins with long half-lives, and that the
surface membrane and cytoskeleton might be the most
dynamic part. This might also explain one of the more
enigmatic properties of muscle, namely the finding that all
nuclei are located at the surface, a rather suboptimal
positioning with respect to minimizing transport distances
to the interior. Central nuclei are found only during
growth or related to pathology and repair where the fibre is
remodelled.
In conclusion, we suggest that both the spatial distribution
and density of nucleic are regulated in muscle. The
number of nuclei seems to be approximately proportional
either to cytoplasmic volume or to the cell surface area. It
seems unlikely that the latter is a mere imperfect or
insufficient adaptation to volume, since few fibres had
nucleic densities corresponding to values between those
predicted by each model.
REFERENCESAllen DL, Linderman JK, Roy RR, Bigbee AJ, Grindeland RE, Mukku
V & Edgerton VR (1997). Apoptosis: a mechanism contributing to
remodeling of skeletal muscle in response to hindlimb
unweighting. Am J Physiol 273, C579–587.
Allen DL, Monke SR, Talmadge RJ, Roy RR & Edgerton VR (1995).
Plasticity of myonuclear number in hypertrophied and atrophied
mammalian skeletal muscle fibers. J Appl Physiol 78, 1969–1976.
Allen DL, Roy RR & Edgerton VR (1999). Myonuclear domains in
muscle adaptation and disease. Muscle Nerve 22, 1350–1360.
Allen DL, Yasui W, Tanaka T, Ohira Y, Nagaoka S, Sekiguchi C,
Hinds WE, Roy RR & Edgerton VR (1996). Myonuclear number
and myosin heavy chain expression in rat soleus single muscle
fibers after spaceflight. J Appl Physiol 81, 145–151.
Apel ED, Lewis RM, Grady RM & Sanes JR (2000). Syne-1, a
dystrophin- and klarsicht-related protein associated with synaptic
nuclei at the neuromuscular junction. J Biol Chem 275,
31 986–31 995.
Bader CR, Bertrand D, Cooper E & Mauro A (1988). Membrane
currents of rat satellite cells attached to intact skeletal muscle
fibers. Neuron 1, 237–240.
Balice-Gordon RJ & Lichtman JW (1990). In vivo visualization of the
growth of pre- and postsynaptic elements of neuromuscular
junctions in the mouse. J Neurosci 10, 894–908.
Cabric M, Appell HJ & Resic A (1987). Effects of electrical
stimulation of different frequencies on the myonuclei and fiber
size in human muscle. Int J Sports Med 8, 323–326.
Cabric M & James NT (1983). Morphometric analyses on the
muscles of exercise trained and untrained dogs. Am J Anat 166,
359–368.
Cavalier-Smith T (1978). Nuclear volume control by nucleoskeletal
DNA, selection for cell volume and cell growth rate, and the
solution of the DNA C-value paradox. J Cell Sci 34, 247–278.
Cavalier-Smith T (1980). How selfish is DNA? Nature 285, 617–618.
Cheek DB, Holt AB, Hill DE & Talbert JL (1971). Skeletal muscle cell
mass and growth: the concept of the deoxyribonucleic acid unit.
Pediatr Res 5, 312–328.
Darr KC & Schultz E (1989). Hindlimb suspension suppresses
muscle growth and satellite cell proliferation. J Appl Physiol 67,
1827–1834.
Dupont-Versteegden EE, Murphy RJ, Houle JD, Gurley CM &
Peterson CA (2000). Mechanisms leading to restoration of muscle
size with exercise and transplantation after spinal cord injury. Am JPhysiol 279, C1677–1684.
Enesco M & Puddy D (1964). Increase in the number of nuclei and
weight in skeletal muscle of rats of various ages. Am J Anat 114,
235–244.
Englander LL & Rubin LL (1987). Acetylcholine receptor clustering
and nuclear movement in muscle fibers in culture. J Cell Biol 104,
87–95.
Frenette J & Cote CH (2000). Modulation of structural protein
content of the myotendinous junction following eccentric
contractions. Int J Sports Med 21, 313–320.
Geman S & Geman D (1984). Stochastic relaxation, Gibbs
distribution and the restoration of images. IEEE Trans PAMI 6,
721–741.
Giddings CJ & Gonyea WJ (1992). Morphological observations
supporting muscle fiber hyperplasia following weight-lifting
exercise in cats. Anat Rec 233, 178–195.
Goldberg AL (1967). Protein synthesis in tonic and phasic skeletal
muscles. Nature 216, 1219–1220.
Muscle nuclei in vivoJ Physiol 551.2 477
Jou
rnal
of P
hysi
olog
y
Gregory TR (2001). Coincidence, coevolution, or causation? DNA
content, cell size, and the C-value enigma. Biol Rev Camb PhilosSoc 76, 65–101.
Gundersen K, Sanes JR & Merlie JP (1993). Neural regulation of
muscle acetylcholine receptor e- and a-subunit gene promoters in
transgenic mice. J Cell Biol 123, 1535–1544.
Hall ZW & Ralston E (1989). Nuclear domains in muscle cells. Cell59, 771–772.
Hartig R, Shoeman RL, Janetzko A, Grub S & Traub P (1998). Active
nuclear import of single-stranded oligonucleotides and their
complexes with non-karyophilic macromolecules. Biol Cell 90,
407–426.
Hawke TJ & Garry DJ (2001). Myogenic satellite cells: physiology to
molecular biology. J Appl Physiol 91, 534–551.
Hikida RS, Van Nostran S, Murray JD, Staron RS, Gordon SE &
Kraemer WJ (1997). Myonuclear loss in atrophied soleus muscle
fibers. Anat Rec 247, 350–354.
Holy TE, Dogterom M, Yurke B & Leibler S (1997). Assembly and
positioning of microtubule asters in microfabricated chambers.
Proc Natl Acad Sci U S A 94, 6228–6231.
Kadi F, Eriksson A, Holmner S, Butler-Browne GS & Thornell LE
(1999). Cellular adaptation of the trapezius muscle in strength-
trained athletes. Histochem Cell Biol 111, 189–195.
Kelly FJ, Lewis SE, Anderson P & Goldspink DF (1984). Pre- and
postnatal growth and protein turnover in four muscles of the rat.
Muscle Nerve 7, 235–242.
Landing BH, Dixon LG & Wells T (1974). Studies on isolated human
skeletal muscle fibers. Hum Pathol 5, 441–461.
Lichtman JW, Magarassi L & Purves D (1987). Visualization of
neuromuscular junctions over periods of several months in living
mice. J Neurosci 7, 1215–1222.
McCall GE, Allen DL, Linderman JK, Grindeland RE, Roy RR,
Mukku VR & Edgerton VR (1998). Maintenance of myonuclear
domain size in rat soleus after overload and growth hormone/
IGF-I treatment. J Appl Physiol 84, 1407–1412.
Merlie JP & Sanes JR (1985). Concentration of acetylcholine receptor
mRNA in synaptic regions of adult muscle fibers. Nature 317,
66–68.
Morris NR (2003). Nuclear positioning: the means is at the ends.
Curr Opin Cell Biol 15, 54–59.
Mosley-Bishop KL, Li Q, Patterson L & Fischer JA (1999). Molecular
analysis of the klarsicht gene and its role in nuclear migration
within differentiating cells of the Drosophila eye. Curr Biol 9,
1211–1220.
Moss FP (1968). The relationship between the dimensions of the
fibers and the number of nuclei during normal growth of skeletal
muscle in the domestic fowl. Am J Anat 122, 555–564.
Ohira Y, Yoshinaga T, Ohara M, Nonaka I, Yoshioka T, Yamashita-
Goto K, Shenkman BS, Kozlovskaya IB, Roy RR & Edgerton VR
(1999). Myonuclear domain and myosin phenotype in human
soleus after bed rest with or without loading. J App Pysiol 87,
1776–1785.
Ralston E & Hall ZW (1992). Restricted distribution of mRNA
produced from a single nucleus in hybrid myotubes. J Cell Biol119, 1063–1068.
Ralston E, Lu Z & Ploug T (1999). The organization of the Golgi
complex and microtubules in skeletal muscle is fiber type-
dependent. J Neurosci 19, 10 694–10 705.
Ralston E, Ploug T, Kalhovde J & Lomo T (2001). Golgi complex,
endoplasmic reticulum exit sites, and microtubules in skeletal
muscle fibers are organized by patterned activity. J Neurosci 21,
875–883.
Roy RR, Monke SR, Allen DL & Edgerton VR (1999). Modulation of
myonuclear number in functionally overloaded and exercised rat
plantaris fibers. J Appl Physiol 87, 634–642.
Roy RR, Pierotti DJ & Edgerton VR (1996). Skeletal muscle fiber
cross-sectional area: effects of freezing procedures. Acta Anat(Basel) 155, 131–135.
Sanes JR, Johnson YR, Kotzbauer PT, Mudd J, Hanley T, Martinou
JC & Merlie JP (1991). Selective expression of an acetylcholine
receptor-lacZ transgene in synaptic nuclei of adult muscle fibres.
Development 113, 1181–1191.
Schiaffino S, Gorza L, Sartore S, Saggin L, Ausoni S, Vianello M,
Gundersen K & Lømo T (1989). Three myosin heavy chain
isoforms in type 2 skeletal muscle fibres. J Muscle Res Cell Motil 10,
197–205.
Schmalbruch H (1978). Satellite cells of rat muscles as studied by
freeze-fracturing. Anat Rec 191, 371–376.
Schmalbruch H & Hellhammer U (1977). The number of nuclei in
adult rat muscles with special reference to satellite cells. Anat Rec189, 169–176.
Schmalbruch H & Lewis DM (2000). Dynamics of nuclei of muscle
fibers and connective tissue cells in normal and denervated rat
muscles. Muscle Nerve 23, 617–626.
Seiden D (1976). Quantitative analysis of muscle cell changes in
compensatory hypertrophy and work-induced hypertrophy. Am JAnat 145, 459–465.
Snow MH (1977). The effects of ageing on satellite cells in skeletal
muscles of mice and rats. Cell Tissue Res 185, 399–408.
Strassburger E (1893). Über die Wirkungssphäre der kerne und die
zellgrösse. Histol Beitr 5, 97–124.
Tidball JG (1991). Myotendinous junction injury in relation to
junction structure and molecular composition. Exerc Sport Sci Rev19, 419–445.
Tseng BS, Kasper CE & Edgerton VR (1994). Cytoplasm-to-
myonucleus ratios and succinate dehydrogenase activities in adult
rat slow and fast muscle fibers. Cell Tissue Res 275, 39–49.
Utvik JK, Njå A & Gundersen K (1999). DNA injection into single
cells of intact mice. Hum Gene Ther 10, 291–300.
Viguie CA, Lu DX, Huang SK, Rengen H & Carlson BM (1997).
Quantitative study of the effects of long-term denervation on the
extensor digitorum longus muscle of the rat. Anat Rec 248,
346–354.
Winchester PK & Gonyea WJ (1992). A quantitative study of satellite
cells and myonuclei in stretched avian slow tonic muscle. Anat Rec232, 369–377.
J. C. Bruusgaard, K. Liestøl, M. Ekmark, K. Kollstad and K. Gundersen478 J Physiol 551.2
Top Related
Copyright © 2022 FDOKUMEN

