


Bahasa
Halaman
Hukum

Noninvasive identification of human central sulcus: a comparison ofgyral morphology, functional MRI, dipole localization, and direct
cortical mapping
Vernon L. Towle,a,* Leila Khorasani,a Stephen Uftring,b Charles Pelizzari,c
Robert K. Erickson,d Jean-Paul Spire,a Kenneth Hoffmann,e David Chu,f and Michael Schergg
a Department of Neurology, University of Chicago, Chicago, IL, USAb Department of Radiology, University of Chicago, Chicago, IL, USA
c Department of Radiological Oncology, University of Chicago, Chicago, IL, USAd Department of Surgery, University of Chicago, Chicago, IL, USAe Department of Radiology, University of Buffalo, Buffalo, NY, USA
f Fonar Corporation, Melville, NY, USAg Section of Biomagnetism, Department of Neurology, University of Heidelberg, Heidelberg, Germany
Received 1 November 2002; revised 3 February 2003; accepted 14 February 2003
Abstract
The locations of the human primary hand cortical somatosensory and motor areas were estimated using structural and functional MRI,scalp-recorded somatosensory-evoked potential dipole localization, expert judgments based on cortical anatomy, and direct corticalstimulation and recording studies. The within-subject reliability of localization (across 3 separate days) was studied for eight normalsubjects. Intraoperative validation was obtained from five neurosurgical patients. The mean discrepancy between the different noninvasivefunctional imaging methods ranged from 6 to 26 mm. Quantitative comparison of the noninvasive methods with direct intraoperativestimulation and recording studies did not reveal a significant mean difference in accuracy. However, the expert judgments of the locationof the sensory hand areas were significantly more variable (maximum error, 39 mm) than the dipole or functional MRI techniques. It isconcluded that because expert judgments are less reliable for identifying the cortical hand area, consideration of the findings of noninvasivefunctional MRI and dipole localization studies is desirable for preoperative surgical planning.© 2003 Elsevier Science (USA). All rights reserved.
Keywords: Functional MRI; Functional localization; Somatosensory evoked potential; SEP; Sensory cortex; Dipole localization; Cortical mapping;Functional imaging
Introduction
The development of accurate noninvasive techniques fordetermining the location of the human primary motor andsensory cortex is of interest to researchers in a variety ofareas, particularly those interested in functional localization(Geyer et al., 2000; van Essen et al., 2000), cortical plas-
ticity (Pons et al., 1991; Mogilner et al., 1993; Wunderlichet al., 1998; Chu et al., 2000), and stroke (Jenkins andMerzenich, 1987; Chollet et al., 1991; Cao et al., 1998).Such information is of practical value as an aid in planningneurosurgical procedures involving the Rolandic area but,with few exceptions (Stapleton et al., 1997; Mine et al.,1998; Pujol et al., 1998), is still obtained through surgicalprocedures (King and Schell, 1987; Burchiel et al., 1989;Berger et al., 1989; Suzuki and Yasui, 1992; Hirsch et al.,2000). Because of the known relationship of primary sen-sory and motor cortex to the central sulcus, several nonin-vasive strategies have been proposed to identify this sulcus
* Corresponding author. Department of Neurology, MC-2030, TheUniversity of Chicago, 5841 S. Maryland Avenue, Chicago, IL 60637. Fax:�1-773-702-4066.
E-mail address: [email protected] (V.L. Towle).
NeuroImage 19 (2003) 684–697 www.elsevier.com/locate/ynimg
1053-8119/03/$ – see front matter © 2003 Elsevier Science (USA). All rights reserved.doi:10.1016/S1053-8119(03)00147-2
on the basis of gyral morphology as seen on CT or MRI(Kido et al., 1980; Iwasaki et al., 1991; Naidish et al., 1995;Yousry et al., 1997). Unfortunately, such morphologicallybased judgements have only rarely been verified by alter-nate means (Berger et al., 1990; White et al., 1997) and havebeen found to be unreliable across observers (Sobel et al.,1993; Kennedy et al., 1998). In such a situation, convergingevidence from independent techniques would increase theconfidence that the central sulcus has been correctly iden-tified. Potential confirmation can be sought through nonin-vasive functional imaging techniques such as positron emis-sion tomography (PET) (Fox et al., 1987; Nyberg et al.,1996; Bittar et al., 1999), functional magnetic resonanceimaging (fMRI) (Hammeke et al., 1994; Rao et al., 1995;Lin et al., 1996; Sakai et al., 1995), transcranial magneticstimulation (Krings et al., 1999), and dipole source local-ization using magnetoencephalography (MEG) (Hari et al.,1984; Gallen et al., 1993; Yang et al., 1993 Kristeva-Feigeet al., 1994) or electroencephalographic (EEG) recordings(Henderson et al., 1975; Suk et al., 1991; Buchner et al.,1994; Nakamura et al., 1998).
Direct cortical stimulation is widely accepted as a thebest means for identifying the motor and sensory cortexin awake humans (Penfield and Boldrey, 1937; Bergerand Rostomily, 1997). Somatosensory evoked potentials(SEPs) recorded directly from the surface of the brainhave also been used to identify primary sensory cortexduring surgery as a means to reduce postoperative mor-bidity (Woolsey et al., 1979; Wood et al., 1988; Allison,1982; Allison et al., 1989). In this study we compare (1)expert judgments based on gyral morphology, (2) sensoryand motor functional MRI activations of the hand, and (3)noninvasive scalp dipole localization studies of the handsensory area to (4) direct mapping studies of the sensoryand motor cortices to determine which of these noninva-sive procedures most accurately reflects intraoperativefindings. Their location and reliability are described fornormal subjects, and their accuracy and validity are as-sessed through quantitative comparisons with direct sur-gical mapping studies.
Materials and methods
Eight normal adult volunteers and five neurosurgicalpatients were studied. All gave informed written consent.
Normal subjects
The normal subjects were paid for their participation,which involved three 2.5-h electrophysiology recording ses-sions obtained on separate days and a 1.5-h MRI scanningsession. All of the subjects were right-handed, as measuredby the Edenburgh Handedness Inventory (Oldfield, 1971),and were without a history of neurologic disease.
Patients
The five patients (23–43 years old) were scheduled toundergo surgical resection of frontal and parietal tumors, orresections for focal epilepsy, and were evaluated in a single4-h recording session prior to surgery. The diagnoses werepartial motor seizures involving the left medial frontal lobe,partial complex seizures involving the left temporal lobe(two patients), partial complex seizures involving the rightposterior temporal lobe, and partial motor simple seizuresinvolving the left frontal lobe with secondary generaliza-tion. None of the patients had involvement of their hand intheir disease.
Direct cortical recordings
Subdural electrodes were implanted according to theneeds of the patient. After opening the dura, and preliminarymapping studies, 4 � 8 or 8 � 8 arrays of electrodes (PMTCorp., Minneapolis, MN) with 5- or 10-mm spacings wereplaced on the cortex. The grids were photographed in placeboth at implantation and at removal, as was the exposedcortex, with a ruler in view. In addition to the intraoperativestudies, somatosensory-evoked potentials were recorded atthe bedside with the patient awake, using identical param-eters to the preoperative study, except that the amplifier gainwas reduced from 1000 to 500. SEP dipoles were calculatedfrom the subdural recordings using a single-shell sphericalmodel.
To supplement the SEP maps, the cortex was alsomapped using direct cortical stimulation. Biphasic currentsbetween 1 and 10 mA consisting of 0.2-ms-duration pulsespresented at 50 Hz were utilized. When movement of thecontralateral hand, face, or foot was noted, the minimumcurrent to elicit a response was determined. Once the precisearea generating the response was identified, it was markedwith a small numbered label and photographed. For theawake patients the postcentral sensory area was also stim-ulated to identify sensory cortex. In the operating roomstimulation was performed using a bipolar stimulator with2- to 3-mm electrode spacing. At the bedside, stimulationwas administered through the implanted grids.
MRIs
Each of the subjects received three MRI scans of thehead in a single session according to imaging protocolsdeveloped at The University of Chicago. Scans were ob-tained using a 1.5-T whole-body MRI scanner equippedwith a quadrature head coil (Signa Advantage, GE MedicalSystems, Milwaukee, WI). Changes in blood flow related tostimulation were measured using a 2D T2*-weighted gradi-ent echo sequence (TR � 2000 ms, TE � 60 ms, flip angle� 90°). Five axial slices were obtained encompassing theprimary motor cortex and the supplementary motor area
685V.L. Towle et al. / NeuroImage 19 (2003) 684–697

using a within plane 128 � 128 resolution of 1.9 mm and an8-mm slice thickness. After a 32-s baseline recording, fouralternating 16-s-long periods of self-paced finger opposition(motor activation) or passive squeezing of the hand (so-matosensory activation) were obtained, separated by 16-srest intervals. Pulses began 5 s after the start of each task.This procedure was performed four times, lasting about 15min for each hand. It usually results in signal changesbetween 2 and 5%, which correlate with the task condition.Functional activations were analyzed using the AFNI signalanalysis package (Cox, 1996) after resampling the space to1-mm3 voxels and filtering clusters containing fewer thanfive contiguous voxels. The functional images were super-imposed on 60 sagittal (256 � 128) 2.8-mm-thick high-resolution T1-weighted anatomical slices after correctionfor possible head movement. A scan designed to enhancecortex was obtained and rendered as a 3D model of cortex,to better visualize the organization of gyral patterns usingsoftware developed in this laboratory (Levin et al., 1989).The left side of the head was marked with a vitamin Ecapsule. The radiologists were blinded to the intraoperativeand scalp SEP results until after the analyses of the func-tional MRI data for each subject were completed.
Somatosensory-evoked potentials
Normal subjects and patients underwent 2.5-h recordingsessions during which SEPs were elicited by electrical stim-ulation of the median nerve at the left and then right wrist.The stimuli were 0.2-ms square-wave pulses presented at 6per s at a constant current sufficient to produce a smallmuscle twitch of the thumb. After the application of thescalp electrodes, patients relaxed awake on a bed or reclinerin a semidarkened room in which the experimenter waspresent during 15 replications of the median nerve stimula-tion (N � 500 stimuli/replication). Each normal subject wasstudied on 3 separate days within a 1-month period. Themedian nerves of the patients were similarly studied on oneoccasion. Bandpass of the amplifiers was 1–500 Hz, with again of 1000. The amplified EEG was digitized for 50 msafter stimulus onset at 5 kHz per channel using the SYN-AMP signal averaging system (Neurosoft, Inc., El Paso,TX). Trials with potentials greater than 500 �V in anychannel were rejected as artifacted.
SEP data reduction and analysis
For median nerve stimulation the traditional componentsof interest were N10, P14, N18, N20, P22, P25, and P30. Toreduce the effect of the stimulus artifact, the first 5 ms wereeliminated for median nerve responses; the waveforms werelinearly detrended, and baselines between 5 and 10 ms wereset to 0. Dipole modeling was performed using the BrainElectric Source Analysis program (BESA 2.0, MEGIS Soft-ware GmbH, Munich, Germany) (Scherg, 1984; Scherg andvon Cramon, 1985). After removal of the grand mean wave-
form, brain stem dipoles were modeled between 10 ms andthe peak of N13; cortical dipoles were modeled over theinterval initially starting 2 ms after the peak of N13 (Oz)(and iteratively shifted to the onset of the N20 source) andending at the peak of N20 (Pc).
Scalp electrodes
Thirty-three electrodes were applied to the surface of thescalp after mild abrasion with conductive paste. In additionto the locations from the 10–20 system, extra electrodeswere placed in the central and parietal regions to increasethe spatial resolution near the active brain areas (Mosher etal., 1993). To increase resolution in the central area, extraelectrodes were placed at FC1,2 and CP1,2. To lessen themodeling problems from sampling only the top of the head(Desmedt et al., 1990), electrodes were placed lower on thehead at F8,9, T8,9, PO9,10, Nz, and Iz. Cz served as reference.
Registration of scalp electrode locations with MRIs
Scalp electrodes were located in the MRIs by a combi-nation of two methods: surface fitting and fiducial pointregistration. On each occasion that the scalp recordingswere obtained, 33 electrode locations and 11 fiducial points(nose tip, nasion, preauricular fossae, external auditorymeati, external canthi, mastoids, and left cheek) were digi-tized three times using an RF localizer (Polhemus Fastrak,Colchester, VT), the stylus of which was placed at eachelectrode location marked on the scalp. Accuracy was lessthan the width of an electrode (Towle et al., 1993). One-hundred fifty points on the scalp were digitized along withthe electrode locations and fiducial points to provide apatient-specific head-shaped coordinate reference for regis-tering the electrode locations with the MRI image (Pelizzariet al., 1989). After registration, the discrepancy between thefirst eight digitized fiducial points listed above and theircorresponding locations as identified on the MRI slicesprovided an index of registration accuracy.
Scalp SEP dipole variability
The reliability of each dipole estimate was comparedusing parametric descriptive statistics. After the dipole so-lutions were computed, the within- and between-sessionreliability of their location and orientation was quantified.We calculated the mean dipole location within and betweendays, as well as the average deviation from the mean.
Registration of subdural electrodes
The subdural recordings were registered to the MR im-ages using a blending of two procedures. Skull films of thegrids and radio-opaque markers placed on the contralateralscalp were taken from at least two directions so that theirrelative positions could be calculated (Metz and Fencil,
686 V.L. Towle et al. / NeuroImage 19 (2003) 684–697
1989). The electrode locations in the intraoperative photo-graphs were visually transferred to the 3D rendered corticalimages so that the location of the grid relative to the crani-otomy, gyral patterns, and surface vessels appeared identi-cal in the two images. They were then located on the 3Dimages using surface fitting (Pelizzari et al., 1989). Theresults of this reconstruction and fitting process were com-pared and manually adjusted to match intraoperative pho-tographs of the visible portions of the grids placed on thecortical surface, which were taken both at the time of im-plantation and at removal of the grids.
A second technique for locating the grids on the corticalsurface was to project them onto the surface based on theposition of the electrodes as seen in lateral skull films. Theywere positioned proportionally relative to the anterior andposterior poles and the inferior and superior surface of thebrain as seen on sagittal skull films and MRI. Subsequentanalyses revealed that neither of these techniques weresuperior, with a mean 9.6-mm discrepancy calculated acrossall electrodes. The mean of the two registration techniqueswas therefore used as the best estimate of the location of thesubdural grids on the brain surface.
Expert judgments
Eight “experts” were asked to make a judgment of thelocation of the cortical primary motor and sensory handareas based on cortical anatomy (two neurosurgeons, twoneurologists, and four neuroscientists). The anatomical T-1MRI slices were simultaneously viewed from all threeplanes using the AFNI display software. They were asked toscroll through the images and place the 3D cursor at theirbest estimate as to the location of the hand primary motorarea (BA 4) and the primary sensory receiving area (BA 3b).
Results
Expert judgments
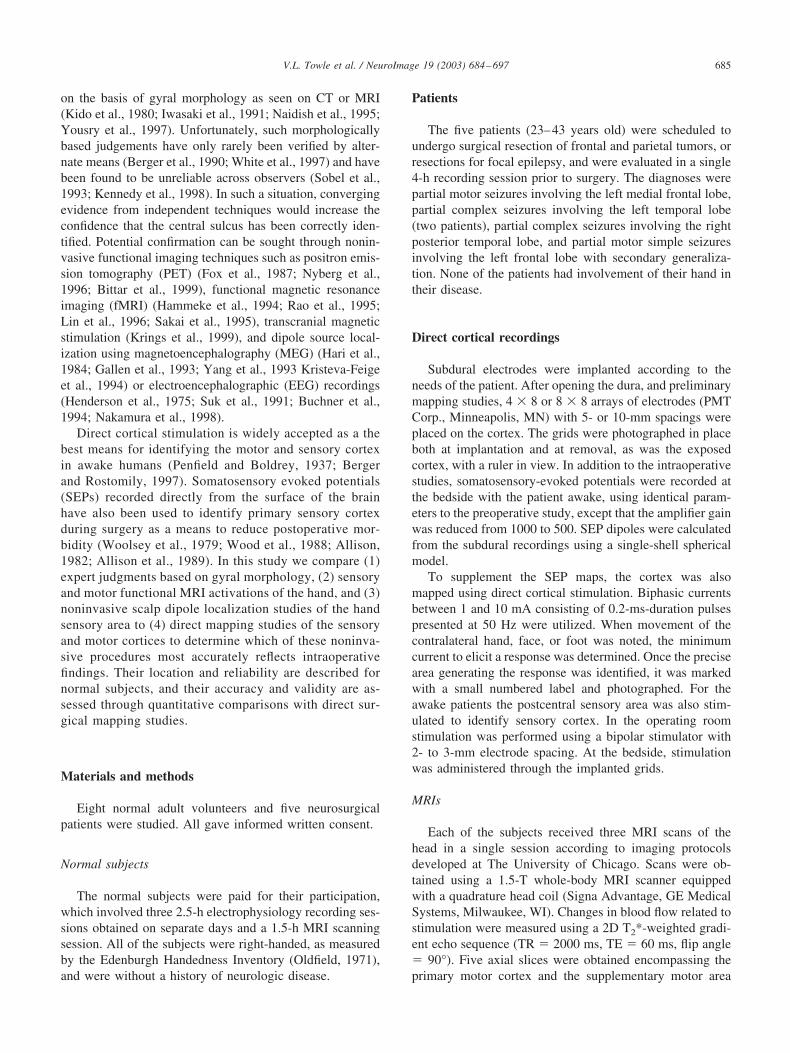
All of the experts located the hand somatosensory areawithin the Rolandic region, approximately midway alongthe convexity. For both the patients and the normal subjectsthe same gyrus was chosen in 60% of the judgments. For theremaining cases, two or three different gyri were identifiedas the central sulcus. After sequentially numbering the gyrifrom anterior to posterior, the Spearman rank-order corre-lation of the judgments was 0.55. Interestingly, the neuro-scientists, who were the most accurate on average in thissample (Fig. 1), relied mainly on the rostral axial cuts andattempted to identify an �-shaped “knob” along the motorstrip. The neurosurgeons more often relied on lateral sagittalslices and moved medially, away from the Sylvian fissure.The mean discrepancy among the eight experts and thedirect cortical mapping results was 25 mm, with the least
accurate judgment having a 48 mm discrepancy from thesurgical findings.
Functional MRI findings
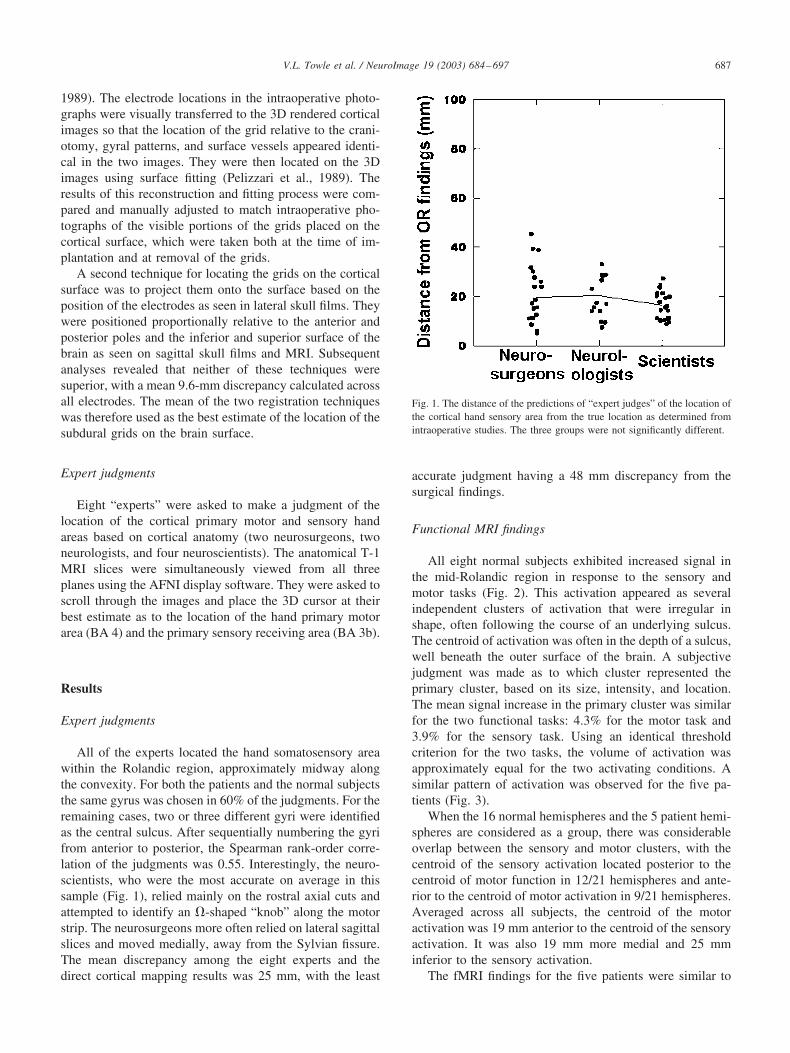
All eight normal subjects exhibited increased signal inthe mid-Rolandic region in response to the sensory andmotor tasks (Fig. 2). This activation appeared as severalindependent clusters of activation that were irregular inshape, often following the course of an underlying sulcus.The centroid of activation was often in the depth of a sulcus,well beneath the outer surface of the brain. A subjectivejudgment was made as to which cluster represented theprimary cluster, based on its size, intensity, and location.The mean signal increase in the primary cluster was similarfor the two functional tasks: 4.3% for the motor task and3.9% for the sensory task. Using an identical thresholdcriterion for the two tasks, the volume of activation wasapproximately equal for the two activating conditions. Asimilar pattern of activation was observed for the five pa-tients (Fig. 3).
When the 16 normal hemispheres and the 5 patient hemi-spheres are considered as a group, there was considerableoverlap between the sensory and motor clusters, with thecentroid of the sensory activation located posterior to thecentroid of motor function in 12/21 hemispheres and ante-rior to the centroid of motor activation in 9/21 hemispheres.Averaged across all subjects, the centroid of the motoractivation was 19 mm anterior to the centroid of the sensoryactivation. It was also 19 mm more medial and 25 mminferior to the sensory activation.
The fMRI findings for the five patients were similar to
Fig. 1. The distance of the predictions of “expert judges” of the location ofthe cortical hand sensory area from the true location as determined fromintraoperative studies. The three groups were not significantly different.
687V.L. Towle et al. / NeuroImage 19 (2003) 684–697
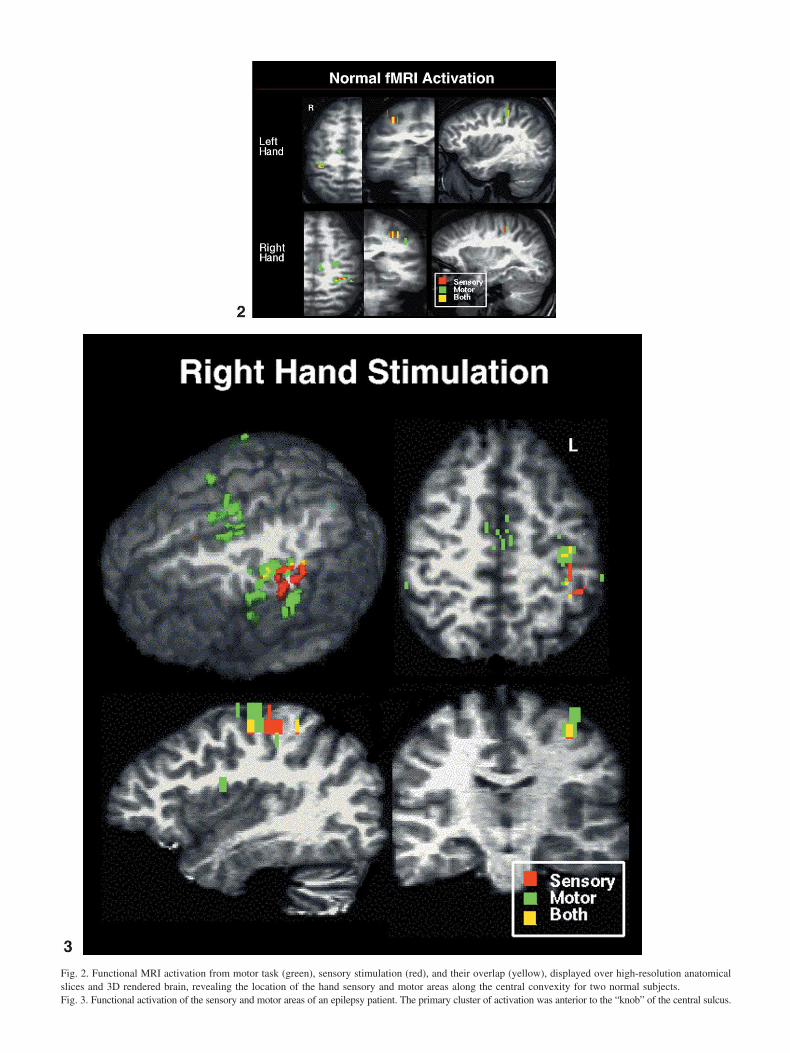
Fig. 2. Functional MRI activation from motor task (green), sensory stimulation (red), and their overlap (yellow), displayed over high-resolution anatomicalslices and 3D rendered brain, revealing the location of the hand sensory and motor areas along the central convexity for two normal subjects.Fig. 3. Functional activation of the sensory and motor areas of an epilepsy patient. The primary cluster of activation was anterior to the “knob” of the central sulcus.
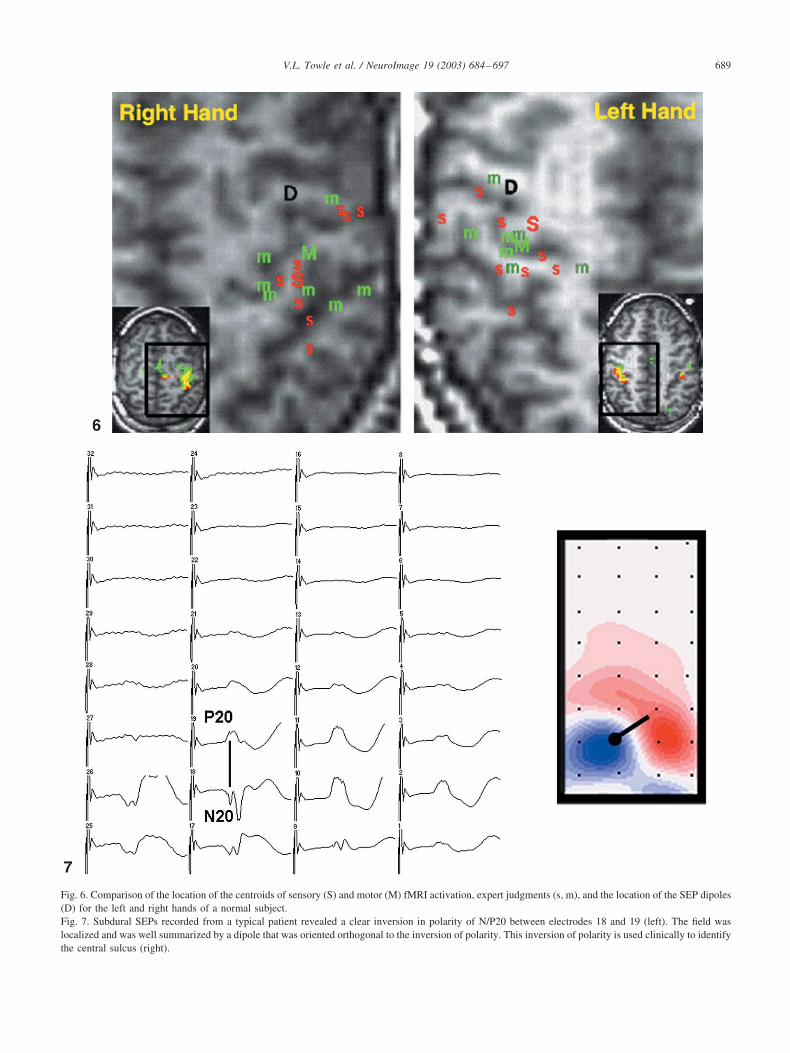
Fig. 6. Comparison of the location of the centroids of sensory (S) and motor (M) fMRI activation, expert judgments (s, m), and the location of the SEP dipoles(D) for the left and right hands of a normal subject.Fig. 7. Subdural SEPs recorded from a typical patient revealed a clear inversion in polarity of N/P20 between electrodes 18 and 19 (left). The field waslocalized and was well summarized by a dipole that was oriented orthogonal to the inversion of polarity. This inversion of polarity is used clinically to identifythe central sulcus (right).
689V.L. Towle et al. / NeuroImage 19 (2003) 684–697
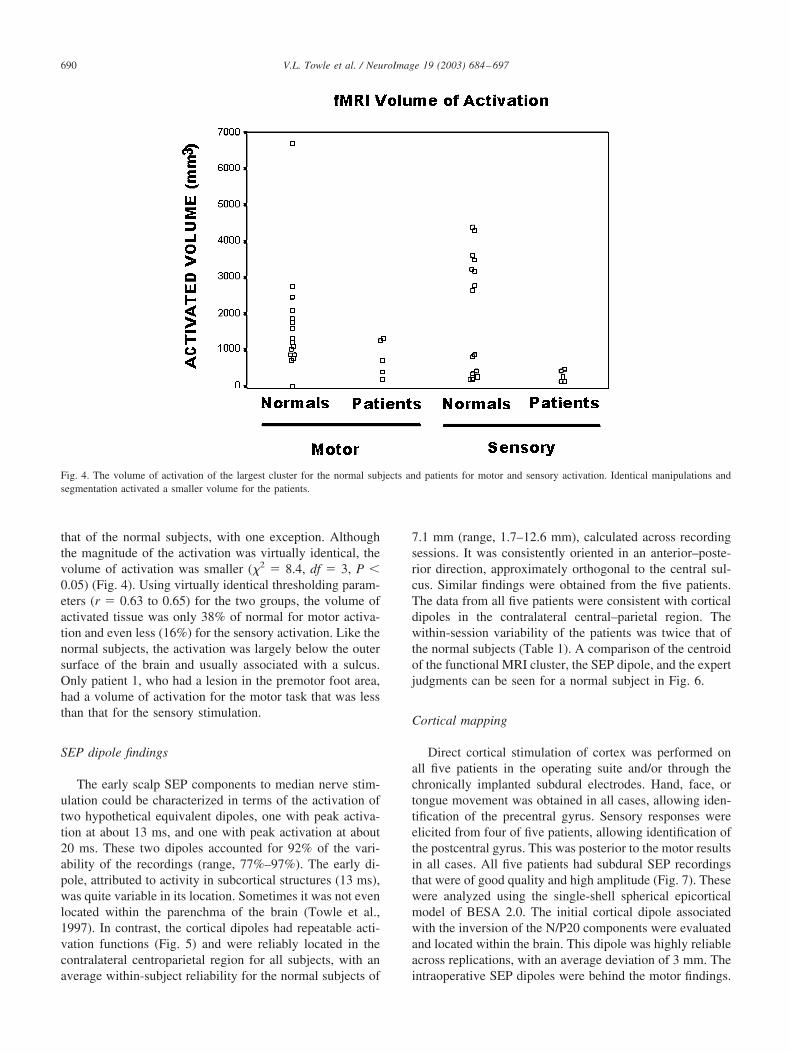
that of the normal subjects, with one exception. Althoughthe magnitude of the activation was virtually identical, thevolume of activation was smaller (�2 � 8.4, df � 3, P �0.05) (Fig. 4). Using virtually identical thresholding param-eters (r � 0.63 to 0.65) for the two groups, the volume ofactivated tissue was only 38% of normal for motor activa-tion and even less (16%) for the sensory activation. Like thenormal subjects, the activation was largely below the outersurface of the brain and usually associated with a sulcus.Only patient 1, who had a lesion in the premotor foot area,had a volume of activation for the motor task that was lessthan that for the sensory stimulation.
SEP dipole findings
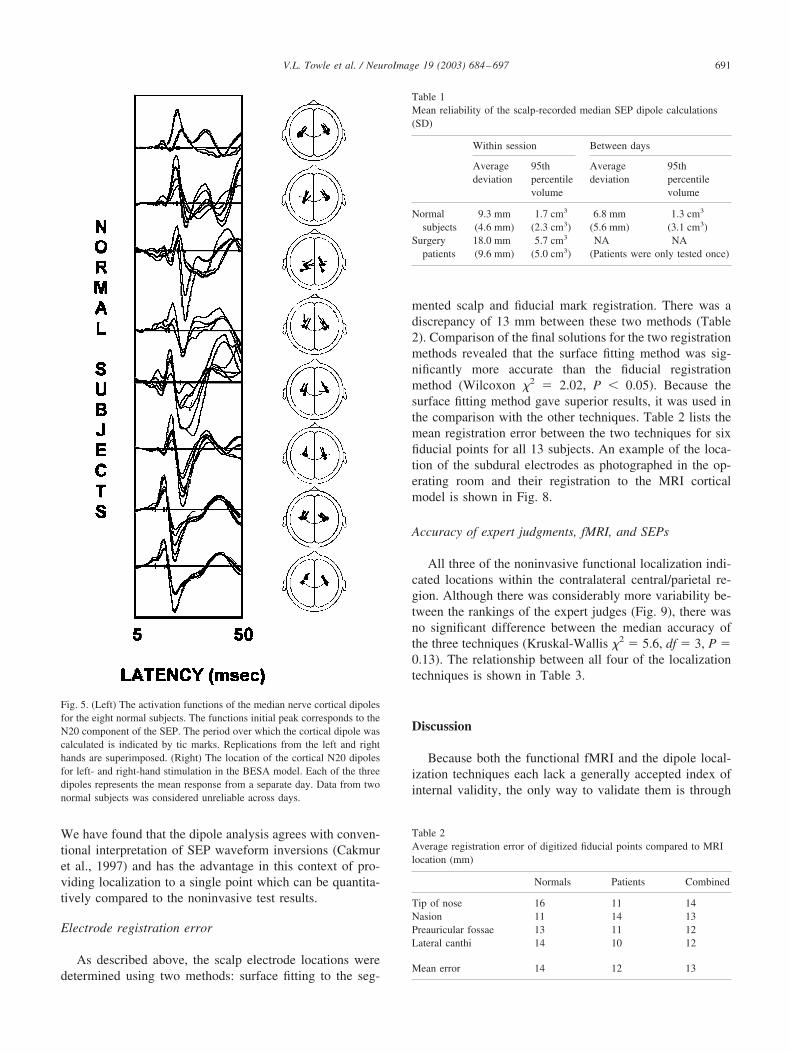
The early scalp SEP components to median nerve stim-ulation could be characterized in terms of the activation oftwo hypothetical equivalent dipoles, one with peak activa-tion at about 13 ms, and one with peak activation at about20 ms. These two dipoles accounted for 92% of the vari-ability of the recordings (range, 77%–97%). The early di-pole, attributed to activity in subcortical structures (13 ms),was quite variable in its location. Sometimes it was not evenlocated within the parenchma of the brain (Towle et al.,1997). In contrast, the cortical dipoles had repeatable acti-vation functions (Fig. 5) and were reliably located in thecontralateral centroparietal region for all subjects, with anaverage within-subject reliability for the normal subjects of
7.1 mm (range, 1.7–12.6 mm), calculated across recordingsessions. It was consistently oriented in an anterior–poste-rior direction, approximately orthogonal to the central sul-cus. Similar findings were obtained from the five patients.The data from all five patients were consistent with corticaldipoles in the contralateral central–parietal region. Thewithin-session variability of the patients was twice that ofthe normal subjects (Table 1). A comparison of the centroidof the functional MRI cluster, the SEP dipole, and the expertjudgments can be seen for a normal subject in Fig. 6.
Cortical mapping
Direct cortical stimulation of cortex was performed onall five patients in the operating suite and/or through thechronically implanted subdural electrodes. Hand, face, ortongue movement was obtained in all cases, allowing iden-tification of the precentral gyrus. Sensory responses wereelicited from four of five patients, allowing identification ofthe postcentral gyrus. This was posterior to the motor resultsin all cases. All five patients had subdural SEP recordingsthat were of good quality and high amplitude (Fig. 7). Thesewere analyzed using the single-shell spherical epicorticalmodel of BESA 2.0. The initial cortical dipole associatedwith the inversion of the N/P20 components were evaluatedand located within the brain. This dipole was highly reliableacross replications, with an average deviation of 3 mm. Theintraoperative SEP dipoles were behind the motor findings.
Fig. 4. The volume of activation of the largest cluster for the normal subjects and patients for motor and sensory activation. Identical manipulations andsegmentation activated a smaller volume for the patients.
690 V.L. Towle et al. / NeuroImage 19 (2003) 684–697
We have found that the dipole analysis agrees with conven-tional interpretation of SEP waveform inversions (Cakmuret al., 1997) and has the advantage in this context of pro-viding localization to a single point which can be quantita-tively compared to the noninvasive test results.
Electrode registration error
As described above, the scalp electrode locations weredetermined using two methods: surface fitting to the seg-
mented scalp and fiducial mark registration. There was adiscrepancy of 13 mm between these two methods (Table2). Comparison of the final solutions for the two registrationmethods revealed that the surface fitting method was sig-nificantly more accurate than the fiducial registrationmethod (Wilcoxon �2 � 2.02, P � 0.05). Because thesurface fitting method gave superior results, it was used inthe comparison with the other techniques. Table 2 lists themean registration error between the two techniques for sixfiducial points for all 13 subjects. An example of the loca-tion of the subdural electrodes as photographed in the op-erating room and their registration to the MRI corticalmodel is shown in Fig. 8.
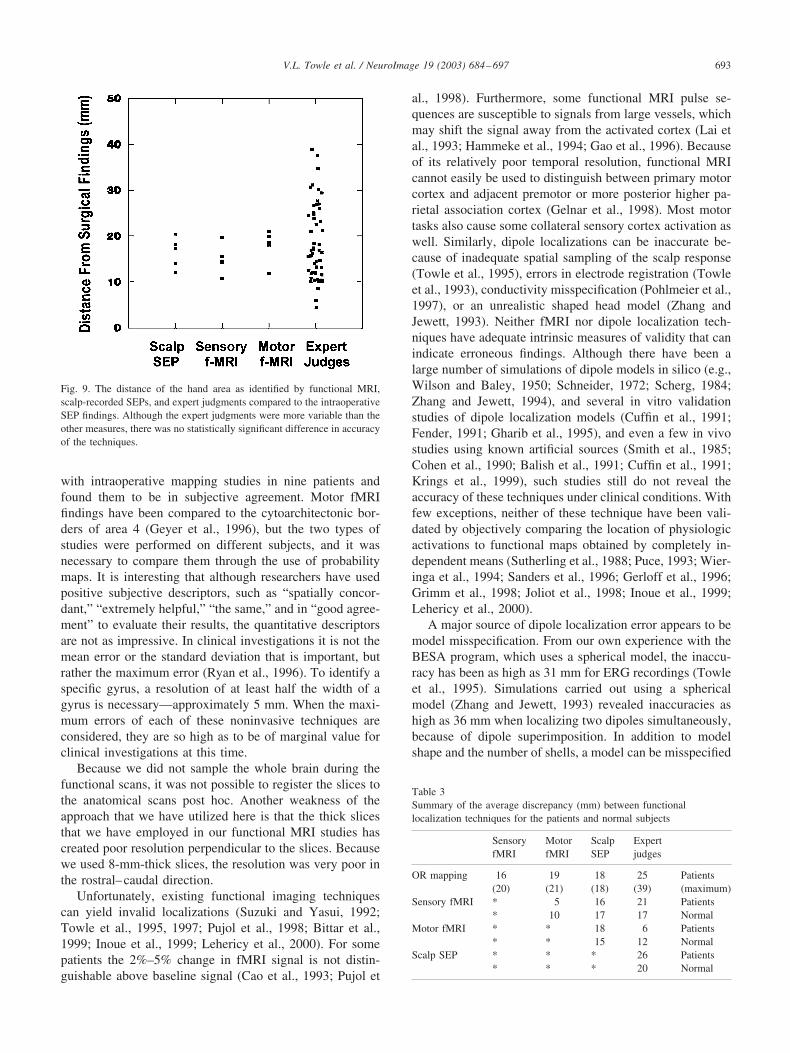
Accuracy of expert judgments, fMRI, and SEPs
All three of the noninvasive functional localization indi-cated locations within the contralateral central/parietal re-gion. Although there was considerably more variability be-tween the rankings of the expert judges (Fig. 9), there wasno significant difference between the median accuracy ofthe three techniques (Kruskal-Wallis �2 � 5.6, df � 3, P �0.13). The relationship between all four of the localizationtechniques is shown in Table 3.
Discussion
Because both the functional fMRI and the dipole local-ization techniques each lack a generally accepted index ofinternal validity, the only way to validate them is through
Fig. 5. (Left) The activation functions of the median nerve cortical dipolesfor the eight normal subjects. The functions initial peak corresponds to theN20 component of the SEP. The period over which the cortical dipole wascalculated is indicated by tic marks. Replications from the left and righthands are superimposed. (Right) The location of the cortical N20 dipolesfor left- and right-hand stimulation in the BESA model. Each of the threedipoles represents the mean response from a separate day. Data from twonormal subjects was considered unreliable across days.
Table 1Mean reliability of the scalp-recorded median SEP dipole calculations(SD)
Within session Between days
Averagedeviation
95thpercentilevolume
Averagedeviation
95thpercentilevolume
Normalsubjects
9.3 mm 1.7 cm3 6.8 mm 1.3 cm3
(4.6 mm) (2.3 cm3) (5.6 mm) (3.1 cm3)Surgery 18.0 mm 5.7 cm3 NA NA
patients (9.6 mm) (5.0 cm3) (Patients were only tested once)
Table 2Average registration error of digitized fiducial points compared to MRIlocation (mm)
Normals Patients Combined
Tip of nose 16 11 14Nasion 11 14 13Preauricular fossae 13 11 12Lateral canthi 14 10 12
Mean error 14 12 13
691V.L. Towle et al. / NeuroImage 19 (2003) 684–697
direct comparison with a procedure that is widely acceptedfor identification of the central sulcus. By comparing thefindings with direct cortical stimulation and direct corticalrecordings, we found that these two noninvasive functionallocalization techniques were not significantly different intheir ability to locate the cortical hand areas, but wereslightly better than expert judgments.
Our findings of a mean dipole localization error of 16–18mm is consistent with other laboratories, which have re-ported mean errors of 17.3 mm (Walter et al., 1992), 19.7mm (Roth et al., 1993), and 18.6 mm (Gerloff et al., 1996).One investigation that is similar to ours found a smaller
discrepancy (8.5 mm), but the formal quantitative compar-ison was only based on two patients Kristeva-Feige et al.,1997). Evoked potential dipole findings have been subjec-tively compared to intraoperative mapping studies by Jacket al., (1994). fMRI localizations have also been comparedto intraoperative findings in the same patients (Cao et al.,1993; Puce et al., 1995; Yousry et al., 1995), but the cor-respondence has not been reported quantitatively. One ex-ception is a study by Kurth et al. (2001), which reported amean discrepancy of 8.9 mm. fMRI findings have beencompared to gyral morphology by Yousry et al. (1995).Berger et al. (1990) have compared CT gyral morphology
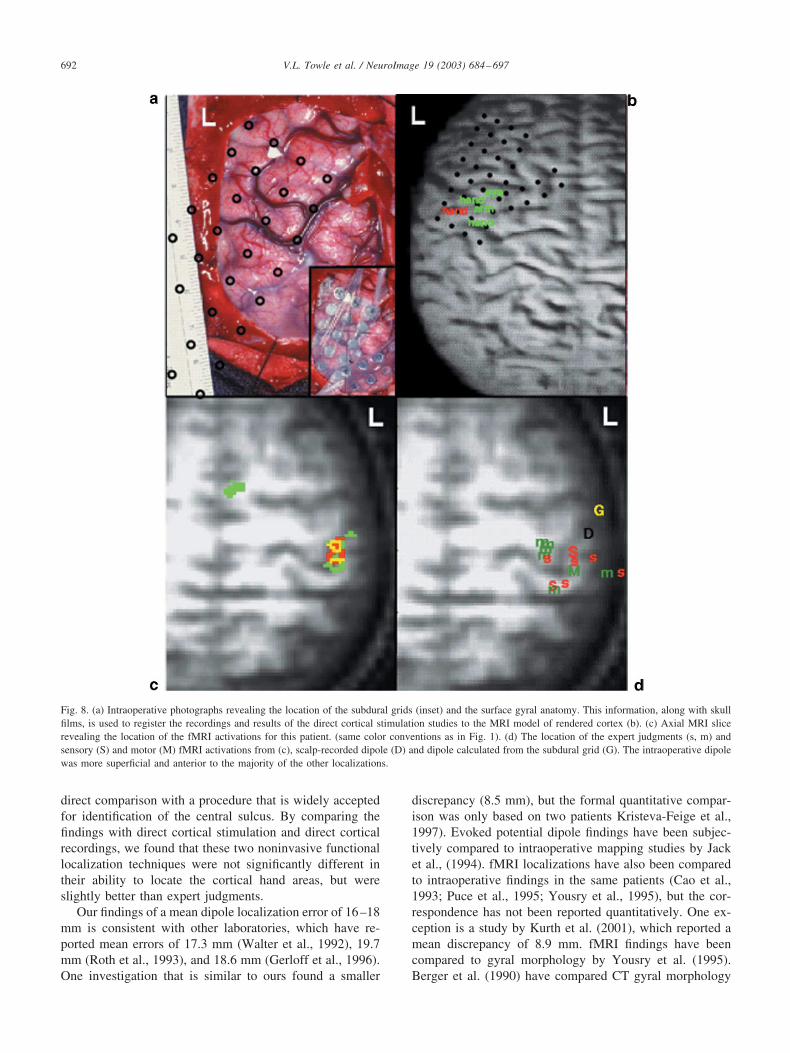
Fig. 8. (a) Intraoperative photographs revealing the location of the subdural grids (inset) and the surface gyral anatomy. This information, along with skullfilms, is used to register the recordings and results of the direct cortical stimulation studies to the MRI model of rendered cortex (b). (c) Axial MRI slicerevealing the location of the fMRI activations for this patient. (same color conventions as in Fig. 1). (d) The location of the expert judgments (s, m) andsensory (S) and motor (M) fMRI activations from (c), scalp-recorded dipole (D) and dipole calculated from the subdural grid (G). The intraoperative dipolewas more superficial and anterior to the majority of the other localizations.
692 V.L. Towle et al. / NeuroImage 19 (2003) 684–697
with intraoperative mapping studies in nine patients andfound them to be in subjective agreement. Motor fMRIfindings have been compared to the cytoarchitectonic bor-ders of area 4 (Geyer et al., 1996), but the two types ofstudies were performed on different subjects, and it wasnecessary to compare them through the use of probabilitymaps. It is interesting that although researchers have usedpositive subjective descriptors, such as “spatially concor-dant,” “extremely helpful,” “the same,” and in “good agree-ment” to evaluate their results, the quantitative descriptorsare not as impressive. In clinical investigations it is not themean error or the standard deviation that is important, butrather the maximum error (Ryan et al., 1996). To identify aspecific gyrus, a resolution of at least half the width of agyrus is necessary—approximately 5 mm. When the maxi-mum errors of each of these noninvasive techniques areconsidered, they are so high as to be of marginal value forclinical investigations at this time.
Because we did not sample the whole brain during thefunctional scans, it was not possible to register the slices tothe anatomical scans post hoc. Another weakness of theapproach that we have utilized here is that the thick slicesthat we have employed in our functional MRI studies hascreated poor resolution perpendicular to the slices. Becausewe used 8-mm-thick slices, the resolution was very poor inthe rostral–caudal direction.
Unfortunately, existing functional imaging techniquescan yield invalid localizations (Suzuki and Yasui, 1992;Towle et al., 1995, 1997; Pujol et al., 1998; Bittar et al.,1999; Inoue et al., 1999; Lehericy et al., 2000). For somepatients the 2%–5% change in fMRI signal is not distin-guishable above baseline signal (Cao et al., 1993; Pujol et
al., 1998). Furthermore, some functional MRI pulse se-quences are susceptible to signals from large vessels, whichmay shift the signal away from the activated cortex (Lai etal., 1993; Hammeke et al., 1994; Gao et al., 1996). Becauseof its relatively poor temporal resolution, functional MRIcannot easily be used to distinguish between primary motorcortex and adjacent premotor or more posterior higher pa-rietal association cortex (Gelnar et al., 1998). Most motortasks also cause some collateral sensory cortex activation aswell. Similarly, dipole localizations can be inaccurate be-cause of inadequate spatial sampling of the scalp response(Towle et al., 1995), errors in electrode registration (Towleet al., 1993), conductivity misspecification (Pohlmeier et al.,1997), or an unrealistic shaped head model (Zhang andJewett, 1993). Neither fMRI nor dipole localization tech-niques have adequate intrinsic measures of validity that canindicate erroneous findings. Although there have been alarge number of simulations of dipole models in silico (e.g.,Wilson and Baley, 1950; Schneider, 1972; Scherg, 1984;Zhang and Jewett, 1994), and several in vitro validationstudies of dipole localization models (Cuffin et al., 1991;Fender, 1991; Gharib et al., 1995), and even a few in vivostudies using known artificial sources (Smith et al., 1985;Cohen et al., 1990; Balish et al., 1991; Cuffin et al., 1991;Krings et al., 1999), such studies still do not reveal theaccuracy of these techniques under clinical conditions. Withfew exceptions, neither of these technique have been vali-dated by objectively comparing the location of physiologicactivations to functional maps obtained by completely in-dependent means (Sutherling et al., 1988; Puce, 1993; Wier-inga et al., 1994; Sanders et al., 1996; Gerloff et al., 1996;Grimm et al., 1998; Joliot et al., 1998; Inoue et al., 1999;Lehericy et al., 2000).
A major source of dipole localization error appears to bemodel misspecification. From our own experience with theBESA program, which uses a spherical model, the inaccu-racy has been as high as 31 mm for ERG recordings (Towleet al., 1995). Simulations carried out using a sphericalmodel (Zhang and Jewett, 1993) revealed inaccuracies ashigh as 36 mm when localizing two dipoles simultaneously,because of dipole superimposition. In addition to modelshape and the number of shells, a model can be misspecified
Table 3Summary of the average discrepancy (mm) between functionallocalization techniques for the patients and normal subjects
SensoryfMRI
MotorfMRI
ScalpSEP
Expertjudges
OR mapping 16 19 18 25 Patients(20) (21) (18) (39) (maximum)
Sensory fMRI * 5 16 21 Patients* 10 17 17 Normal
Motor fMRI * * 18 6 Patients* * 15 12 Normal
Scalp SEP * * * 26 Patients* * * 20 Normal
Fig. 9. The distance of the hand area as identified by functional MRI,scalp-recorded SEPs, and expert judgments compared to the intraoperativeSEP findings. Although the expert judgments were more variable than theother measures, there was no statistically significant difference in accuracyof the techniques.
693V.L. Towle et al. / NeuroImage 19 (2003) 684–697
because of inaccurate estimates of shell conductivity (Law,1993) or shell thickness, leading to localization error (Zhanget al., 1994). Although identification of the SEP reversalpoint is easily determined by visual inspection of the surfacedistribution of the response in the operating room, it hasbeen suggested that if the central sulcus is not perpendicularto the cortical surface, inaccurate conclusions can be drawn.One way to avoid this problem is to analyze the subduralwaveforms with dipole source localization techniques, aswe have done here. This has been shown to be in agreementwith direct cortical stimulation results (Baumgartner et al.,1991; Cakmur et al., 1997).
Our dipole analyses of these cortical recordings havebeen generally consistent with reports that have suggestedthat there is a tangential dipolar source associated withN/P20 and a radial dipolar source associated with P25(Allison, 1982; Allison et al., 1989; Goldring and Gregorie,1984; Wood et al., 1988; Franssen et al., 1992). Our findingsare similar to those of Baumgartner et al. (1991), in that wefound that BESA analysis of 20 neurosurgery cases indi-cated that although it is accurate to characterize N20 as atangential dipole, the P25 dipole deviates from a true radialdipole by about 47° on average, and cannot be reliablylocalized (Cakmur et al., 1997).
A second source of error in dipole localization studies iselectrode registration error. Electrode registration error hasrarely been explicitly quantified in dipole localization stud-ies (Grzeszczuk et al., 1992). The common practice in EEGand MEG dipole localization studies of registering only thenasion and preauricular fossae appears to be a major un-quantified source of error, especially in posterior regions.Although electrode location can be determined on CT im-ages, ethical considerations precluded our submitting thesubjects to the relatively high radiation levels of CT forresearch purposes, compared to regular skull films. Thattechnique still requires fitting the CT image to the MRimage, contributing to location error. In addition to thesmall number of patients tested, the greatest limitation ofthis study is our confidence in the location of the intracranialgrids. Unlike the scalp electrodes, where the validity ofextra fiducial marks could be ascertained, we were unable todevise an independent quantitative estimate of grid regis-tration error. When the precision of each step in the regis-tration process is known, more confidence in electrophysi-ologic studies of source localization will become manifest.Another limitation is that we were only able to record from32 scalp channels, which may have decreased the accuracyof the scalp dipole localizations. The field would benefitfrom a systematic study of the relationship between thenumber of channels recorded and dipole stability/accuracy.
It has been suggested that improved accuracy can resultfrom combining different techniques into a single analy-sis—the so called “priors” strategy (Ahlfors et al., 1999;Ossenblok et al., 1996). For example, dipole solutions couldbe constrained to be within two activated functional MRIvolumes to see which gave the lowest residual variance.
However, when dipoles are constrained to a nonoptimallocation, a dipole model that has been designed to minimizetotal residual variance might do so by altering the orienta-tion, magnitude, or location to an incorrect value (Zhangand Jewett, 1993, 1994). Because such interactions are notwell understood, it would appear that a more cautious ap-proach would be to allow each technique to determine itsunrestrained solution and then compare the different solu-tions based on their merits.
Improvements in electrophysiologic modeling owing tomore accurate electrode registration, owing to replacingspherical models with more anatomically realistic models(He et al., 2002), and by obtaining solutions based onextended sources, rather than on strict dipole assumptions,may improve the accuracy of electrophysiologic solutions.Advanced techniques for identifying sources of noise arenow available, which may be useful for locating deepersources, like the N13/N18 components (Scherg and Berg,1996). The field still lacks well-accepted estimates of shellconductivity and corrections for anisotropies. FunctionalMRI offers the promise of more accurate results from in-creased field strength and the development of improvedpulse sequences. The dramatic improvement in acquisitionspeed due to echo planar imaging has already increased thetemporal resolution of fMRI beyond the time course ofcerebral functional haemodynamics. Both techniques wouldbenefit from the development of quantitative and objectivemeasures of internal validity. Although much work is stillneeded, it appears inevitable that just as in the field ofcomputer chess playing algorithms, noninvasive functionallocalization techniques will surpass the accuracy of expertjudgments and become routine clinical tests.
Acknowledgments
This project was supported in part by NIH GrantNS3001A2 and a grant from the Brain Research Founda-tion. We also acknowledge the expertise and help of EricBerkson, Olga Frankfurt, and Sudha Kailas. Portions ofthese data were presented at the meetings of the AmericanSociety of Neurophysiologic Monitoring and the IEEE En-gineering in Medicine and Biology Society. A differentanalysis of the patient data appears in He et al. (2002).
References
Ahlfors, S.P., Simpson, G.V., Dale, A.M., Belliveau, J.W., Liu, A.K.,Jorvenoja, A., Virtanen, J., Huotilainen, M., Tootell, R.B.H., Aronen,H.J., Ilmoniemi, R.J., 1999. Spatiotemporal activity of a cortical net-work for processing visual motion revealed by MEG and fMRI. J. Neu-rophysiol. 82, 2545–2555.
Allison, T., 1982. Scalp and cortical recordings of initial somatosensorycortex activity to median nerve stimulation in man. Ann. N.Y. Acad.Sci. 112, 671–677.
Allison, T., McCarthy, G., Wood, C.C., Darcey, T.M., Spencer, D.D.,Williamson, P.D., 1989. Human cortical potentials evoked by stimula-
694 V.L. Towle et al. / NeuroImage 19 (2003) 684–697
tion of the median nerve. I. Cytoarchitectonic areas generating short-latency activity. J. Neurophysiol. 62, 694–710.
Balish, M., Sato, S., Connaughton, P., Kufta, C., 1991. Localization ofimplanted dipoles by magnetoencephalography. Neurology 41, 1072–1076.
Baumgartner, C., Barth, D.S., Levesque, M.F., Sutherling, W.W., 1991.Functional anatomy of human hand sensorimotor cortex from spatio-temporal analysis of electrocorticography. Electroencephalogr. Clin.Neurophysiol. 78, 56–65.
Berger, M.S., Cohen, W.A., Ojemann, G.A., 1990. Correlation of motorcortex brain mapping data with magnetic resonance imaging. J. Neu-rosurg. 72, 383–387.
Berger, M.S., Kincaid, J., Ojemann, G.A., Lettich, E., 1989. Brain mappingtechniques to maximize resection, safety, and seizure control in chil-dren with brain tumors. Neurosurgery 25, 786–792.
Berger, M.S., Rostomily, R.C., 1997. Low grade gliomas: functional map-ping resection strategies, extent of resection, and outcome. J. Neuro-Oncol. 34, 85–101.
Bittar, R.G., Olivier, A., Sadikot, A.F., Andermann, F., Comeau, R.M.,Cyr, M., Peters, T.M., Reutens, D.C., 1999. Localization of somato-sensory function by using positron emission tomography scanning: acomparison with intraoperative cortical stimulation. J. Neurosurg. 90,478–483.
Buchner, H., Adams, L., Knepper, A., Ruger, R., Laborde, G., Gilsbach,J.M., Ludwig, I., Reul, J., Scherg, M., 1994. Preoperative localizationof the central sulcus by dipole source analysis of early somatosensoryevoked potentials and three-dimensional magnetic resonance imaging.J. Neurosurg. 80, 849–856.
Buchner, H., Adams, L., Muller, A., Ludwig, I., Knepper, A., Thron, A.,Nieman, K., Scherg, M., 1995. Somatotopy of human hand somato-sensory cortex revealed by dipole source analysis of early somatosen-sory evoked potentials. Electroencephalogr. Clin. Neurophysiol. 96,121–134.
Burchiel, K.J., Clarke, H., Ojemann, G.A., Dacey, R.G., Winn, H.R., 1989.Use of stimulation mapping and corticography in the excision ofarteriovenous malformations in sensorimotor and language-related neo-cortex. Neurosurgery 24, 322–327.
Cakmur, R., Towle, V.L., Mullan, J.F., Suarez, D., Spire, J.P., 1997.Intra-operative localization of sensorimotor cortex by cortical somato-sensory evoked potentials: from analysis of waveforms to dipole sourcemodeling. Acta Neurochir. (Wien) 139, 1117–1124.
Cao, Y., D’Olhaberriague, L., Vidingstad, E.M., Levine, S.R., Welch,K.M.A., 1998. Pilot study of functional MRI to assess cerebral activa-tion of motor function after poststroke hemiparesis. Stroke 29, 112–122.
Cao, Y., Towle, V.L., Levin, D.N., Balter, J.M., 1993. Functional mappingof human motor cortical activation with conventional MR imaging at1.5 T. J. Mag. Reson. Imag. 3, 869–875.
Chollet, F., DiPiero, V., Wise, R.J.S., Brooks, D.J., Dolan, R.J., Frackow-iak, R.S.J., 1991. The functional anatomy of motor recovery afterstroke in humans: A study with positron emission tomography. Ann.Neurol. 29, 63–71.
Chu, D., Huttenlocher, P.R., Levin, D.N., Towle, V.L., 2000. Reorganiza-tion of the hand somatosensory cortex following perinatal unilateralbrain injury. Neuropediatrics 31, 63–69.
Cohen, D., Cuffin, B.N., Yunokuchi, K., et al., 1990. MEG versus EEGlocalization test using implanted sources in the human brain. Ann.Neurol. 28, 811–817.
Cox, R.W., 1996. AFNI: software for analysis and visualization of func-tional magnetic resonance neuroimages. Comp. Biomed. Res. 29, 162–173.
Cuffin, B.N., Cohen, D., Yunokuchi, K., Maniewski, R., Purcell, C.,Cosgrove, G.R., Ives, J., Kennedy, J., Schomer, D., 1991. Tests of EEGlocalization accuracy using implanted sources in the human brain. Ann.Neurol. 29, 132–138.
Desmedt, J.E., Chalklin, V., Tomberg, C., 1990. Emulation of somatosen-sory evoked potential (SEP) components with the 3-shell head model
and the problem of “ghost potential fields” when using an averagereference in brain mapping. Electroencephalogr. Clin. Neurophysiol.77, 243–258.
Fender, D.H., 1991. Models of the human brain and the surrounding media:their influence on the reliability of source localization. J. Clin. Neuro-physiol. 8, 381–390.
Fox, P.T., Burton, H., Raichle, M.E., 1987. Mapping human somatosen-sory cortex with positron emission tomography. J. Neurosurg. 67,34–43.
Franssen, H., Stegeman, D.F., Moleman, J., Schoobaar, R.P., 1992. Dipolemodeling of median nerve SEPs in normal subjects and patients withsmall subcortical infarcts. Electroencephalogr. Clin. Neurophysiol. 84,401–417.
Gallen, C.C., Sobel, D.F., Waltz, T., Aung, M., Copeland, B., Schwartz,B.J., Hirschkoff, E.C., Bloom, F.E., 1993. Noninvasive presurgicalneuromagnetic mapping of somatosensory cortex. Neurosurgery 33,260–268.
Gao, J.H., Miller, I., Lai, S., Xiong, J., Fox, P.T., 1996. Quantitativeassessment of blood inflow effects in functional MRI signals. Magn.Reson. Med. 36, 314–319.
Gelnar, P.A., Krauss, B.R., Szeverenyi, N.M., Apkarian, A.V., 1998. Fin-gertip representation in the human somatosensory cortex: an fMRIstudy. NeuroImage 7, 261–283.
Gerloff, C., Grodd, W., Altenmuller, E., Kolb, R., Naegele, T., Klose, U.,Voigt, K., Dichgans, J., 1996. Coregistration of EEG and fMRI in asimple motor task. Hum. Brain Map. 4, 199–209.
Geyer, S., Ledberg, A., Schleicher, A., Kinomura, S., Schormann, T.,Burgel, U., Klingberg, T., Larsson, J., Zilles, K., Roland, P.E., 1996.Two different areas within the primary motor cortex of man. Nature382, 805–807.
Geyer, S., Schormann, T., Mohlberg, H., Zilles, K., 2000. Areas 3a, 3b, and1 of human primary somatosensory cortex. 2. Spatial normalization tostandard anatomical space. NeuroImage 11, 684–696.
Gharib, S., Sutherling, W.W., Nakasato, N., Barth, D.S., Baumgartner, C.,Alexopoulos, N., Taylor, S., Rogers, R.L., 1995. MEG and ECoGlocalization accuracy test. Electroencephalogr. Clin. Neurophysiol. 94,109–114.
Goldring, S., Gregorie, E.M., 1984. Surgical management of epilepsy usingepidural recordings to localize the seizure focus. J. Neurosurg. 60,457–466.
Grimm, C., Schreiber, A., Kristeva-Feige, R., Mergner, T., Hennig, J.,Lucking, C.H., 1998. A comparison between electric source localiza-tion and fMRI during somatosensory stimulation. Electroencephalogr.Clin. Neurophysiol. 106, 22–29.
Grzeszczuk, R., Tan, K.K., Levin, D.N., Pelizzari, C.A., Hu, X., Chen,G.T.Y., Beck, R.N., Chen, C-T., Cooper, M., Milton, J., Spire, J-P.,Towle, V.L., Dohrmann, G.J., Erickson, R.K., 1992. Retrospectivefusion of radiographic and MR data for localization of subdural elec-trodes. J. Comp. Assist. Tomogr. 16, 764–773.
Hammeke, T.A., Yetkin, F.Z., Mueller, W.M., Morris, G.L., Haughton,V.M., Rao, S.M., Binder, J.R., 1994. Functional magnetic resonanceimaging of somatosensory stimulation. Neurosurgery 35, 677–681.
Hari, R., Reinikainen, K., Kaukoranta, E., Hamalainen, M., Ilmoniemi, R.,Penttinen, A., Saluonen, J., Teszner, D., 1984. Somatosensory evokedcerebral magnetic fields from SI and SII in man. Electroencephalogr.Clin. Neurophysiol. 57, 254–263.
Henderson, C.J., Butler, S.R., Glass, A., 1975. The localization of equiv-alent dipoles of EEG sources by the application of electrical fieldtheory. Electroencephalogr. Clin. Neurophysiol. 39, 117–130.
He, B., Zhang, X., Wu, D., Wang, Y., Sasaki, H., Lian, J., Towle, V.L.,2002. Boundary element method-based cortical potential imaging ofsomatosensory evoked potentials using subjects’ magnetic resonanceimages. NeuroImage 16, 564–576.
Hirsch, J., Ruge, M.I., Kim, K.H.S., Correa, D.D., Victor, J.D., Relkin,N.R., Labar, D.R., Krol, G., Bilsky, M.H., Souweidane, M.M., DeAn-gelis, L.M., Gutin, P.H., 2000. An integrated functional magneticresonance imaging procedure for preoperative mapping of cortical
695V.L. Towle et al. / NeuroImage 19 (2003) 684–697
areas associated with tactile, motor, language, and visual functions.Neurosurgery 47, 711–722.
Inoue, T., Shimizu, H., Nakasato, N., Kumabe, T., Yoshimoto, T., 1999.Accuracy and limitation of functional magnetic resonance imaging foridentification of the central sulcus: comparison with magnetoencepha-lography in patients with brain tumors. NeuroImage 10, 738–748.
Iwasaki, S., Nakagawa, H., Fukusumi, A., Kichikawa, K., Kitamura, K.,Otsugi, H., Uchida, H., Ohishi, H., Yaguchi, K., Sumie, H., Kuru, Y.,1991. Identification of pre- and postcentral gyri on CT and MR imageson the basis of the medullary pattern of cerebral white matter. Radiol-ogy 179, 207–213.
Jack Jr., C.R., Thompson, R.M., Butts, R.K., Sharbrough, F.W., Kelly, P.J.,Hanson, D.P., Eiederer, S.J., Ehman, R.L., Hangiandreou, N.J., Cas-cino, G.D., 1994. Sensory motor cortex: correlation of presurgicalmapping with functional MR imaging and invasive cortical mapping.Radiology 190, 85–92.
Jenkins, W.M., Merzenich, M.M., 1987. Reorganization of neocorticalrepresentations after brain injury: a neurophysiological model of thebases of recovery from stroke. Prog. Brain Res. 71, 249–266.
Joliot, M., Crivello, F., Badier, J.M., Diallo, B., Tzourio, N., Mazoyer, B.,1998. Anatomical congruence of metabolic and electromagnetic acti-vation signals during a self-paced motor task: a combined PET-MEGstudy. NeuroImage 7, 337–351.
Kennedy, D.N., Lange, N., Makris, N., Bates, J., Meyer, J., Caviness Jr.,V.S., 1998. Gyri of the human neocortex: an MRI-based analysis ofvolume and variance. Cereb. Cortex 8, 372–384.
Kido, D.K., Lemay, M., Levinson, A.W., Benson, W.E., 1980. Computedtomographic localization of the precentral gyrus. Radiology 135, 373–377.
King, R.B., Schell, G.R., 1987. Cortical localization and monitoring duringcerebral operations. J. Neurosurg. 67, 210–219.
Krings, T., Chiappa, K.H., Cuffin, B.N., Cochius, J.I., Connolly, S., Cos-grove, G.R., 1999. Accuracy of EEG dipole source localization usingimplanted sources in the human brain. Clin. Neurophysiol. 110, 106–114.
Kristeva-Feige, R., Grimm, C., Huppertz, H-J., Otte, M., Schreiber, A.,Jager, D., Feige, B., Buchert, M., Hennig, J., Mergner, T., Lucking,C.H., 1997. Reproducibility and validity of electric source localisationwith high-resolution electroencephalography. Electroencephalogr.Clin. Neurophysiol. 103, 652–660.
Kristeva-Feige, R., Walter, H., Lutkenhoner, B., Hampson, S., Ross, B.,Knorr, U., Steinmetz, H., Cheyne, D., 1994. A neuromagnetic study ofthe functional organization of the sensorimotor cortex. Eur. J. Neurosci.6, 632–639.
Kurth, R., Villringer, K., Kombos, T., Suss, O., Brock, M., Villringer, A.,Wolf, K-J., 2001. Correlation of preoperative fMRI of the primarymotor cortex and intraoperative monopolar electrostimulation duringneuronavigated-surgery of intracerebral tumours. NeuroImage 13,S1208.
Lai, S., Hopkins, A.L., Haacke, E.M., Li, D., Wasserman, B.A., Buckley,P., Friedman, I., Meltzer, H., Hedera, P., Friedland, R., 1993. Identi-fication of vascular structures as a major source of signal contrast inhigh-resolution 2D and 3D functional activation imaging of the motorcortex at 1.5T—preliminary results. Magn. Reson. Med. 30, 387–392.
Law, S.K., 1993. Thickness and resistivity variations over the upper sur-face of the human skull. Brain Topogr. 6, 99–109.
Lehericy, S., Duffau, H., Cornu, P., Capelle, L., Pidoux, B., Carpentier, A.,Auliac, S., Clemenceau, S., Sichez, J-P., Bitar, A., Valery, C-A., vanEffenterre, R., Faillot, T., Srour, A., Fohanno, D., Philippon, J., leBihan, D., Marsaault, C., 2000. Correspondence between functionalmagnetic resonance imaging somatotopy and individual brain anatomyof the central region: comparison with intraoperative stimulation inpatients with brain tumors. J. Neurosurg. 92, 589–598.
Levin, D.N., Hu, X., Tan, K.K., Galhotra, S., 1989. Surface of the brain:three-dimensional MR images created with volume-rendering. Radiol-ogy 171, 277–280.
Lin, W., Kuppusamy, K., Haacke, E.M., Burton, H., 1996. Functional MRIin human somatosensory cortex activated by touching textured sur-faces. J. Magn. Reson. Imag. 6, 565–572.
Metz, C.E., Fencil, L.E., 1989. Determination of three-dimensional struc-ture in biplane radiography without prior knowledge of the relationshipbetween the two views: theory. Med. Phys. 16, 45–51.
Mine, S., Oka, N., Yamaura, A., Nakajima, Y., 1998. Presurgical func-tional localization of primary somatosensory cortex by dipole tracingmethod of scalp-skull-brain head model applied to somatosensoryevoked potential. Electroencephalogr. Clin. Neurophysiol. 108, 226–233.
Mogilner, A., Grossman, J.A.I., Ribary, U., Joliot, M., Volkmann, J.,Rapaport, D., Beasley, R.W., Llinas, R.R., 1993. Somatosensory cor-tical plasticity in adult humans revealed by magnetoencephalography.Proc. Natl. Acad. Sci. USA 90, 3593–3597.
Mosher, J.C., Spencer, M.E., Leahy, R.M., Lewis, P.S., 1993. Error bandsfor EEG and MEG dipole source localization. Electroencephalogr.Clin. Neurophysiol. 86, 303–321.
Naidich, T.P., Valavanis, A.G., Kubik, S., 1995. Anatomic relationshipsalong the low-middle convexity. I. Normal specimens and magneticresonance imaging. Neurosurgery 36, 517–32.
Nakamura, A., Yamada, T., Goto, A., Kato, T., Ito, K., Abe, Y., Kachi, T.,Kakig, R., 1998. Somatosensory homunculus as drawn by MEG. Neu-roImage 7, 377–386.
Nyberg, G., Andersson, J., Antoni, G., et al., 1996. Activation PET scan-ning in pretreatment evaluation of patients with cerebral tumours orvascular lesions in or close to the sensorimotor cortex. Acta Neurochir.138, 684–694.
Oldfield, R.C., 1971. The assessment and analysis of handedness: theEdinburgh inventory. Neuropsychologia 9, 97–113.
Ossenblok, P., Wilts, G., Numminen, J., Peters, M.J., Lopes da Silva, F.H.,1996. Locating the cortical sources of somatosensory evoked responsesby integration of EEG and MEG. Electroencephalogr. Clin. Neuro-physiol. 46 (Suppl.), 183–191.
Pelizzari, C.A., Chen, G.T.Y., Spelbring, D.R., Weichselbaum, R., Chen,C-T., 1989. Accurate three-dimensional registration of CT, PET, and/orMR images of the brain. J. Comp. Assist. Tomogr. 13, 20–26.
Penfield, W., Boldrey, E., 1937. Somatic motor and sensory representationin the cerebral cortex of man as studied by electrical stimulation. Brain60, 389–443.
Pohlmeier, R., Buchner, H., Knoll, G., Rienacker, A., Beckmann, R.,Pesch, J., 1997. Brn. Topogr. 9, 157–164.
Pons, T.P., Garraghty, P.E., Ommaya, A.K., Kaas, J.H., Taub, E., Mishkin,M., 1991. Massive cortical reorganization after sensory deafferentiationin adult macaques. Science 252, 1857–1860.
Puce, A., 1993. Comparative assessment of sensorimotor function usingfunctional magnetic resonance imaging and electrophysiological meth-ods. J. Clin. Neurophysiol. 12, 450–459.
Puce, A., Constable, R.T., Luby, M.L., McCarthy, G., Nobre, A.C., Spen-cer, D.D., Gore, J.C., Allison, T., 1995. Functional magnetic resonanceimaging of sensory and motor cortex: comparison with electrophysio-logical localization. J. Neurosurg. 83, 262–270.
Pujol, J., Conesa, G., Deus, J., Lopez-Obarrio, L., Isamat, F., Capdevila,A., 1998. Clinical application of functional magnetic resonance imag-ing in presurgical identification of the central sulcus. J. Neurosurg. 88,863–869.
Rao, S.M., Binder, J.R., Hammeke, T.A., Bandettini, P.A., Bobholz, J.A.,Frost, J.A., Mykelbust, B.M., Jacobson, R.D., Hyde, J.S., 1995. Soma-totopic mapping of the human primary motor cortex with functionalmagnetic resonance imaging. Neurology 45, 919–924.
Roth, B.J., Balish, M., Gorbach, A., Sato, S., 1993. How well does a3-sphere model predict positions of diples in a realistically shapedhead? Electroencephalogr. Clin. Neurophysiol. 87, 175–184.
Ryan, M.J., Erickson, R.K., Levin, D.N., Pelizzari, C.A., Macdonald, R.L.,Dohrmann, G.J., 1996. Frameless stereotaxy with real-time tracking ofpatient head movement and retrospective patient-image registration.J. Neurosurg. 85, 287–292.
696 V.L. Towle et al. / NeuroImage 19 (2003) 684–697
Sakai, K., Watanabe, E., Onodera, Y., Itagaki, H., Yamamoto, E., Koizumi,H., Miyashita, Y., 1995. Functional mapping of the human somatosen-sory cortex with echo-planar MRI. Magn. Reson. Med. 33, 736–743.
Sanders, J.A., Lewine, J.D., Orrison Jr., W.W., 1996. Comparison ofprimary motor cortex localization using functional magnetic resonanceimaging and magnetoencephalography. Hum. Brain Map. 4, 47–57.
Scherg, M., 1984. Spatio-temporal modeling of early auditory evokedpotentials. Rev. Laryngol. 105, 163–170.
Scherg, M., Berg, P., 1996. New concepts of brain source imaging andlocalization. Electroencephalogr. Clin. Neurophysiol. 46 (Suppl.), 127–137.
Scherg, M., von Cramon, D., 1985. A new interpretation of the generatorsof BAEP waves I–V: results of a spatio-temporal dipole model. Elec-troencephalogr. Clin. Neurophysiol. 62, 290–299.
Schneider, M., 1972. A multistage process for computing virtual dipolarsources of EEG discharges from surface information. IEEE Trans.Biomed. Eng. 19, 1–12.
Smith, D.B., Sidman, R.D., Flanigin, H., Hinke, J., Labines, D., 1985. Areliable method for localizing deep intracranial sources of the EEG.Neurology 35, 1702–1707.
Sobel, D.F., Gallen, C.C., Schwartz, B.J., Waltz, T.A., Copeland, B.,Yamada, S., et al., 1993. Locating the central sulcus: comparison ofMR anatomic and magnetoencephalographic functional methods.Am. J. Neuroradiol. 14, 915–927.
Stapleton, S.R., Kiriakopoulos, E., Mikulis, D., Drake, J.M., Hoffman,H.J., Humphreys, R., Hwang, P., Otsubo, H., Holowka, S., Logan, W.,Rutka, J.T., 1997. Combined utility of functional MRI, cortical map-ping, and frameless stereotaxy in the resection of lesions in eloquentareas of the brain. Pediatr. Neurosurg. 26, 68–82.
Suk, J., Ribary, U., Cappell, J., Yamamoto, T., Llinas, R., 1991. Anatom-ical localization revealed by MEG recordings of the human somato-sensory system. Electroencephalogr. Clin. Neurophysiol. 78, 185–196.
Sutherling, W.W., Crandall, P.H., Darcey, T.M., Becker, D.P., Levesque,M.F., Barth, D.S., 1988. The magnetic and electric fields agree withintracranial localizations of somatosensory cortex. Neurology 38,1705–1714.
Suzuki, A., Yasui, N., 1992. Intraoperative localization of the centralsulcus by cortical somatosensory evoked potentials in brain tumor.J. Neurosurg. 76, 867–870.
Towle, V.L., Bolanos, J., Suarez, D., Tan, K., Grzeszczuk, R., Levin, D.N.,Cakmur, R., Frank, S.A., Spire, J-P., 1993. The spatial location of EEGelectrodes: locating the best-fitting sphere relative to cortical anatomy.Electroencephalogr. Clin. Neurophysiol. 86, 1–6.
Towle, V.L., Cakmur, R., Cao, Y., Brigell, M., Parmeggiani, L., 1995.Locating VEP equivalent dipoles in magnetic resonance images. Int.J. Neurosci. 80, 105–115.
Towle, V.L., Khorasani, L., Berkson, E.M., Syed, I., Pelizzari, C.H.,Jewett, D., Spire, J-P., 1997. Human somatosensory evoked potential
dipoles: how accurate are the localizations? Proc. IEEE-EMBS 19,2616–2621.
Van Essen, D.C., Drury, H.A., Joshi, S., Miller, M.I., 2000. Functional andstructural mapping of human cerebral cortex: solutions are in thesurfaces. Adv. Neurol. 84, 23–34.
Walter, H., Kristeva, R., Knorr, U., Schlaug, G., Huang, Y., Steinmetz, H.,Nebeling, B., Herzog, H., Seitz, R.J., 1992. Individual somatotopy ofprimary sensorimotor cortex revealed by intermodal matching of MEG,PET and MRI. Brain Topogr. 5, 183–187.
White, W.E., Andrews, T.J., Hulette, C., Richards, A., Groelle, M., Pay-darfar, J., Purves, D., 1997. Structure of the human somatosensorysystem. I: morphology and cytoarchitecture of the central sulcus.Cereb. Cortex 7, 18–30.
Wieringa, H., Peters, H., Lopes da Silva, F., 1994. Integration of MEG,EEG, and MRI, in: Thatcher, R.W., Hallet, M., Zeffiro, T., John, E.R.,Huerta, M. (Eds.), Functional Neuroimaging, Academic Press, SanDiego, pp. 279–288.
Wilson, F.N., Baley, R.H., 1950. The electric field of an eccentric dipole ina homogeneous spherical conducting medium. Circulation 1, 84–92.
Wood, C.C., Spencer, D.D., Allison, T., McCarthy, G., Williamson, P.D.,Goff, W.R., 1988. Localization of human sensorimotor cortex duringsurgery by cortical surface recording of somatosensory evoked poten-tials. J. Neurosurg. 68, 99–111.
Woolsey, C.N., Erickson, T.C., Gilson, W.E., 1979. Localization in so-matic sensory and motor areas of human cerebral cortex as determinedby direct recording of evoked potentials and electrical stimulation.J. Neurosurg. 51, 476–506.
Wunderlich, G., Knorr, U., Herzog, H., Kiwit, J.C.W., Fruend, H-J., Seitz,R.J., 1998. Precentral glioma location determines the displacement ofcortical hand representation. Neurosurgery 42, 18–27.
Yang, T.T., Gallen, C.C., Schwartz, B.J., Bloom, F.E., 1993. Noninvasivesomatosensory homunculus mapping in humans by using a large-arraybiomagnetometer. Proc. Natl. Acad. Sci. USA 90, 3098–3102.
Yousry, T.A., Schmid, U.D., Alkadhi, H., Schmidt, D., Peraud, A., Buett-ner, A., Winkler, P., 1997. Localization of the motor hand area to aknob on the precentral gyrus: a new landmark. Brain 120, 141–157.
Yousry, T.A., Schmid, U.D., Jassoy, A.G., Schmidt, D., Eisner, W.E.,Reulen, H.J., Reiser, M.F., Lissner, J., 1995. Topography of the corticalmotor hand area: prospective study with functional MR imaging anddirect motor mapping at surgery. Radiology 195, 23–29.
Zhang, Z., Jewett, D.L., 1993. Insidious errors in dipole localization pa-rameters at a single time-point due to model misspecification of numberof shells. Electroencephalogr. Clin. Neurophysiol. 88, 1–11.
Zhang, Z., Jewett, D.L., 1994. Model misspecification detection by meansof multiple generator errors, using the observed potential map. BrainTopogr. 7, 29–39.
Zhang, Z., Jewett, D.L., Goodwill, G., 1994. Insidious errors in dipoleparameters due to shell model misspecification using multiple time-points. Brain Topogr. 6, 283–298.
697V.L. Towle et al. / NeuroImage 19 (2003) 684–697
Top Related
Copyright © 2022 FDOKUMEN

