


Bahasa
Halaman
Hukum

New ways of measuring intake, efficiency and behaviourof grazing livestock
Paul L. GreenwoodA,B,D, Philip ValenciaC, LeslieOversC, David R. PaullB and IanW. PurvisB
ANSW Department of Primary Industries Beef Industry Centre, University of New England, Armidale,NSW 2351, Australia.
BCSIRO Animal Food and Health Sciences, Armidale, NSW 2350, Australia.CCSIRO Computational Informatics, Pullenvale, Qld 4069, Australia.DCorresponding author. Email: [email protected]
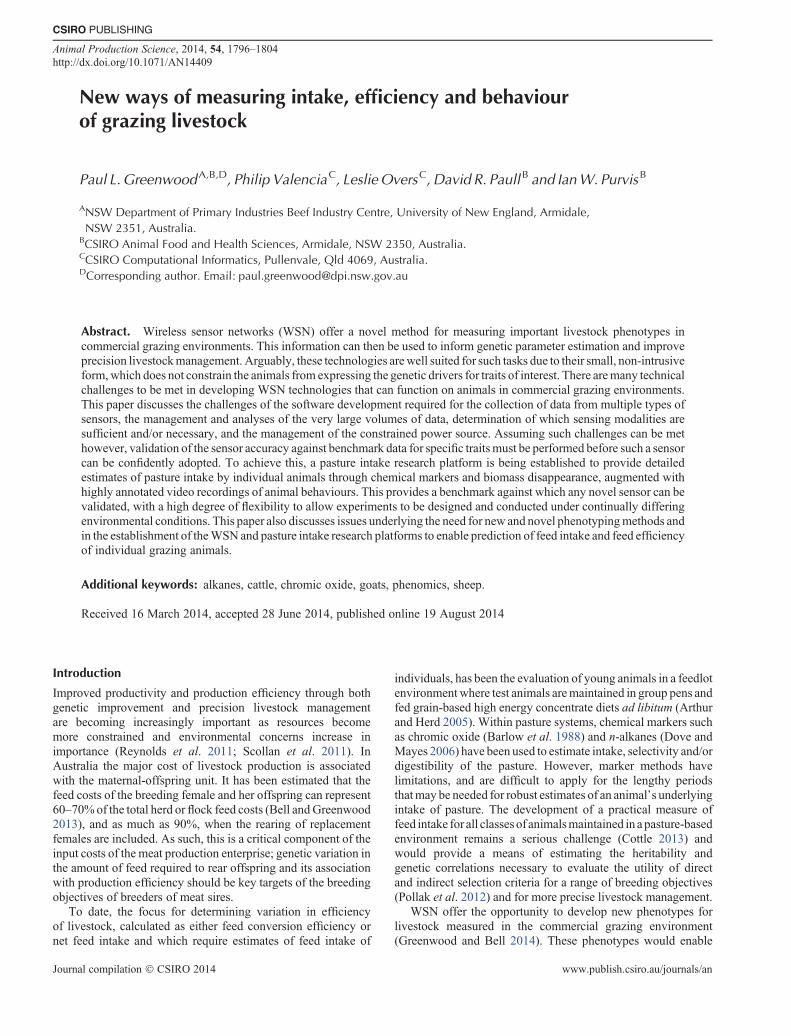
Abstract. Wireless sensor networks (WSN) offer a novel method for measuring important livestock phenotypes incommercial grazing environments. This information can then be used to inform genetic parameter estimation and improveprecision livestockmanagement. Arguably, these technologies arewell suited for such tasks due to their small, non-intrusiveform,which does not constrain the animals from expressing the genetic drivers for traits of interest. There aremany technicalchallenges to be met in developing WSN technologies that can function on animals in commercial grazing environments.This paper discusses the challenges of the software development required for the collection of data from multiple types ofsensors, the management and analyses of the very large volumes of data, determination of which sensing modalities aresufficient and/or necessary, and the management of the constrained power source. Assuming such challenges can be methowever, validation of the sensor accuracy against benchmark data for specific traitsmust be performed before such a sensorcan be confidently adopted. To achieve this, a pasture intake research platform is being established to provide detailedestimates of pasture intake by individual animals through chemical markers and biomass disappearance, augmented withhighly annotated video recordings of animal behaviours. This provides a benchmark against which any novel sensor can bevalidated, with a high degree of flexibility to allow experiments to be designed and conducted under continually differingenvironmental conditions. This paper also discusses issues underlying the need for new and novel phenotypingmethods andin the establishment of theWSNand pasture intake research platforms to enable prediction of feed intake and feed efficiencyof individual grazing animals.
Additional keywords: alkanes, cattle, chromic oxide, goats, phenomics, sheep.
Received 16 March 2014, accepted 28 June 2014, published online 19 August 2014
Introduction
Improved productivity and production efficiency through bothgenetic improvement and precision livestock managementare becoming increasingly important as resources becomemore constrained and environmental concerns increase inimportance (Reynolds et al. 2011; Scollan et al. 2011). InAustralia the major cost of livestock production is associatedwith the maternal-offspring unit. It has been estimated that thefeed costs of the breeding female and her offspring can represent60–70%of the total herd or flock feed costs (Bell andGreenwood2013), and as much as 90%, when the rearing of replacementfemales are included. As such, this is a critical component of theinput costs of the meat production enterprise; genetic variation inthe amount of feed required to rear offspring and its associationwith production efficiency should be key targets of the breedingobjectives of breeders of meat sires.
To date, the focus for determining variation in efficiencyof livestock, calculated as either feed conversion efficiency ornet feed intake and which require estimates of feed intake of
individuals, has been the evaluation of young animals in a feedlotenvironmentwhere test animals aremaintained in group pens andfed grain-based high energy concentrate diets ad libitum (Arthurand Herd 2005). Within pasture systems, chemical markers suchas chromic oxide (Barlow et al. 1988) and n-alkanes (Dove andMayes 2006) have been used to estimate intake, selectivity and/ordigestibility of the pasture. However, marker methods havelimitations, and are difficult to apply for the lengthy periodsthatmay be needed for robust estimates of an animal’s underlyingintake of pasture. The development of a practical measure offeed intake for all classes of animalsmaintained in apasture-basedenvironment remains a serious challenge (Cottle 2013) andwould provide a means of estimating the heritability andgenetic correlations necessary to evaluate the utility of directand indirect selection criteria for a range of breeding objectives(Pollak et al. 2012) and for more precise livestock management.
WSN offer the opportunity to develop new phenotypes forlivestock measured in the commercial grazing environment(Greenwood and Bell 2014). These phenotypes would enable
CSIRO PUBLISHING
Animal Production Science, 2014, 54, 1796–1804http://dx.doi.org/10.1071/AN14409
Journal compilation � CSIRO 2014 www.publish.csiro.au/journals/an
genetic parameter estimation and allow for development ofapplications to improve precision livestock management(Houle et al. 2010; Hocquette et al. 2012; Purvis et al. 2013).Furthermore, these technologies offer the opportunity to recordinformation without constraining animals from expressing thegenetic drivers for traits of interest and offer a broad range ofapplications to develop phenotypes relating to productivity,efficiency, health and welfare (Rushen et al. 2012; Rutter2013; Swain et al. 2013). For example, the development of acatalogue of behaviours of grazing livestock using sensordata would allow for deeper phenotyping of factors thatregulate intake of pasture, and behavioural signaturesassociated with normal behaviour and with aberrant behaviourassociated with compromised welfare status or the onset ofspecific diseases to be established.
In addition to technical issues relating to WSN, successfuldevelopment and application of these technologies requiresgeneration of benchmark data for traits against which todevelop methodologies and prediction algorithms. Specificchallenges in the establishment of these phenotyping methodsalso lie in development of software to enable collection of datafrom multiple types of sensors, the management and analyses ofthe very large volumes of data that are an integral part of thismethodology, and the design and management of the powersource (Kwong et al. 2012).
To achieve the objective of accurate and precise estimation ofintake by individual grazing animals, highly annotated data forspecific behaviours associatedwith intake of pasture such as headlowering, biting or ripping, chewing, drinking, ruminating, lyingand walking, and development of a pasture intake platform toprovide benchmark individual animal intake data is required.Currently available methods allow such a platform to be basedon the use of chemical markers (Barlow et al. 1988) and/orbiomass disappearance (Penning 2004) to estimate individualanimal intake. However, a pasture intake platform also requires ahigh degree of flexibility to allow the design of experimentsconducted under continually differing environmental and pastureconditions.
This paper discusses development of novel phenotypingmethods using WSN, including the establishment andoptimisation of a pasture intake platform for generation ofbenchmark data to allow prediction of feed intake and efficiencyof individual animals on pasture using WSN. Subsequent paperswill report results on the optimisation of our WSN and pastureintake platforms and on the development of predictive algorithmsfor pasture intake.
Concepts in developing new ways of measuring intake,efficiency and behaviour of grazing livestock
Overview of the approach to developing applicationsfor sensing technologies
The development of electronic sensing capability has thepotential to allow the measurement of traits of economicimportance that previously had not been measurable in thecommercial grazing environment. Historically, on-animallogging devices for sensors used for phenotyping were bulky,and often heavy enough to raise concerns that animals may nothave exhibited normal behaviours. However, over recent decades
there have been considerable advances in miniaturisation andreduction of power use in electronic devices, such asmicrocontrollers, Global Positioning System (GPS) chips anddigital radio technologies. This has allowed ecologists andenvironmental scientists to collect high quality traces of themovements of free-ranging animal often over lengthy timeframes (Anthony et al. 2012).
Recent technical advances in digital radio communicationsand microcontrollers has led to the evolution of WSN,which offers the potential for developing lightweight, smallsensing devices for measuring a wider variety of traits relevantto grazing livestock (Handcock et al. 2009). However, theconstraints imposed by a device that can be practicallydeployed on livestock introduce limitations on local storageand communications throughput, which in turn, makestransmission of high-temporal, low-level sensory informationdifficult, particularly as the system is scaled up to a largernumber of devices. This limitation has motivated thedevelopment of classifiers on the WSN nodes which translatethe signal data collected at high frequencies into data that areindicative of certain animal behaviours and are less frequentlytransmitted. Such an approach can produce a significantreduction of information while retaining enough information tostill accurately classify phenotypic behaviours. This reduction ofinformation saves bandwidth and energy, allowing large numbersof livestock to be measured over long periods.
The intersection of the capability to have accurate knowledgeof behaviour in the animals’ commercial grazing environments,over long periods on large numbers of animals, provides thenovel methodology for phenotyping livestock in a practical andeconomically viable way. However, it is essential that reliablephenotypic data is generated against which metrics associatedwith specific behaviours and algorithms can be developed andvalidatedusing sensingdevices.Aparticular challenge associatedwith developing a robust and precise method of measuringfeed intake in grazing animals is the absence of an existingmethodology to use as a high quality benchmark against which totrain the predictive algorithms developed from the sensor data.
Identification of sensors and hardware, and softwaredevelopment
Sensors
The first step in developing an economical means ofestimating feed intake en masse is to identify a suite of sensorsthat are likely to exhibit information that correlates with pastureintake and todeterminewhere these sensors arebest located in andon the animal. A study jointly initiated by CSIRO and the NSWDepartment of Primary Industries atArmidale inNSW is testing arangeof sensors, from theperspective of size, cost,weight, energyusage, sensor longevity and impact of the sensor on the pastureintake of the animal. Two locations on the animal have initiallybeen tested to assess likely longevity of the device and sensorsignal qualitywith respect tobehaviours of interest.One approachwas to mount a suite of sensors on an eartag and the other as adevice attached to a halter, adjacent to the mouth of the animal oron the back of the head.
Two sensing modalities are being initially employed. AnInertial Measurement Unit, comprised of 3-axis accelerometers,
Pasture intake by ruminants Animal Production Science 1797
3-axis magnetometers and a pressure sensor for gross-heightchange detection, which were selected on the basis that theanimal needs to move its head (and mouth) in order for feedintake to occur (Oudshoorn et al. 2012; Tani et al. 2013).Similarly, the ripping and chewing of feed matter (and drinking)will necessarily produce sounds that can potentially be usedto estimate feed intake (Galli et al. 2011; Navon et al. 2013;Tani et al. 2013). Hence an audio recording capability has alsobeen included.
Signal sampling
The second step in developing apractical and economicmeansof estimating pasture intake is the development of algorithms toclassify the low-level, high-sample-rate input sensor data intooutput behaviours such as foraging, biting, chewing, ripping,ruminating, drinking, and sleeping.
Mapping the sensor signals directly to pasture intake isdeemed impractical as this would require measuring thepasture intake at a frequency similar to input sample rate(faster than 1 Hz). The input features (values for everyaccelerometer and magnetometer axis and the pressure sensoras well as several audio statistics over various window sizes)inherently provide different levels of predictive power and soneed to be scaled and weighted. However, to determine theappropriate predictive power of any feature using asupervised learning approach requires the compilation of atraining dataset which includes the potential input features andoutputs (behaviours/traits). Therefore, multi-day, multi-animalexperiments recording the raw data (Inertial Measurement Unitand audio) are required with simultaneous use of benchmarkmethods of measuring feed intake and animal behaviour.
WSN hardware and annotation evaluation: developmentof behavioural annotation platform for evaluating thein-field performance of the sensing devices and WSN
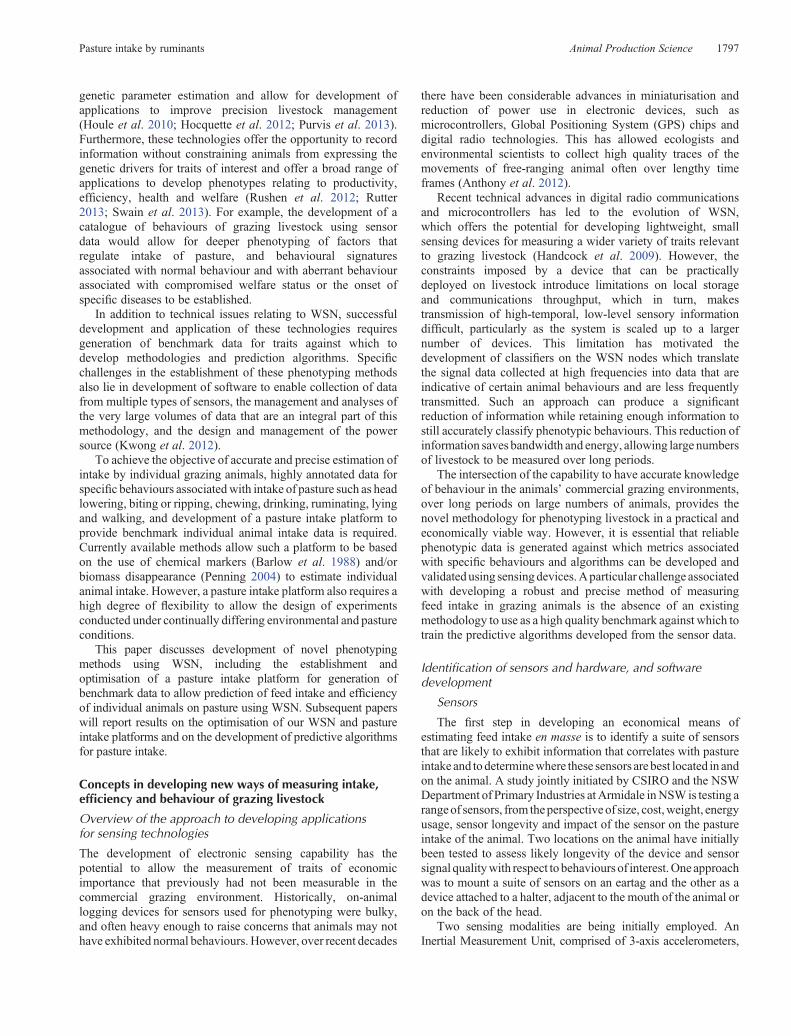
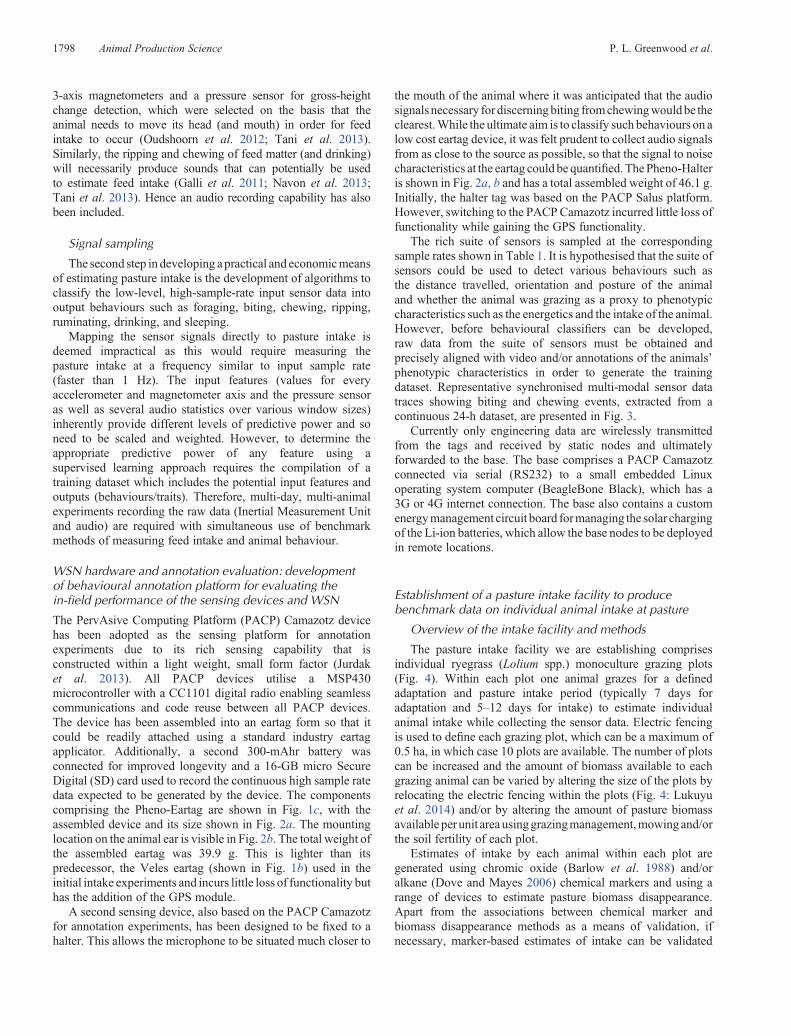
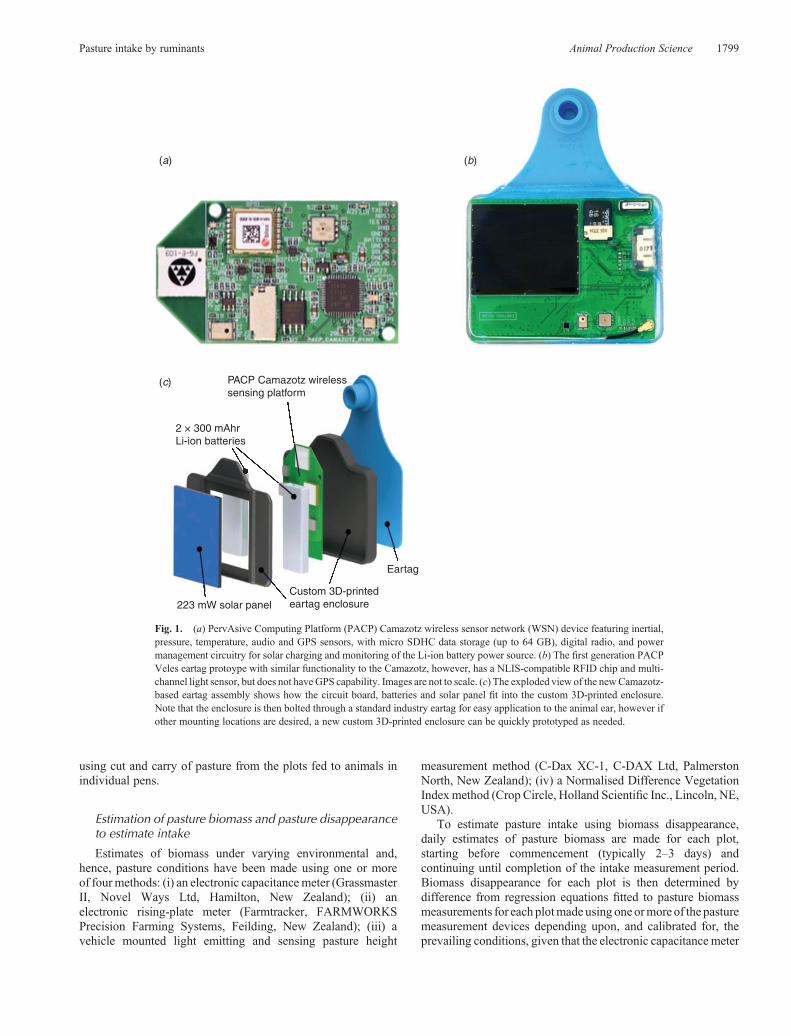
The PervAsive Computing Platform (PACP) Camazotz devicehas been adopted as the sensing platform for annotationexperiments due to its rich sensing capability that isconstructed within a light weight, small form factor (Jurdaket al. 2013). All PACP devices utilise a MSP430microcontroller with a CC1101 digital radio enabling seamlesscommunications and code reuse between all PACP devices.The device has been assembled into an eartag form so that itcould be readily attached using a standard industry eartagapplicator. Additionally, a second 300-mAhr battery wasconnected for improved longevity and a 16-GB micro SecureDigital (SD) card used to record the continuous high sample ratedata expected to be generated by the device. The componentscomprising the Pheno-Eartag are shown in Fig. 1c, with theassembled device and its size shown in Fig. 2a. The mountinglocation on the animal ear is visible in Fig. 2b. The total weight ofthe assembled eartag was 39.9 g. This is lighter than itspredecessor, the Veles eartag (shown in Fig. 1b) used in theinitial intake experiments and incurs little loss of functionality buthas the addition of the GPS module.
A second sensing device, also based on the PACP Camazotzfor annotation experiments, has been designed to be fixed to ahalter. This allows the microphone to be situated much closer to
the mouth of the animal where it was anticipated that the audiosignals necessary for discerningbiting fromchewingwouldbe theclearest.While the ultimate aim is to classify such behaviours on alow cost eartag device, it was felt prudent to collect audio signalsfrom as close to the source as possible, so that the signal to noisecharacteristics at the eartag could bequantified.ThePheno-Halteris shown in Fig. 2a, b and has a total assembled weight of 46.1 g.Initially, the halter tag was based on the PACP Salus platform.However, switching to the PACPCamazotz incurred little loss offunctionality while gaining the GPS functionality.
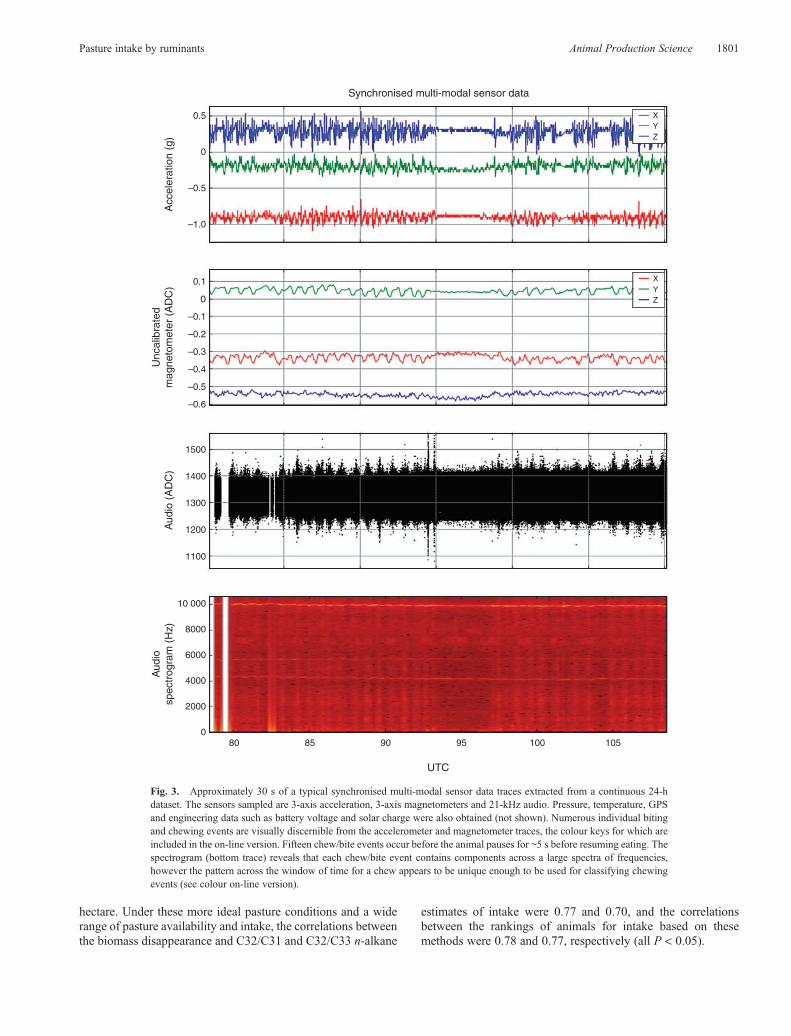
The rich suite of sensors is sampled at the correspondingsample rates shown in Table 1. It is hypothesised that the suite ofsensors could be used to detect various behaviours such asthe distance travelled, orientation and posture of the animaland whether the animal was grazing as a proxy to phenotypiccharacteristics such as the energetics and the intake of the animal.However, before behavioural classifiers can be developed,raw data from the suite of sensors must be obtained andprecisely aligned with video and/or annotations of the animals’phenotypic characteristics in order to generate the trainingdataset. Representative synchronised multi-modal sensor datatraces showing biting and chewing events, extracted from acontinuous 24-h dataset, are presented in Fig. 3.
Currently only engineering data are wirelessly transmittedfrom the tags and received by static nodes and ultimatelyforwarded to the base. The base comprises a PACP Camazotzconnected via serial (RS232) to a small embedded Linuxoperating system computer (BeagleBone Black), which has a3G or 4G internet connection. The base also contains a customenergymanagement circuit board formanaging the solar chargingof the Li-ion batteries, which allow the base nodes to be deployedin remote locations.
Establishment of a pasture intake facility to producebenchmark data on individual animal intake at pasture
Overview of the intake facility and methods
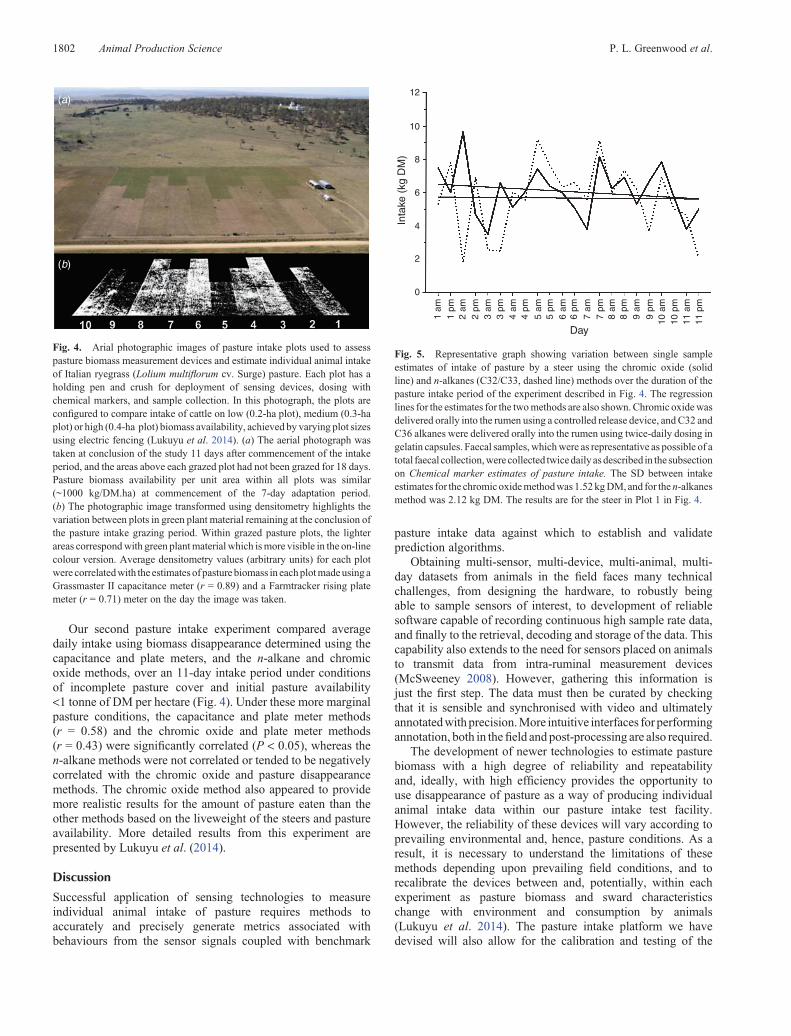
The pasture intake facility we are establishing comprisesindividual ryegrass (Lolium spp.) monoculture grazing plots(Fig. 4). Within each plot one animal grazes for a definedadaptation and pasture intake period (typically 7 days foradaptation and 5–12 days for intake) to estimate individualanimal intake while collecting the sensor data. Electric fencingis used to define each grazing plot, which can be a maximum of0.5 ha, in which case 10 plots are available. The number of plotscan be increased and the amount of biomass available to eachgrazing animal can be varied by altering the size of the plots byrelocating the electric fencing within the plots (Fig. 4: Lukuyuet al. 2014) and/or by altering the amount of pasture biomassavailable perunit areausinggrazingmanagement,mowingand/orthe soil fertility of each plot.
Estimates of intake by each animal within each plot aregenerated using chromic oxide (Barlow et al. 1988) and/oralkane (Dove and Mayes 2006) chemical markers and using arange of devices to estimate pasture biomass disappearance.Apart from the associations between chemical marker andbiomass disappearance methods as a means of validation, ifnecessary, marker-based estimates of intake can be validated
1798 Animal Production Science P. L. Greenwood et al.
using cut and carry of pasture from the plots fed to animals inindividual pens.
Estimation of pasture biomass and pasture disappearanceto estimate intake
Estimates of biomass under varying environmental and,hence, pasture conditions have been made using one or moreof four methods: (i) an electronic capacitancemeter (GrassmasterII, Novel Ways Ltd, Hamilton, New Zealand); (ii) anelectronic rising-plate meter (Farmtracker, FARMWORKSPrecision Farming Systems, Feilding, New Zealand); (iii) avehicle mounted light emitting and sensing pasture height
measurement method (C-Dax XC-1, C-DAX Ltd, PalmerstonNorth, New Zealand); (iv) a Normalised Difference VegetationIndexmethod (Crop Circle, Holland Scientific Inc., Lincoln, NE,USA).
To estimate pasture intake using biomass disappearance,daily estimates of pasture biomass are made for each plot,starting before commencement (typically 2–3 days) andcontinuing until completion of the intake measurement period.Biomass disappearance for each plot is then determined bydifference from regression equations fitted to pasture biomassmeasurements for each plotmade using oneormore of the pasturemeasurement devices depending upon, and calibrated for, theprevailing conditions, given that the electronic capacitancemeter
(a)
(c) PACP Camazotz wirelesssensing platform
2 × 300 mAhrLi-ion batteries
Eartag
Custom 3D-printedeartag enclosure223 mW solar panel
(b)
Fig. 1. (a) PervAsive Computing Platform (PACP) Camazotz wireless sensor network (WSN) device featuring inertial,pressure, temperature, audio and GPS sensors, with micro SDHC data storage (up to 64 GB), digital radio, and powermanagement circuitry for solar charging and monitoring of the Li-ion battery power source. (b) The first generation PACPVeles eartag protoype with similar functionality to the Camazotz, however, has a NLIS-compatible RFID chip and multi-channel light sensor, but does not haveGPS capability. Images are not to scale. (c) The exploded view of the newCamazotz-based eartag assembly shows how the circuit board, batteries and solar panel fit into the custom 3D-printed enclosure.Note that the enclosure is then bolted through a standard industry eartag for easy application to the animal ear, however ifother mounting locations are desired, a new custom 3D-printed enclosure can be quickly prototyped as needed.
Pasture intake by ruminants Animal Production Science 1799
and Normalised Difference Vegetation Index methods are lessreliablewhen there is incomplete pasture cover. Pasture exclusioncages and assessments of the extent of faecal contamination arealso used to enable adjustments to estimates of pasture intakeif necessary.
Chemical marker estimates of pasture intake
In our work to date, alkanes have been delivered to the rumenmorning and afternoon each day by oral dosing with gelatincapsules containing measured amounts of C32 and C36 alkanesfrom 1 week prior (equilibration period) until completion ofthe intake measurement period. Each morning and afternoonduring the intake period, fresh faecal samples are obtaineddirectly from pasture using a tray and scraper taking care toavoid contamination with soil and vegetative matter, and/or perrectum. Samples from each collection period are pooled to obtainas close as possible to a pooled sample from a total faecalcollection from individual animals for the desired period, anda combined pooled sample from all collection periods is also
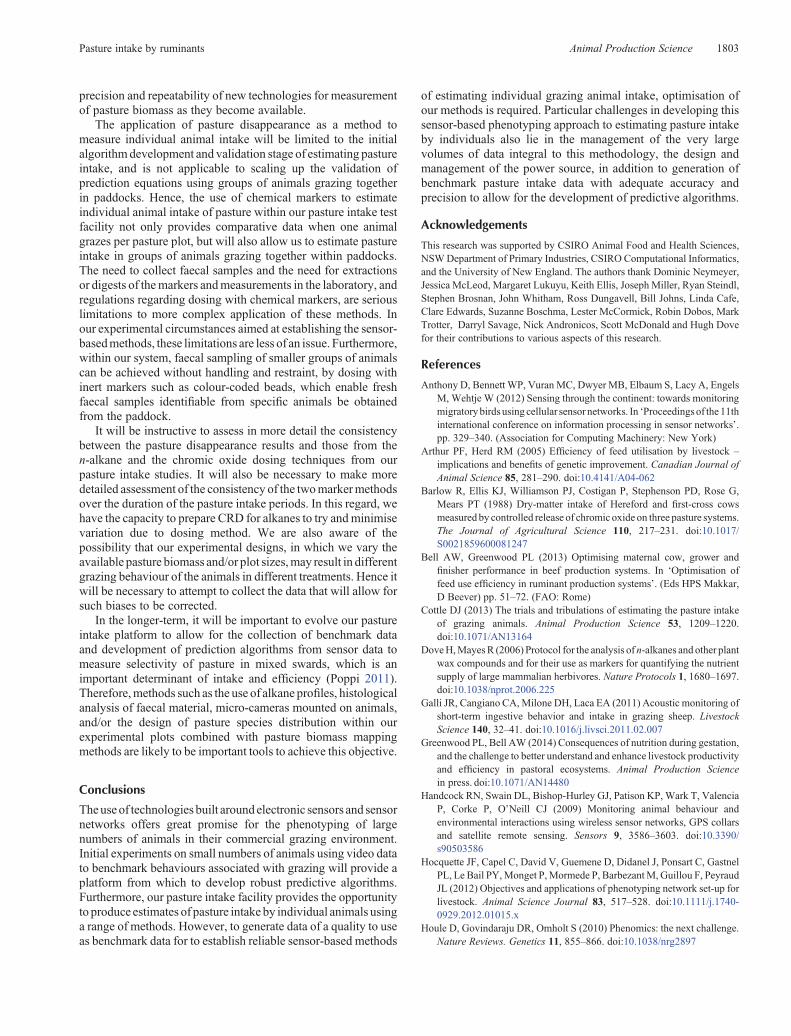
prepared for each animal. Alkanes are extracted from subsamplesof ground faeces and their concentrations measured as describedbyDove andMayes (2006). Representative pasture samples fromeach plot, and composite samples of green stem, green leaf anddead pasture material, obtained at the start and the end of theintake period, are also analysed for their alkane content. Initialresults from our studies have shown a higher degree of variabilityin alkane estimates of intake of pasture using the twice-dailydosing method compared with the chromic oxide method belowin steers dosed using a controlled release device (CRD),a representative graph of which is presented in Fig. 5.
Chromic oxide, delivered using a CRD prepared in ourlaboratory, is also used to obtain estimates of pasture intake.Thedelivery rate andduration of linear delivery rate is determinedfor the CRD using fistulated animals. The CRD are administeredto eachexperimental animal1weekbefore the start of experiment.The concentration of chromium in ground faeces, collected asdescribed above, is measured and intake of pasture determined,essentially as described by Barlow et al. (1988).
Analyses of pasture samples
Representative pasture samples obtained from each plot at thecommencement and the conclusion of intake experiments areanalysed for their n-alkanes, dry matter (DM), acid detergentfibre, neutral detergent fibre, crude protein, ash, DMdigestibility,dry organic matter digestibility, metabolisable energy, greenleaf, green stem and dead plant material content.
Preliminary results comparing pasture intake methods
Our initial pasture intake experiment compared average dailyintake using biomass disappearance determined using thecapacitance meter with the n-alkane methods over a 5-dayintake period under conditions of complete pasture cover andinitial pasture availability ranging from 1 to 3.5 tonnes of DMper
(a)
(b)(a)
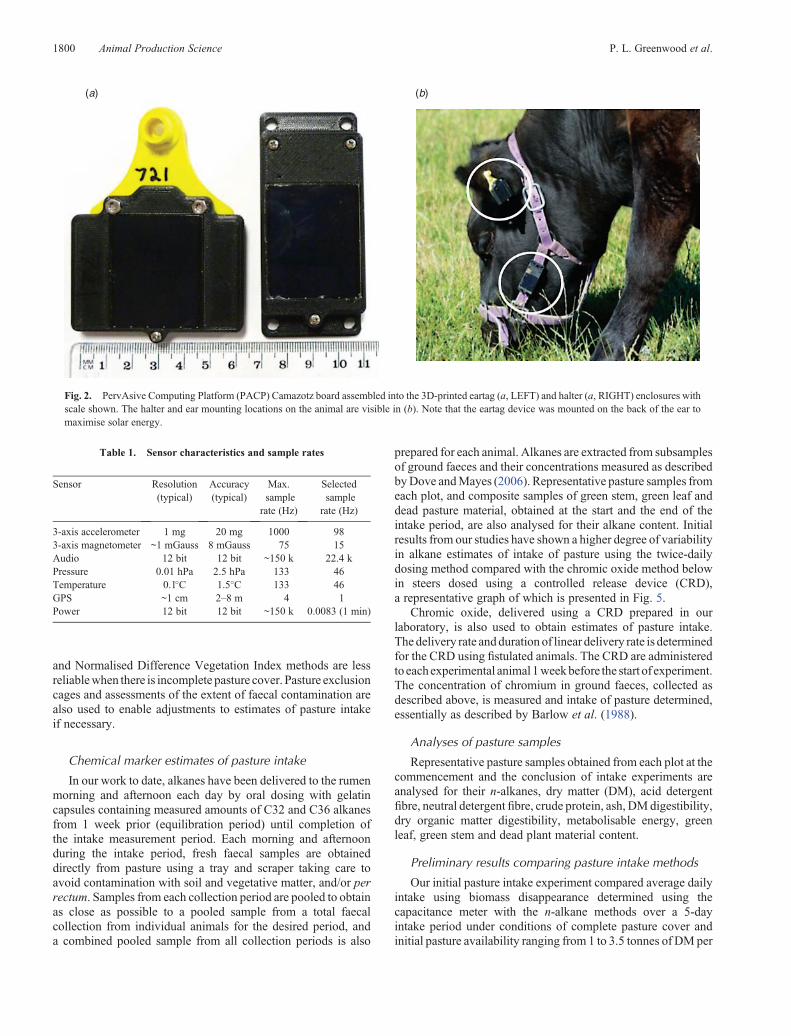
Fig. 2. PervAsive Computing Platform (PACP) Camazotz board assembled into the 3D-printed eartag (a, LEFT) and halter (a, RIGHT) enclosures withscale shown. The halter and ear mounting locations on the animal are visible in (b). Note that the eartag device was mounted on the back of the ear tomaximise solar energy.
Table 1. Sensor characteristics and sample rates
Sensor Resolution(typical)
Accuracy(typical)
Max.sample
rate (Hz)
Selectedsample
rate (Hz)
3-axis accelerometer 1 mg 20 mg 1000 983-axis magnetometer ~1 mGauss 8 mGauss 75 15Audio 12 bit 12 bit ~150 k 22.4 kPressure 0.01 hPa 2.5 hPa 133 46Temperature 0.1�C 1.5�C 133 46GPS ~1 cm 2–8 m 4 1Power 12 bit 12 bit ~150 k 0.0083 (1 min)
1800 Animal Production Science P. L. Greenwood et al.
hectare. Under these more ideal pasture conditions and a widerange of pasture availability and intake, the correlations betweenthe biomass disappearance and C32/C31 and C32/C33 n-alkane
estimates of intake were 0.77 and 0.70, and the correlationsbetween the rankings of animals for intake based on thesemethods were 0.78 and 0.77, respectively (all P < 0.05).
Synchronised multi-modal sensor data
XYZ
0.5
0
Acc
eler
atio
n (g
)A
udio
(A
DC
)U
ncal
ibra
ted
mag
neto
met
er (
AD
C)
Aud
iosp
ectr
ogra
m (
Hz)
–0.5
–1.0
0.1
–0.1
–0.2
–0.3
–0.4
–0.5
1500
1400
1200
10 000
8000
6000
4000
2000
080 85 90
UTC
95 100 105
1300
1100
–0.6
0
XYZ
Fig. 3. Approximately 30 s of a typical synchronised multi-modal sensor data traces extracted from a continuous 24-hdataset. The sensors sampled are 3-axis acceleration, 3-axis magnetometers and 21-kHz audio. Pressure, temperature, GPSand engineering data such as battery voltage and solar charge were also obtained (not shown). Numerous individual bitingand chewing events are visually discernible from the accelerometer and magnetometer traces, the colour keys for which areincluded in the on-line version. Fifteen chew/bite events occur before the animal pauses for ~5 s before resuming eating. Thespectrogram (bottom trace) reveals that each chew/bite event contains components across a large spectra of frequencies,however the pattern across the window of time for a chew appears to be unique enough to be used for classifying chewingevents (see colour on-line version).
Pasture intake by ruminants Animal Production Science 1801
Our second pasture intake experiment compared averagedaily intake using biomass disappearance determined using thecapacitance and plate meters, and the n-alkane and chromicoxide methods, over an 11-day intake period under conditionsof incomplete pasture cover and initial pasture availability<1 tonne of DM per hectare (Fig. 4). Under these more marginalpasture conditions, the capacitance and plate meter methods(r = 0.58) and the chromic oxide and plate meter methods(r = 0.43) were significantly correlated (P < 0.05), whereas then-alkane methods were not correlated or tended to be negativelycorrelated with the chromic oxide and pasture disappearancemethods. The chromic oxide method also appeared to providemore realistic results for the amount of pasture eaten than theother methods based on the liveweight of the steers and pastureavailability. More detailed results from this experiment arepresented by Lukuyu et al. (2014).
Discussion
Successful application of sensing technologies to measureindividual animal intake of pasture requires methods toaccurately and precisely generate metrics associated withbehaviours from the sensor signals coupled with benchmark
pasture intake data against which to establish and validateprediction algorithms.
Obtaining multi-sensor, multi-device, multi-animal, multi-day datasets from animals in the field faces many technicalchallenges, from designing the hardware, to robustly beingable to sample sensors of interest, to development of reliablesoftware capable of recording continuous high sample rate data,and finally to the retrieval, decoding and storage of the data. Thiscapability also extends to the need for sensors placed on animalsto transmit data from intra-ruminal measurement devices(McSweeney 2008). However, gathering this information isjust the first step. The data must then be curated by checkingthat it is sensible and synchronised with video and ultimatelyannotatedwithprecision.More intuitive interfaces for performingannotation, both in thefield and post-processing are also required.
The development of newer technologies to estimate pasturebiomass with a high degree of reliability and repeatabilityand, ideally, with high efficiency provides the opportunity touse disappearance of pasture as a way of producing individualanimal intake data within our pasture intake test facility.However, the reliability of these devices will vary according toprevailing environmental and, hence, pasture conditions. As aresult, it is necessary to understand the limitations of thesemethods depending upon prevailing field conditions, and torecalibrate the devices between and, potentially, within eachexperiment as pasture biomass and sward characteristicschange with environment and consumption by animals(Lukuyu et al. 2014). The pasture intake platform we havedevised will also allow for the calibration and testing of the
(a)
(b)
Fig. 4. Arial photographic images of pasture intake plots used to assesspasture biomass measurement devices and estimate individual animal intakeof Italian ryegrass (Lolium multiflorum cv. Surge) pasture. Each plot has aholding pen and crush for deployment of sensing devices, dosing withchemical markers, and sample collection. In this photograph, the plots areconfigured to compare intake of cattle on low (0.2-ha plot), medium (0.3-haplot) or high (0.4-ha plot) biomass availability, achieved by varying plot sizesusing electric fencing (Lukuyu et al. 2014). (a) The aerial photograph wastaken at conclusion of the study 11 days after commencement of the intakeperiod, and the areas above each grazed plot had not been grazed for 18 days.Pasture biomass availability per unit area within all plots was similar(~1000 kg/DM.ha) at commencement of the 7-day adaptation period.(b) The photographic image transformed using densitometry highlights thevariation between plots in green plant material remaining at the conclusion ofthe pasture intake grazing period. Within grazed pasture plots, the lighterareas correspondwith green plantmaterial which ismore visible in the on-linecolour version. Average densitometry values (arbitrary units) for each plotwere correlatedwith the estimates ofpasture biomass in eachplotmadeusing aGrassmaster II capacitance meter (r = 0.89) and a Farmtracker rising platemeter (r = 0.71) meter on the day the image was taken.
10
12
8
6
Inta
ke (
kg D
M)
4
2
0
Day
1 am
1 pm
2 am
3 am
4 am
5 am
5 pm
6 am
6 pm
7 am
7 pm
8 am
9 am
10 a
m
11 a
m11
pm
10 p
m
9 pm
8 pm
4 pm
2 pm
3 pm
Fig. 5. Representative graph showing variation between single sampleestimates of intake of pasture by a steer using the chromic oxide (solidline) and n-alkanes (C32/C33, dashed line) methods over the duration of thepasture intake period of the experiment described in Fig. 4. The regressionlines for the estimates for the twomethods are also shown.Chromic oxidewasdelivered orally into the rumen using a controlled release device, andC32 andC36 alkanes were delivered orally into the rumen using twice-daily dosing ingelatin capsules. Faecal samples,whichwere as representative as possible of atotal faecal collection,werecollected twicedaily as described in the subsectionon Chemical marker estimates of pasture intake. The SD between intakeestimates for the chromic oxidemethodwas 1.52kgDM,and for then-alkanesmethod was 2.12 kg DM. The results are for the steer in Plot 1 in Fig. 4.
1802 Animal Production Science P. L. Greenwood et al.
precision and repeatability of new technologies for measurementof pasture biomass as they become available.
The application of pasture disappearance as a method tomeasure individual animal intake will be limited to the initialalgorithmdevelopment and validation stage of estimating pastureintake, and is not applicable to scaling up the validation ofprediction equations using groups of animals grazing togetherin paddocks. Hence, the use of chemical markers to estimateindividual animal intake of pasture within our pasture intake testfacility not only provides comparative data when one animalgrazes per pasture plot, but will also allow us to estimate pastureintake in groups of animals grazing together within paddocks.The need to collect faecal samples and the need for extractionsor digests of themarkers andmeasurements in the laboratory, andregulations regarding dosing with chemical markers, are seriouslimitations to more complex application of these methods. Inour experimental circumstances aimed at establishing the sensor-basedmethods, these limitations are less of an issue. Furthermore,within our system, faecal sampling of smaller groups of animalscan be achieved without handling and restraint, by dosing withinert markers such as colour-coded beads, which enable freshfaecal samples identifiable from specific animals be obtainedfrom the paddock.
It will be instructive to assess in more detail the consistencybetween the pasture disappearance results and those from then-alkane and the chromic oxide dosing techniques from ourpasture intake studies. It will also be necessary to make moredetailed assessment of the consistency of the twomarkermethodsover the duration of the pasture intake periods. In this regard, wehave the capacity to prepare CRD for alkanes to try andminimisevariation due to dosing method. We are also aware of thepossibility that our experimental designs, in which we vary theavailable pasture biomass and/or plot sizes,may result in differentgrazing behaviour of the animals in different treatments. Hence itwill be necessary to attempt to collect the data that will allow forsuch biases to be corrected.
In the longer-term, it will be important to evolve our pastureintake platform to allow for the collection of benchmark dataand development of prediction algorithms from sensor data tomeasure selectivity of pasture in mixed swards, which is animportant determinant of intake and efficiency (Poppi 2011).Therefore,methods such as the use of alkane profiles, histologicalanalysis of faecal material, micro-cameras mounted on animals,and/or the design of pasture species distribution within ourexperimental plots combined with pasture biomass mappingmethods are likely to be important tools to achieve this objective.
Conclusions
Theuseof technologies built around electronic sensors and sensornetworks offers great promise for the phenotyping of largenumbers of animals in their commercial grazing environment.Initial experiments on small numbers of animals using video datato benchmark behaviours associated with grazing will provide aplatform from which to develop robust predictive algorithms.Furthermore, our pasture intake facility provides the opportunityto produce estimates of pasture intake by individual animals usinga range of methods. However, to generate data of a quality to useas benchmark data for to establish reliable sensor-based methods
of estimating individual grazing animal intake, optimisation ofour methods is required. Particular challenges in developing thissensor-based phenotyping approach to estimating pasture intakeby individuals also lie in the management of the very largevolumes of data integral to this methodology, the design andmanagement of the power source, in addition to generation ofbenchmark pasture intake data with adequate accuracy andprecision to allow for the development of predictive algorithms.
Acknowledgements
This research was supported by CSIRO Animal Food and Health Sciences,NSWDepartment of Primary Industries, CSIRO Computational Informatics,and the University of New England. The authors thank Dominic Neymeyer,Jessica McLeod, Margaret Lukuyu, Keith Ellis, JosephMiller, Ryan Steindl,Stephen Brosnan, John Whitham, Ross Dungavell, Bill Johns, Linda Cafe,Clare Edwards, Suzanne Boschma, Lester McCormick, Robin Dobos, MarkTrotter, Darryl Savage, Nick Andronicos, Scott McDonald and Hugh Dovefor their contributions to various aspects of this research.
References
Anthony D, Bennett WP, Vuran MC, Dwyer MB, Elbaum S, Lacy A, EngelsM, Wehtje W (2012) Sensing through the continent: towards monitoringmigratorybirdsusing cellular sensor networks. In ‘Proceedingsof the11thinternational conference on information processing in sensor networks’.pp. 329–340. (Association for Computing Machinery: New York)
Arthur PF, Herd RM (2005) Efficiency of feed utilisation by livestock –
implications and benefits of genetic improvement. Canadian Journal ofAnimal Science 85, 281–290. doi:10.4141/A04-062
Barlow R, Ellis KJ, Williamson PJ, Costigan P, Stephenson PD, Rose G,Mears PT (1988) Dry-matter intake of Hereford and first-cross cowsmeasured by controlled release of chromic oxide on three pasture systems.The Journal of Agricultural Science 110, 217–231. doi:10.1017/S0021859600081247
Bell AW, Greenwood PL (2013) Optimising maternal cow, grower andfinisher performance in beef production systems. In ‘Optimisation offeed use efficiency in ruminant production systems’. (Eds HPS Makkar,D Beever) pp. 51–72. (FAO: Rome)
Cottle DJ (2013) The trials and tribulations of estimating the pasture intakeof grazing animals. Animal Production Science 53, 1209–1220.doi:10.1071/AN13164
DoveH,MayesR (2006) Protocol for the analysis of n-alkanes and other plantwax compounds and for their use as markers for quantifying the nutrientsupply of large mammalian herbivores. Nature Protocols 1, 1680–1697.doi:10.1038/nprot.2006.225
Galli JR, Cangiano CA,Milone DH, Laca EA (2011) Acoustic monitoring ofshort-term ingestive behavior and intake in grazing sheep. LivestockScience 140, 32–41. doi:10.1016/j.livsci.2011.02.007
Greenwood PL, Bell AW (2014) Consequences of nutrition during gestation,and the challenge to better understand and enhance livestock productivityand efficiency in pastoral ecosystems. Animal Production Sciencein press. doi:10.1071/AN14480
Handcock RN, Swain DL, Bishop-Hurley GJ, Patison KP, Wark T, ValenciaP, Corke P, O’Neill CJ (2009) Monitoring animal behaviour andenvironmental interactions using wireless sensor networks, GPS collarsand satellite remote sensing. Sensors 9, 3586–3603. doi:10.3390/s90503586
Hocquette JF, Capel C, David V, Guemene D, Didanel J, Ponsart C, GastnelPL, Le Bail PY,Monget P,Mormede P, BarbezantM, Guillou F, PeyraudJL (2012) Objectives and applications of phenotyping network set-up forlivestock. Animal Science Journal 83, 517–528. doi:10.1111/j.1740-0929.2012.01015.x
Houle D, Govindaraju DR, Omholt S (2010) Phenomics: the next challenge.Nature Reviews. Genetics 11, 855–866. doi:10.1038/nrg2897
Pasture intake by ruminants Animal Production Science 1803
JurdakR,SommerP,KusyB,KottegeN,CrossmanC,McKeownA,WestcottD (2013) Camazotz: multimodal activity-based GPS sampling.In ‘Proceedings of the 12th international conference on informationprocessing in sensor networks’. pp. 67–78. (Association forComputing Machinery: New York)
Kwong KH, Yu TT, Goh HG, Sasloglou K, Stephen B, Glover I, Shen C, DuW, Michie C, Andonovic I (2012) Practical considerations for wirelesssensor networks in cattle monitoring applications. Computers andElectronics inAgriculture 81, 33–44. doi:10.1016/j.compag.2011.10.013
Lukuyu M, Paull DR, Johns WH, Niemeyer D, McLeod J, McCorkell B,Savage D, Purvis IW, Greenwood PL (2014) Precision of estimatingindividual feed intake of grazing animals offered low, declining pastureavailability. Animal Production Science, in press. doi:10.1071/AN14531
McSweeney C (2008) ‘Novel individual enteric methane measuring systemfor multiple ruminants.’ Project No. B.CCH.1003. (Meat and LivestockAustralia: Sydney)
Navon S,MizrachA, Hetzroni A, Ungar ED (2013) Automatic recognition ofjaw movements in free-ranging cattle, goats and sheep, using acousticmonitoring. Biosystems Engineering 114, 474–483. doi:10.1016/j.biosystemseng.2012.08.005
Oudshoorn FW, Cornou C, Hellwing ALF, Lund P, Kristensen T,Munksgaard L (2012) ‘Estimation of grazing time and grass intake onpasture for dairy cows using tightly and loosely mounted di- and tri-axialaccelerometers.’ Report 644. (Innovations in Grazing LivestockResearch: Wageningen UR, Netherlands)
Penning PD (Ed.) (2004) ‘Herbage intake handbook.’ (British GrasslandSociety: Reading, UK)
Pollak EJ, Bennett GL, Snelling WM, Thallman RM, Kuehn LA (2012)Genomics and the global beef industry. Animal Production Science52, 92–99. doi:10.1071/AN11120
Poppi DP (2011) Nutritional constraints for grazing animals and theimportance of selective grazing behaviour. In ‘Grassland productivity
and ecosystems services’. (Eds G Lemaire, J Hodgson, A Chabbi)pp. 19–26. (CABI: Wallingford, UK)
Purvis IW, Valencia P, Overs L, Greenwood PL (2013) Novel phenotypingtechniques for enhancing genetic and genomic predictions of traits thatare difficult to measure in grazing livestock. In ‘Proceedings of the 20thconference of the Association for the Advancement of Animal Breedingand Genetics’. pp. 282–285. (AAABG: Armidale)
Reynolds CK, Crompton LA, Mills AN (2011) Improving the efficiency ofenergy utilization in cattle. Animal Production Science 51, 6–12.doi:10.1071/AN10160
Rushen J, Chapinal N, Passille AM (2012) Automated monitoring ofbehavioural-based animal welfare indicators. Animal Welfare (SouthMimms, England) 21, 339–350. doi:10.7120/09627286.21.3.339
Rutter SM (2013) Can precision farming technologies be applied to grazingmanagement? In ‘Proceedings of the 22nd international grasslandcongress’. (Eds DL Michalk, GD Millar, WB Badgery, KM Broadfoot)pp. 617–620. (NSW Department of Primary Industries: Orange)
Scollan ND, Greenwood PL, Newbold CJ, Yanez Ruiz DR, Shingfield KJ,Wallace RJ, Hocquette JF (2011) Future research priorities for animalproduction in a changing world. Animal Production Science 51, 1–5.doi:10.1071/AN10051
SwainDL,HancockRN,Bishop-HurleyGJ,MenziesD (2013)Opportunitiesfor improving livestock production with e-management systems. In‘Proceedings of the 22nd international grassland congress’. (Eds DLMichalk, GD Millar, WB Badgery, KM Broadfoot) pp. 603–609.(NSW Department of Primary Industries: Orange)
Tani Y, Yokota Y, Yayota M, Ohtani S (2013) Automatic recognition andclassification of cattle chewing activity by an acousticmonitoringmethodwith a single-axis acceleration sensor. Computers and Electronics inAgriculture 92, 54–65. doi:10.1016/j.compag.2013.01.001
1804 Animal Production Science P. L. Greenwood et al.
www.publish.csiro.au/journals/an
Top Related
Copyright © 2022 FDOKUMEN

