


Bahasa
Halaman
Hukum

r Human Brain Mapping 35:89–106 (2014) r
Multivariate Pattern Analysis Reveals Subtle BrainAnomalies Relevant to the Cognitive Phenotype in
Neurofibromatosis Type 1
Joao V. Duarte,1* Maria J. Ribeiro,1 Ines R. Violante,1 Gil Cunha,1
Eduardo Silva,2 and Miguel Castelo-Branco1*
1Visual Neuroscience Laboratory, IBILI, Faculty of Medicine, University of Coimbra,Portugal
2Centre for Hereditary Eye Diseases, Department of Ophthalmology,University Hospital of Coimbra, Portugal
r r
Abstract: Neurofibromatosis Type 1 (NF1) is a common genetic condition associated with cognitivedysfunction. However, the pathophysiology of the NF1 cognitive deficits is not well understood.Abnormal brain structure, including increased total brain volume, white matter (WM) and grey matter(GM) abnormalities have been reported in the NF1 brain. These previous studies employed univariatemodel-driven methods preventing detection of subtle and spatially distributed differences in brainanatomy. Multivariate pattern analysis allows the combination of information from multiple spatiallocations yielding a discriminative power beyond that of single voxels. Here we investigated for thefirst time subtle anomalies in the NF1 brain, using a multivariate data-driven classification approach.We used support vector machines (SVM) to classify whole-brain GM and WM segments of structuralT1-weighted MRI scans from 39 participants with NF1 and 60 non-affected individuals, divided in chil-dren/adolescents and adults groups. We also employed voxel-based morphometry (VBM) as a univari-ate gold standard to study brain structural differences. SVM classifiers correctly classified 94% of cases(sensitivity 92%; specificity 96%) revealing the existence of brain structural anomalies that discriminateNF1 individuals from controls. Accordingly, VBM analysis revealed structural differences in agreementwith the SVM weight maps representing the most relevant brain regions for group discrimination.These included the hippocampus, basal ganglia, thalamus, and visual cortex. This multivariate data-driven analysis thus identified subtle anomalies in brain structure in the absence of visible pathology.Our results provide further insight into the neuroanatomical correlates of known features of the cogni-tive phenotype of NF1. Hum Brain Mapp 35:89–106, 2014. VC 2012 Wiley Periodicals, Inc.
Key words: neurofibromatosis type 1; support vector machine (SVM); neuroimaging; multivariatepattern classification; MRI; brain structure
r r
Additional Supporting Information may be found in the onlineversion of this article.
Contract grant sponsor: University of Coimbra; Contract grantnumber: III/14/2008; Contract grant sponsor: PortugueseFoundation for Science and Technology; Contract grant numbers:PIC/IC/83155/2007, PIC/IC/82986/2007, SFRH/BD/41348/2007,SFRH/BPD/34392/2006, Compete PTDC/SAU-ORG/118380/2010.
*Correspondence to: Joao V. Duarte or Miguel Castelo-Branco,Visual Neuroscience Laboratory, IBILI, Institute for Biomedical
Research on Light and Image, Faculty of Medicine, University ofCoimbra, Azinhaga de Santa Comba, 3000-548 Coimbra, Portugal.E-mail: [email protected]; or [email protected]
Received for publication 4 November 2011; Revised 7 June 2012;Accepted 13 June 2012
DOI: 10.1002/hbm.22161Published online 11 September 2012 in Wiley Online Library(wileyonlinelibrary.com).
VC 2012 Wiley Periodicals, Inc.
INTRODUCTION
The brain changes during development as a function ofgenetic and environmental conditions, as well as in thecontext of neurodevelopmental disorders. To understandabnormal neurodevelopment and its consequences it isfundamental to investigate the structural phenotype andits possible role in cognition [Hoeft et al., 2008].
Neurofibromatosis Type 1 (NF1) is a common, singlegene, developmental disorder with an incidence of 1 in3,500, characterized by increased predisposition for tumordevelopment and cognitive deficits [Kayl and Moore, 2000].NF1 features are detectable in infancy or early childhood,suggesting a role for the NF1 gene in normal development[Daston and Ratner, 1992]. Previous studies indicated thatthe NF1 gene is expressed throughout the brain during de-velopment and in adulthood, both in neurons and glia[Daston and Ratner, 1992; Zhu et al., 2005]. While duringdevelopment the protein product of the NF1 gene, neurofi-bromin, is expressed in all organ systems, in adult tissuesexpression predominates in the nervous system (includingthe cerebral cortex, cerebellum, and brainstem) [Daston andRatner, 1992; Gutmann et al., 1995]. Neurofibromin isinvolved in cell proliferation and differentiation [Lee et al.,2010], suggesting that brain structure might be affected inNF1. Indeed, an increase in total brain volume is a widelyreported structural abnormality [Cutting et al., 2002; Payneet al., 2010]. Other studies show evidence for more specificlocalized structural deficits, e.g., the thalamus and the cor-pus callosum [Cutting et al., 2000; Dubovsky et al., 2001;Greenwood et al., 2005; Kayl et al., 2000; Moore et al., 2000;Payne et al., 2010; Steen et al., 2001].
Importantly, individuals with NF1 and no brain tumorsshow impaired cognitive abilities suggesting anomalousbrain function or structure independently of focal lesions[De Winter et al., 1999; Moore et al., 1994; Schrimsheret al., 2003]. Furthermore, visuospatial, memory, andmotor deficits have so far been described in individualswith NF1 without clearly identified brain mechanisms[Hyman et al., 2006, 2005; Levine et al., 2006; North,2000]. The prominent visuospatial deficits reported inthese patients suggest parietal dysfunction [Billingsleyet al., 2002; Clements-Stephens, et al., 2008] while studiesusing NF1 animal models indicate abnormal function ofthe hippocampus, prefrontal cortex and striatum, relatedto visuospatial memory, working memory, and atten-tional deficits, respectively [Costa et al., 2002; Park et al.,2009].
Magnetic resonance imaging (MRI) is a standard methodfor studying brain structure, with studies mainly focusingeither on volume changes in particular anatomical struc-tures, lobes, or on the whole brain [Bray et al., 2009; Hoeftet al., 2008; Mietchen and Gaser, 2009]. To date, only uni-variate analysis methods have been applied to study brainanatomical alterations in patients with NF1 [Payne et al.,2010]. In contrast, multivariate methods enable the identifi-cation of subtle neuroanatomical discriminative patterns
encoded across brain regions, in the absence of a priorihypotheses. This method determines group differencesfrom a large number of simultaneously evaluated spatiallocations (voxels). Notably, individual voxels might not besignificantly different between groups but can still contrib-ute to a significantly different overall spatial pattern [Eckeret al., 2010; Marzelli et al., 2011; Pereira et al., 2009]. InNF1, as in other clinical populations, multivariate patternanalysis techniques are of particular interest for studyingthe brain anatomy, as studies have shown that these disor-ders rarely affect single brain structures [Bray et al., 2009].We hypothesize that structural brain alterations wouldinvolve multiple and distributed anatomical structures ofthe brain, composing a complex spatial pattern that maynot be easily observed using univariate approaches. Herewe used a data-driven multivariate classifier, employing asupport vector machine (SVM) algorithm, which has previ-ously been employed to investigate group differences withstructural MRI [Ecker et al., 2010; Kloppel et al., 2008;Marzelli et al., 2011]. We used linear SVM to classifywhole-brain high-resolution anatomical images. Weemployed a leave-two-out cross-validation procedure todiscriminate participants with NF1 from non-affected con-trols and to identify differences in neuroanatomical spatialpatterns. Furthermore, we also used the standard univari-ate voxel-based morphometry (VBM) analysis, commonlyused for whole brain structural analysis. This method isnot directly comparable with the multivariate classificationtechnique, but allowed us to better interpret the meaningof the weights identified by SVM analysis while at thesame time confirming whether the distributed patternshighlighted with SVM included locations identified byVBM. The identified spatial patterns and their functionalsignificance provide novel insights on current pathophys-iological hypotheses in NF1.
METHODS
Participants
For this study, we recruited 112 individuals, 26 NF1children/adolescents, 31 control children/adolescents, 20NF1 adults, and 35 control adults. Although NF1 is anautosomal dominant genetic disorder, novel mutations arecommon and therefore diagnosis does not rely solely ongenetic testing. All participants with NF1 were recruitedand diagnosed in collaboration with the Clinical GeneticsDepartment of the Pediatrics Hospital of Coimbra accord-ing to the NIH clinical criteria for NF1 [Neurofibromatosis.Conference statement. National Institutes of Health Con-sensus Development Conference, 1988]. The presence oftwo or more of the following criteria constitutes definitivediagnosis:
1. Six or more ‘‘cafe-au-lait’’ spots greater than 5 mm indiameter in prepubertal children or greater than 15mm in diameter in postpubertal individuals.
r Duarte et al. r
r 90 r
2. Two or more neurofibromas of any form or one plexi-form neurofibroma.
3. Freckling in the axillary or inguinal regions.4. Optic glioma.5. Two or more Lisch nodules (iris hamartomas).6. A distinctive osseous lesion such as sphenoid dyspla-
sia or thinning of long bone cortex with or withoutpseudoarthrosis.
7. A first-degree relative with NF1 by the above criteria.
Symptom severity is variable from mild symptoms inmost individuals diagnosed with NF1 to some debilitatingcases, characterized by severe cognitive impairments andserious medical complications [Tonsgard, 2006]. Here, weinvestigated individuals without brain tumors to provethat a phenotype is still present in NF1 in the absence ofsevere structural abnormalities.
Children and adolescent controls were recruited amongunaffected siblings and from a local school. Adult controlswere recruited among the unaffected parents or from anadult education school. Neuroradiological assessments ofFLAIR and T1-weighted MRI scans were carried out by anexperienced neuroradiologist in order to detect centralnervous system pathologies. We excluded participantswith a clinically significant intracranial abnormality onMRI, as intracranial tumor, optic glioma, or other imagingabnormalities. T2-hyperintensities were not considered anexclusion criterion. T2-hyperintensities are the most com-monly identified abnormalities on T2-weighted MR imagesin participants with NF1. T2-hyperintensities tend toresolve with adulthood and the hypothesis that theselesions are associated cognitive impairment in childrenwith NF1 remains controversial [Payne et al., 2010]. Noneof the participants had a psychiatric illness and individu-als with other neurological problems (e.g., epilepsy) wereexcluded. We excluded 13 participants based on thesecriteria.
T1-weighted MRI brain scans from 99 participants di-vided in two groups were analyzed: a group of children/adolescents (7–17 years old), 21 participants diagnosedwith NF1 and 29 age- and gender-matched controls; and agroup of adults (19–50 years old), 18 participants withNF1 and 31 age- and gender-matched controls. Overall, 95participants were right handed and only 4 participantswere left handed. Demographic data for the included par-ticipants are reported in Table I.
In order to correlate the level of cognitive impairmentswith the output of SVM classification, we performed theneuropsychological characterization of the participants. Inthe group of children/adolescents, we applied the Portu-guese adapted version of the Wechsler Intelligence Scalefor children (WISC-III) to measure the IQ [Wechsler, 2003].For adult participants, we applied the first set of the RavenAdvanced Progressive Matrices [Raven, 1947] as an indica-tion of non-verbal intelligence. Participants in both agegroups also performed the Benton’s Judgment of Line Ori-entation (JLO) test, a standardized measure of visuospatial
judgment [Benton et al., 1978]. The neuropsychologicalcharacterization of a subgroup of these patients has al-ready been reported before in our previous study [Ribeiroet al., 2012]. Neuropsychological differences between par-ticipants with NF1 and controls were evaluated using in-dependent samples t-tests, after testing for normality ofthe data. In all cases we failed to reject the null hypothesisthat the samples came from a normal distribution(except for JLO, in which case non parametric tests wereused). Neuropsychological characterization is reported inTable II.
Standard Protocol Approvals, Registrations, and
Patient Consents
The study was approved by the Ethics Committees ofthe Faculty of Medicine of the University of Coimbra andof the Pediatrics Hospital of the University of Coimbra.Written informed consent was obtained from the adultparticipants and from the legal representative in the caseof participants under 18 years old. Oral or written consentwas also obtained from participants under 18 years old.
MR Image Acquisition and Preprocessing
All subjects were scanned at the Portuguese Brain Imag-ing Network facilities in Coimbra, Portugal, on a 3Tresearch scanner (Magnetom TIM Trio, Siemens) using a12-channel birdcage head coil. Two high-resolution whole-brain anatomical T1-weighted MR images (MPRAGEsequence, 1 � 1 � 1 mm3 voxel size, repetition time (TR)2.3 s, echo time (TE) 2.98 ms, flip angle (FA) 9�, field ofview (FOV) 256 � 256, 160 slices) were acquired for eachparticipant, as well as a T2-weighted MR image (FLAIRsequence, 1 � 1 � 1 mm3 voxel size, TR 5 s, TE 2.98 ms,inversion time (TI) 1.8 s, FOV 250 � 250, 160 slices).
Data were pre-processed using SPM8 software (Well-come Trust Centre for Neuroimaging, Institute of Neurol-ogy, UCL, London, UK, http://www.fil.ion.ucl.ac.uk/spm) and VBM8 toolbox (http://dbm.neuro.uni-jena.de/vbm8/) in the Matlab computing environment (version7.6.0 R2008a, The Mathworks, MA). Each T1-weightednative image volume was manually aligned onto the axis
TABLE I. Demographic data on study cohort
Group
Children/adolescents Adults
NF1 Controls NF1 Controls
n 21 29 18 31Age 11.12 (2.35) 12.08 (2.41) 33.05 (5.42) 34.97 (7.93)Gender
(F/M)14/7 16/13 17/1 25/6
Data expressed as mean (SD). There were no significant statisticaldifferences in age (using independent samples t-tests) and genderratios (using Chi-square test) between the clinical groups.
r Subtle Anomalies in the NF1 Brain: Multivariate Data-Driven Classification Approach r
r 91 r
of the anterior and posterior commisures. Images wereautomatically corrected for inhomogeneity of the magneticfield and segmented into grey matter (GM), white matter(WM), and cerebrospinal fluid, with the value at eachvoxel representing the proportion of the corresponding tis-sue type [Ashburner and Friston, 2005]. For the adults’group, we used the standard MNI template for spatialnormalization and segmentation. For the children/adoles-cents’ group, we created a custom template with theTOM toolbox [Wilke et al., 2008]. We used the high-dimensional registration DARTEL algorithm in SPM[Ashburner, 2007] to spatially align each subject’s imagewith the corresponding template. This high-dimensionalnormalization procedure in SPM includes both linear(affine) and nonlinear components. The affine scalingmatches the subject brain to the template in overall shapeand the nonlinear component expands and contractssome brain regions on a locally specific basis. To correctfor the effects of spatial normalization in our study, weused a non-linear only ‘‘modulation’’ step. This accountsfor local amount of expansion or contraction of brainstructures, so that the total amount of GM/WM in themodulated images remains the same as it would be inthe original images. For instance, if spatial normalizationdoubles the volume of a certain structure, then the correc-tion will halve the intensity of the signal in this region.With the adjustment, we can compare the total volume oftissue in each structure corrected for individual brain size(tissue volume per unit volume of spatially normalizedimage) [Ashburner, 2009; Ashburner and Friston, 2000],which we will denominate as relative volume. If the lin-ear (affine) component of the modulation had beenincluded, through the determinant of the affine matrix[see Buckner et al., 2004 for a complete review of themethod] the same corrections would have been appliedon a global scale: i.e., larger brains would show a globallyhigher intensity due to the necessary global contractionto fit the template, and vice-versa. We have chosen toignore the affine modulation step, so the GM/WM mapsare also corrected for overall global size and shape and
there is no need to include global measures as nuisancecovariates in subsequent statistical models [Ashburner,2009].
We also generated custom GM and WM templates foreach group (children/adolescents and adults) from GMand WM images of each group’s subjects, for optimizationof the segmentation procedure and for presentation of theresults. Global brain volumes were determined throughthese automatic segmentation procedures. Differencesbetween participants with NF1 and controls were eval-uated using independent samples t-tests. Volumetric meas-ures for the included participants are reported in Table II.
Support Vector Pattern Classification
As a supervised learning method, the SVM algorithmdetermines a map between features of the data and theassociated label. In the context of our study, the featuresof the data are the intensity values in each voxel of thesegmented and modulated volume images (GM or WM),which represent the relative volume of tissue (as discussedearlier) and the label of each image is the group to whichit belongs (NF1 or Control). Aiming at distinguishing theimages into two discrete classes, we perform a binary clas-sification task, in which each image is classified individu-ally as ‘‘NF1’’ or ‘‘Control.’’ Prior to classification, eachfeature is scaled to a z-score in the matrix containing allthe participants. The z-score is computed for each voxel(corresponding to a column in the data matrix while eachimage of an individual is a row of the matrix) using themean and standard deviation along the column. After scal-ing, each voxel will have mean 0 and standard deviation1, compensating for a possible wider variation in signalamplitude in some voxels than others [Pereira et al., 2009].A set of images is used to train the classifier to learn theneuroanatomical relationships between the relative volumeacross voxels and the group membership. In the trainingof the classifier, a mathematical decision function that bestdistinguishes the images of the two groups is established.
TABLE II. Volumetric and neuropsychological measures on patients and control groups
Group
Children/adolescents Adults
NF1 Controls NF1 Controls
Grey matter (ml) 701.63 (111.73) 740.79 (88.85) 654.97* (55.50) 616.51* (51.06)White matter (ml) 498.33* (59.44) 456.76* (54.08) 556.02** (51.62) 475.50** (56.75)Cerebral spinal Fluid (ml) 237.82 (79.94) 210.76 (30.29) 206.79 (34.94) 195.71 (19.12)Brain total (ml) 1437.78 (136.96) 1408.31 (141.82) 1417.78** (113.37) 1287.72** (111.82)Full-scale IQ 96.60* (15.21)a 114.42* (20.53)b — —Raven score — — 0.50* (0.23)c 0.66* (0.23)d
JLO score 16.89** (6.29)e 24.26** (3.97)f 17.94* (4.22)g 22.43* (6.05)a
Data expressed as mean (SD). Significant group differences (NF1 vs. Controls) are marked: *P < 0.05, **P < 0.001.JLO: Judgment of Line Orientation test.a,b,c,d,e,f,gn ¼ 21, 24, 18, 22, 19, 23, 18.
r Duarte et al. r
r 92 r
Once the decision function is learned, the model can beapplied to predict the group assignment of a previouslyunseen test image [Pereira et al., 2009]. We used a linearSVM due to its simplicity, interpretability, and generallygood performance [Pereira et al., 2009]. The linear classi-fier predicts the class of the test image based on a linearcombination of the features.
In high-dimensional problems, as is the case of thewhole-brain approach in our study, it is likely that only asubset of voxels will actually provide enough informationfor classification. In order to reduce the number of voxelsused in the classification task, we used a simple filteringapproach, the Fisher score, which allows choosing the vox-els that are most discriminative between classes. TheFisher criterion score is a simple filtering approach, inde-pendent of the classifier that uses inter- and intra-classvariance to measure the power of the feature in discrimi-nating the examples’ labels [Chang and Lin, 2008]. Thehigher the F-score the more discriminative is the feature.The voxels were ranked by discriminative power regard-ing the class and we selected the n voxels with highest dis-criminative power for classification. We analyzed imagesfrom the different age groups (children/adolescents oradults) and tissue type (GM or WM) separately, using 100,1,000, 10,000, 50,000, 100,000, or 150,000 voxels. Impor-tantly, the feature selection step was performed on thetraining set only.
To extract more general conclusions about the structuralpatterns distinguishing patients with NF1 from controlswe used a Leave-Two-Out Cross-Validation (L2OCV)method [Bray et al., 2009; Pereira et al., 2009]. In theL2OCV method, pairs of images (one from each class) areleft out for testing the model in each L2OCV iteration. Inour procedure, each image of one class was tested pairedwith each image of the other class and this procedure wasrepeated 100 times. Given the larger number of controlsthan participants with NF1 in our data set, a number ofcontrol participants (8 in the children/adolescents and 13in the adults) were randomly excluded in each of the 100L2OCV repetitions, ensuring that the classification wasperformed with the same number of participants for eachclinical group. After constructing the training set of eachcross-validation fold, the F-score ranking of all the voxelswas computed only in this set. Then the highest n rankedvoxels were selected to form the reduced training set andthe same voxels were selected in the test set to test theexamples in the test fold of the cross-validation iteration.We repeated the L2OCV 100 times, an arbitrary value, toensure that each participant would be tested several timesand to build a sample of classification accuracy values tocompare with the sample of accuracy values obtained withpermuted labels. Each participant was included in L2OCVprocedure 84 times, on average. We then computed themean sensitivity (measuring correct identification of NF1images), specificity (measuring correct identification ofcontrol images), and classification accuracy (the proportionof correct predictions) over all iterations of the procedure.
To evaluate the statistical significance of the classificationresults we needed to determine the probability of obtainingthe observed classification results if the null hypothesiswas true (that there is no information about the label in thedata). Due to the large number of voxels and training/test-ing trials it was not computationally feasible to generatethe null distribution by permutation for each cross-valida-tion fold in each repetition [Golland and Fischl, 2003; Pe-reira et al., 2009]. We rather repeated 200 times the sameL2OCV procedure with a different shuffling of the labelseach time. Over many repetitions, this yields a sample ofclassification results under the null hypothesis that there isno class information in the data [Pereira and Botvinick,2011]. Normality of the distribution was assessed with theShapiro–Wilk test (in all cases failed to reject the null hy-pothesis) and we used the t distribution to assess the sig-nificance of the classification results. We performedindependent sample t-tests to compare the mean classifica-tion performance values (accuracy, sensitivity and specific-ity) between the real tests distribution and the distributionfrom the tests with randomized labels to extract the corre-sponding P-values [Kaplan and Meyer, 2012].
Discriminative Patterns
Linear SVM determines the weights of the classificationmodel during training. The weights, one for each voxel,can be used to characterize the specific pattern of braindifferences between NF1 and control brains. Although notin all cases, the absolute values of the weights often indi-cate which voxels are more important for classification[Cristianini and Shawe-Taylor, 2000]. A higher absoluteweight indicates that the voxel is considered more indetermining the group assignment than another voxelwith lower weight. This helps to identify the brain regionsthat strongly contributed, albeit not alone, to the discrimi-nation between individuals with NF1 and controls in theGM or WM tissues. Note that the interpretation of the vox-els’ weights of a linear SVM classifier must be done withcare, because although the sign and strength of the weightof a voxel may often imply the sign and strength of thecorrelation that a feature has with the labels, this does notalways hold true, given the multivariate nature of the deci-sion boundary [Pereira and Botvinick, 2011]. In principle,a positive/negative weight means higher/lower tissue rel-ative volume in patients than in controls [Ecker et al.,2010], respectively, but it can really only be determinedfrom univariate assessment (which our VBM approachprovides). Thus, we examined how the combined relation-ships between the voxels contribute to the discriminationby analyzing the distribution of the voxels’ weights, andused VBM results to inform the meaning of SVM patterns.We mapped the voxels’ weights in the custom GM andWM templates for each group. As the cross-validationmethod comprises the training of many SVM models, weaveraged the voxels’ weights across iterations to determinethe spatial discriminative pattern of tissue relative volume
r Subtle Anomalies in the NF1 Brain: Multivariate Data-Driven Classification Approach r
r 93 r
differences. We also extracted the discriminative map froman SVM model trained with the entire datasets (children/adolescents and adults separately), which resulted in apattern very similar to the weight vector of each L2OCViteration. We discuss the discriminative maps in terms ofthe regions with strong weights, contained within theidentified distributed patterns, and its probable functionalsignificance to the cognitive phenotype of NF1. Note thatthese regions should be seen as components of a complexand distributed network of subtle differences in the NF1brain.
Voxel-Based Morphometry Analysis
Univariate VBM is a traditionally used univariatemethod to study whole brain morphometry, when no apriori hypotheses are available [Ashburner and Friston,2000]. Thus, we performed VBM in the same GM/WMsegments used in the classification analysis in order togain information about voxel-wise local volumetric differ-ences that can help the interpretation of the SVM findings.We performed VBM analysis comparing NF1 and controlbrains in each group, adults and children/adolescents.First, we smoothed the modulated normalized GM andWM volume images with 3-dimensional 8-mm full-width-at-half-maximum (FWHM) isotropic Gaussian kernels.Smoothing in VBM is required to guarantee normality ofthe data for subsequent statistical analysis. We thenapplied the general linear model (GLM) at each voxelusing SPM8 and VBM8 toolbox to investigate between-group differences in GM or WM regional volume. Statisti-cal inference of significant clusters of volumetric differen-ces (NF1 vs. controls) in GM and WM was performedusing a voxel-wise two-sample t-test corrected for multiplecomparisons. We used a voxel level P-value < 0.05 cor-rected employing the family wise error (FWE) rate andaccounting for non-uniform smoothness of the data [Haya-saka et al., 2004; Worsley et al., 1999]. When there were nosuprathreshold voxels, we lowered the statistical strin-gency to uncorrected P-value < 0.001 to provide heuristicinformation on the meaning of the sign of SVM weightmaps. To display the regions showing changes that mightbe involved in NF1, the output maps were overlaid ontocustom GM and WM templates for each group.
RESULTS
Neuropsychological Characterization and
Volumetric Measurements
Volumetric and neuropsychological measures for theincluded participants are reported in Table II.
Children and adolescents with NF1 had significantlyhigher WM volumes than controls (P < 0.05). In contrast,GM volume and total intracranial volume were not signifi-cantly different from control levels. In adult participants,
statistically significant volumetric differences were foundin the global volume of GM (P < 0.05), WM (P < 0.001),and whole brain (P < 0.05). In both children/adolescentsand adults, we found statistically significant differencesbetween NF1 and controls in intelligence measures [full-scale IQ (P < 0.05) for children and adolescents and Raventest score (P < 0.05) for adults] and visuospatial abilities(JLO test score: P < 0.05 in children/adolescents, P <0.001 in adults). For all these measures the scores of theindividuals with NF1 were lower than the scores of thecontrol participants.
SVM Classification Performance
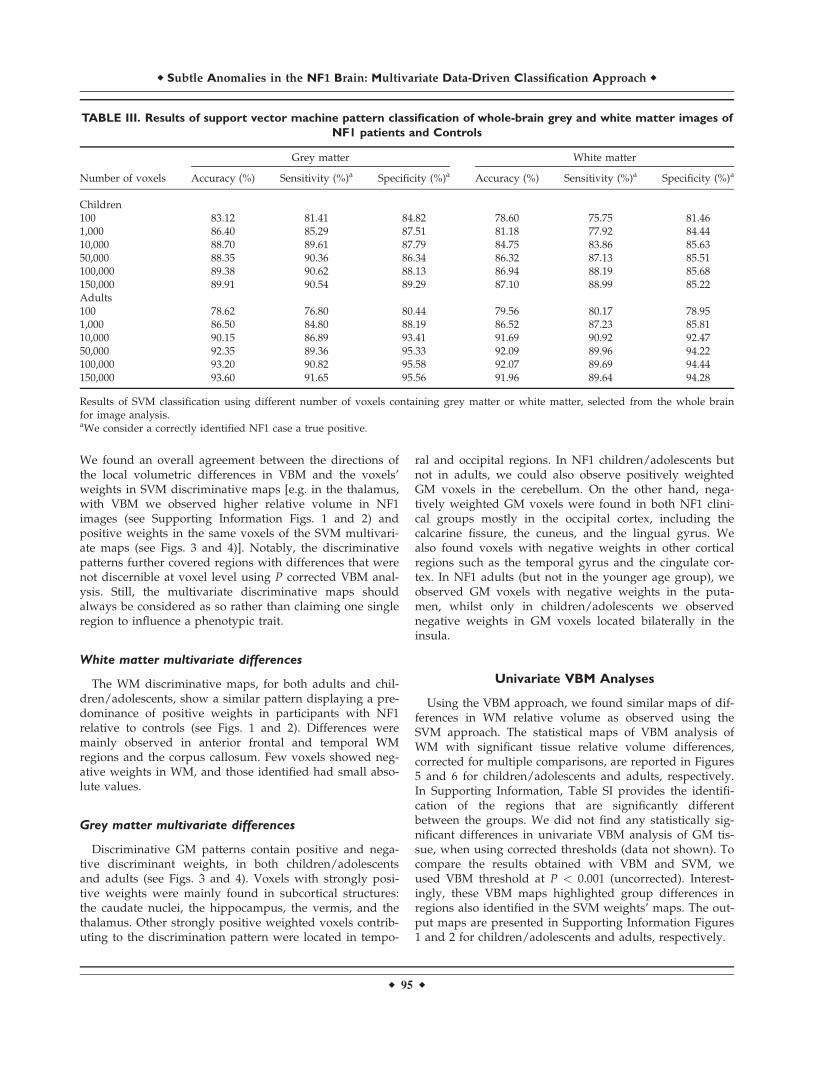
The results of the classification between individualswith NF1 and controls using GM and WM images areshown in Table III. The best classification accuracy wasobtained in the adult’s group using the GM images. Here,individuals with NF1 were correctly classified in 93.60% ofall cases (sensitivity ¼ 91.65%; specificity ¼ 95.56%).Slightly lower classification accuracies were observed onthe basis of the WM images, which resulted in correct clas-sification in 91.96% of adults with sensitivity of 89.64%and specificity of 94.28%. In the children/adolescentsgroup, the classification accuracy using GM was 89.91%(sensitivity ¼ 90.54%; specificity ¼ 89.29%) and using WMwas 87.10% (sensitivity ¼ 88.99%; specificity ¼ 85.22%).The performance (accuracy, sensitivity and specificity) ofthe classification was always significantly higher than thatderived with the null distribution obtained with permutedlabels (P < 0.001) for both age groups (children/adoles-cents and adults), number of voxels used and tissue types(GM and WM).
Multivariate SVM Classifier Weight Vectors
The WM discriminative maps showing spatially distrib-uted patterns of differences between NF1 and controls aredisplayed in Figures 1 and 2 for children/adolescents andadults, respectively, while the GM discriminative maps areshown in Figures 3 and 4, for children/adolescents andadults, respectively. Due to the multivariate nature ofSVM, the discriminative maps should be interpreted asspatially distributed patterns of local volumetric differen-ces. Nonetheless, we have highlighted the regions thatcontributed with higher absolute weights to the discrimi-nation between patients with NF1 and controls. Despitethe fact that the relationship between the sign and strengthof the voxels’ weights and the increase/decrease in rela-tive volume is not necessarily direct, it usually holds true[Pereira and Botvinick, 2011]. A positive weight in the dis-criminative map suggests relatively higher tissue volumein patients than in controls and a negative weight meansrelatively lower tissue volume in patients. As changes inrelative volumes can only be definitely determined by uni-variate assessment, we also employed the VBM approach.
r Duarte et al. r
r 94 r
We found an overall agreement between the directions ofthe local volumetric differences in VBM and the voxels’weights in SVM discriminative maps [e.g. in the thalamus,with VBM we observed higher relative volume in NF1images (see Supporting Information Figs. 1 and 2) andpositive weights in the same voxels of the SVM multivari-ate maps (see Figs. 3 and 4)]. Notably, the discriminativepatterns further covered regions with differences that werenot discernible at voxel level using P corrected VBM anal-ysis. Still, the multivariate discriminative maps shouldalways be considered as so rather than claiming one singleregion to influence a phenotypic trait.
White matter multivariate differences
The WM discriminative maps, for both adults and chil-dren/adolescents, show a similar pattern displaying a pre-dominance of positive weights in participants with NF1relative to controls (see Figs. 1 and 2). Differences weremainly observed in anterior frontal and temporal WMregions and the corpus callosum. Few voxels showed neg-ative weights in WM, and those identified had small abso-lute values.
Grey matter multivariate differences
Discriminative GM patterns contain positive and nega-tive discriminant weights, in both children/adolescentsand adults (see Figs. 3 and 4). Voxels with strongly posi-tive weights were mainly found in subcortical structures:the caudate nuclei, the hippocampus, the vermis, and thethalamus. Other strongly positive weighted voxels contrib-uting to the discrimination pattern were located in tempo-
ral and occipital regions. In NF1 children/adolescents butnot in adults, we could also observe positively weightedGM voxels in the cerebellum. On the other hand, nega-tively weighted GM voxels were found in both NF1 clini-cal groups mostly in the occipital cortex, including thecalcarine fissure, the cuneus, and the lingual gyrus. Wealso found voxels with negative weights in other corticalregions such as the temporal gyrus and the cingulate cor-tex. In NF1 adults (but not in the younger age group), weobserved GM voxels with negative weights in the puta-men, whilst only in children/adolescents we observednegative weights in GM voxels located bilaterally in theinsula.
Univariate VBM Analyses
Using the VBM approach, we found similar maps of dif-ferences in WM relative volume as observed using theSVM approach. The statistical maps of VBM analysis ofWM with significant tissue relative volume differences,corrected for multiple comparisons, are reported in Figures5 and 6 for children/adolescents and adults, respectively.In Supporting Information, Table SI provides the identifi-cation of the regions that are significantly differentbetween the groups. We did not find any statistically sig-nificant differences in univariate VBM analysis of GM tis-sue, when using corrected thresholds (data not shown). Tocompare the results obtained with VBM and SVM, weused VBM threshold at P < 0.001 (uncorrected). Interest-ingly, these VBM maps highlighted group differences inregions also identified in the SVM weights’ maps. The out-put maps are presented in Supporting Information Figures1 and 2 for children/adolescents and adults, respectively.
TABLE III. Results of support vector machine pattern classification of whole-brain grey and white matter images of
NF1 patients and Controls
Number of voxels
Grey matter White matter
Accuracy (%) Sensitivity (%)a Specificity (%)a Accuracy (%) Sensitivity (%)a Specificity (%)a
Children100 83.12 81.41 84.82 78.60 75.75 81.461,000 86.40 85.29 87.51 81.18 77.92 84.4410,000 88.70 89.61 87.79 84.75 83.86 85.6350,000 88.35 90.36 86.34 86.32 87.13 85.51100,000 89.38 90.62 88.13 86.94 88.19 85.68150,000 89.91 90.54 89.29 87.10 88.99 85.22Adults100 78.62 76.80 80.44 79.56 80.17 78.951,000 86.50 84.80 88.19 86.52 87.23 85.8110,000 90.15 86.89 93.41 91.69 90.92 92.4750,000 92.35 89.36 95.33 92.09 89.96 94.22100,000 93.20 90.82 95.58 92.07 89.69 94.44150,000 93.60 91.65 95.56 91.96 89.64 94.28
Results of SVM classification using different number of voxels containing grey matter or white matter, selected from the whole brainfor image analysis.aWe consider a correctly identified NF1 case a true positive.
r Subtle Anomalies in the NF1 Brain: Multivariate Data-Driven Classification Approach r
r 95 r
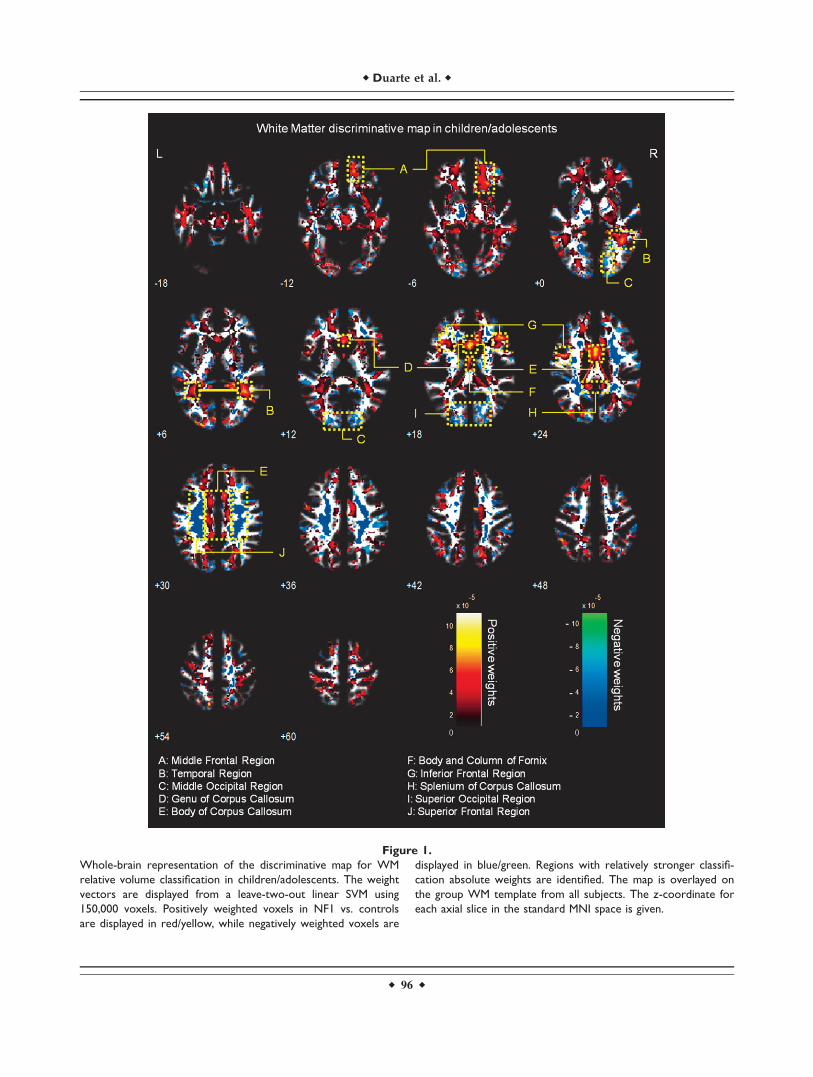
Figure 1.
Whole-brain representation of the discriminative map for WM
relative volume classification in children/adolescents. The weight
vectors are displayed from a leave-two-out linear SVM using
150,000 voxels. Positively weighted voxels in NF1 vs. controls
are displayed in red/yellow, while negatively weighted voxels are
displayed in blue/green. Regions with relatively stronger classifi-
cation absolute weights are identified. The map is overlayed on
the group WM template from all subjects. The z-coordinate for
each axial slice in the standard MNI space is given.
r Duarte et al. r
r 96 r
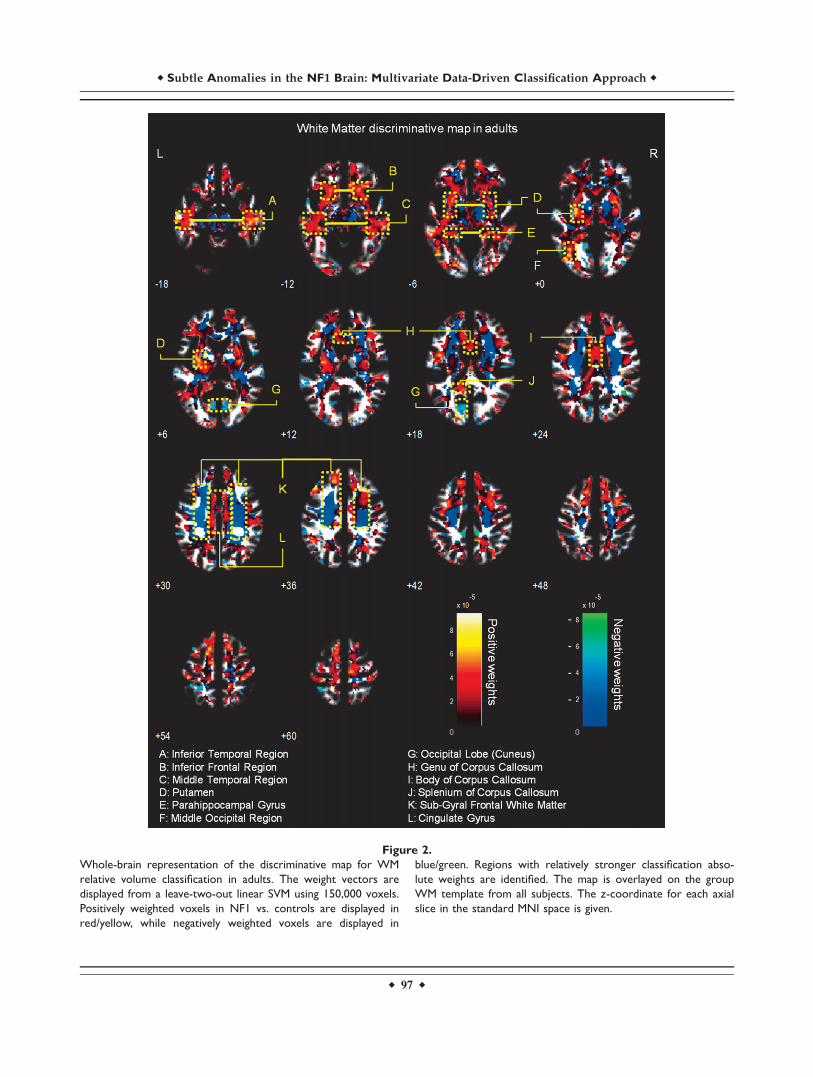
Figure 2.
Whole-brain representation of the discriminative map for WM
relative volume classification in adults. The weight vectors are
displayed from a leave-two-out linear SVM using 150,000 voxels.
Positively weighted voxels in NF1 vs. controls are displayed in
red/yellow, while negatively weighted voxels are displayed in
blue/green. Regions with relatively stronger classification abso-
lute weights are identified. The map is overlayed on the group
WM template from all subjects. The z-coordinate for each axial
slice in the standard MNI space is given.
r Subtle Anomalies in the NF1 Brain: Multivariate Data-Driven Classification Approach r
r 97 r
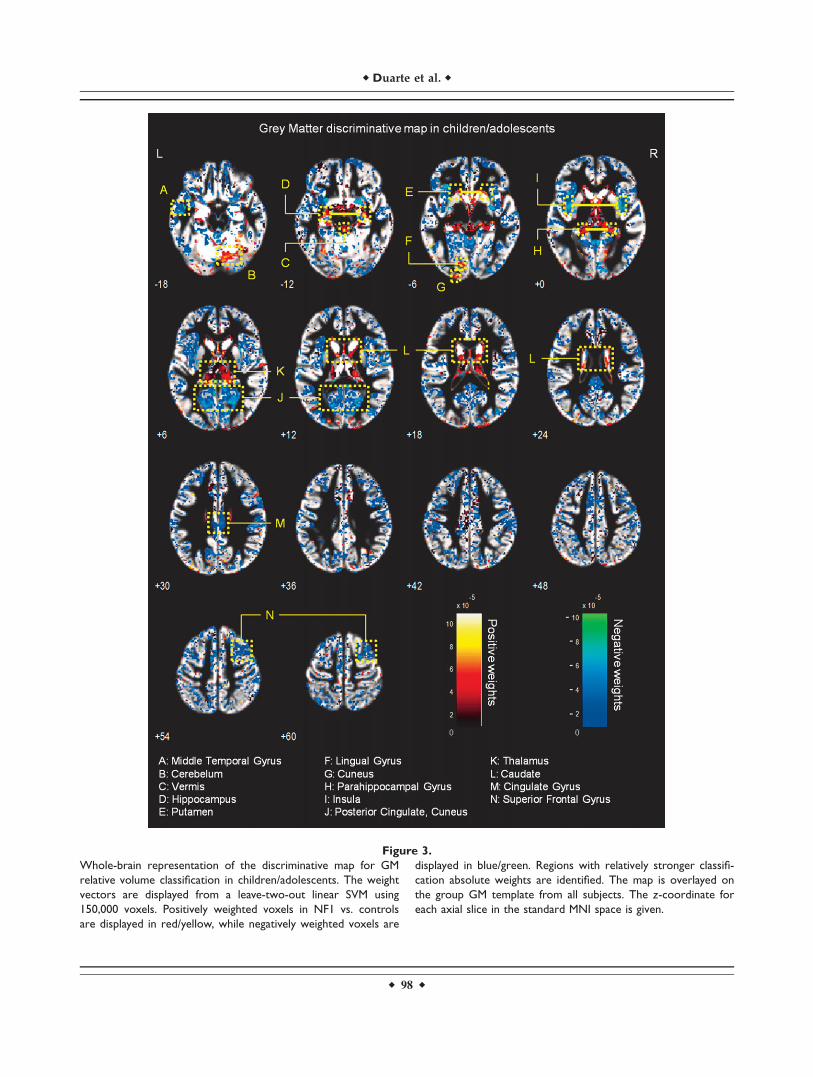
Figure 3.
Whole-brain representation of the discriminative map for GM
relative volume classification in children/adolescents. The weight
vectors are displayed from a leave-two-out linear SVM using
150,000 voxels. Positively weighted voxels in NF1 vs. controls
are displayed in red/yellow, while negatively weighted voxels are
displayed in blue/green. Regions with relatively stronger classifi-
cation absolute weights are identified. The map is overlayed on
the group GM template from all subjects. The z-coordinate for
each axial slice in the standard MNI space is given.
r Duarte et al. r
r 98 r
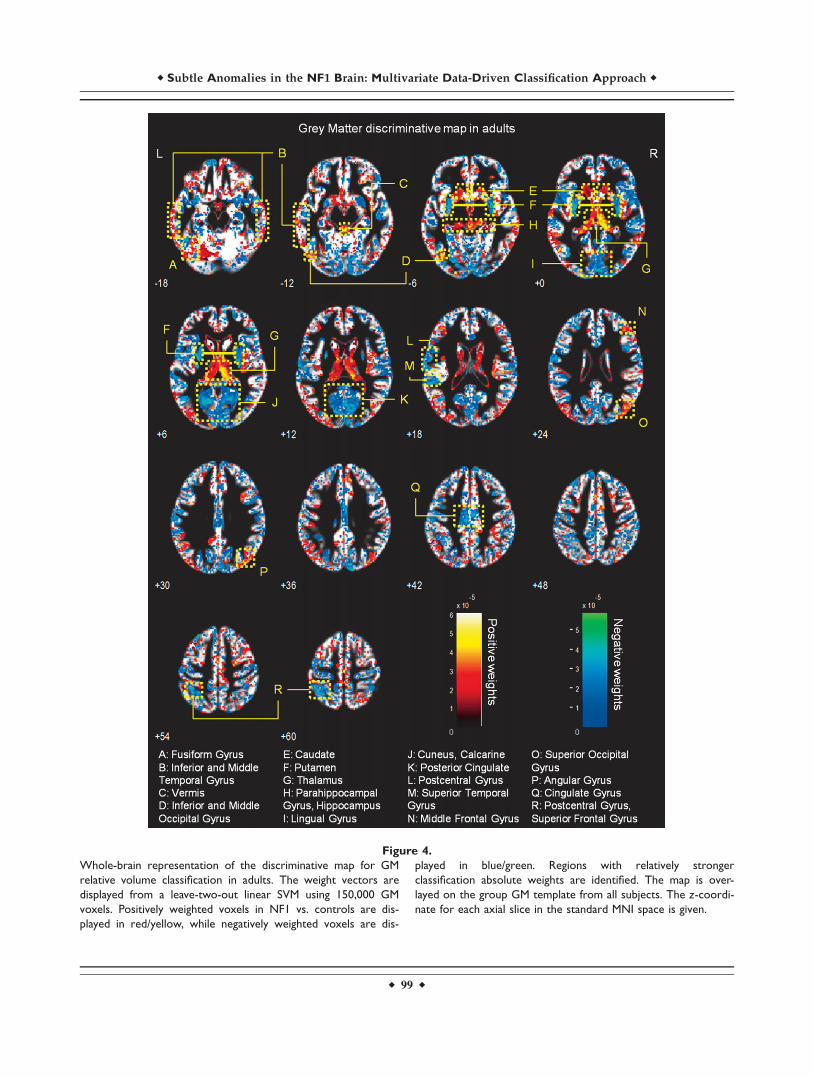
Figure 4.
Whole-brain representation of the discriminative map for GM
relative volume classification in adults. The weight vectors are
displayed from a leave-two-out linear SVM using 150,000 GM
voxels. Positively weighted voxels in NF1 vs. controls are dis-
played in red/yellow, while negatively weighted voxels are dis-
played in blue/green. Regions with relatively stronger
classification absolute weights are identified. The map is over-
layed on the group GM template from all subjects. The z-coordi-
nate for each axial slice in the standard MNI space is given.
r Subtle Anomalies in the NF1 Brain: Multivariate Data-Driven Classification Approach r
r 99 r
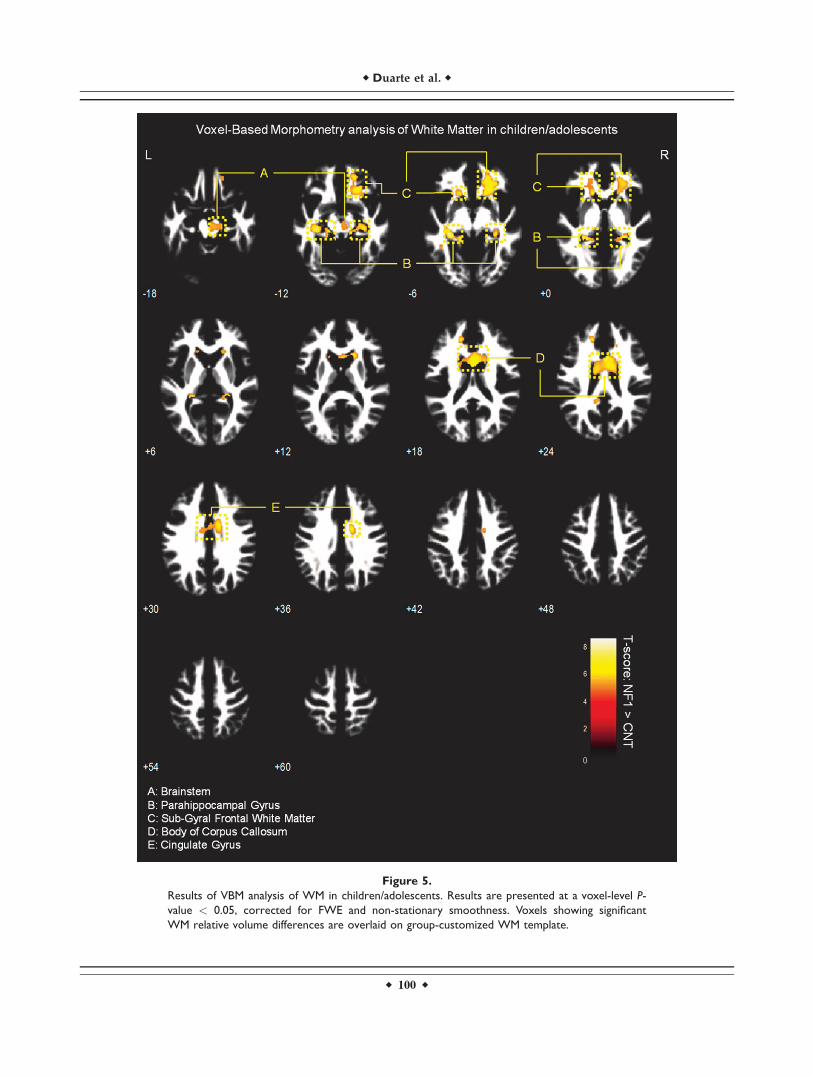
Figure 5.
Results of VBM analysis of WM in children/adolescents. Results are presented at a voxel-level P-
value < 0.05, corrected for FWE and non-stationary smoothness. Voxels showing significant
WM relative volume differences are overlaid on group-customized WM template.
r Duarte et al. r
r 100 r
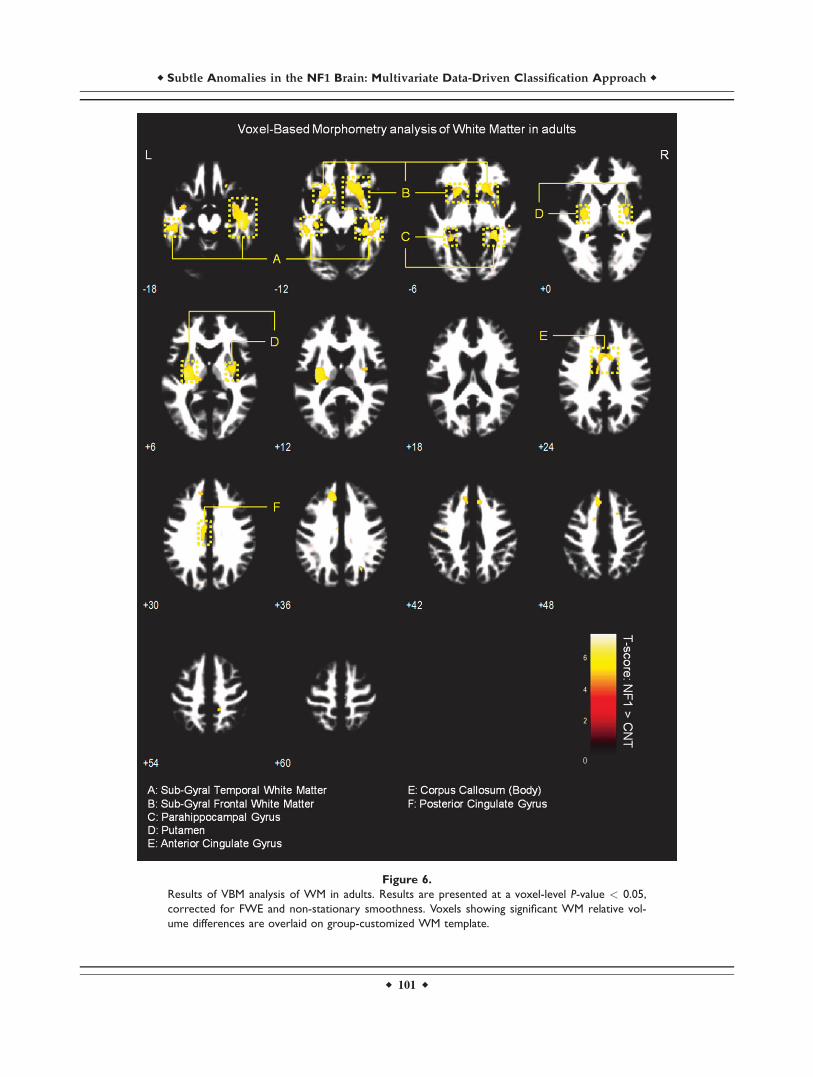
Figure 6.
Results of VBM analysis of WM in adults. Results are presented at a voxel-level P-value < 0.05,
corrected for FWE and non-stationary smoothness. Voxels showing significant WM relative vol-
ume differences are overlaid on group-customized WM template.
r Subtle Anomalies in the NF1 Brain: Multivariate Data-Driven Classification Approach r
r 101 r
White matter VBM results
We observed significantly higher WM relative volume inindividuals with NF1 compared to controls in the regionsadjacent to the lingual gyrus, cingulate gyrus, temporalgyrus, parahippocampal gyrus, and in the body of the cor-pus callosum (voxel-level FWE corrected P < 0.05). We alsofound WM relative volume increases in brainstem of NF1children/adolescents and near the putamen of NF1 adults(see Figs. 5 and 6 and Supporting Information Table SI).
Grey Matter VBM results
No significant between-group (NF1 vs. Control) differen-ces in GM relative volume of either children/adolescents oradults were observed when correcting for multiple compari-sons at the voxel-level (FWE P < 0.05). Nonetheless, the ex-ploratory analysis of uncorrected univariate VBM maps ofGM also revealed regions, mainly with GM relative volumedeficits in the NF1 groups, covered by the multivariate SVMdiscriminative maps. These were the vermis, hippocampus,lingual gyrus, and the cuneus. Lower relative GM volumewas also detectable bilaterally in the insula of children/ado-lescents with NF1. On the other hand, in accordance with themultivariate analysis, the thalamus was identified withhigher GM relative volume in NF1 children/adolescents andadult participants (see Supporting Information Figs. 1 and 2).
Correlation of SVM output with neuropsychological
measures
We computed the correlation of the SVM test marginswith Full-scale IQ (for children/adolescents), Raven matri-ces scores (an indication of non-verbal intelligence foradults), and JLO scores (a measure of visuospatial per-formance consistently impaired in patients with NF1). Forall these measures, we found univariate significant differ-ences between clinical groups (NF1 vs. Controls, P < 0.05).We computed the correlations including the examplesfrom both classes (NF1 and Controls) and we did not findany significant correlation between the neuropsychologicalmeasurements and the output of the SVM (distance ofeach example to the separating boundary).
DISCUSSION
This study is, to our knowledge, the first to use multi-variate pattern analysis of whole-brain GM and WM volu-metric segments of structural MRI scans in individualswith NF1. Linear SVM were able to correctly discriminatebetween NF1 and control images with high accuracy basedon T1-weighted anatomical images in two different popu-lations, children/adolescents and adults. The high classifi-cation performance demonstrates that the SVM is apowerful method to predict group separation. Addition-ally, it confirms the presence of neuroanatomical differen-ces between individuals with NF1 and controls.
Macrocephaly, associated with bigger brain global vol-umes, is commonly found in individuals with NF1 [Payneet al., 2010]. Indeed, in our cohorts, we also found differ-ences in global brain volume measures (Table II). How-ever, our aim was to determine whether patients with NF1could be discriminated based on local relative volumeanomalies that could be related to the cognitive profile ofthese patients. Thus, we discarded global brain volumedifferences between the groups, by only applying nonlin-ear modulation to the data. Note that, in the preprocessingof the data, the normalization applied to the whole braindoes not introduce a biased intensification of the localeffects [Ashburner, 2009; Ashburner and Friston, 2000].Thus, global volume differences are not a likely explana-tion for the distributed discriminative patterns found (infact GM global differences are even absent in our childrencohort) suggesting that different brain regions are affectedby the disease in different ways.
Our data driven analysis allowed the identification ofabnormal structural patterns that may be relevant tounderstanding disease mechanisms. In our sample, the tra-ditional VBM analysis detected no significant between-group differences in GM relative volumes after correctingfor multiple comparisons. Furthermore, only few signifi-cant differences were identified in WM maps. This sup-ports the idea that the univariate nature of the VBMmethod makes subtle or distributed differences hard tofind [Ecker et al., 2010; Marzelli et al., 2011], possibly as aconsequence of the necessary smoothing step in VBM.This step ensures the normality of the data for statisticalanalysis and it inevitably produces loss of spatial resolu-tion. Nonetheless, the spatial maps of WM as well as theuncorrected exploratory analysis of GM were in agreementwith the multivariate discrimination results.
Unlike VBM, which considers each voxel as a spatiallyindependent unit, SVM is a multivariate technique. Due tothe method inputs and preprocessing steps, the discrimi-native maps should be interpreted as spatially distributednetworks of local relative volume differences rather thanstrong claims about effects in individual regions. The SVMdiscriminative map contains information about the relativeimportance of each voxel to the classification but its inter-pretation needs to be done with caution. We do not claimany specific region to be individually responsible for a cer-tain phenotypic feature but we note its contribution to themulti-part neuroanatomical pattern. Voxels with positive/negative high weights in the multivariate analysis arelikely to present true higher/lower relative tissue volumein NF1 group but other scenarios are also possible. Thecombination with VBM analysis is thus useful to confirmwhether local volumetric differences are consistent withthe discriminative pattern.
It is worth to note, as a limitation of this study, that, dueto the nature of the MR signal, besides pure volumetric dif-ferences our results could also reflect differences in tissuecontent that might give rise to differences in signal T1 prop-erties. These differences could lead the segmentation
r Duarte et al. r
r 102 r
algorithm to interpret signal intensity differences as volu-metric differences and miss-assign these as more/less tissuevolume. Thus, the differences in discriminative maps couldalso arise, at least in part, from different water content inGM and WM, different myelin composition or myelin thick-ness, different neural or neuropil density, or different neuralsize between groups. Recent diffusion weighted imagingand diffusion tensor imaging (DWI/DTI) data in NF1 isconsistent with this notion [Wignall et al., 2010; Zamboniet al., 2007]. Further investigation is needed to elucidate thisissue. Nevertheless, even if the discriminative voxels do notrepresent true differences in relative volume they still pointout regions with structural alterations and provide startingpoints for localized investigations (e.g., ROI - Region of In-terest - analysis). Accordingly, we discuss the plausibleinfluence of these regions, as constituents of a complex net-work, to the phenotypic profile in NF1.
Distributed Neuroanatomical Networks
Discriminating NF1 Brains
Regarding WM, discriminative maps show mainly posi-tively weighted voxels discriminating between NF1 andcontrols mostly located in frontal, temporal, and occipitalregions and were detected also with voxel-wise VBM, sug-gesting that these differences are more pronounced thanGM anomalies. Our data span regions such as corpus cal-losum (genu, body, and splenium) in children/adolescentswhich corroborates other morphometric findings in childrenwith NF1 [Cutting et al., 2000; Dubovsky et al., 2001; Kaylet al., 2000; Moore et al., 2000; Steen et al., 2001]. Also ourVBM results of higher local relative WM volume are in ac-cordance with the sign of the weights attributed by SVM tothese regions. Increased callosal volume has been found tobe related to low IQ, impaired visuospatial, and motor skillsand learning problems in NF1 children [Moore et al., 2000;Pride et al., 2010]. In line with our results, it is also knownthat besides being larger than normal, the NF1 corpus cal-losum has abnormal microstructure as measured by DTI,most likely compromising callosal function [Wignall et al.,2010; Zamboni et al., 2007]. Our data revealed abnormalstructure in other strongly weighted WM voxels, such aspremotor and frontal WM regions. We further detectedincreased relative volume of frontal WM in NF1 brain withVBM. These findings are also in accordance with other mor-phometric NF1 studies reporting significant increases in cer-ebral WM volume, predominantly in frontal regions of thebrain [Cutting et al., 2000; Greenwood et al., 2005]. The fron-tal cortex is involved in executive function, abnormal inpatients with NF1 [Levine et al., 2006; Roy et al., 2010].Thus, this deficit might be related to abnormal connectivityin the frontal lobe. Noteworthy, frontal WM was also foundto have abnormal microstructure in a previous DTI study[Zamboni et al., 2007]. The concordance of our findings withprevious reports using different approaches, suggest con-sistent frontal WM structural anomalies in NF1.
We could also identify positive and negative weightedWM discriminative voxels in the temporal lobe, in a regioncrossed by the superior longitudinal fasciculus, a majorassociative intrahemispheric fiber tract that connects pari-eto-temporal association areas with the frontal lobe and viceversa [Makris et al., 2005]. Structural abnormalities in thispathway suggest associative memory deficits. In addition,we observed positively weighted WM voxels in a region ofthe temporal lobe that might comprise part of the posteriorthalamic radiation, a projection fiber from the posterior partof the thalamus to the occipital cortex, which also includesthe optic radiation [Cheon et al., 2011; Wakana et al., 2004].These results are consistent with visual and/or memorydeficits found in individuals with NF1.
We have identified more complex discriminative pat-terns of differences in GM voxels. As discussed before,their interpretation benefits from joint consideration ofother methods. However, in our study we did not findstatistically significant voxel-wise relative volume differen-ces with VBM analysis of GM relative volume. Neverthe-less, with pattern recognition we have identified regions,as part of a complex network important for patient classifi-cation, which could potentially underlie the cognitiveproblems that are commonly found in NF1, such as defi-cient visuospatial function, memory, executive function,and motor function.
Visuospatial deficits are considered the hallmark of thecognitive profile of NF1 [Levine et al., 2006]. Notably, wefound between-group differences in discriminative pat-terns including the visual cortex; the parahippocampalgyrus, involved in visual navigation [Epstein, 2008]; theangular gyrus, involved in high-level vision [Seghier et al.,2010]; and the pulvinar nucleus of the thalamus, whichwas also detected with uncorrected exploratory VBM anal-ysis, involved in visual attention [Smith et al., 2009]. Con-current alteration of these structures might thereforeunderlie the visuospatial deficits observed in the NF1 pop-ulation. Memory deficits in NF1þ/� mice are related toabnormal physiology of the hippocampus [Costa andSilva, 2003; Costa et al., 2002; Cui et al., 2008; Donarumet al., 2006; Park et al., 2009]. Notably, in our study weobserved positively weighted GM discriminative voxels inthis structure in participants with NF1. In addition, VBMalso revealed (below corrected statistical significance) uni-variate local differences in this region with patients withNF1 showing higher relative GM volume than controls. Asthe hippocampus plays an important role in visual andspatial learning and memory function [Morgado-Bernal,2011], affected in patients with NF1 [Levine et al., 2006],our results suggest a structural hippocampal abnormalityunderlying these deficits. Thus, our findings of abnormalstructure in the hippocampus are suggestive of its non-optimal functioning and implicate for the first time thisstructure in the human NF1, in line with the findings fromthe animal model.
Our findings of generalized discriminant contribution ofvoxels in the thalamus are in line with previous studies
r Subtle Anomalies in the NF1 Brain: Multivariate Data-Driven Classification Approach r
r 103 r
reporting abnormal thalamic function and metabolic con-tent in patients with NF1 [Barbier et al., 2011; Kaplanet al., 1997; Wang et al., 2000]. The thalamus, acting as arelay station, receives sensory information and projects toseveral areas of the cortex, including the frontal cortex(involved in executive function) and the visual cortex.Indeed, global thalamic dysfunction can lead to memoryproblems, sensory perception deficits, and executive dys-function, all being features of NF1 [Barbier et al., 2011;Hyman et al., 2007; Levine et al., 2006; Moore et al., 1996;Roy et al., 2010]. Furthermore, we observed between-groupdifferences in the caudate nucleus and the putamen, theformer involved in goal oriented and executive functionand the latter in motor planning and implementation ofautomatic routines. Interestingly, reduced striatal dopa-mine levels have been linked to attentional deficits in anNF1 mouse model [Brown et al., 2010]. In addition, ahuman study reported clusters of dysplastic cells in thecaudate nucleus and putamen of individuals with NF1[Yokota et al., 2008]. Our results further support thehypothesis that these structures have abnormal constitu-tion and might contribute to the executive and motordysfunction in NF1. Also parts of the cerebellum wereobserved to contribute to the discriminative pattern of GMdifferences in the children with NF1 involved in thisstudy. Our findings thus suggest that the basis of themotor deficits in NF1 population could be an abnormalstructural network including this brain region [Puttemanset al., 2005]. However, the interpretation of such complexpatterns in terms of region-specific differences must becautious, particularly regarding heterogeneous samples.
In the present study, we did not find a significant corre-lation of cognitive impairment measures with the SVMoutput (distance from each example and the separatingboundary). On the one hand, this lack of correlation mightreflect the fact that neuropsychological measures are gen-erally associated with large coefficients of variation. Fur-thermore, the association of brain tissue volumes with IQis still controversial, even in studies with large samples[see e.g. Brain Development Cooperative Group, 2012]. Onthe other hand, cognitive deficits in patients with NF1might be more closely related with abnormal functionthan with structural anomalies. Finally, it should be takeninto account that care must be taken when using the testmargin to correlate with behavioral variables given thatthe test margin depends crucially on the training margin[Marquand et al., 2010]. The SVM algorithm employed inour study was based on the binary separation betweenpatients with NF1 and the control group. In this type ofapproach, the test margins therefore ignore specific cogni-tive profiles [Ecker et al., 2010].
CONCLUSION
This work showed that SVMs, in the context of a multi-variate pattern analysis of whole-brain T1-weighted struc-
tural images, can be used to distinguish betweenindividuals diagnosed with NF1 and control participantson the basis of neuroanatomical differences. Furthermore,this data-driven analysis indicated biologically plausible,spatially distributed networks of brain regions with abnor-mal structure in individuals with NF1 providing importantclues for the pathophysiology of the cognitive phenotypeassociated with this disorder. A causal link still remainshowever to be established as it could also be that abnor-mal function of these areas lead to abnormal developmentof structure and not the other way around.
ACKNOWLEDGMENTS
Authors thank the NF1 participants and their families,as well as all the control subjects that participated in thisstudy. Authors also thank Carlos Ferreira and Joao Mar-ques for help with MRI scanning.
REFERENCES
Ashburner J (2007): A fast diffeomorphic image registration algo-rithm. NeuroImage 38:95–113.
Ashburner J (2009): Computational anatomy with the SPM soft-ware. Magn Reson Imaging 27:1163–1174.
Ashburner J, Friston KJ (2000): Voxel-based morphometry—Themethods. NeuroImage 11:805–821.
Ashburner J, Friston KJ (2005): Unified segmentation. NeuroImage26:839–851.
Barbier C, Chabernaud C, Barantin L, Bertrand P, Sembely C, Siri-nelli D, Castelnau P, Cottier JP (2011): Proton MR spectro-scopic imaging of basal ganglia and thalamus inneurofibromatosis type 1: Correlation with T2 hyperintensities.Neuroradiology 53:141–148.
Benton AL, Varney NR, Hamsher KD (1978): Visuospatial judg-ment. A clinical test. Arch Neurol 35:364–367.
Billingsley RL, Schrimsher GW, Jackson EF, Slopis JM, Moore BDIII (2002): Significance of planum temporale and planum parie-tale morphologic features in neurofibromatosis type 1. ArchNeurol 59:616–622.
Brain Development Cooperative Group (2012): Total and regionalbrain volumes in a population-based normative sample from 4to 18 years: The NIH MRI study of normal brain development.Cereb Cortex: 22.
Bray S, Chang C, Hoeft F (2009): Applications of multivariate pat-tern classification analyses in developmental neuroimaging ofhealthy and clinical populations. Front Hum Neurosci 3:32.
Brown JA, Emnett RJ, White CR, Yuede CM, Conyers SB, O’MalleyKL, Wozniak DF, Gutmann DH (2010): Reduced striatal dopa-mine underlies the attention system dysfunction in neurofibro-matosis-1 mutant mice. Hum Mol Genet 19:4515–4528.
Buckner RL, Head D, Parker J, Fotenos AF, Marcus D, Morris JC,Snyder AZ (2004): A unified approach for morphometric andfunctional data analysis in young, old, and demented adultsusing automated atlas-based head size normalization: Reliabil-ity and validation against manual measurement of total intra-cranial volume. Neuroimage 23:724–738.
Chang YW, Lin CJ (2008): Feature ranking using linear SVM. InJMLR: Workshop and Conference Proceedings, Hong-Kong,3:53–64.
r Duarte et al. r
r 104 r
Cheon KA, Kim YS, Oh SH, Park SY, Yoon HW, Herrington J,Nair A, Koh YJ, Jang DP, Kim YB, Leventhal BL, Cho ZH, Cas-tellanos FX, Schultz RT (2011): Involvement of the anterior tha-lamic radiation in boys with high functioning autism spectrumdisorders: A Diffusion Tensor Imaging study. Brain Res1417:77–86.
Clements-Stephens AM, Rimrodt SL, Gaur P, Cutting LE (2008):Visuospatial processing in children with neurofibromatosistype 1. Neuropsychologia 46:690–697.
Costa RM, Silva AJ (2003): Mouse models of neurofibromatosistype I: Bridging the GAP. Trends Mol Med 9:19–23.
Costa RM, Federov NB, Kogan JH, Murphy GG, Stern J, Ohno M,Kucherlapati R, Jacks T, Silva AJ (2002): Mechanism for thelearning deficits in a mouse model of neurofibromatosis type1. Nature 415:526–530.
Cristianini N, Shawe-Taylor J (2000): An introduction to SupportVector Machines and Other Kernel-Based Learning Methods.Cambridge: Cambridge University Press.
Cui Y, Costa RM, Murphy GG, Elgersma Y, Zhu Y, Gutmann DH,Parada LF, Mody I, Silva AJ (2008): Neurofibromin regulationof ERK signaling modulates GABA release and learning. Cell135:549–560.
Cutting LE, Koth CW, Burnette CP, Abrams MT, Kaufmann WE,Denckla MB (2000): Megalencephaly in NF1: Predominantlywhite matter contribution and mitigation by ADHD. J ChildNeurol 15:157–160.
Cutting LE, Cooper KL, Koth CW, Mostofsky SH, Kates WR,Denckla MB, Kaufmann WE (2002): Megalencephaly in NF1:Predominantly white matter contribution and mitigation byADHD. Neurology 59:1388–1394.
Daston MM, Ratner N (1992): Neurofibromin, a predominantlyneuronal GTPase activating protein in the adult, is ubiqui-tously expressed during development. Dev Dyn 195:216–226.
De Winter AE, Moore BD III, Slopis JM, Ater JL, Copeland DR(1999): Brain tumors in children with neurofibromatosis: Addi-tional neuropsychological morbidity? Neuro Oncol 1:275–281.
Donarum EA, Halperin RF, Stephan DA, Narayanan V (2006):Cognitive dysfunction in NF1 knock-out mice may result fromaltered vesicular trafficking of APP/DRD3 complex. BMCNeurosci 7:22.
Dubovsky EC, Booth TN, Vezina G, Samango-Sprouse CA, PalmerKM, Brasseux CO (2001): MR imaging of the corpus callosumin pediatric patients with neurofibromatosis type 1. AJNR AmJ Neuroradiol 22:190–195.
Ecker C, Rocha-Rego V, Johnston P, Mourao-Miranda J, MarquandA, Daly EM, Brammer MJ, Murphy C, Murphy DG, MRCAIMS Consortium (2010): Investigating the predictive value ofwhole-brain structural MR scans in autism: A pattern classifi-cation approach. NeuroImage 49:44–56.
Epstein RA (2008): Parahippocampal and retrosplenial contribu-tions to human spatial navigation. Trends Cogn Sci 12:388–396.
Golland P, Fischl B (2003): Permutation tests for classification:Towards statistical significance in image-based studies. LectNotes Comput Sci 2732:330–341.
Greenwood RS, Tupler LA, Whitt JK, Buu A, Dombeck CB, HarpAG, Payne ME, Eastwood JD, Krishnan KRR, MacFall JR(2005): Brain morphometry, T2-weighted hyperintensities, andIQ in children with neurofibromatosis type 1. Arch Neurol62:1904–1908.
Gutmann DH, Geist RT, Wright DE, Snider WD (1995): Expressionof the neurofibromatosis 1 (NF1) isoforms in developing andadult rat tissues. Cell Growth Differ 6:315–323.
Hayasaka S, Phan KL, Liberzon I, Worsley KJ, Nichols TE (2004):Nonstationary cluster-size inference with random field andpermutation methods. NeuroImage 22:676–687.
Hoeft F, Lightbody AA, Hazlett H, Patnaik S, Piven J, Reiss AL(2008): Morphometric spatial patterns differentiate fragile Xsyndrome, typical developing and developmentally delayedboys of ages one to three. Arch Gen Psychiatry 65:1087–1097.
Hyman SL, Shores EA, North KN (2005): The nature and fre-quency of cognitive deficits in children with neurofibromatosistype 1. Neurology 65:1037–1044.
Hyman SL, Shores EA, North KN (2006): Learning disabilities inchildren with neurofibromatosis type 1: Subtypes, cognitiveprofile, and attention-deficit-hyperactivity disorder. Dev MedChild Neurol 48:973–977.
Hyman SL, Gill DS, Shores EA, Steinberg A, North KN (2007): T2hyperintensities in children with neurofibromatosis type 1 andtheir relationship to cognitive functioning. J Neurol NeurosurgPsychiatry 78:1088–1091.
Kaplan J, Meyer K (2012): Multivariate pattern analysis revealscommon neural patterns across individuals during touch ob-servation. Neuroimage 60:204–212.
Kaplan AM, Chen K, Lawson MA, Wodrich DL, Bonstelle CT,Reiman EM (1997): Positron emission tomography in childrenwith neurofibromatosis-1. J Child Neurol 12:499–506.
Kayl AE, Moore BD III (2000): Behavioral phenotype of neurofi-bromatosis, type 1. Ment Retard Dev Disabil 6:117–124.
Kayl AE, Moore BD III, Slopis JM, Jackson EF, Leeds NE (2000):Quantitative morphology of the corpus callosum in childrenwith neurofibromatosis and attention-deficit hyperactivity dis-order. J Child Neurol 15:90–96.
Kloppel S, Stonnington CM, Chu C, Draganski B, Scahill RI,Rohrer JD, Fox NC, Jack CR Jr, Ashburner J, Frackowiak RSJ(2008): Automatic classification of MR scans in Alzheimer’sdisease. Brain 131:681–689.
Lee DY, Yeh TH, Emnett RJ, White CR, Gutmann DH (2010): Neu-rofibromatosis-1 regulates neuroglial progenitor proliferationand glial differentiation in a brain region-specific manner.Genes Dev 24:2317–2329.
Levine TM, Materek A, Abel J, O’Donnell M, Cutting LE (2006):Cognitive profile of neurofibromatosis type 1. Semin PediatrNeurol 13:8–20.
Makris N, Kennedy DN, McInerney S, Sorensen AG, Wang R,Caviness VS, Pandya DN (2005): Segmentation of subcompo-nents within the superior longitudinal fascicle in humans: Aquantitative, in vivo, DT-MRI study. Cereb Cortex 15:854–869.
Marquand A, Howard M, Brammer M, Chu C, Coen S, Mourao-Miranda J (2010): Quantitative prediction of subjective pain in-tensity from whole-brain fMRI data using Gaussian processes.Neuroimage 49:2178–2189.
Marzelli MJ, Hoeft F, Hong DS, Reiss AL (2011): Neuroanatomicalspatial patterns in Turner syndrome. NeuroImage 55:439–447.
Mietchen D, Gaser C (2009): Computational morphometry fordetecting changes in brain structure due to development,aging, learning, disease and evolution. Front Neuroinform3:25.
Moore BD III, Ater JL, Needle MN, Slopis J, Copeland DR (1994):Neuropsychological profile of children with neurofibromatosis,brain tumor, or both. J Child Neurol 9:368–377.
Moore BD III, Slopis JM, Schomer D, Jackson EF, Levy BM(1996): Neuropsychological significance of areas of high signalintensity on brain MRIs of children with neurofibromatosis.Neurology 46:1660–1668.
r Subtle Anomalies in the NF1 Brain: Multivariate Data-Driven Classification Approach r
r 105 r
Moore BD III, Slopis JM, Jackson EF, De Winter AE, Leeds NE(2000): Brain volume in children with neurofibromatosis type 1:Relation to neuropsychological status. Neurology 54:914–920.
Morgado-Bernal I (2011): Learning and memory consolidation:Linking molecular and behavioral data. Neuroscience 176:12–19.
Neurofibromatosis. Conference statement. National Institutes ofHealth Consensus Development Conference (1988): Arch Neu-rol 45:575–578.
North KN (2000): Neurofibromatosis type 1. Am J Med Genet97:119–127.
Park CS, Zhong L, Tang SJ (2009): Aberrant expression of synapticplasticity-related genes in the NF1/ mouse hippocampus. JNeurosci Res 87:3107–3119.
Payne JM, Moharir MD, Webster R, North KN (2010): Brain struc-ture and function in neurofibromatosis type 1: Current con-cepts and future directions. J Neurol Neurosurg Psychiatry81:304–309.
Pereira F, Botvinick M (2011): Information mapping with patternclassifiers: A comparative study. Neuroimage 56:476–496.
Pereira F, Mitchell T, Botvinick M (2009): Machine learning classi-fiers and fMRI: A tutorial overview. NeuroImage 45:S199–S209.
Pride N, Payne JM, Webster R, Shores EA, Rae C, North KN (2010):Corpus callosum morphology and its relationship to cognitivefunction in neurofibromatosis type 1. J Child Neurol 25:834–841.
Puttemans V, Wenderoth N, Swinnen SP (2005): Changes in brainactivation during the acquisition of a multifrequency bimanualcoordination task: From the cognitive stage to advanced levelsof automaticity. J Neurosci 25:4270–4278.
Raven JC (1947): Raven’s Advanced Progressive Matrices APMSet I. Oxford: Oxford Psychologists Press.
Ribeiro MJ, Violante IR, Bernardino I, Ramos F, Saraiva J, ReviriegoP, Upadhyaya M, Silva ED, Castelo-Branco M (2012): Abnormalachromatic and chromatic contrast sensitivity in neurofibroma-tosis type 1. Invest Ophthalmol Vis Sci 53:287–293.
Roy A, Roulin JL, Charbonnier V, Allain P, Fasotti L, Barbarot S,Stalder JF, Terrien A, Gall DL (2010): Executive dysfunction inchildren with neurofibromatosis type 1: A study of actionplanning. J Int Neuropsychol Soc 16:1056–1063.
Schrimsher GW, Billingsley RL, Slopis JM, Moore BD III (2003):Visual-spatial performance deficits in children with neurofibro-matosis type-1. Am J Med Genet A 120:326–330.
Seghier ML, Fagan E, Price CJ (2010): Functional subdivisions inthe left angular gyrus where the semantic system meets anddiverges from the default network. J Neurosci 30:16809–16817.
Smith AT, Cotton PL, Bruno A, Moutsiana C (2009): Dissociatingvision and visual attention in the human pulvinar. J Neuro-physiol 101:917–925.
Steen RG, Taylor JS, Langston JW, Glass JO, Brewer VR, ReddickWE, Mages R, Pivnick EK (2001): Prospective evaluation of thebrain in asymptomatic children with neurofibromatosis type 1:Relationship of macrocephaly to T1 relaxation changes andstructural brain abnormalities. AJNR Am J Neuroradiol22:810–817.
Tonsgard JH (2006): Clinical manifestations and management ofneurofibromatosis type 1. Semin Pediatr Neurol 13:2–7.
Wakana S, Jiang H, van Zijl PCM, Mori S (2004): Fiber tract-basedatlas of human white matter anatomy. Radiology 230:77–87.
Wang PY, Kaufmann WE, Koth CW, Denckla MB, Barker PB(2000): Thalamic involvement in neurofibromatosis type 1:Evaluation with proton magnetic resonance spectroscopicimaging. Ann Neurol 47:477–484.
Wechsler D (2003): Escala de Inteligencia de Wechsler para Crian-cas—Terceira Edicao (WISC-III): Manual. Lisboa: CEGOC-Tea.
Wignall EL, Griffiths PD, Papadakis NG, Wilkinson ID, Wallis LI,Bandmann O, Cowell PEE, Hoggard N (2010): Corpus cal-losum morphology and microstructure assessed using struc-tural MR imaging and diffusion tensor imaging: Initialfindings in adults with neurofibromatosis type 1. AJNR Am JNeuroradiol 31:856–861.
Wilke M, Holland SK, Altaye M, Gaser C (2008): Template-O-Matic: A toolbox for creating customized pediatric templates.NeuroImage 41:903–913.
Worsley KJ, Andermann M, Koulis T, MacDonald D, Evans AC(1999): Detecting changes in nonisotropic images. Hum BrainMapp 8:98–101.
Yokota O, Tsuchiya K, Hayashi M, Kakita A, Ohwada K, IshizuH, Takahashi H, Akiyama H (2008): Glial clusters and peri-neuronal glial satellitosis in the basal ganglia of neurofibroma-tosis type 1. Acta Neuropathol 116:57–66.
Zamboni SL, Loenneker T, Boltshauser E, Martin E, Il’yasov KA(2007): Contribution of diffusion tensor MR imaging in detect-ing cerebral microstructural changes in adults with neurofibro-matosis type 1. AJNR Am J Neuroradiol 28:773–776.
Zhu Y, Harada T, Liu L, Lush ME, Guignard F, Harada C, BurnsDK, Bajenaru ML, Gutmann DH, Parada LF (2005): Inactiva-tion of NF1 in CNS causes increased glial progenitor prolifer-ation and optic glioma formation. Development 132:5577–5588.
r Duarte et al. r
r 106 r
Top Related
Copyright © 2022 FDOKUMEN

