


Bahasa
Halaman
Hukum


Ple
ase
note
that
this
is a
n au
thor
-pro
duce
d P
DF
of a
n ar
ticle
acc
epte
d fo
r pub
licat
ion
follo
win
g pe
er re
view
. The
def
initi
ve p
ublis
her-a
uthe
ntic
ated
ver
sion
is a
vaila
ble
on th
e pu
blis
her W
eb s
ite
1
Marine Geology Vol. 234, Issues 1-4 , 18 Dec. 2006, Pages 159-177 http://dx.doi.org/10.1016/j.margeo.2006.09.025 © 2006 Elsevier B.V. All rights reserved
Archimer, archive institutionnelle de l’Ifremerhttp://www.ifremer.fr/docelec/
Morphological changes and sedimentary processes induced by the December 2003 flood event at the present mouth of the Grand Rhône
River (southern France)
Grégoire M. Mailleta,b *, Claude Vellaa, Serge Bernéc, Patrick L. Friendd, Carl L. Amosd, Thomas J., Fleurya and Alain Normandc
a CEREGE, UMR CNRS 6635, Université de Provence Aix-Marseille 1, P.O. Box 80, 13580 Aix en Pce cedex 04, FR b Laboratoire « Paysages et Biodiversité », Université d’Angers, UFR Sciences, 2 Bd Lavoisier, 49045 Angers, FR. c IFREMER, DRO/GM, P.O. Box 70, 29280 Plouzané, FR d School of Ocean and Earth Science, National Oceanography Centre Southampton, Southampton, SO14 3ZH, UK * Corresponding author: Tel : 33 241 735 288 ; Fax : 33 241 735 352 ; Email addresses: [email protected], [email protected], [email protected], [email protected], [email protected], [email protected], [email protected]
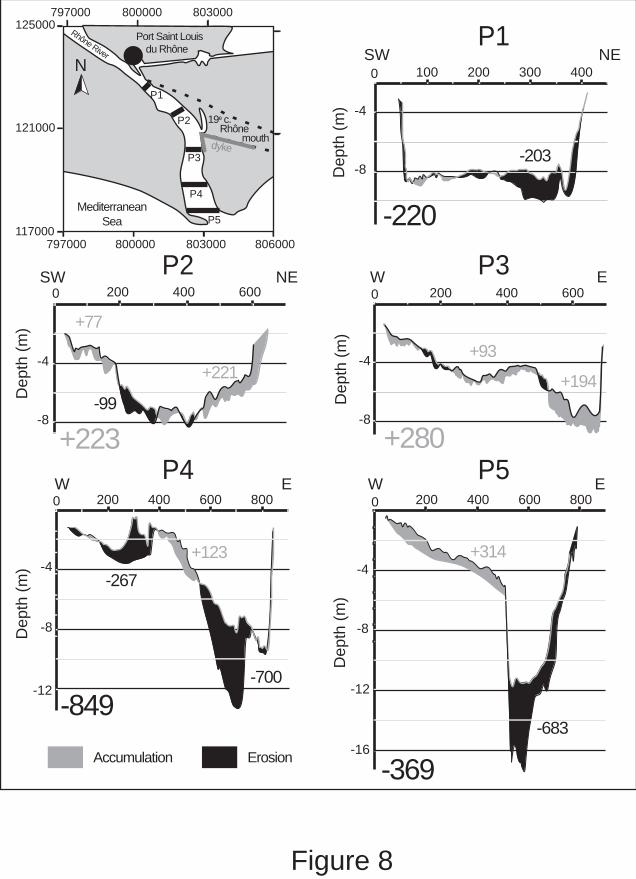
Abstract: The study, which is based on repetitive bathymetric surveys, assesses changes and effects of one of the most important floods recorded in the Rhône Delta area: bottom morphology and sediment distribution in the Rhône outlet after the December 2003 flood are discussed by comparison between Digital Terrain maps (DTMs) of November 2003 and January 2004. The post-flood morphology shows that the whole of the system is active, mainly in the east. The channel of the Rhône has been hollowed out on the left bank by more than 5 m, the eastern coast of the mouth has retreated 400 m, the mouth-bar has prograded 200 m and the slope of the delta front has increased by 0.19°. The overlay of pre- and post-flood DTMs makes it possible to estimate the total volume deposited in the [0 to − 20 m] zone as + 7.8 × 10⁶ m3 (i.e. 0.88 m3 m− 2), which corresponds to 4 × 10⁶ t of sediment. These values are compared with the average annual volume of 0.47 × 10⁶ m3 yr− 1 of sediment deposited in this zone between 1995 and 2003, as well as the average sediment load estimated at the Arles station (50 km upstream) for this flood event (3.1 × 10⁶ t to 5.3 × 10⁶ t). The acquisition of bathymetric measurements immediately before and after a major flood allows more than a simple morphological description; in addition, an analysis of the solid load transfer processes towards the prodelta is achievable. Three mechanisms are highlighted. Most of the material eroded in the channel and supplied to the delta front corresponds to fine sediment that drape homogeneously over the pre-flood morphology of the delta front. The transit of the coarsest sediment (primarily sand) is slowed down in the channel of the Rhône: this sediment builds up in relatively small areas, leading to the formation of gullies on the prodelta slope. The gullies have fixed positions and disappear gradually towards the west, following the progressive migration of the active band towards the east. These old features are not reactivated by floods occurring after their formation. During the flood, only a small volume of coarse sediment bypasses through the gullies, and the fine deposits are remobilised rapidly or compacted. Flood input concerns essentially the delta front, which traps 90% of the fluvial solid discharge between 0 and 20 m depth. The coarse prodelta supply is then due mainly to mass movements of unconsolidated material deposited beforehand on the top of the delta front. Consequently, the main nourishment of the prodelta does not occur directly during and/or immediately after a flood event, but is delayed by sediment being temporarily trapped on the delta front. Keywords: mouth-bar; delta front; prodelta; flood processes; sedimentation rate; bathymetric maps

1. Introduction The growing interest in understanding the processes of sediment transport from coastal zones to deep basins requires an improved understanding of sediment transfer mechanisms between rivers and their prodeltas during major flood events. Deposition on and beyond prodeltas is documented or hypothesised to occurs by plume fallout, nepheloid transport, currents, sediment gravity flows or submarine slides (Prior and Coleman, 1978 ; Nardin et al., 1979 ; Cacchione and Drake, 1986 ; Trincardi and Normak, 1988 ; Schwab et al., 1993; Hampton et al., 1996 . Field et al., 1999; Trincardi et al., 2004). However, little is known about the relative importance of these processes during extreme events like floods, although it is recognised that they are significant in terms of sediment supply. Regarding the Rhône River, the study of sediment transfer has focused mainly on the dispersion of suspended material (river plume), because of the low amount of coarse-grained solid discharge (Pauc, 1970; Aloisi et al, 1979; Leveau and Coste, 1987; Got and Aloisi, 1990; Zuo et al. 1997; Estournel et al, 2001; Arnoux-Chiavassa et al. 2003). However, studies of the Rhône River have been promoted recently by national and international research programs (see acknowledgements), and upgraded by recent hydrologic events of high intensity (three 50-100 year floods occurring within just two years). Thus this area of research now benefits from the convergence of considerable human and technical resources, representing a prelude to a larger study on climatic variability and sediment transport during the last 500 000 years in the North West Mediterranean (PROMESS1, Berné et al., 2004). In this paper, we present some preliminary results about the land/sea interface based on the use of bathymetric data acquired in an area extending from Port-Saint-Louis-du-Rhône, 6 km upstream from the mouth of the Grand Rhône, to the bottom of the modern prodelta at around -60 m water depth. The impact of the December 2003 flood and the transfer mechanisms of the fluvial solid load have been studied using a diachronic geomorphological approach; these results complement other research undertaken on the Rhône mouth and the Têt River areas within the EUROSTRATAFORM program, which aims to define the sediment supply mechanisms to the North Mediterranean continental margin and beyond. 2. Regional setting 2.1. General Setting The Rhône, one of the largest rivers entering the Mediterranean Sea, flows from the mountain chains of the Alps to the Mediterranean Sea, where a delta is formed at its mouth (fig 1). The Rhône river system result from a catchment area of 97 800 km² and drains alpine, oceanic and Mediterranean climatic zones. The hydrological regime of the Lower Rhône River ranges from a dominant nival-pluvial type, to a pluvial Mediterranean type with nival input (Vivian, 1989). The climate in the catchment basin is variable due to oceanic, continental and Mediterranean weather influences, with an average precipitation of 843 mm (Ludwig and Meybeck, 2003). A strong seasonal contrast controls the hydrological regime of the Rhône River that exhibits an extremely large difference between low and high water discharges (Table 1 and Fig. 2a). Because of the effects of the Mediterranean climate in some parts of the basin area, the maximum-recorded daily rainfall can be close to the mean annual rainfall. Consequently, the infilling coefficient of the river bed (liquid discharge per metre width) is around 5, and the ratio of peak discharge to mean annual discharge is high (6.5) (Estrela et al., 2001). The mean annual discharge of the Rhône River is 1710 m3 s-1
(Table 1). The discharges for flood return periods of 10-100 and 1000 years are respectively 8 390, 11 300 and 14 160 m3 s-1. Because of the high hydrological variability, 80% of the annual solid load transit occurs during 20% of the year (Roditis and Pont, 1993). The present-day riverine suspended load is estimated as 7 x 10⁶ t yr-1, with high inter-annual variations ranging between 15 and 250 % of this value (Antonelli & Provansal, 2002). The bed load transport rate before the construction of dams (1950) was estimated to vary between 2 and 5 x 10⁵ m3 yr-1, but is nowadays reckoned to be between 2.5 and 5.0 x 10⁴ m3 yr-1 (IRS, 2000), i.e. around 6,5 and 13 x 104 tons yr-1. At the present, the Grand Rhône mouth forms an outlet for 90% of the liquid flow. Maillet (2005) have estimated that a mean volume of 0.47 x 10⁶ m3 yr-1 was deposited between 0 to -20 m water depth, at the Grand Rhône mouth between 1995 and 2003. Radiogenic isotope methods yield sedimentation rates of around 20-30 cm yr-1 (Radakovitch et al., 1999) in the same zone. The remainder of the sediment supplied to the sea is transported onto the continental shelf at a mean rate of less than 0.3 cm yr-1 (Zuo et al., 1997; Radakovitch et al., 1999; Miralles et al., 2005).
2

The Rhône mouth is characterised by a tidal range of about 0.3 m, and it is influenced mainly by waves and their associated currents. The main characteristics of these waves are: Hmean = 0.72-0.82 m; Tmean = 5.01-5.23 s; H0/L0 = 0.017-0.020 (Sabatier, 2001), their closure depth is estimated to be at -20 m water depth at the Rhône mouth (Suanez, 1997). The most frequent waves (low energy) come from the SW (30% of the total regime), with heights of between 0.5 to 1 m and with periods shorter than 6 s in 80% of cases (Sabatier, 2001). Thus, the dominant longshore littoral drift direction is towards the east. The more morphogenic waves, generated by onshore winds from the SSE and SE, which can exceed 100 km h-1, come from the SSE (16% of total regime) and from the ESE (11%). These waves present high energy, with heights > 2 m in more than 40% of cases, and periods > 6 s, in more than 25% of cases. Thus, the Rhône is a wave-influenced delta (Galloway, 1975) and fits the type-8 category (mouthbar-type; low-gradient; highly stable; suspension-load river with levees) of Postma (1995). The subaerial lobe feature is expressed as a homogeneous thick sandy beach ridge (1000-1500 m wide) developed locally around the Rhône channel. According to the asymmetry index A of Bhattacharya and Giosan (2003) (A=sediment drift in m3 yr-1 / river discharge in m3 month-1), a wave-dominated mouth is symmetric when A<200. For the modern Rhône lobe system, occurring to the Sabatier (2001) estimates, A = 62.7, and the present lobe of the Rhône is symmetric. 2.2. Characteristics of the December 2003 flood period Major floods (~100 yr return period) of the Rhône River have already occurred in 1840, 1856, 1993, 1994, and 2002. However, at the beginning of December 2003 (Fig.2a), an exceptional flood occurred in the downstream part of the Rhône River. This flood is considered as one of the highest ever known in the Rhône, with a maximum river discharge estimated at around 11 000 to 12 000 m3 s-1 on the 3rd December at 03:00 GMT (Table 2). Nevertheless, it is not the intensity of the flood that gives it its exceptional character, but rather the rate of the flood increase (200 m3 s-1 h-1) and the duration of the event (62 h > 8000 m3 s-1). The flood was associated with an extensive Mediterranean-type rainstorm (Pardé, 1925), which spread over the Cevennes (31% of the total liquid flow during this event), the Rhône valley, the lower valley of the Isère, and the middle and lower valleys of the Durance (fig. 1). The Mediterranean region is characterised by instantaneous heavy precipitations, frequently reaching values around 100 mm h-1 in autumn. However, in the case of the December 2003 flood, the return period of this sort of rainfall is < 30 years. Therefore, it is more the duration and the large geographic extension of this rainfall event that made the flood significant. Moreover, the synchronous nature of the rainfall pattern, across more than 2/3 of the catchment area, was coupled with a high global runoff coefficient due to previous soil saturation caused by a rain event of at least 200 mm that occurred during the 21 – 24 November 2003 period. As a result, more than 3 x 10⁹ m3 of water transited along the Rhône River to Beaucaire in 5 days (Fig. 2a and Table 2). Concerning the parameters associated to the sea (Fig. 2c), flood event occurs during a south-eastern storm, with speeds of sea winds up to 16 m/s and with associated waves around 5 m high and 5 s period. Note the good correlation between the height of the waves and the speed of the wind during sea-storm events. The main consequences of these climatic conditions are: on one hand, the very weak seaward extension of the river plume during flood event due to the dominance of the south-eastern winds, and on the other hand, the dominance of the continental winds after the flood event (after the 5th of December) which induced extremely calm hydrodynamics conditions (the winds came from North West, except during the small storm of December the 8th, and the waves had no preferential direction). 3. Materials and methods The study area (fig 3) extends from the river channel, 6 km upstream of the mouth, to the top of the prodelta, at -20 m water depth. It was selected to allow monitoring of sediment transport processes between the fluvial and marine domains, and to link observations from the river with those from the subaqueous lobe. Weather conditions and shallow bathymetry at the mouth required the use of special equipment and research vessels. For this reason, the study area was divided into three zones (river channel, mouth bar and delta-front), taking into account the differing hydrology and morphology (fig 3). The present morphological study of the Rhône outlet began in May 2002 with the acquisition of multibeam echo-sounding and chirp data (Strataform 1 cruise) (Fig. 2b and table 3). New surveys were carried out in November 2003, during the Rhône 03 cruise, and after the December 2003 flood, in January 2004. The pre-flood survey was performed over 5 days with a coupled mono-beam / ADCP / navigation system to
3

measure bathymetry, fluvial currents and turbidity, using two shallow draught vessels. The data were corrected for water-level variations of the river measured at Port-Saint-Louis and by using the Marseille tide gauge records. During this survey, the hydrodynamic conditions were of low-energy type (mean Rhône discharge = 1200 m3 s-1, mean wave height = 0.2 m). The post-flood survey was carried out in several stages depending upon sea state and equipment availability. Although many measurements were obtained during these cruises (Table 3), only the bathymetric data and interface coring data are used here. Regarding the multibeam surveys (Strataform1, Rhoneflood, MATRhône2), to obtain total coverage of this area, the step between the bathymetric profiles was adapted to the water depth, ranging from 150 to 20 m coastwards. During both surveys DGPS was used for positioning; and depth measurements were corrected for roll, pitch and yaw of the vessel. The data acquired during the different cruises were filtered and gridded in 0.5 m bins using the Arc view® 3D Analyst extension. A triangulation interpolation method was used to provide high accuracy DTMs relative to source data density: each triangulated network was converted to raster with a cell size of 20 m. Volume calculations were carried out by subtracting the two DTMs, in the area between the shoreline and the -20 m isobath of the post-flood DTM. Changes in water depth less than 10 cm were not considered significant (Van der Wal and Pye, 2003). Mean apparent sedimentation rates, total erosion and net sedimentary budget were determined by superposition of pre- and post-flood bathymetric maps. The estimates represent only the apparent sedimentation, because the bathymetric changes do not take into account consolidation/compaction processes in the deposited sediment, and the high variability of sediment porosity. 4. Results 4.1 Pre-flood morphology 4.1.1 River channel Our study area corresponds to the downstream part of the Rhône over the lowermost 6 km of the river, below Port-Saint-Louis-du-Rhône (Fig. 3, part a). This zone represents a progressive transition between a totally artificial navigable section upstream (with bilateral embankments and dredging as far as Port-Saint-Louis-du-Rhône), and an un-navigable natural littoral zone. The width of the river in this transition zone varies from 325 to 1110 m. The maximum depth of the channel exceeds 20 m, whilst the mean river slope in this section is around 0.5 ‰ (Table 4). This area is characterised by a curvature with a sinuosity factor of 1.06, i.e. the ratio of the axial fluvial length (6325 m) to the wavelength of the curve (6715 m). Upstream of Port-Saint-Louis-du-Rhône, the Rhône is dredged permanently to enable navigation. Downstream of Port-Saint-Louis, two subaqueous channels are identified clearly on the river bed. These sub-channels are 170 m wide at the west bank and 150 m at the east bank, both with a depth of around 8 m. They are separated by a sandy levee (160 µm mean grain size) about 1 m in height. Farther downstream, the sub-channel located in the convexity (west bank) is filled in, thus reducing the width of the river section. The eastern sub-channel is incised mainly under the influence of morphologies inherited from the 19th century paleochannel of the Rhône (Maillet et al., 2005), and because of the concentration of erosive energy on the concave side of the bend. The incision trend is defined clearly, with the slope of the levee reaching 22°. The mean grain size of surface sediments at the bottom of the sub-channel reaches 20 µm. At the mouth, only the eastern sub-channel (east bank) provides an outlet for the fluvial liquid discharge. The western sub-channel is blocked completely by a sandy spit controlled by the westward longshore drift. 4.1.2. Mouth-bar In the nearshore zone, a large crescent-shaped mouth-bar extends offshore from the coastline down to 4 m water depth, thus forming the first of the marine sedimentary deposits (Fig. 3 part b; Fig. 4). This feature is characteristic of microtidal river mouths dominated by waves (Wright 1977; Postma, 1995; Cooper, 2001). The mouth-bar consists of a shallow-water platform showing an asymmetrical topography in cross-section, with a gentle slope upstream and a steeper slope seaward (Table 4, Fig. 3 part b). The mean surface sediment grain-size of this zone is 270 µm, with a large variability between 120 µm and 430 µm. In this zone, two domains with distinct behaviours can be differentiated. The western domain is relatively stable and influenced mainly by the most frequent (low energy) waves. It receives the maximum amount of longshore sedimentary input, calculated to be 287 x 103 m3 yr-1 (Sabatier, 2001), and is protected partially from the river dynamics by a sandy spit built up by the littoral drift. Conversely, the eastern domain is the most exposed part to both fluvial dynamics and strongest swells. The shallowest zone of this bar is located in the river channel axis. The eastern sub-channel curves round the shoal zone towards the east (sinuosity
4

index = 1.1). It crosses the top of the bar (bypass channel), creating an incision of around 1.5 m. Laterally, the mouth-bar is connected to shore-face bars, which allow the supply of sand to the eastern and western beaches. 4.1.3. Delta front Farther offshore (Fig. 3 part c), the delta front extends from - 4 m to - 20 m (Fig. 4), with an average slope of 4.13° in 2003 (Table 4). Concerning the surface sediments grain-size, sand dominates (>50%) up to 10 m water depth in the west and up to 16 m water depth in the east. Beyond 20 m water depth, the slope lessens gently. The transition between the delta front and the prodelta is represented only weakly in the topography, and takes place gradually between – 20 and – 30m. Two types of bed feature are identified on this slope (Fig. 4): 1) slump and 2) gullies. 4.1.3.1. Slump The Rhône03 surveys show a zone of steep slope below – 5 m (Fig. 4; Fig. 5). This forms a 520 m wide (W) and 260 m length (L) scar, with a headscarp height (HH) of 10 m with a maximum slope (β) of 15°, for an average slope of the delta front (α) measured as 4.13 (Fig. 5).This feature is interpreted as a shallow rotational slide of the delta-front. This interpretation is supported by the absence of a direct connection with the river channel (Fig. 4, Fig. 5) and the presence of a sediment slided mass beyond the scar (Fig. 6). Shallow rotational slide interpretation is consistent with known styles of delta slope deformation observed elsewhere (Prior and Coleman, 1984; Lindsay et al., 1984; Kostaschuk and McCann, 1987; Nemec, 1990). However, based solely on the surface morphology, it is difficult to determine the sliding mechanism. For this reason the generic term “slump” is used here, in reference to the disturbance caused by the downslope movement of a failed mass of sediment. The amount of sediment moved as a wedge-shaped volume can be estimated (see Fig. 5) using the Al-Kashi formula:
)Csin(21 BABCACWV ×××≈
with width W, side AC = L, BC = ( )βsin
HH , and angle AĈB= ( )βα −−−−− 9018090180 .
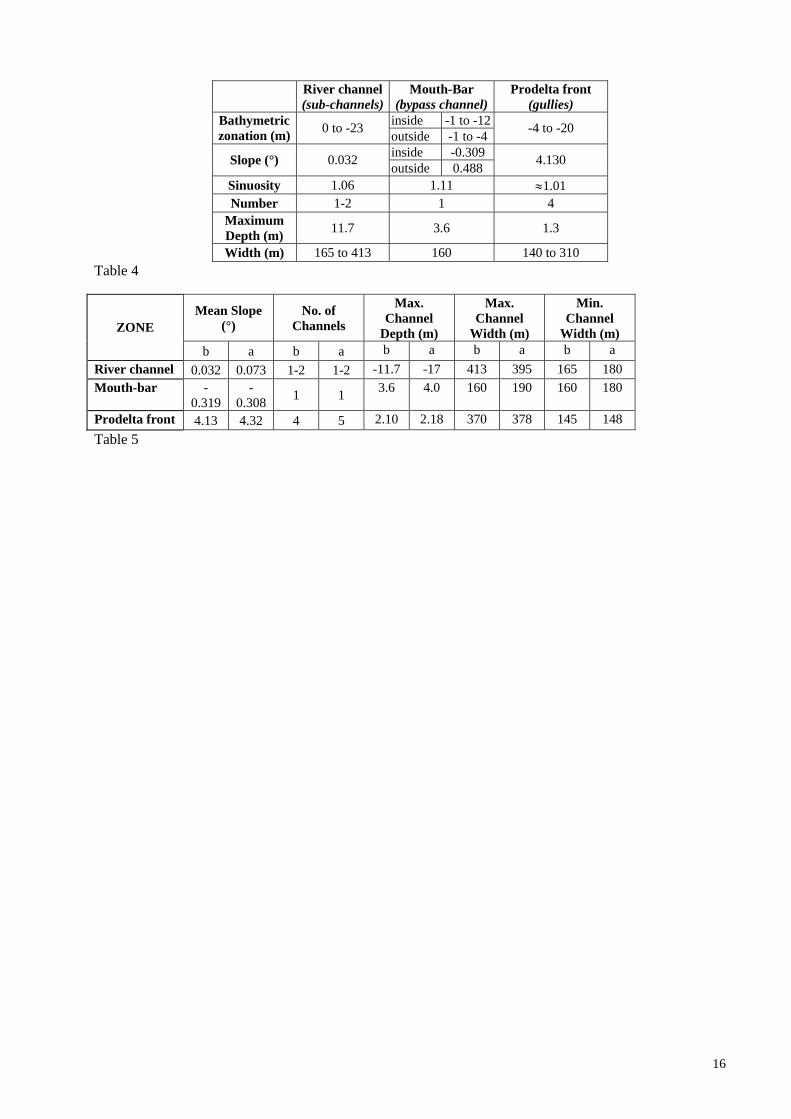
Thus, the volume of sediment which has been moved towards the prodelta during this event is approximately 5 x 10⁵ m3 .This volume, corresponding to one event, is equivalent to the total volume sedimented each year between 0 and -20 m since 1998. Taking into account the high rate of sedimentation in these environments, the fact that the morphology is visible suggests a recent instability. Moreover, it is likely that the survey was performed just after the slump because, in this area, wave action is likely to re-established quickly some kind of equilibrium profile. The causes of this type of slump on the delta-front could be the angle of sediment repose, or external forcing due to sediment load arising from mouth bar accretion and changes in pore pressure due to wave conditions (Nemec, 1990; Mello and Pratson, 1999; Hill and Christian, 2003). However, it is not known if flood events directly induce these sorts of sediment slides, since this observed slump exists on the pre-flood morphology. 4.1.3.2. Gullies Between – 15 m and – 35 m, 4 sub-parallel gullies (numbered from 1 to 4 eastward on Fig.4) occur along the steepest part of the delta front slope. Gullies are small channels with low relief. They are distributed over a zone more than 1-500 m wide, and present a width varying from 140 m to 380 m, and a maximum depth of 1.3 m (table 4). The depth of these gullies generally decreases downslope and, whilst their length is difficult to determine precisely, it does not exceed 2000 m. Box-cores, collected on the delta-front by Miralles et al. (2006), both within and outside the main gully (n°2 on Fig.4) at 20 m and 30m water depth during the Rhône Flood cruise, show that these features incised a laminated sandy clayey silt, oversaturated in water (porosity ≥ 80%, Lansard, 2004). The structure of the sediment within the gullies is similar to that between the gullies, although it was not possible to establish the lateral continuity of the observed laminations. Coring of the interface carried out at the foot of some channels revealed large amounts of detrital organic material (leaves, branches, etc.). The current velocity measurements, carried out under weak hydrodynamic conditions during the Rhône03 cruise, failed to show any particular activity at the scale of the gullies (Fig. 7a). Measurements of turbidity (backscatter values from the turbidity sensor) showed stratification of the water column marked by the presence of a turbid plume on the surface (Fig. 7b). At the water/sediment interface, the water is particularly clear and the gully zones are not preferential areas of transport. Hence, these gullies are probably not actives except during flood periods.
5

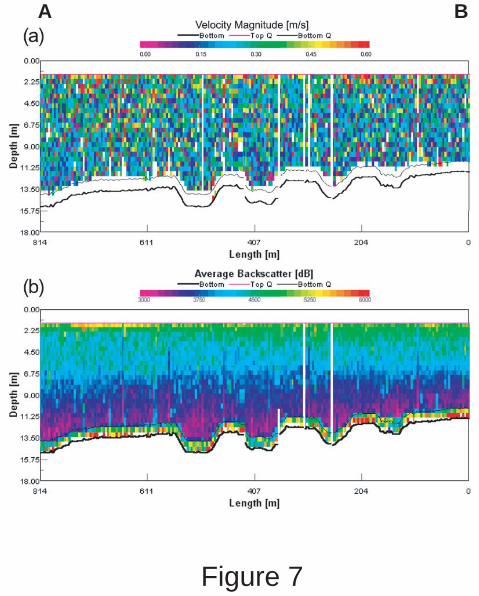
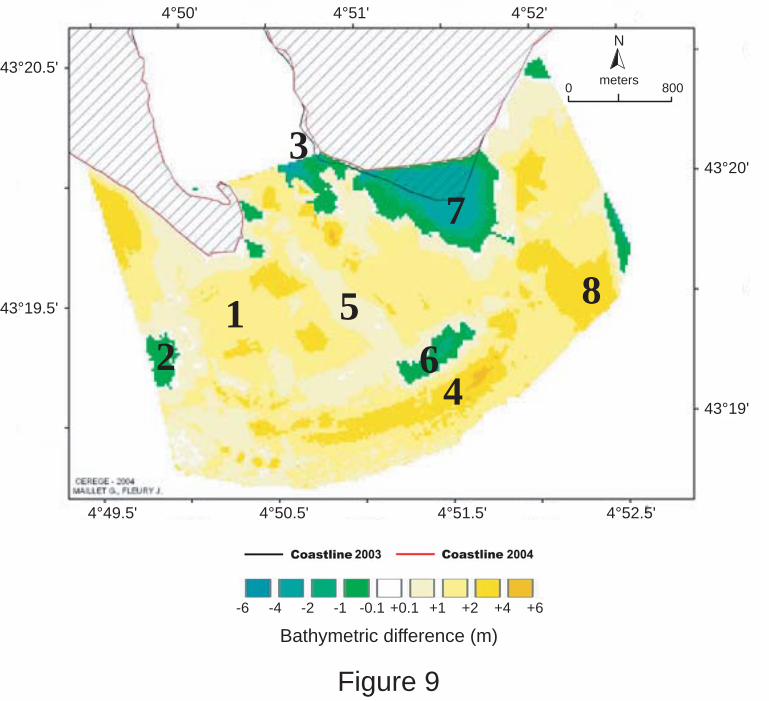
4.2 Impact of the 2003 flood 4.2.1. Geomorphic effect on the Grand Rhône mouth area 4.2.1.1. River Channel Bathymetric measurements made before and after the December 2003 flood highlight an important adjustment of the river channel in the 6-km section upstream of the mouth (Table 5, Fig. 8). Maximum deepening occurs on the east (left) bank because of: i) the Rhône channel curvature, ii) the inherited river features due to the historic presence of dykes; and iii) the influence of centennial eastwards longshore drift trend (Maillet et al., 2005). In a general way, the Rhône is modified over the entire riverine section by an increase in slope gradient as well as a reduction in width (see Table 5), however the processes of erosion and deposition appear to alternate. From a quantitative point of view, and to a first approximation, the overall sedimentary budget of the channel between Port-Saint-Louis-du-Rhône and the mouth is evaluated at – 6 x 10⁵ m3. On average, the profiles show a volume of eroded sediment that is double the accumulated volume, whereas the areas affected by erosion and deposition are similar (45.5% and 54.5%, respectively, of the total surface-area). Thus, the rates of erosion in the channel are almost twice the rates of accumulation. Positive budgets are observed for two (P2 and P3) of the five profiles. These two profiles are located in the channel curvature, which forms an obstacle to the movement of coarse-grained dunes on the riverbed (see reviews by Allen, 1984; Southard & Boguchwal, 1990; Nelson et al., 1993; and Best, 1996). In the Rhône channel deltaic part, Antonelli et al. (2004) highlight a global channel incision phase for the past150 years, without a chronic deposition zone. Thus, profiles P2 and P3 suggest that the coarse sediment transit in the river channel occurs through large dunes moving in pulses during paroxysmal events. Maximum incision (≈ 6 m) is observed in profile P5, near the coastline, in a zone where the spit barring the channel reduces considerably the cross-section of fluvial discharge. This incision can be favoured by an increase in current velocity as a result of this decrease in channel width. Also, the high erosion rates during extreme events observed in profiles P4 and P5 can be explained partially by the resuspension of fine sediments (20 µm) deposited preliminary near the mouth in the manner of a silt plug. Thus, with this hypothesis and during flood events, the downstream part of the Rhône channel would contribute mainly to feeding the solid load of the river with fine sediment, whilst simultaneously, slowing down the expulsion of coarse sediments. 4.2.1.2. Mouth Bar and delta-front In Figure 9, the zone of overlay of the DTMs extends from the coastline to the -20 m isobath, and covers an area of 8.85 km². Quantitatively, overall sedimentary budget for the flood period in this zone amounts to +7.81 x 10⁶ m3, which corresponds to a mean layer of about 0.88 m thick. The total eroded volume (1.22 x 10⁶ m3) is roughly equivalent to 15% of the total volume deposited during the flood. The surface area of erosion is 4 times less than the surface area of accumulation (1.9 x 10⁶ m2 and 7.6 x 10⁶ m2, respectively). Erosion is thus very localised but important at the rare places where it does occur, whilst deposition takes place in a more homogeneous way over the entire zone of interest (Fig. 9). The rate of sedimentation is about twice the rate of erosion during the flood in the mouth area, i.e. the opposite situation compared with the river channel. In detail, the western part of the mouth remains stable and undergoes very slight morphological changes. The zone exhibits homogeneous sedimentation, often of less than 1 m in thickness. The principal depositional area is at the downstream end of the spit (zone 1 in Fig. 9), in a sector protected from the direct action of the river current. A slight erosional surface on the western edge of the studied zone (zone 2 in Fig. 9) suggests that mechanisms of re-mobilisation by swells can take place quickly after the flood. In the central part of the mouth, near the littoral spit, erosion corresponds to an erosional channel evidenced in profile P5 (zone 3 in Fig. 9). Farther offshore, the top of the mouth-bar is lowered on average by 1 m, and is widened and levelled off, but remains very high everywhere. The maximum net accumulation during the flood occurs in the axis of the Rhône outlet (zone 4 in Fig. 9). However, there is a narrow area of weak sedimentation (zone 5 in Fig. 9) between the outlet and zone 4, which could reflect the passage of a strong current. Therefore, this accumulation would result from progradation of the top of the bar, pushed seaward by the liquid flow of the Rhône. The upstream zone of erosion would mark the initial position of the bar (zone 6 in Fig. 9), 200m upstream of the post-flood position (relative erosion). The eastern part of the mouth exhibits the greatest change in bathymetry: an extensive area of erosion (zone 7 in Fig. 9) is observed, characterised by an average deepening of 3 m over an area of approximately 0.5 km²; and accompanied by coastline retreat of up to 400 m. Such erosion involves the displacement of mainly sandy material with a volume estimated at 1.2 x 10⁶ m3. At least part of this was probably exported seawards via
6

the sub-channel through the mouth-bar, as a major deposit equivalent to between 2 and 4 m of instantaneous vertical sedimentation (zone 8 in Fig. 9) is seen on the delta-front in the axis of the bypass channel, between -4 and -20 m depth. Except for this area, sedimentation on the delta-front is homogeneous, with a seawards decrease in the thicknesses of deposition. Thus, the advance about 200m seawards of the top of the mouth-bar during the flood, together with the concentration of deposits at the top of the delta front after the flood, generated an increase of +0.19° in the slope gradient of the front (Table 5). 4.2.2. Sedimentary processes Bathymetric data on the delta front are available for May 2002 (Strataform 1 cruise), November 2003 (Rhône03 cruise), December 2003 (Rhôneflood cruise) and January 2004 (MATRhône 2 cruise). The surveys carried out in 2002 and Nov. 2003 give a good estimate of sea-floor evolution over a year, including the impact of two important floods (10 500 m3 s-1 in September 2002 and 10 200 m3 s-1 in November 2002). The comparison of the Rhône03 and Rhôneflood surveys corresponds to the total budget of the December 2003 flood. Lastly, the MATRhône 1 survey allows observation in the short term of the evolution of the flood deposits. Based on the successive morphological changes of the delta front, it is possible to imagine the dispersion mechanisms of the solid load of the river in periods of flood. During the 2003 flood event, the generalised advance of the mouth-bar does not induce a significant displacement of the delta-front at depths greater than - 25 m (Fig.10a). The bathymetric variations at the top of the delta-front between the Rhôneflood survey carried out just after the flood (09/12/2003) and the MATRhône 2 survey one month later (14-26/01/2004) show that the majority of the sedimentary input was deposited on the delta front after, not during, the flood (Fig 10a). The deposits reached a maximum thickness on the top of the delta front, but were remobilised immediately by swell waves in the [0 to -6 m water depth] zone. With regards to slope failure (Fig. 4), it is certain that such a process did not take place during the December 2003 flood since the slump scar was already present before the flood. In addition, the bathymetric differences map (Fig. 6) between 2002 and Dec.2003 shows the slided mass. Then, the slump occurs after May 2002 and before 2003 flood event, but, based on our present knowledge, it cannot be demonstrated that this process is directly related to previous floods. The question of the role of the delta-front gullies during the flood should be studied in more detail. Although there are no available current meter measurements for periods of strong river activity, a preliminary interpretation is proposed based on the characteristics of the gullies. Fig. 10b shows a west-east transverse section across the slope of the delta front in May 2002, Nov. 2003 and Feb 2004, at around 20 m water depth. Note the remarkable similarity of morphologies between these three dates: the four channels and the slide mass identified on the pre-flood bathymetry (Nov. 2003) already seem to be present on the bathymetry for 2002, and are preserved on the post-flood survey. Despite preservation of the general sea-floor morphology, important bathymetric changes occurred between the pre- and post-flood surveys (Fig. 10b, Table 5). The area covered by the profiles EF (3500 m length) preserves its morphological features, but is the site of homogeneous sedimentation of approximately 1 m. According to Miralles et al. (2006), there is no preferential deposition in the gullies or at the side, as observed on the northern California slope by Field et al (1999) in the case of “regular parallel gully aggradation”. The whole of the pre-flood morphology is draped by a sediment cover of overall quasi-constant thickness. Therefore, these sediments could not be deposited preferentially as a result of either channelised transport mechanisms, or even very high energy processes. Since the deposited bed mimics the shape of the underlying surface, it suggests a dispersive sedimentation pattern from suspension that is not influenced by slope morphology. The sedimentation processes may correspond to mechanisms of settling out by electrochemical flocculation and organomineral aggregation (Thill et al., 2001; Fox et al., 2004) extending over the whole of the [0; -20m water depth] zone. This generally homogeneous sedimentation over the whole width of the delta-front is slightly more marked in the east (≈ +1.5 m), near the depositional zone 8 (on Fig. 9), than in the west (≈ +0.8 m). Moreover, note the existence of a fifth gully on the post-flood bathymetry, at the east of the slump, but absent on the 2002 and pre-flood surveys. Thus, the eastern part of the mouth seems more active during floods than the western part, in accordance with the dynamics and the morphology of the river channel and the mouth-bar described above. The appearance of a new gully in the post-flood survey (gully n°5) is attributed to the dynamics of the 2003 flood. It could provide evidence for the existence of density flows, strongly loaded with sediment transferred to the prodelta (Mulder and Syvitski, 1995), but any connection with the distributary channel can only be supposed because sedimentary re-mobilisation related to the swell waves modifies continuously the morphology in the area between 0 to - 3 m water depth. The comparison between the 2002 and pre-flood profiles (Fig. 10b) shows a thicker residual accumulation in the east than in the west, and mainly in the gullies. Despite the main explanation provided by the rate of
7
sedimentation difference between the western and the eastern part of the mouth, the existence of resuspension phenomena (Palanquès et al., 2002) that are more effective in the west than in the east needs to be considered. In NW Mediterranean area, storm waves were the main contributor to the transport of sediment, although they only resuspended fine-grained surface sediments in near-shore zone during extreme wave conditions (Hs > 4.5 m and Ts > 10 s) (Puig et al., 2001; Ferré et al., 2005). Given that there was no notable storm between these two surveys, the better preservation of the deposits in the east may result from differences on waves exposure inducing a grain-size distribution more positively skewed eastward (Maillet et al., 2006). Finally, it is interesting to note the disappearance of a gully, visible in the west on the 2002 survey, but buried before the 2003 flood event by the chronic swells effects. In the same way, the “smoothing out” of the gully n°1 (Fig. 9b) during the flood supports the hypothesis of a migration of the active zone towards the east. 5. Discussion 5.1. Solid load input during the flood The rates of sedimentary accumulation in the subaqueous delta area are difficult to evaluate with precision, because of the importance of: (i) the terrigenous sediment supply; (ii) the presence of gas due to high organic matter content; (iii) resuspension under wave action, and (iv) the bioturbation intensity (Touzani and Giresse, 2002). To test whether the accumulation volume of 7.8 x 10⁶ m3 is realistic, comparison can be made with other measurements. Different estimates of the maximum annual sedimentation rates near the Rhône mouth (Calmet and Fernandez, 1990; Charmasson et al., 1998; Radakovitch et al., 1999; Beaudouin et al., 2005) give values of 0.5 to 0.8 m3 m-2 below 20 m water depth. Although these estimates fall below the 0.8 to 1.5 m deposit thicknesses measured after the flood at 20 m water depth (Fig.8c), this difference is minor if the effects related to remobilisation / compaction events and the specificity of the December 2003 flood event are taken into account. Thus, our results are in broad agreement with previous studies of the Rhône subaqueous delta. Moreover, assuming a dry bulk density of 2.65 g cm-3, and a mean porosity of 80% (Lansard, 2004), the total sediment accumulation is in the order of 4 x 10⁶ tonnes. However, the suspended sediment load of the Rhône during the flood was estimated by Ollivier et al. (2006) at around 3.1 x 10⁶ tonnes at Arles, 50 km upstream from the Rhône mouth. Concerning the same locality, Antonelli et al. (2006) report a total solid discharge of 3.60 x 10⁶ t of silt, 0.85 x 10⁶ t of sand, and 0.83 x 10⁶ t of clay, i.e. > 85% fine sediment and < 15% sand. In this way, a mass of between 3.1 to 5.28 x 10⁶ t of sediment may transit through the Rhône at Arles. Interestingly, our rough estimate is fully consistent with the river load estimates, despite the relay phenomena that occur between Arles and the river mouth (over-bank trapping, channel erosion, etc.) and the volume of 6 x 10⁵ m3 eroded between Port-Saint-Louis and the Rhône mouth (Fig. 8). This implies that, during the flood, almost all of the transported sediments would be deposited in the zone up to 20 m depth, and that the prodelta would receive only very weak inputs linked with the limited expansion of the plume during the flood event due to wave and wind conditions. In this way, between May 2002 and Dec.2003, Figure n° 6 shows a thin homogeneous deposit below 20 m depth (<1m), excluding the shape of the slided volume. Lastly, the fact that 85% of the solid load of the Rhône during the flood consists of fine particles, is compatible with the concentration of most of the sediment accumulation on the delta front slope, beneath 5 m depth. At the same time, the grain-size data support the assumptions about transport mechanisms, inferred from the evolution of the morphological features, and highlighted through the processes of sedimentary draping recognised on the delta front. 5.2. Prodelta supply A key question related to sedimentation on the prodelta concerns the mechanisms that move sediment from the river onto or beyond the delta front slope. The nourishment of prodeltas by gullies and the phenomena of submarine slides in water depths of between 5 to 100 m is well documented for deltas such as the Mississippi (Prior and Coleman, 1978, Lindsay et al., 1984, Bouma et al., 1991; Coleman et al., 1998), the Fraser (Shepard and Milliman, 1978; Hart et al., 1992; Hart et al., 1998) and, in a different context, the Amazon (Nittrouer and Demaster, 1986; Sternberg et al., 1996). In the Mediterranean, these processes have been observed more recently for the Nile delta (Stanley, 2003; Stanley et al., 2006), and in the Adriatic Sea (Belloti et al, 1994; Cattaneo et al., 2003; Trincardi et al., 2004). With regards to the Rhône delta, the observations in this study follow on from previous studies concerning the transfer of particles in the Gulf of Lions (Aloïsi et al., 1982; Naudin and Cauwet, 1997). These authors indicated a multi-layer sediment transit system (plume, intermediate and bottom nepheloid layers) at the vicinity of the prodelta. However, unlike the other main delta types, the sediment supplied to the Rhône prodelta does not seem to transit in a significant way through these gullies. Indeed, if we do not take into account the volume of the slump, the
8

comparison of the multibeam DTMs of Nov. 2003 and Dec. 2003 shows that only a sediment layer of 0.2 m maximum thickness was deposited at 20 m depth. On the contrary, between Strataform1 survey (May 2002) and RhoneFlood survey (Dec. 2003), a deposit of 0.6 m mean thickness was preserved below 20 m depth (Fig. 6).Thus, the prodelta does not appear to be a zone of preferential deposition during the 2003 flood event, since <10% of the solid load input of the river settles here because of swells conditions, but it behaves like a preferential medium-term accumulation zone. Moreover, some studies on a prodeltaïc core (length: 7 m; depth: -40 m, position: 43°18’47N; 4°51’02E) show with palynological proxy (Beaudouin et al, 2005) that more than 70% of the deposited sediment is remobilised, whilst Touzani and Giresse (2002), based on lithological data, note a perturbed sedimentary sequence resembling a slump, about 2 m thick, at the bottom of the core. According to these results, as the direct sediment supply to the prodelta during flood events is not very often and the direct input of coarse sediment is minimal, gravity slides unrelated to the flood events would appear to be an important mechanism of prodelta supply. 5.3. Lobe spreading The long-term construction of the current lobe of the Grand Rhône results mainly from the inputs of sand, because the fine-grained sediments are resuspended rapidly and exported towards the shelf (Suanez et al., 1998). In the present-day context of littoral drift and quasi-immobilisation of the outlet, the lateral and longitudinal growth of the lobe takes place according to complementary but independent mechanisms: 5.3.1. Cross-shore growth During the floods, and following the pulsed arrival of transverse large dunes migrating along the Rhône channel (Arnaud-Fassetta et al., 2003, Antonelli et al., 2004), most of the sandy load accumulates on the uppermost part of the mouth-bar and the delta front. During the most important floods, the flushing effect leads to an advance of the bar without significant supply at the foot of the delta front, which creates an increase in slope. When the critical slope is reached (≈ 5° for the modern Rhône lobe), gravity sliding allows the transfer of sediment towards the top of the prodelta and the re-establishment of an equilibrium profile on the delta-front (≈ 4° for the modern Rhône lobe). This general pattern is moderated by mechanisms that influence the distribution of fine-grained sediment input (swell waves, plume, stratification of water column, etc.).This sort of slide feature was observed for the first time on the Rhône subaqueous delta area during this study, and it is not possible to determine the frequency and the consequence of each slide. Note that, even if the slipped volume is equivalent to the annual mean volume sedimented in this area, it does not seem to represent large volumes after compaction and re-suspension; the suspended load makes up a significant part of the supply to the prodelta and thus leads to the very slow aggradation of the lobe. Concerning the role of gullies in cross-shore material transfer, it appears that only one gully was created and active during the flood, with only a small sediment volume passing through this feature to supply the prodelta area. On the other hand, the evolution of gully morphology since 2002 gives information on the lateral lobe spreading. 5.3.2. Long-shore growth During the flood, stable gully features in the west together with active features in the east are observed. Thus, during flood, the construction of the mouth-bar and of the delta front is governed by asymmetrical processes, which account for the differences in grain-size and slope between the western and eastern parts. However, it can be seen that the global construction of the lobe is ultimately symmetrical (according to the A index of Bhattacharya and Giosan, 2003). Thus, it is considered that the process of filling the available space during flood never concerns the entire surface of the prodeltaïc zone. The relict channel features record the effects of past inputs to the west of the lobe. The new channel, formed during the December 2003 flood, shows that the eastern part of the mouth is being supplied presently with sediment, thus leading to a completely subaqueous symmetrical lobe. The symmetrical progradation of the emerged beach ridge, in the present context of weak littoral drift and limited terrigenous input, would thus be related to the distribution dynamics of the fluvial inputs by swinging from west to east. In this way, the symmetrical nature of this lobe masks the processes of progradation due to the inertia affecting the construction and emergence of the lobe, since, in the short term, these processes remain non-homogeneous in both time and space. 6. Conclusion This detailed study of bathymetric changes at the present Rhône mouth, induced by a large flood event, reveals a complex assemblage of seafloor features. These represent the interaction at different temporal and
9

spatial scales of several different sediment transport and deformation processes related to: 1) sediment supply from the river; 2) deposition from suspension; and 3) sediment remobilisation. During the December 2003 flood event, the river mouth functioned generally according to a pre-established pattern, and the importance of the flood did not modify the organisation and trend of morphological development of the mouth area (see section 4.2). In fact, the mechanisms remained the same as those during periods of weaker liquid flow. The majority of the solid river discharge during the flood event is confined to the [0 to - 20 m] zone. This confirms the long-term trend in which the delta front is the only part of the present day coastal zone experiencing major accumulation (Sabatier et al, this volume). The Rhône supplies very little coarse material to the prodelta. Sand input is channelised and is active exclusively to the east of the mouth, in the axis of the main passage through the mouth-bar. Prodelta deposits are made up primarily of fine sediments that accumulate by settling out. This mechanism of sedimentation allows the preservation of relict features, in particular those gullies which, in the past, supplied sand to the western and central parts of the prodelta fan. Slope failure from the top of the delta front is the major mechanism allowing the supply of coarse sediment to the prodelta, but the triggering of this gravity-driven phenomenon does not coincide with the 2003 flood event. From the present state of knowledge, it cannot be demonstrated that slope failure is related to flood dynamics. By extension, it can be concluded that there is only a weak correlation between the short-term construction of the current lobe of the Grand Rhône and paroxysmal river events. This study demonstrates clearly the need for further investigations into the role of delta-front gullies in cross-shore material transfer. There is a requirement for the development of suitable instrumentation (with adequate moorings) for the in-situ measurement of flood events. 7. Acknowledgements This study was supported by the European Community through the programmes Eurodelta (contract EVK3-CT-2001-20001) and Eurostrataform (contract EVK3-2001-00200), and by the GDR “Marges”. The team of the “Domaine de la Palissade” provided permanent logistical support for the running of the river survey cruises. We sincerely thank C. Satra and the L.E.S./Ifremer, as well as the crew of the “Suroît” for their assistance during the “Strataform1” and “Rhôneflood” cruises. N. Frumholtz helped in the processing of bathymetric data. J. Lofi provided constructive and very useful referee comments and F. Sabatier is equally acknowledged for fruitful discussion. P. Plantevin (SOACSY) and F. Denivet (PAM) are thanked for their efficiency during MATRhône 2. Dr M.S.N. Carpenter was responsible for translating and post-editing an early draft of the manuscript. 8. References Allen, J.R.L., 1984. Sedimentary Structures: Their Character and Physical Basis. Elsevier (Ed),
Amsterdam, 539 pp. Aloïsi, J.C., Monaco, A., Millot, C., Pauc H., 1979. Dynamique des suspensions et mécanismes
sédimentogénétiques sur le plateau continental du Golfe du Lion, C.R. Acad. Sci. Paris, ser. D, 289, 879-882.
Aloïsi, J.C., Cambon, J.P., Carbonne, J., Cauwet, G., Millot, C., Monaco, A., Pauc, H., 1982. Origin and rôle of the bottom nepheloid layer in the transfer of particles into the marine environment - application to the Gulf of Lions, Ocean. Acta 5 (4), 481-491.
Antonelli, C., Provansal, M., 2002. Vers une ré-évaluation des matières en suspension du Rhône aval par acquisition de mesures sur toute la colonne d'eau. in: Delahaye D., Levoy F., Maquaire O. (Eds.), Geomorphology: from Expert Opinion to Modelling. A tribute to Professor Jean-Claude Flageollet. Proceedings of the Symposium held in Strasbourg, France. April 26-27.
Antonelli, C., Provansal, M., Vella, C., 2004. Recent morphological channel changes in a deltaïc environment. The case of the Rhône River, France; Geomorphology, 57, 385-402
Antonelli, C., Rolland, B., Eyrolle, F., Provansal, M., Sabatier, F., 2006. Suspended sediment and 137Cs fluxes during exceptional floods. The case of the Rhône River (SE France) in December 2003. Geomorphology, (in press).
Arnaud-Fassetta, G., Quisserne, D., Antonelli, C., 2003. Bed-material discontinuum in a large and regulated river: the deltaic Rhone River (France), Géomorphologie : relief, processus, environnement, 1, 33-50.
10

Arnoux-Chiavassa, S., Rey, V., Fraunié, P., 2003. Modelling 3D Rhône river plume using a higher order advection scheme. Ocean. Acta, 26 (4), 299-309.
Beaudouin, C, Suc, J-P, Cambon, G, Touzani, A, Giresse, P, Pont, D, Aloisi, J-C, Marsset, T, Cochonat, P, Duzer, D, Ferrier, J, 2005. Present-day rhythmic depositions in the Grand Rhone prodelta (NW Mediterrenean) according to high-resolution pollen analyses. J. Coastal Res. 22 (1), 66-80.
Bellotti, P., Chiocci, F.L., Milli, S., Tortora, P., Valeri, P., 1994. Sequence stratigraphy and depositional setting of the Tiber delta: Integration of high-resolution seismics, well logs, and archeological data. J. Sediment. Res., 64 (3), 416-432.
Berné, S, Shipboard Scientific Party, (2004) PROMESS1 Summary cruise Report: past global changes investigated by drilling Mediterranean continental margins. Unpublished Cruise report, Research Institute for Exploitation of the Sea (IFREMER), Brest, France, unpublished: 1-7.
Best, J.L., 1996. The fluid dynamics of small-scale alluvial bedforms. In:. Carling P.A, Dawson M.D. (Eds), Advances in Fluvial Dynamics and Stratigraphy, pp. 67-125. Wiley, Chichester.
Bhattacharya, J.P., Giosan, L., 2003. Wave-influenced deltas: geomorphological: implications for facies reconstruction. Sedimentology, 50, 187-210.
Bouma, A.H., Roberts H.H., Coleman J.M., Prior D.B., 1991. Delta front gullies as part of mass-movement phenomena: Mississippi River delta front. in: Osborne R.H. (Ed.), From Shoreline to Abyss: Contributions in marine geology in honor of Francis Parker Shepard. Special publication of the Society of Economic Paleontologist and Mineralogists, 46, 99-105.
Cacchione, D.A., Drake, D.E., 1986. Nepheloid layers and internal waves over continental shelves and slopes. Geo-Mar. Lett., 6, 147-152.
Calmet, D., Fernandez, J.-M., 1990. Caesium distribution in northwest Mediterranean seawater, suspended particles and sediment. Cont. Shelf Res 10, 895–913.
Cattaneo, A., Correggiari, A., Langone, L, Trincardi, F., 2003. The late-Holocene Gargano subaqueous delta, Adriatic shelf: Sediment pathways and supply fluctuations. Mar. Geol., 193, 61-91.
Charmasson, S., Radakovitch, O., Arnaud, M., Bouisset, P., Pruchon, A.-S., 1998. Long-core profiles of 137Cs, 134Cs, 60Co and 210Pb in sediment near the Rhône river (northwestern Mediterranean Sea). Estuaries 21 (3), 367–378.
Coleman, J.M., Walker, H.J., Grabau W.E., 1998. Sediment instability in the Mississippi River Delta. J. Coast. Res., 14 (3), 872-881.
Cooper, J.A.G., 2001. Geomorphological variability among microtidal estuaries from wave-dominated South African coasts. Geomorphology, 40, 99-122.
Estournel, C., Broche, P., Marsaleix, P., Devenon, J. -L., Auclair, F., Vehil, R., 2001. The Rhone River Plume in Unsteady Conditions: Numerical and Experimental Results. Est., Coast. Shelf Sc., 53 (1), 25-38.
Estrela, T., Menendez, M., Dimas, M., Marcuello, C., Rees, G., Cole, G., Weber, K., Grath, J., Leonard, J., Ovesen, B.N, Fehér, J., Consult, V., 2001. Sustainable water use in Europe. Part 3: Extreme hydrological events: floods and droughts. Environment issue report No. 21. European Environment Agency. Copenhagen.
Field, M.E., Gardner, J.V., Prior, D.B., 1999. Geometry and significance of stacked gullies on the northern California slope. Mar. Geol., 154 (1-4), 271-286.
Ferré, B., Guizien, K., Durrieu De Madron, X., Palanques, A., Guillén, J., Grémare, A., 2005. Fine-grained sediment dynamics during a strong storm event in the inner-shelf of the Gulf of Lion (NW Mediterranean). Cont. Shelf Res. 25 (19-20), 2410-2427.
Fox, J.M., Hill, P.S., Milligan, T.G., Boldrin, A., 2004. Flocculation and sedimentation on the Po River Delta. Mar. Geol., 203, 95-107.
Galloway, W.E., 1975. Process framework for describing the morphologic and stratigraphic evolution of deltaïc depositional systems. in: B. Ed. (Editor), Deltas. Houston Geol. Soc., 87-98 pp.
Got, H., Aloisi, J.C., 1990. The Holocene sedimentation of the Gulf of Lions margin: a quantitative approach, Cont. Shelf Res., 10, 841-855.
Hampton, M., Lee, H.,Locat, J., 1996. Submarine landslides. Reviews of Geophysics 34(1): DOI: 10.1029/95RG03287.
Hart, B.S., Hamilton, T.S., Barrie, J.V., 1998. Sedimentation rates and patterns on a deep-water delta (Fraser Delta, Canada): Integration of high-resolution seismic stratigraphy, core lithofacies, and Cs-137 fallout stratigraphy. J. .Sed. R. 68 (4), 556-568
Hart, B.S., Prior, D.B., Barrie, J.V., Currie, R. G., Luternauer J. L., 1992. A river mouth submarine channel and failure complex, Fraser Delta, Canada, Sed. Geol., 81, 1-2, 73-87.
11

Hill P.R., Christian H.A., 2003. Monitoring in situ pore pressures for prediction of slope failure on the prodelta slope of the Fraser River Delta, Canada. Geophysical Research Abstracts, EGS/AGU/EUG Joint Assembly, 5, 13783, Nice France.
IRS, 2000. Etude globale pour une stratégie de réduction des risques dus aux crues du Rhône. Etude du transport solide, 1st step, synthesis report. Institution interdépartementale des bassins Rhône-Saône, Valence, France. 5 vol, 469 pp.
Kostaschuk, R.A., McCann, S.B., 1987. Subaqueous morphology and slope processes in a fjord delta: Bella Coola, British Columbia. Canadian J. Earth Sc., 24, 52-59.
Lansard, B., 2004. Distribution et remobilisation du plutonium dans les sédiments du prodelta du Rhône (Méditerranée, Nord-Occidentale), Unpublished PhD Thesis, University Paul Cézanne, Aix-Marseille 3, 344 pp
Leveau, M., Coste B., 1987. Impact des apports rhodaniens sur le milieu pélagique du Golfe du Lion. Bull. Ecol., 18, 119-122.
Lindsay, J.F., Prior, D.B., Coleman, J.M., 1984. Distributary-mouth bar development and rôle of submarine landslides in delta-growth, south pass, Mississippi delta, Bull AAPG, 68 (11), 1732-1743.
Ludwig, W., Meybeck, M., 2003. Riverine Transport of water, sediments and pollutants to the Mediterranean Sea, UNEP/MAP/MED POL, MAP Technical Reports Series No 141, UNEP/MAP Athens 2003, 111 pp.
Maillet, G.M., 2005. Dynamiques sédimentaires récentes et actuelles entre un fleuve et son delta : exemple de l’embouchure du Rhône. Unpublished PhD Thesis, University of Provence, Aix-Marseille 1, 331 pp.
Maillet, G.M., Rizzo, E., Revil, A., Vella C., 2005. High resolution Electrical Resistivity Tomography (ERT) in a transition zone environment. Application for detailed internal architecture and infilling processes study of a Rhône River paleo-channel.. Mar. Geophys. Res., 26, (2-4), 317 – 328, DOI: 10.1007/s11001-005-3726-5
Maillet, G.M., Vella, C., Sabatier F., Poizot, E., Mear, Y., 2006. Sedimentological evolution during a flood period in a microtidal river mouth: the Grand Rhône, France. Estuar. Coast. Shelf Sc. In press.
Miralles, J., Radakovitch, O., Aloïsi, J.C., 2005. 210Pb sedimentation rates from the North-western Mediterranean margin. Mar. Geol. 216, 155-167.
Miralles, J., Arnaud, M., Radakovitch, O., 2006. Radionuclide deposition in the Rhône river prodelta (NW Mediterranean Sea) in response to the December 2003 extreme flood. Mar. Geol. This volume.
Mello, U.T., Pratson, L.F., 1999. Regional slope stability and slope-failure mechanics from the two-dimensional state of stress in an infinite slope. Mar. Geol., 154, 339–356.
Mulder, T., Syvitski, J.P.M., 1995. Turbidity currents generated at river mouths during exceptional discharges to the world oceans. J. Geol., 103, 285-299.
Nardin, T.R., Hein, F.J., Gorsline, D.S., Edwards, B.D., 1979. A review of mass movement processes, sediment and acoustic characteristics, and contrasts in slope and base-of-slope systems versus canyon-fan-basin floor systems. Geology of Continental Slopes, In: Doyle, L.J., Pilkey, O.H. (Eds.), Soc. Econ. Paleontol. Mineral. Spec. Publ. 27, 61-73.
Naudin, J. J., Cauwet, G., 1997. Transfer mechanisms and biogeochemical implications in the bottom nepheloid layer. A case study of the coastal zone off the Rhône river France. Deep-Sea Res. II 44, 551–575.
Nelson, J.M., McLean, S.R., Wolfe, S.R., 1993. Mean flow and turbulence fields over two-dimensional bed forms. Water Resources Res., 29, 3935-3953.
Nemec, W., 1990. Aspects of sediment movement on steep delta slopes. in: Colella A., Prior, D.B. (Eds) Coarse-Grained Deltas, Int. Assoc. Sedimentol. Spec. Publ., 10, 29-73.
Nittrouer, C.A., Demaster, D.J., 1986. Sedimentary processes on the Amazon continental shelf - past, present and future research. Cont. Shelf Res., 6 (1-2), 5-30.
Ollivier, P., Radakovitch, O., Hamelin, B. 2006. Unusual variations of dissolved As, Sb and Ni in the Rhône River during flood events. J. Geochem. Expl. 88, 394-398.
Palanquès, A., Puiga, P., Guillen, J., Jimenez, J., Gracia, V., Sanchez-Arcilla, A., Madsen, O., 2002. Near-bottom suspended sediment fluxes on the microtidal low-energy Ebro continental shelf (NW Mediterranean) Cont. Shelf Res. 22, 285–303.
Pardé, M., 1925. Le régime du Rhône. Etude hydrologique. Unpublished Thesis University of Grenoble, 2 vol., 887 and 440 pp.
Pauc, H., 1970. Contribution à l'étude dynamique et structurale des suspensions solides au large de l'embouchure du Grand-Rhône (Grau de Roustan), Unpublished Thesis, University of Perpignan, 126 pp.
12

Postma, G., 1995. Causes of architectural variations in deltas. In: Oti, M.N., Postma, G. (Eds.), Geology of Deltas. Balkema, The Netherlands, 3– 16.
Prior, D.B., Coleman J.M., 1978. Submarine landslides on the Mississippi River delta-front slope. Geoscience and man, School of Geosciences, Louisiana State University, Baton Rouge, 19, 41-53.
Prior, D.B., Coleman, J.M., 1984. Submarine slope instability. in: Brunsden, D. and Prior, D.B. (Eds), Slope Instability, Wiley, New York, 419, 455 pp.
Puig, P., Palanques, A., Guillén, J. 2001. Near-bottom suspended sediment variability caused by storms and near-inertial internal waves on the Ebro mid continental shelf (NW Mediterranean) Mar. Geol., 178 (1-4), 81-93.
Radakovitch, O., Charmasson, S., Arnaud, M., Bouisset, P., 1999. 210Pb and Caesium accumulation in the Rhône delta sediments. Estuarine, Coast. Shelf Sc., 48, 77-92.
Roditis, J-C., Pont, D., 1993. Dynamiques fluviales et milieux. de sédimentation du Rhône à l’amont immédiat de son delta. Méditerranée 3, 5–18.
Sabatier, F., Maillet, G., Fleury, J., Suanez, S., Vella, C., 2006. Long term relationships between river sediment input and littoral bathymetric change in a microtidal deltaic system (Rhone delta shoreline, Mediterranean sea, SE France). Mar. Geol., This issue.
Sabatier, F., 2001. Fonctionnement et dynamiques morphosédimentaires du littoral du delta du Rhône. Unpublished PhD Thesis, University of Aix-Marseille 3, 272 pp.
Schwab, W.C., Lee, H.J., Twichell, D.C., 1993. Submarine Landslides: Selected Studies in the US Exclusive Economic Zone. U.S. Geol. Surv. Bull. 2002.
Shepard, F.P., Milliman, J.D., 1978. Sea-floor currents on the foreset slope of the Fraser River Delta, British Columbia (Canada), Mar. Geol., 28 (3-4), 245-251.
Southard, J.B., Boguchwal, M.J.N., 1990. Bed configuration in steady, unidirectional water flows. Part 2. Synthesis of flume data. J. Sedim. Petrol., 60, 658-679.
Stanley, D.J., Schnepp, G., Jorstad, T., 2006. Submergence of archaeological sites in Abu Qir Bay, the result of gradual longterm processes plus catastrophic events. In: Goddio, F., and others (Eds): Abu Qir I. Periplus, London (in press).
Stanley, D.J., 2003. Nile delta margin: failed and fluidized deposits concentrated along distributary channels. Géomorphologie : relief, processus, environnement, 4, 211-226.
Sternberg, R.W., Cacchione, D.A., Paulson, B., Kineke, G.C., Drake D.E., 1996. Observations of sediment transport on the Amazon subaqueous delta. Cont. Shelf Res. 16 (5-6), 697-715.
Suanez, S., Bruzzi, C., Arnoux-Chiavassa, S., 1998. Recent data about the evolution of the offshore beach on the eastern part of the Rhone delta (Napoléon beach and La Gracieuse spit), Géomorphologie : relief, processus, environnement, 4, 291-312.
Thill, A, Moustier, S, Garnier, JM, Estournel, C, Naudin, JJ, Bottero, JY, 2001. Evolution of particle size and concentration in the Rhone river mixing zone: influence of salt flocculation. Cont. Shelf Res., 21 (18-19), 2127-2140.
Touzani, A., Giresse, P., 2002. The Rhône River Prodelta: Short-Term (100–103 Year) Sedimentation Patterns and Human Impact. J. Coast. Res., 18 (1), 102–117.
Trincardi, F., Cattaneo, A., Correggiari, A, Ridente, D., 2004. Evidence of soft sediment deformation, fluid escape, sediment failure and regional weak layers within the Late Quaternary mud deposits of the Adriatic Sea. Mar. Geol., 213, 91-119.
Trincardi, F., Normark, W.R., 1988. Sediment waves on the Tiber prodelta slope: Interaction of deltaic sedimentation and currents along the shelf. Geo-Mar. Lett., 149-157.
Van der Wal, D., Pye, K., 2003. The use of historical bathymetric charts in a GIS to assess morphological change in estuaries. Geographical J., 169, 21-31.
Vivian, H., 1989. Hydrological Changes of the Rhone River. Chap 4 in Petts, G.E., Möller, H., Roux, A.L. (Eds.), Historical Change of large alluvial Rivers: Western Europe, John Wiley & Sons, Chichester, 57 - 77.
Wright, L. D., 1977, Sediment transport at river mouths: a synthesis: Geol. Soc. Am. Bull., 88, 857-868. Zuo, Z., Eisma, D., Gieles, R., Beks J., 1997. Accumulation rates and sediment deposition in the
northwestern Mediterranean. Deep-Sea Res. II, 44, 3-4, 597-609.
13

9. Tables, Figure legends, Tables Table captions Table 1: Characteristic values for the Grand Rhône River at Arles, downstream of the diffluence, 40 km
upstream of the Grand Rhône mouth. * Estimated value. Data from Compagnie Nationale du Rhône (CNR).
Table 2: 2003 Flood event characteristics at Beaucaire, upstream of the diffluence, 60 km upstream the Grand Rhône mouth. *Estimated value. (data from CNR).
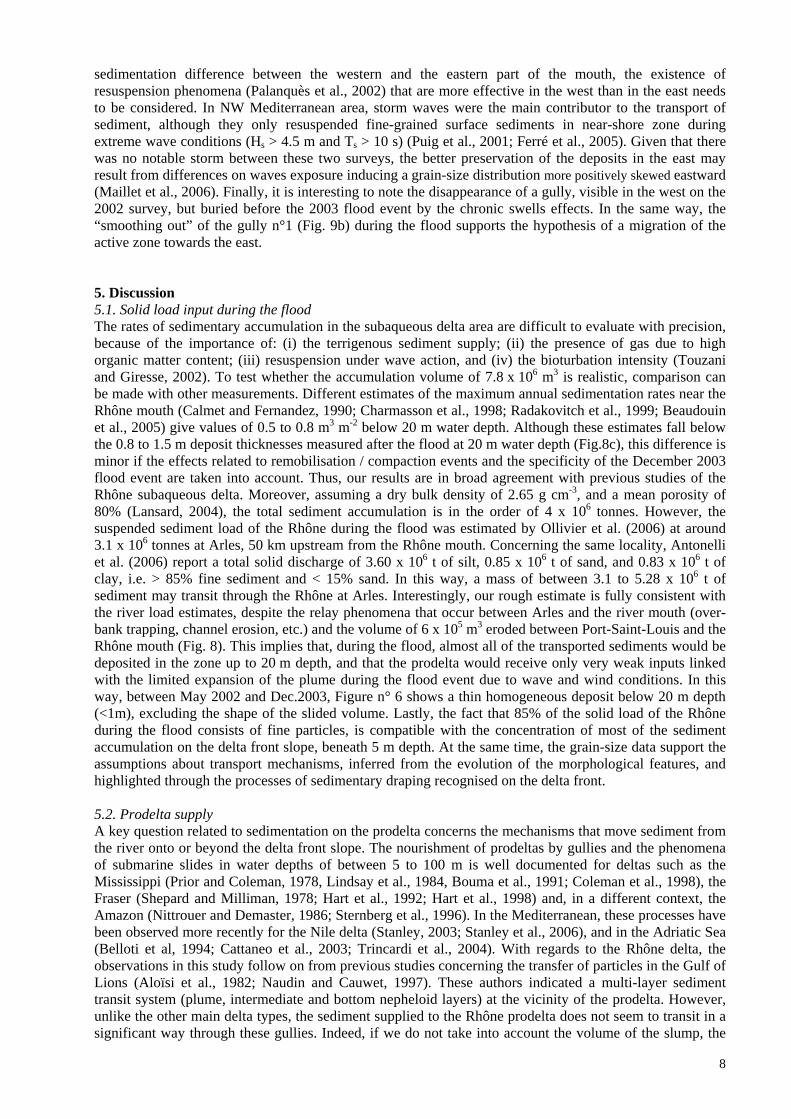
Table 3: Dates of measurement and tools used for the six cruises considered in this study. Table 4: Summary of seafloor morphology characteristics, Grand Rhône mouth Table 5: Evolution of seafloor morphology characteristics during 2003 flood event (b: before flood; a: after
flood) Slope <0 means reversal of slope. Figures captions Figure n°1: Location maps of the study area. (a) Hydrographic basin of the Rhône River and its tributaries.
1: Beaucaire gauging station. 2: Arles gauging station. (b) Location of Rhône River mouth in the lower delta plain area. (c) Local setting of the present river mouth (Roustan mouth). A-B is the location of the ADCP profiles shown in Figure n°5; P1 to P5 are the bathymetric profiles across the river shown in Figure n° 6; C-D and E-F are the bathymetric profiles shown in Figure n°8.
Figure n°2 Flood hydrographs at Beaucaire gauging station for 2003 flood event: (a) Mean daily liquid discharge (m3 s-1) and mean hourly liquid discharge (m3.s-1). (b) Timing of cruises. (c) Climatic conditions during the flood period. Directions are designed with conventional marine chart (origin direction for wind and displacement direction for waves).
Figure n°3: Bathymetric DTM before 2003 flood event. Study area is divided into three parts: (a) River channel, (b) mouth-bar and (c) Delta-front (Rhône03 cruise). In the mouth-bar area, the incised sub-channel is well marked and leads to a shoal mouth bar. Most of the alluvial flow takes place via a bypass channel through the mouth bar to the east, and via a broad depressed zone to the west. A slump scar is visible on the delta front, linked to a submarine slide occurring before the December 2003 flood. Submarine gullies on the delta-front slope extend from the base of the mouth-bar to the top of the prodelta (between -4m and -30m isobaths).
Figure n°4: Detailed bathymetric DTM of the Grand Rhône subaqueous lobe with evidences of slope failure and gully features.
Figure n°5: Morphology of the delta-front slope. Sketch detailing the slide area dimensions with (W) is the wide scar, (L) is the length scar, (HH) is the headscarp height, (β) is the maximum slope gradient (15°) and (α) is the approximate average slope gradient of the delta front (see the text).
Figure n°6: Morpho-bathymetric difference observed between the multibeam surveys of May 2002 and December 2003 (Cruise Strataform1 and RhoneFlood) on the prodelta area. Only a thin cover of sediment was deposited in this zone since 2002 and slided mass shape was not deleted by 2003 flood event dynamics.
Figure n°7: Hydrodynamic conditions on the delta-front slope during low stage period in 2003 November (mean Rhône discharge = 1200 m3 s-1, mean wave height = 0.2 m) along AB profile (position on figure n°1). (a) ADCP-measured current velocity (m s-1) and (b) acoustic backscatter (dB). Backscatter is an indication of suspended sediments in the water column. These images depict homogeneous velocities in the water column with an increase in suspended sediment near the sea surface (plume). Gullies appear to be inactive.
Figure n°8: Overlay of surveyed river-channel sections showing river bed adjustments (in cubic metres) during 2003 flood event (profiles location on figure n°1). Small lettering indicate partial sedimentary budget. Large lettering indicate total budget along each profiles. Black and grey figures refer to erosion and accumulation budgets, respectively. To a first approximation, 600.000 m3 of sediment have been eroded. Maximum sub-channel incision (6 m) occurs in the eastern and lower part of the Rhone River Channel.
Figure n°9: Bathymetric changes in metres during the 2003 flood event at the Rhône mouth, between 0 and -20 m depth. A significant total volume (Vt) of 7.8 millions m3 (about 4 millions tons) was sedimented in this area, corresponding to a mean volume per unit area (Vm) of about 0.88 m3 m-2. These values are in accordance with upstream fluvial measurements that quantified flood solid discharge between 3.1 and 5.28 millions tons.
Figure n°10: Bathymetric variation along two profiles across the Rhône subaqueous lobe from DTM data. Detailed location on figure n°1 (a) cross-shore profiles before the 2003 flood event (Rhone03
14

cruise), just after flood event (MATRhône1 cruise) and one month later (MATRhône2 cruise). Post-flood deposition mechanisms are highlighted and sediment remobilisation by waves is in evidence down to 6 m depth. (b) long-shore profiles across the delta-front. The 2002 profile (Strataform1 cruise) is used as a reference profile. Bathymetric and morphological changes induced by the 2003 flood event are shown comparing the pre-flood and post-flood profiles. Numerals define the order of gullies in an eastward direction. Features are preserved during the flood event, so settling out processes are presumed predominant. Note the creation of a new channel during the flood event (n°5), being the morphological expression of local hyperpycnal coarse sediment transfer.
Tables
ARLES Low regime Median regime High regime
Average Discharge < 650 m3.s-1 1.710 m3.s-1 > 5.000 m3.s-1
Duration (day.yr-1) 35 325 5 Average Surf water velocity 0.15 m.s-1 0.5 m.s-1 1.3 m.s-1
Surf water elevation +1.6 m +1.8 m +5.5 m Extreme Events 380 m3.s-1 *11.000 – 12.000 m3.s-1
Table 1
Peak discharge (m3.s-1) *[11000-12000] Max. mean daily discharge (m3.s-1) 10521 Return period (years) >200 Flood rise gradient (m3.s-1.h-1) 200 Surface water velocity (m.s-1) 2.56 Discharge > 8000 m3.s-1 (h) 62 Discharge > 10000 m3.s-1 (h) 46
2 days 2.8 Total liquid volume (109.m3) 6 days 3.8 Table 2
Date Cruise Surveyed zone Tools Main result
10-11 May 2002 Strataform 1 -17 m / -80 m Multibeam EM1000 echo-sounding / chirp
Initial assessment
3-10 November 2003 Rhône 03 Channel / mouth-bar & -5 m / -25m
Monobeam echo-sounding ADCP
pre-flood DTM
01-06 December 2003 Flood event
09 December 2003 MATRhône 1 Channel / mouth-bar Monobeam echo-sounding
15 December 2003 Rhône Flood -17 m / -80 m Multibeam EM1000 echo-
sounding / chirp / box-coring
14 January 2004 MATRhône2
-3m / -17 m Western part
Multibeam RESON 8101 echo-sounding
26 January 2004 MATRhône2
-3 m / -22 m Eastern part
Multibeam RESON 8101 echo-sounding
post-flood
DTM
Table 3
15
River channel(sub-channels)
Mouth-Bar (bypass channel)
Prodelta front (gullies)
inside -1 to -12Bathymetric zonation (m) 0 to -23 outside -1 to -4 -4 to -20
inside -0.309 Slope (°) 0.032 outside 0.488 4.130
Sinuosity 1.06 1.11 ≈1.01 Number 1-2 1 4
Maximum Depth (m)
11.7 3.6 1.3
Width (m) 165 to 413 160 140 to 310 Table 4
Mean Slope (°)
No. of Channels
Max. Channel
Depth (m)
Max. Channel
Width (m)
Min. Channel
Width (m) ZONE
b a b a b a b a b a River channel 0.032 0.073 1-2 1-2 -11.7 -17 413 395 165 180 Mouth-bar -
0.319 -
0.308 1 1 3.6 4.0 160 190 160 180
Prodelta front 4.13 4.32 4 5 2.10 2.18 370 378 145 148 Table 5
16

Marseille
Lyon
Isère
Saône
Ardèche
Gard
Durance
Ain
Drôme
N
0 50km
CE
VE
NN
ES
ALPINE
MOUNTAINS
Rhône
21
Rhône Delta
(a)
ARLES
RHONE
DELTA
Petit Rhône
Gra
nd
Rhône
0 10km
N
MEDITERRANEAN
SEA
La Crau
Lyon
Marseille
Gra
cieu
se S
pit
Port-Saint-Louis-
du-Rhône
Gulf of Fos
C
DE
F
AB
P4
P5
P3
P2
P1
0 2km
N
4°46'E 4°50'E 4°54'E
43°20,5'N
43°22,5'N
43°24,5'N
Piémanson Beach
Roustan Mouth
(c)
(b)
c
b
a
Figure 1

0
2000
4000
6000
8000
10000
1200001/10/03 01/11/03 01/12/03 01/01/04 01/02/04
Time (day)
Rhone 03 MATRhone 1
Rhone flood
MATRhone 2
MATRhone 2
01/03/04
Flood period14000
10000
6000
2000
0
0 24 48 72
03/12/03
03h00 GMT
96 120 144Time (Hours)
(m
3/s
)(a)
(b)
(c)
0
4
8
12
16
Win
d m
ain
sp
ee
d (
m/s
)
Win
d m
ain
dir
ectio
n (
°N)
0
1
2
3
4
5
6
Waves H
max (
m)
0
60
120
180
240
300
360
Wa
ve
s m
ain
Dir
ectio
n (
°N)
Hmax
maindir
0
60
120
180
240
300
360
01/12 03/12 05/12 07/12 09/12 11/12 13/12 15/12
Time (days)
main speed
main dir
Figure 2

Bypass Channel
2000 m
Gracieuse Spit
Port Saint Louisdu Rhône
Delta frontpart (c)
Prodelta
Mouth Barpart (b)
Sub-ChannelsRhône River
Channel part (a)
04°48'00'' E
04°49'48'' E
04°51'36'' E
0 2000m1000
04°53'24'' E
43°22'48'' N
43°21'00'' N
43°19'12'' N
43°18'24'' N
Bathymetry (m)
Figure 3

55
50
45
40
35
30
252010
2
5
2
4°50'0"E 4°51'0"E 4°52'0"E
43°18'30"N
43°19'30"N
55
50
45
40
35
30
252010
2
5
2
4°50'30"E 4°51'30"E
43°19'0"N
43°20'0"N
Scale: 1/23 000Mercator N38 projectionEllipsoid WGS84
Pockmark?
Slided mass
Gullies
Slump scarp
Top of theMouth Bar
1 2 34
Figure 4

a
bHH
L
AB
C
0 400
N
WHH
a
-3 m
-23 m
Step : 1 m -30 m-3 mmeters
Figure 5

Scale: 1/15 000
Mercator N38 projection
Ellipsoid WGS84
-0.1 +0.1 +1 +2 +2.5
Bathymetric difference (m)
Figure 6
A B
Figure 7
P1
P2 P3
P5
-8
-4
0 100 200 300 400NESW
Dep
th (m
)
-8
-4
0 200 400 600NESW
Dep
th (m
)
-8
-4
0 200 400 600EW
Dep
th (m
)
P4
-12
-8
-4
0 200 400 600 800EW
Dep
th (m
)
-16
-12
-8
-4
0 200 400 600 800
Dep
th (m
)
EW
Accumulation Erosion
-220
+223 +280
-849
-369
-203
+77
-99
+221+93
+194
+123-267
-700
+314
-683
P1
P2
P3
P4
P5
Port Saint Louis du Rhône
MediterraneanSea
Rhône River
dyke
803000800000797000 806000
125000
121000
117000
803000800000797000
19e c. Rhône mouth
N
Figure 8
12
3
4
56
7
8
43°20.5'
43°19.5'
43°20'
43°19'
4°50' 4°51' 4°52'
4°49.5' 4°50.5' 4°51.5' 4°52.5'
N
0 800meters
-6 +4+2+1+0.1-0.1-1-2-4 +6
Bathymetric difference (m)
Figure 9

-30
-25
-20
-15
-10
-5
0 500 1000 1500 2000 25000
Meters
dept
h (m
)C D
before 2003 flood
one month later
after 2003 flood
a)
-22
-21
-20
-19
-18
-170 500 1000 1500 2000 2500 3000 3500
Meters
dept
h (m
)
2002 before 2003 flood after 2003 flood
1 2
543SlopeFailure
E Fb)
CD
EF
BurriedGully
Figure 10
Top Related
Copyright © 2022 FDOKUMEN

