


Bahasa
Halaman
Hukum

4372–4388 Nucleic Acids Research, 2022, Vol. 50, No. 8 Published online 7 April 2022https://doi.org/10.1093/nar/gkac208
Modulation of RNA stability regulates geneexpression in two opposite ways: through buffering ofRNA levels upon global perturbations and bysupporting adapted differential expressionMarie-Line Faucillion, Anna-Mia Johansson and Jan Larsson *
Department of Molecular Biology, Umea University, 901 87 Umea, Sweden
Received September 07, 2021; Revised March 09, 2022; Editorial Decision March 15, 2022; Accepted March 17, 2022
ABSTRACT
The steady state levels of RNAs, often referred to asexpression levels, result from a well-balanced com-bination of RNA transcription and decay. Alterationsin RNA levels will therefore result from tight regula-tion of transcription rates, decay rates or both. Here,we explore the role of RNA stability in achieving bal-anced gene expression and present genome-wideRNA stabilities in Drosophila melanogaster male andfemale cells as well as male cells depleted of proteinsessential for dosage compensation. We identify twodistinct RNA-stability mediated responses involvedin regulation of gene expression. The first of theseresponds to acute and global changes in transcrip-tion and thus counteracts potentially harmful genemis-expression by shifting the RNA stability in thedirection opposite to the transcriptional change. Thesecond response enhances inter-individual differen-tial gene expression by adjusting the RNA stability inthe same direction as a transcriptional change. Bothmechanisms are global, act on housekeeping as wellas non-housekeeping genes and were observed inboth flies and mammals. Additionally, we show that,in contrast to mammals, modulation of RNA stabilitydoes not detectably contribute to dosage compensa-tion of the sex-chromosomes in D. melanogaster.
INTRODUCTION
The term gene expression is used liberally to refer to any-thing from the steady state levels of gene products, eithermRNA as an intermediate stage or protein as the final ef-fector molecule, to the generation of gene products, therebydescribing measures of transcription or translation output.Commonly, the term refers to the steady state levels ofRNA. However, the dynamics of gene expression requireadditional steps that are often overlooked: the decay of the
RNAs and the decay of the proteins, since the steady statelevels of a molecule are defined by both its production andits decay rate, which are equally important (1). In fact, itwas brought forward that the modulation of RNA stabilityis essential in order to quickly down-regulate otherwise sta-ble RNAs after a change in conditions because such down-regulation cannot be explained solely by a complete tran-scriptional shut-off (2,3).
The maintenance of balanced gene expression is centralfor the fitness of an organism, and multiple mechanismsacross all levels of gene expression must cooperate and ac-commodate for changes in gene dosage in order to con-tribute to the final harmony. In cases of failure, the alterna-tive gene dose will not be passed on to the next generation.The broad definition of dosage compensation englobes theconsequences of mechanisms whose purpose is to restorethe ‘original expression levels’ following a change in genedose. This difference in gene dose can be acquired across along timescale through evolution, as is the case for the het-eromorphic sex chromosomes. Alternatively, these changescan occur rapidly following segmental chromosomal dupli-cation or deletion (or even monosomies and trisomies, whenthese conditions are viable, such as trisomy 21 in humansand monosomy or trisomy of the fourth chromosome in D.melanogaster). The latter form of compensation is gener-ally referred to as buffering, and it can also include com-pensation for gene mis-expression following, for example,single mutations in transcription factors with broad targets(4–6). Our view is that buffering is not expected to be ef-fected through a single mechanism, but rather the resultof a set of strategies aiming toward the same goal: min-imizing the differences in final gene expression, and cantherefore occur both at the RNA level and at the proteinlevel.
Dosage compensation of the sex chromosomes inXX/XY systems aims to rebalance gene expression be-tween the X-chromosome and the autosomes and alsobetween males and females subsequent to the evolutionof the sex chromosomes where males have lost one gene
*To whom correspondence should be addressed. Tel: +46 90 785 67 85; Email: [email protected]
C© The Author(s) 2022. Published by Oxford University Press on behalf of Nucleic Acids Research.This is an Open Access article distributed under the terms of the Creative Commons Attribution License (http://creativecommons.org/licenses/by/4.0/), whichpermits unrestricted reuse, distribution, and reproduction in any medium, provided the original work is properly cited.
Dow
nloaded from https://academ
ic.oup.com/nar/article/50/8/4372/6564801 by guest on 15 July 2022
Nucleic Acids Research, 2022, Vol. 50, No. 8 4373
dose of most X-linked genes through the degeneration ofthe Y-chromosome (7,8). In mammals, this is achievedthrough the random inactivation of one of the two fe-male X-chromosomes (9), potentially accompanied by,a still controversial 2-fold increase in expression fromthe X-chromosome in both sexes (10–16). Recent anal-yses, focused on regulation of expression beyond tran-script levels in mammals, suggest that higher RNA stabil-ity and higher translation rates of the X-chromosome con-tribute to such chromosome specific increase in expression(17,18).
In D. melanogaster, where it is widely accepted thatthere is a 2-fold increase in RNA levels from the maleX-chromosome (19–21), dosage compensation of the sexchromosomes is thought to result from a combination ofgeneral buffering effects that act on all monosomic re-gions and the specific targeting and stimulation of tran-scription of the male single X-chromosome by the male-specific lethal (MSL) complex (5,21–24). However, it isstill not clear whether the increase in transcription isdue to increased transcriptional elongation, initiation ora combination of both (25–27). It should be noted thata large proportion of genes have been reported to bedosage compensated without being targeted by the MSLcomplex (4).
In the current study, we aim to explore the role of RNAstability in establishing balanced genome-wide expressionand to provide the community with genome-wide data onRNA stability in D. melanogaster. To accomplish this, wedetermined RNA half-lives for transcripts from 60 to 70%of all genes expressed in D. melanogaster male and fe-male cells. Our approach is based on BRIC-seq, a non-destructive method for the estimation of the physiologicaldecay rates of RNAs genome-wide (28). We analyzed dif-ferences in RNA half-lives and ribosome densities to de-termine whether and how differential RNA stability andtranslational activity are mechanisms involved in maintain-ing balanced expression.
Here, we uncover two RNA stability mediated responsesfor the regulation of gene expression. The first is a gen-eral response that buffers RNA levels following an inducedchange in transcription output and acts on all chromosomesby modulating RNA stability in order to counteract bothinduced decreases and increases in transcription. The sec-ond acts on adapted differential expression and enhances,for example cell type specific adapted expression that is es-tablished at the transcriptional level. Additionally, we findno evidence of a role for RNA stability in X-chromosomedosage compensation in flies.
MATERIALS AND METHODS
Cell lines and cell culture
Schneider’s Drosophila line 2, S2 DRSC (male) and Kc167(female) cell lines were cultivated in Schneider’s mediummodified with L-glutamine (Lonza) and supplemented with10% Fetal Bovine Serum, 100 units/ml penicillin and 100�g/ml streptomycin. The S2 cells were grown in T-flasks at25◦C and the Kc167 cells were grown in suspension in Er-lenmeyer glass flasks in a cabinet at 23◦C.
RNAi treatment of Drosophila cells
The DNA templates used to make the dsRNA for msl2 andmle RNAi were obtained by PCR using genomic DNA fromwild type Oregon R flies and the following primers:
Fmsl2: TAATACGACTCACTATAGGGAGAGTTGGCTGTGCTGGCTG,
Rmsl2: TAATACGACTCACTATAGGGAGATGTTGGCTCGTCACTGTC,
Fmle: TAATACGAACTCACTATAGGGGCAACAGGATGGCGAAAAA,
Rmle: TAATACGACTCACTATAGGGTCTGGGTAGTCTTTCCGCAC.
The DNA template used to make the dsRNA for yfpRNAi was obtained by PCR using pEYFP-N1 plasmidDNA (Clontech) and the following primers to introduce theT7 promoter:
FeYFP: TAATACGACTCACTATAGGGAGAGGTGAGCAAGGGCGAGGAGCT,
ReYFP: TAATACGACTCACTATAGGGAGATCTTGAAGTTCACCTTGATGCCG.
The DNA templates were purified and dsRNA was gen-erated using the T7 RiboMAX Express Large Scale RNAproduction system (Promega) or the T7 High Yield RNASynthesis Kit (NEB) according to the manufacturer’s in-structions.
BRIC (Bromouridine Immunoprecipitation Chase)
Our BRIC protocol is based on a protocol from (28) whichwe have adapted to the two D. melanogaster cell lines used.Briefly, all RNAs of a cell are labeled with the uridine ana-log 5-bromouridine (BrU). Next, the cells are washed andresuspended in fresh media without BrU. From this point(t = 0) on, the cells are allowed to continue growing in nor-mal conditions and the RNAs that are degraded will bereplaced over time by newly synthesized unlabeled RNAs.Cell samples are collected at multiple time points and theBrU labeled RNAs are separated by immunoprecipitationusing an anti-BrU antibody. The BrU labeled RNAs arethen sequenced, and the individual RNA half-lives can bededuced from the rate at which transcripts leave the BrUlabeled fraction of RNAs.
RNAi and BrU labeling
A total of 2 × 10⁶ (S2, DRSC) living cells/ml per time pointwere seeded in 6-well plates or cell culture flasks and incu-bated for 15–60 min at 25◦C to allow the cells to attach tothe surface. For the RNAi experiment, 2 × 10⁶ live cells/mlwere collected and resuspended in serum-free antibiotic-free medium. About 20 �g dsRNA/ml were added to thecell culture, followed by 30 min incubation at room temper-ature. Then the cell cultures were diluted 1:1 with mediumcontaining 20% fetal bovine serum, 200 units/ml penicillinand 200 �g/ml streptomycin and incubated at 25◦C inflasks/plates for 4 days. The RNAi treatment was repeatedas above on the same cells resuspended at 2 × 10⁶ livecells/ml and incubated for 1 more day. For western blotanalysis, protein extracts were run on a 10% SDS–PAGEgel and thereafter transferred to a PVDF membrane for 2h 30 min at 25 V. Primary and secondary antibodies [rabbit
Dow
nloaded from https://academ
ic.oup.com/nar/article/50/8/4372/6564801 by guest on 15 July 2022
4374 Nucleic Acids Research, 2022, Vol. 50, No. 8
anti-MLE (1:10 000) and donkey anti rabbit-HPR (JacksonImmunoResearch, 1:10 000), mouse anti-tubulin (SIGMA,T5168, 1:10 000) and goat anti mouse-HPR (Thermo Sci-entific, 1:10 000)] were diluted in 1× PBS, 1% BSA, 0.05%Tween-20. Note that MSL2 was not assessed by westernblot due to the poor performance of our MSL2 antibodiesin that assay. For the labeling, Bromouridine (BrU) (Sigmaor Alfa Aesar) dissolved in culture medium was added to thesamples to a final concentration of 10 mM every third hourfor 24 h (for the RNAi experiments, dsRNA was also addedevery third hour to a final concentration of 10 �g/ml).
For labeling the Kc167 cells, cells were resuspended at aconcentration of 1 × 10⁶ cells/ml in an Erlenmeyer flaskwith shaking and incubated for 24 h with a first addition offresh BrU at a final concentration of 400 �M at the begin-ning and a second addition of fresh BrU after 12 h.
Sample collection
After 24 h of BrU labeling, all cells were washed twice withfresh medium (or PBS). Samples of 2 ml for the S2 cellsand 10 ml for the Kc167 cells were collected at specific timepoints (0, 1, 2, 4, 8, 12 and 16 h) by removing the media andresuspending the cells in appropriate amount of TRIzol LS(Ambion Life Technology) for storage at −80◦C.
RNA preparation and immunoprecipitation
RNA was extracted by the alternative protocol provided bythe manufacturer of TRIzol LS (Ambion Life Technology)that uses 1-bromo-3-chloropropane (BCP) instead of chlo-roform. According to the manufacturer, BCP reduces therisk of DNA contamination of RNA samples and is lesstoxic than chloroform. The RNA was resuspended in 20�l of RNAse-free water and incubated at 55–60◦C for 10–15 min and the concentrations were measured with a Nan-oDrop (Thermo Scientific). Immunoprecipitation of BrUlabeled RNA from S2 cells was done according to the pro-tocol described in (28) while we used a BRIC-kit (MBL) forthe Kc167 samples and followed the manufacturer’s proto-col.
Library preparation and sequencing
The sequencing libraries were made with TruSeq RNASample Preparation v2 (Illumina) according to the man-ufacturer’s instructions. The samples were sequenced atdifferent times, all on Illumina sequencing machines(HiSeq2500 or NovaSeq6000) with paired-end sequenc-ing and a read length of 126 and 151 nucleotides respec-tively. All sequencing data were mapped to D. melanogastergenome version 6.33 using STAR version 2.7.0e and de-fault parameters. For each gene and each time point, readswere counted using HTSeq version 0.9.1. The BRIC-seqand RNA-seq data reported in this paper have been de-posited in the European Nucleotide Archive with accessionnumber PRJEB15335.
Half-life calculation
To remove genes expressed at low levels from our dataset,genes with a sum of raw read counts below 10 as well
as genes with a cpm (count per million as determined byEdgeR) below 2, for time point t = 0, t = 1 or t = 2 h werefiltered out. For genes with rapidly decaying transcripts, thelatest time points give very low read counts and the signal ismainly noise, therefore we filtered out all time points witha cpm below 0.5 as well as the period of time coming aftera filtered out time point. For the latest time points, in somecases the cpm values increase again due to the fact that thecomposition is biased toward stable genes. If the increasefrom one time point to the next is >200%, then the latertime point is removed together with all the subsequent timepoints. In order to correct for biased gene composition atlater time points, we calculated and applied normalizationfactors. To do this, only genes with data for all time pointswere sequentially fitted to an exponential decay curve us-ing the nls function from the nls2 package in R. Correc-tion coefficients that turn the gene decay curve into a per-fect exponential decay curve were collected for each geneand each time point and averaged per time point to formthe normalization factors. These factors were applied to thefull dataset.
To calculate half-lives, the available time points for eachgene were fitted to an exponential decay curve using nls withthe formula a*exp(-b*t) and the half-lives were calculated asln(2)/b. The replicates were pooled together by calculatingthe average if both values were between 0 and 16 h. Half-life values above 16 h or negative indicate that the RNAsare very stable and these genes were arbitrarily given a 16 hhalf-life. Of the genes classified as expressed, we were able todetermine the half-life for 60–70%. For the remaining genes,the decay curve could not be fitted because either its shapewas very different from a first order exponential decay or wedid not have enough valid time points due to the very rapiddecay of some weakly expressed genes.
GeTMM calculations
GeTMM was chosen to calculate and compare transcriptlevels because it performs well for both intrasample and in-tersample comparisons, and the GeTMM values were cal-culated as presented in (29). Briefly, these values are ob-tained by inputting TPMs instead of raw read counts intothe edgeR normalization method TMM (Trimmed Mean ofM-values). In this way, gene length is taken into account innormalization. Genes were defined as expressed, and werethus included, if the transcript level was > 0.2 GeTMM inboth our male (S2) and female (Kc167) samples.
Ribosome density calculations
The RNA-seq and ribo-seq data were generated by (30)and the read counts for coding sequence (CDS) were down-loaded from GEO accession numbers GSM2845525 andGSM2845527. TPMs for both experiments were calculatedas described in (29) using the sum of non-overlapping CDSas gene length. Genes having a raw read count for the ribo-seq data < 10, a raw read count for the RNA-seq data < 50,a TPM value for the ribo-seq data < 2 or a TPM value forthe RNA-seq data < 5 were filtered out. For the remaininggenes, the ribosome density was calculated for each gene, asthe ratio of the TPM from the ribo-seq experiment over theTPM from the RNA-seq experiment.
Dow
nloaded from https://academ
ic.oup.com/nar/article/50/8/4372/6564801 by guest on 15 July 2022
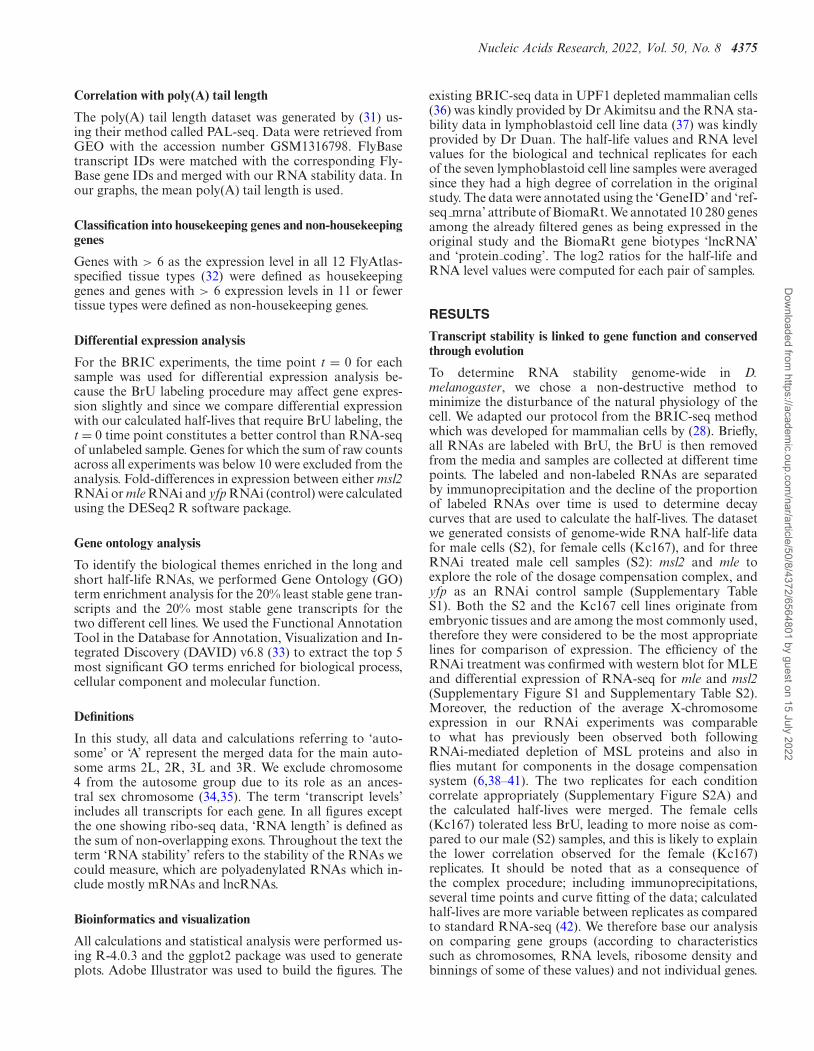
Nucleic Acids Research, 2022, Vol. 50, No. 8 4375
Correlation with poly(A) tail length
The poly(A) tail length dataset was generated by (31) us-ing their method called PAL-seq. Data were retrieved fromGEO with the accession number GSM1316798. FlyBasetranscript IDs were matched with the corresponding Fly-Base gene IDs and merged with our RNA stability data. Inour graphs, the mean poly(A) tail length is used.
Classification into housekeeping genes and non-housekeepinggenes
Genes with > 6 as the expression level in all 12 FlyAtlas-specified tissue types (32) were defined as housekeepinggenes and genes with > 6 expression levels in 11 or fewertissue types were defined as non-housekeeping genes.
Differential expression analysis
For the BRIC experiments, the time point t = 0 for eachsample was used for differential expression analysis be-cause the BrU labeling procedure may affect gene expres-sion slightly and since we compare differential expressionwith our calculated half-lives that require BrU labeling, thet = 0 time point constitutes a better control than RNA-seqof unlabeled sample. Genes for which the sum of raw countsacross all experiments was below 10 were excluded from theanalysis. Fold-differences in expression between either msl2RNAi or mle RNAi and yfp RNAi (control) were calculatedusing the DESeq2 R software package.
Gene ontology analysis
To identify the biological themes enriched in the long andshort half-life RNAs, we performed Gene Ontology (GO)term enrichment analysis for the 20% least stable gene tran-scripts and the 20% most stable gene transcripts for thetwo different cell lines. We used the Functional AnnotationTool in the Database for Annotation, Visualization and In-tegrated Discovery (DAVID) v6.8 (33) to extract the top 5most significant GO terms enriched for biological process,cellular component and molecular function.
Definitions
In this study, all data and calculations referring to ‘auto-some’ or ‘A’ represent the merged data for the main auto-some arms 2L, 2R, 3L and 3R. We exclude chromosome4 from the autosome group due to its role as an ances-tral sex chromosome (34,35). The term ‘transcript levels’includes all transcripts for each gene. In all figures exceptthe one showing ribo-seq data, ‘RNA length’ is defined asthe sum of non-overlapping exons. Throughout the text theterm ‘RNA stability’ refers to the stability of the RNAs wecould measure, which are polyadenylated RNAs which in-clude mostly mRNAs and lncRNAs.
Bioinformatics and visualization
All calculations and statistical analysis were performed us-ing R-4.0.3 and the ggplot2 package was used to generateplots. Adobe Illustrator was used to build the figures. The
existing BRIC-seq data in UPF1 depleted mammalian cells(36) was kindly provided by Dr Akimitsu and the RNA sta-bility data in lymphoblastoid cell line data (37) was kindlyprovided by Dr Duan. The half-life values and RNA levelvalues for the biological and technical replicates for eachof the seven lymphoblastoid cell line samples were averagedsince they had a high degree of correlation in the originalstudy. The data were annotated using the ‘GeneID’ and ‘ref-seq mrna’ attribute of BiomaRt. We annotated 10 280 genesamong the already filtered genes as being expressed in theoriginal study and the BiomaRt gene biotypes ‘lncRNA’and ‘protein coding’. The log2 ratios for the half-life andRNA level values were computed for each pair of samples.
RESULTS
Transcript stability is linked to gene function and conservedthrough evolution
To determine RNA stability genome-wide in D.melanogaster, we chose a non-destructive method tominimize the disturbance of the natural physiology of thecell. We adapted our protocol from the BRIC-seq methodwhich was developed for mammalian cells by (28). Briefly,all RNAs are labeled with BrU, the BrU is then removedfrom the media and samples are collected at different timepoints. The labeled and non-labeled RNAs are separatedby immunoprecipitation and the decline of the proportionof labeled RNAs over time is used to determine decaycurves that are used to calculate the half-lives. The datasetwe generated consists of genome-wide RNA half-life datafor male cells (S2), for female cells (Kc167), and for threeRNAi treated male cell samples (S2): msl2 and mle toexplore the role of the dosage compensation complex, andyfp as an RNAi control sample (Supplementary TableS1). Both the S2 and the Kc167 cell lines originate fromembryonic tissues and are among the most commonly used,therefore they were considered to be the most appropriatelines for comparison of expression. The efficiency of theRNAi treatment was confirmed with western blot for MLEand differential expression of RNA-seq for mle and msl2(Supplementary Figure S1 and Supplementary Table S2).Moreover, the reduction of the average X-chromosomeexpression in our RNAi experiments was comparableto what has previously been observed both followingRNAi-mediated depletion of MSL proteins and also inflies mutant for components in the dosage compensationsystem (6,38–41). The two replicates for each conditioncorrelate appropriately (Supplementary Figure S2A) andthe calculated half-lives were merged. The female cells(Kc167) tolerated less BrU, leading to more noise as com-pared to our male (S2) samples, and this is likely to explainthe lower correlation observed for the female (Kc167)replicates. It should be noted that as a consequence ofthe complex procedure; including immunoprecipitations,several time points and curve fitting of the data; calculatedhalf-lives are more variable between replicates as comparedto standard RNA-seq (42). We therefore base our analysison comparing gene groups (according to characteristicssuch as chromosomes, RNA levels, ribosome density andbinnings of some of these values) and not individual genes.
Dow
nloaded from https://academ
ic.oup.com/nar/article/50/8/4372/6564801 by guest on 15 July 2022
4376 Nucleic Acids Research, 2022, Vol. 50, No. 8
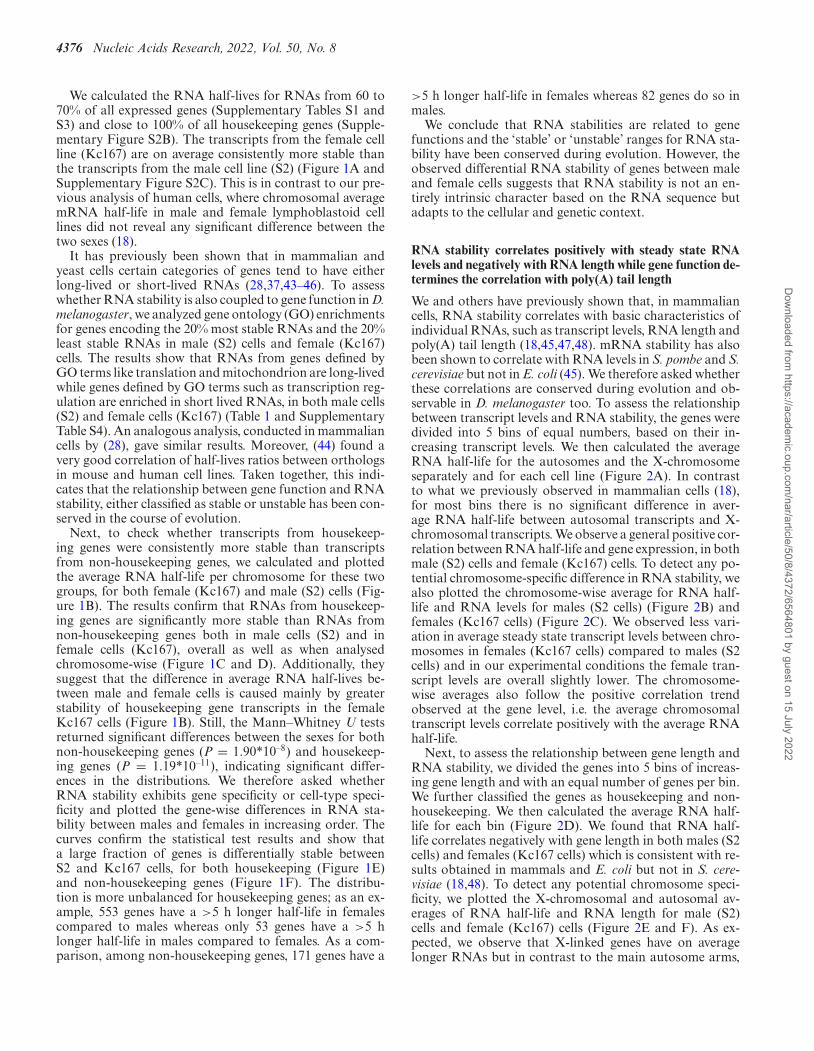
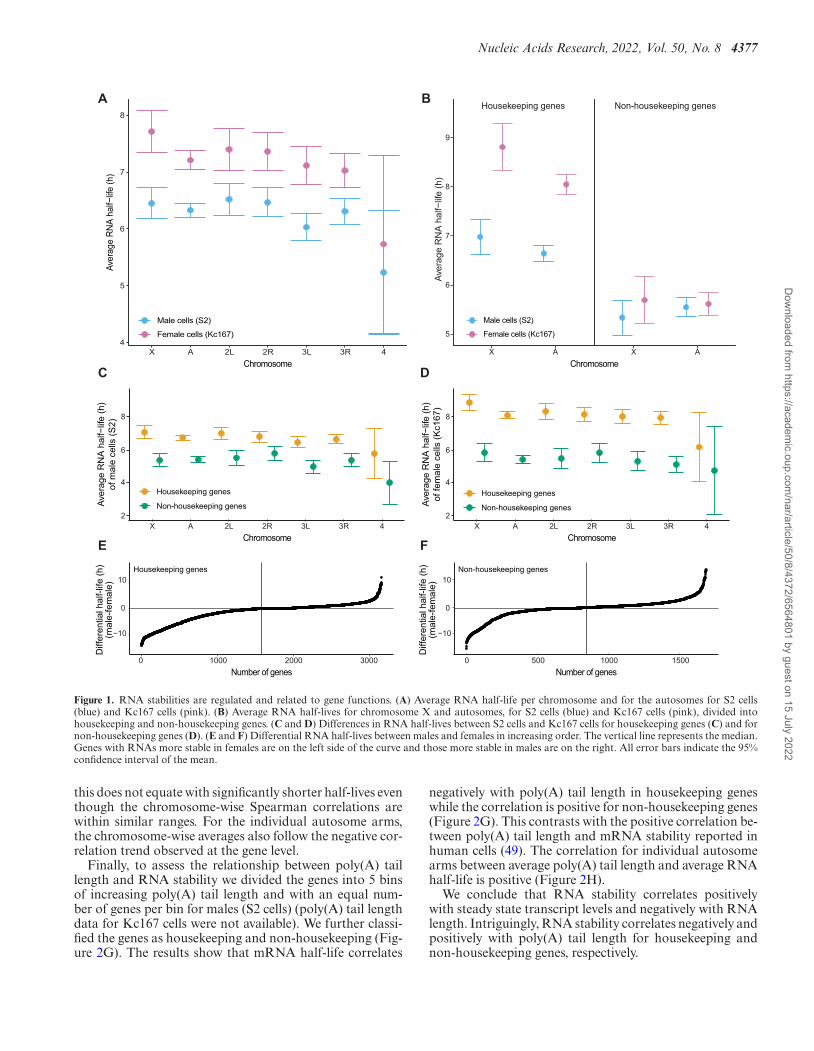
We calculated the RNA half-lives for RNAs from 60 to70% of all expressed genes (Supplementary Tables S1 andS3) and close to 100% of all housekeeping genes (Supple-mentary Figure S2B). The transcripts from the female cellline (Kc167) are on average consistently more stable thanthe transcripts from the male cell line (S2) (Figure 1A andSupplementary Figure S2C). This is in contrast to our pre-vious analysis of human cells, where chromosomal averagemRNA half-life in male and female lymphoblastoid celllines did not reveal any significant difference between thetwo sexes (18).
It has previously been shown that in mammalian andyeast cells certain categories of genes tend to have eitherlong-lived or short-lived RNAs (28,37,43–46). To assesswhether RNA stability is also coupled to gene function in D.melanogaster, we analyzed gene ontology (GO) enrichmentsfor genes encoding the 20% most stable RNAs and the 20%least stable RNAs in male (S2) cells and female (Kc167)cells. The results show that RNAs from genes defined byGO terms like translation and mitochondrion are long-livedwhile genes defined by GO terms such as transcription reg-ulation are enriched in short lived RNAs, in both male cells(S2) and female cells (Kc167) (Table 1 and SupplementaryTable S4). An analogous analysis, conducted in mammaliancells by (28), gave similar results. Moreover, (44) found avery good correlation of half-lives ratios between orthologsin mouse and human cell lines. Taken together, this indi-cates that the relationship between gene function and RNAstability, either classified as stable or unstable has been con-served in the course of evolution.
Next, to check whether transcripts from housekeep-ing genes were consistently more stable than transcriptsfrom non-housekeeping genes, we calculated and plottedthe average RNA half-life per chromosome for these twogroups, for both female (Kc167) and male (S2) cells (Fig-ure 1B). The results confirm that RNAs from housekeep-ing genes are significantly more stable than RNAs fromnon-housekeeping genes both in male cells (S2) and infemale cells (Kc167), overall as well as when analysedchromosome-wise (Figure 1C and D). Additionally, theysuggest that the difference in average RNA half-lives be-tween male and female cells is caused mainly by greaterstability of housekeeping gene transcripts in the femaleKc167 cells (Figure 1B). Still, the Mann–Whitney U testsreturned significant differences between the sexes for bothnon-housekeeping genes (P = 1.90*10–8) and housekeep-ing genes (P = 1.19*10–11), indicating significant differ-ences in the distributions. We therefore asked whetherRNA stability exhibits gene specificity or cell-type speci-ficity and plotted the gene-wise differences in RNA sta-bility between males and females in increasing order. Thecurves confirm the statistical test results and show thata large fraction of genes is differentially stable betweenS2 and Kc167 cells, for both housekeeping (Figure 1E)and non-housekeeping genes (Figure 1F). The distribu-tion is more unbalanced for housekeeping genes; as an ex-ample, 553 genes have a >5 h longer half-life in femalescompared to males whereas only 53 genes have a >5 hlonger half-life in males compared to females. As a com-parison, among non-housekeeping genes, 171 genes have a
>5 h longer half-life in females whereas 82 genes do so inmales.
We conclude that RNA stabilities are related to genefunctions and the ‘stable’ or ‘unstable’ ranges for RNA sta-bility have been conserved during evolution. However, theobserved differential RNA stability of genes between maleand female cells suggests that RNA stability is not an en-tirely intrinsic character based on the RNA sequence butadapts to the cellular and genetic context.
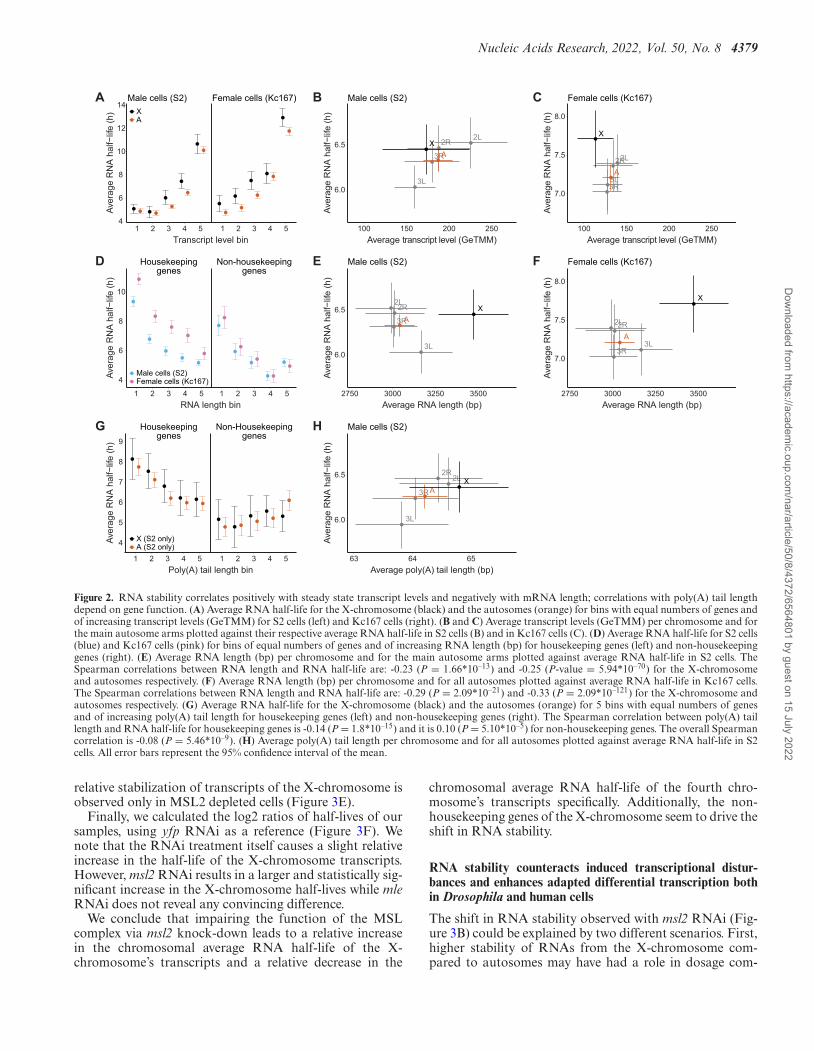
RNA stability correlates positively with steady state RNAlevels and negatively with RNA length while gene function de-termines the correlation with poly(A) tail length
We and others have previously shown that, in mammaliancells, RNA stability correlates with basic characteristics ofindividual RNAs, such as transcript levels, RNA length andpoly(A) tail length (18,45,47,48). mRNA stability has alsobeen shown to correlate with RNA levels in S. pombe and S.cerevisiae but not in E. coli (45). We therefore asked whetherthese correlations are conserved during evolution and ob-servable in D. melanogaster too. To assess the relationshipbetween transcript levels and RNA stability, the genes weredivided into 5 bins of equal numbers, based on their in-creasing transcript levels. We then calculated the averageRNA half-life for the autosomes and the X-chromosomeseparately and for each cell line (Figure 2A). In contrastto what we previously observed in mammalian cells (18),for most bins there is no significant difference in aver-age RNA half-life between autosomal transcripts and X-chromosomal transcripts. We observe a general positive cor-relation between RNA half-life and gene expression, in bothmale (S2) cells and female (Kc167) cells. To detect any po-tential chromosome-specific difference in RNA stability, wealso plotted the chromosome-wise average for RNA half-life and RNA levels for males (S2 cells) (Figure 2B) andfemales (Kc167 cells) (Figure 2C). We observed less vari-ation in average steady state transcript levels between chro-mosomes in females (Kc167 cells) compared to males (S2cells) and in our experimental conditions the female tran-script levels are overall slightly lower. The chromosome-wise averages also follow the positive correlation trendobserved at the gene level, i.e. the average chromosomaltranscript levels correlate positively with the average RNAhalf-life.
Next, to assess the relationship between gene length andRNA stability, we divided the genes into 5 bins of increas-ing gene length and with an equal number of genes per bin.We further classified the genes as housekeeping and non-housekeeping. We then calculated the average RNA half-life for each bin (Figure 2D). We found that RNA half-life correlates negatively with gene length in both males (S2cells) and females (Kc167 cells) which is consistent with re-sults obtained in mammals and E. coli but not in S. cere-visiae (18,48). To detect any potential chromosome speci-ficity, we plotted the X-chromosomal and autosomal av-erages of RNA half-life and RNA length for male (S2)cells and female (Kc167) cells (Figure 2E and F). As ex-pected, we observe that X-linked genes have on averagelonger RNAs but in contrast to the main autosome arms,
Dow
nloaded from https://academ
ic.oup.com/nar/article/50/8/4372/6564801 by guest on 15 July 2022
Nucleic Acids Research, 2022, Vol. 50, No. 8 4377
A
4
5
6
7
8
X A 2L 2R 3L 3R 4
Aver
age
RN
A ha
lf−life
(h)
Female cells (Kc167)
Male cells (S2)
B
X A X A
Housekeeping genes Non-housekeeping genes
5
6
7
8
9
Aver
age
RN
A h
alf−
life
(h)
Female cells (Kc167)
Male cells (S2)
Chromosome Chromosome
E
−10
0
10
0 1000 2000 3000
Diff
eren
tial h
alf-l
ife (h
)(m
ale-
fem
ale)
Housekeeping genes
F
−10
0
10
0 500 1000 1500
Diff
eren
tial h
alf-l
ife (h
)(m
ale-
fem
ale)
Non-housekeeping genes
Number of genes Number of genes
X A 2L 2R 3L 3R 42
4
6
8Av
erag
e R
NA
hal
f−lif
e (h
)of
fem
ale
cells
(Kc1
67)
Housekeeping genes
Non-housekeeping genes
X A 2L 2R 3L 3R 42
4
6
8
Aver
age
RN
A h
alf−
life
(h)
of m
ale
cells
(S2)
Housekeeping genes
Non-housekeeping genes
C D
Chromosome Chromosome
Figure 1. RNA stabilities are regulated and related to gene functions. (A) Average RNA half-life per chromosome and for the autosomes for S2 cells(blue) and Kc167 cells (pink). (B) Average RNA half-lives for chromosome X and autosomes, for S2 cells (blue) and Kc167 cells (pink), divided intohousekeeping and non-housekeeping genes. (C and D) Differences in RNA half-lives between S2 cells and Kc167 cells for housekeeping genes (C) and fornon-housekeeping genes (D). (E and F) Differential RNA half-lives between males and females in increasing order. The vertical line represents the median.Genes with RNAs more stable in females are on the left side of the curve and those more stable in males are on the right. All error bars indicate the 95%confidence interval of the mean.
this does not equate with significantly shorter half-lives eventhough the chromosome-wise Spearman correlations arewithin similar ranges. For the individual autosome arms,the chromosome-wise averages also follow the negative cor-relation trend observed at the gene level.
Finally, to assess the relationship between poly(A) taillength and RNA stability we divided the genes into 5 binsof increasing poly(A) tail length and with an equal num-ber of genes per bin for males (S2 cells) (poly(A) tail lengthdata for Kc167 cells were not available). We further classi-fied the genes as housekeeping and non-housekeeping (Fig-ure 2G). The results show that mRNA half-life correlates
negatively with poly(A) tail length in housekeeping geneswhile the correlation is positive for non-housekeeping genes(Figure 2G). This contrasts with the positive correlation be-tween poly(A) tail length and mRNA stability reported inhuman cells (49). The correlation for individual autosomearms between average poly(A) tail length and average RNAhalf-life is positive (Figure 2H).
We conclude that RNA stability correlates positivelywith steady state transcript levels and negatively with RNAlength. Intriguingly, RNA stability correlates negatively andpositively with poly(A) tail length for housekeeping andnon-housekeeping genes, respectively.
Dow
nloaded from https://academ
ic.oup.com/nar/article/50/8/4372/6564801 by guest on 15 July 2022
4378 Nucleic Acids Research, 2022, Vol. 50, No. 8
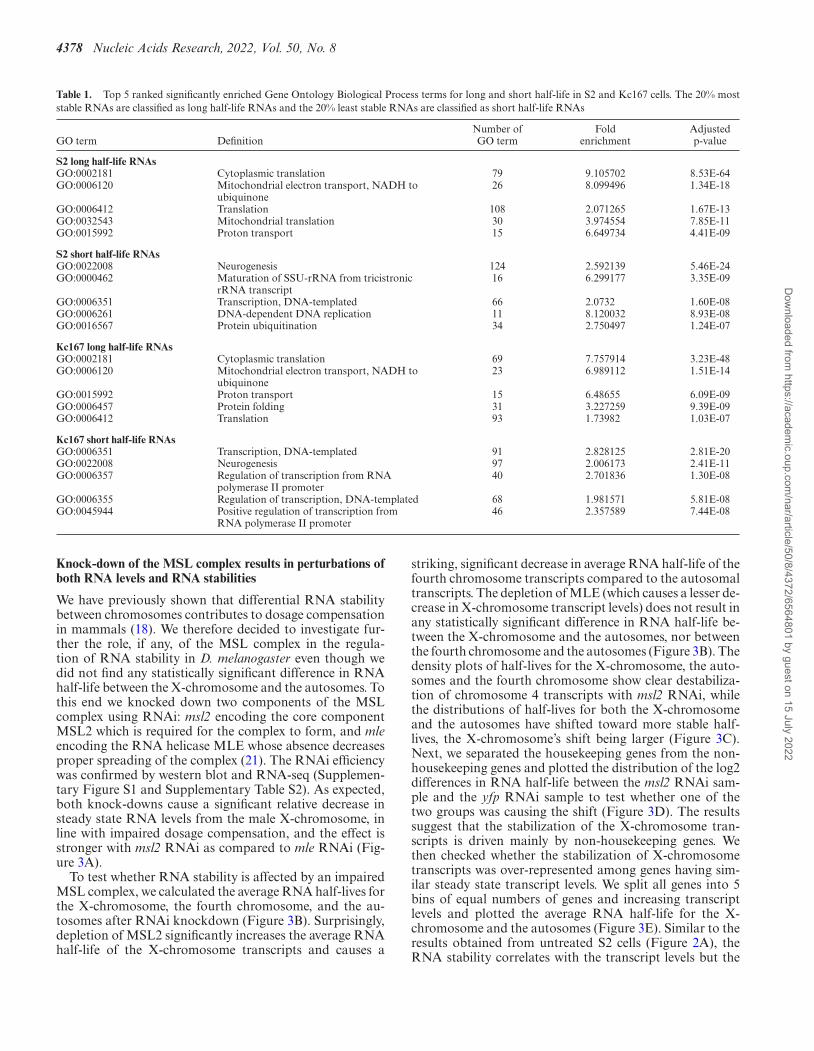
Table 1. Top 5 ranked significantly enriched Gene Ontology Biological Process terms for long and short half-life in S2 and Kc167 cells. The 20% moststable RNAs are classified as long half-life RNAs and the 20% least stable RNAs are classified as short half-life RNAs
GO term DefinitionNumber ofGO term
Foldenrichment
Adjustedp-value
S2 long half-life RNAsGO:0002181 Cytoplasmic translation 79 9.105702 8.53E-64GO:0006120 Mitochondrial electron transport, NADH to
ubiquinone26 8.099496 1.34E-18
GO:0006412 Translation 108 2.071265 1.67E-13GO:0032543 Mitochondrial translation 30 3.974554 7.85E-11GO:0015992 Proton transport 15 6.649734 4.41E-09
S2 short half-life RNAsGO:0022008 Neurogenesis 124 2.592139 5.46E-24GO:0000462 Maturation of SSU-rRNA from tricistronic
rRNA transcript16 6.299177 3.35E-09
GO:0006351 Transcription, DNA-templated 66 2.0732 1.60E-08GO:0006261 DNA-dependent DNA replication 11 8.120032 8.93E-08GO:0016567 Protein ubiquitination 34 2.750497 1.24E-07
Kc167 long half-life RNAsGO:0002181 Cytoplasmic translation 69 7.757914 3.23E-48GO:0006120 Mitochondrial electron transport, NADH to
ubiquinone23 6.989112 1.51E-14
GO:0015992 Proton transport 15 6.48655 6.09E-09GO:0006457 Protein folding 31 3.227259 9.39E-09GO:0006412 Translation 93 1.73982 1.03E-07
Kc167 short half-life RNAsGO:0006351 Transcription, DNA-templated 91 2.828125 2.81E-20GO:0022008 Neurogenesis 97 2.006173 2.41E-11GO:0006357 Regulation of transcription from RNA
polymerase II promoter40 2.701836 1.30E-08
GO:0006355 Regulation of transcription, DNA-templated 68 1.981571 5.81E-08GO:0045944 Positive regulation of transcription from
RNA polymerase II promoter46 2.357589 7.44E-08
Knock-down of the MSL complex results in perturbations ofboth RNA levels and RNA stabilities
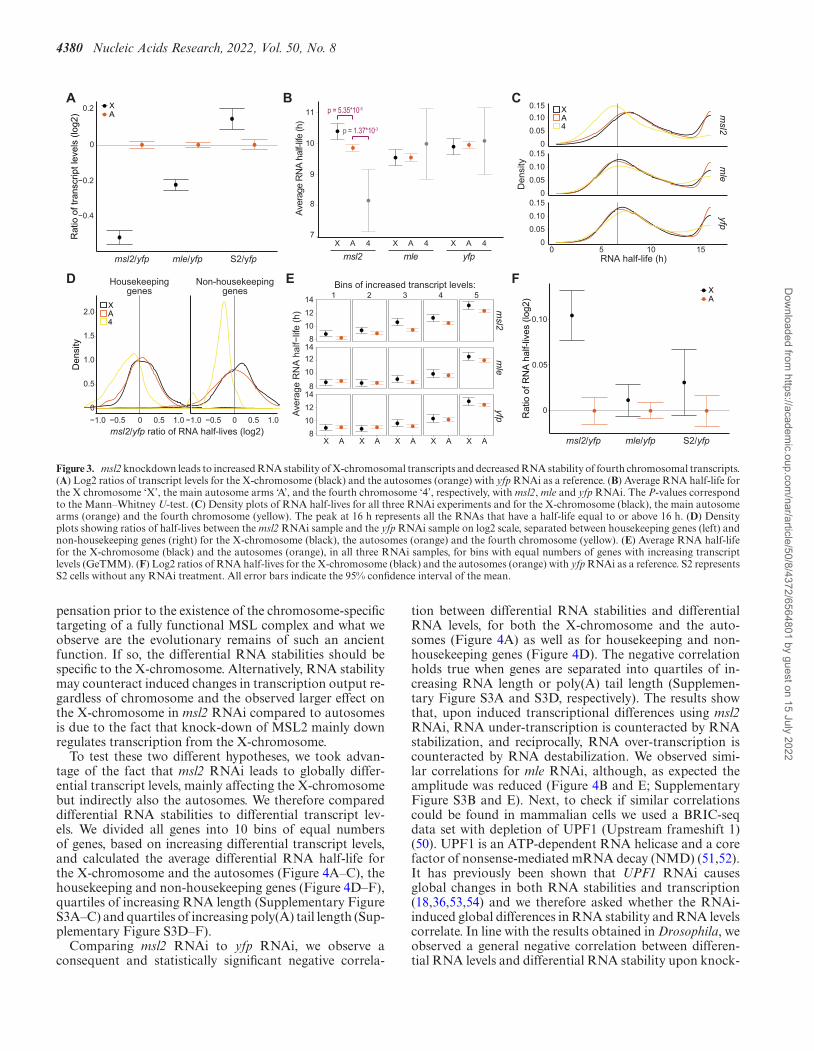
We have previously shown that differential RNA stabilitybetween chromosomes contributes to dosage compensationin mammals (18). We therefore decided to investigate fur-ther the role, if any, of the MSL complex in the regula-tion of RNA stability in D. melanogaster even though wedid not find any statistically significant difference in RNAhalf-life between the X-chromosome and the autosomes. Tothis end we knocked down two components of the MSLcomplex using RNAi: msl2 encoding the core componentMSL2 which is required for the complex to form, and mleencoding the RNA helicase MLE whose absence decreasesproper spreading of the complex (21). The RNAi efficiencywas confirmed by western blot and RNA-seq (Supplemen-tary Figure S1 and Supplementary Table S2). As expected,both knock-downs cause a significant relative decrease insteady state RNA levels from the male X-chromosome, inline with impaired dosage compensation, and the effect isstronger with msl2 RNAi as compared to mle RNAi (Fig-ure 3A).
To test whether RNA stability is affected by an impairedMSL complex, we calculated the average RNA half-lives forthe X-chromosome, the fourth chromosome, and the au-tosomes after RNAi knockdown (Figure 3B). Surprisingly,depletion of MSL2 significantly increases the average RNAhalf-life of the X-chromosome transcripts and causes a
striking, significant decrease in average RNA half-life of thefourth chromosome transcripts compared to the autosomaltranscripts. The depletion of MLE (which causes a lesser de-crease in X-chromosome transcript levels) does not result inany statistically significant difference in RNA half-life be-tween the X-chromosome and the autosomes, nor betweenthe fourth chromosome and the autosomes (Figure 3B). Thedensity plots of half-lives for the X-chromosome, the auto-somes and the fourth chromosome show clear destabiliza-tion of chromosome 4 transcripts with msl2 RNAi, whilethe distributions of half-lives for both the X-chromosomeand the autosomes have shifted toward more stable half-lives, the X-chromosome’s shift being larger (Figure 3C).Next, we separated the housekeeping genes from the non-housekeeping genes and plotted the distribution of the log2differences in RNA half-life between the msl2 RNAi sam-ple and the yfp RNAi sample to test whether one of thetwo groups was causing the shift (Figure 3D). The resultssuggest that the stabilization of the X-chromosome tran-scripts is driven mainly by non-housekeeping genes. Wethen checked whether the stabilization of X-chromosometranscripts was over-represented among genes having sim-ilar steady state transcript levels. We split all genes into 5bins of equal numbers of genes and increasing transcriptlevels and plotted the average RNA half-life for the X-chromosome and the autosomes (Figure 3E). Similar to theresults obtained from untreated S2 cells (Figure 2A), theRNA stability correlates with the transcript levels but the
Dow
nloaded from https://academ
ic.oup.com/nar/article/50/8/4372/6564801 by guest on 15 July 2022
Nucleic Acids Research, 2022, Vol. 50, No. 8 4379
1 2 3 4 5 1 2 3 4 54
6
8
10
12
14
Transcript level bin
Aver
age
RN
A h
alf−
life
(h)
2L2R
3L
3RAX
6.0
6.5
100 150 200 250Average transcript level (GeTMM)
Aver
age
RN
A h
alf−
life
(h)
Male cells (S2)
2L2R
3L3R
X
A
7.0
7.5
8.0
100 150 200 250Average transcript level (GeTMM)
Aver
age
RN
A h
alf−
life
(h)
Female cells (Kc167)
1 2 3 4 5 1 2 3 4 5
4
6
8
10
RNA length bin
Aver
age
RN
A h
alf−
life
(h)
2L2R
3L
3RAX
6.0
6.5
2750 3000 3250 3500Average RNA length (bp)
Aver
age
RN
A h
alf−
life
(h)
Male cells (S2)
2L2R
3L3R
A
X
7.0
7.5
8.0
2750 3000 3250 3500Average RNA length (bp)
Aver
age
RN
A h
alf−
life
(h)
Female cells (Kc167)
1 2 3 4 5 1 2 3 4 5
4
5
6
7
8
9
Poly(A) tail length bin
Aver
age
RN
A h
alf−
life
(h)
2L2R
3L
3RAX
6.0
6.5
63 64 65Average poly(A) tail length (bp)
Aver
age
RN
A h
alf−
life
(h)
Male cells (S2)
Male cells (S2) Female cells (Kc167)
Housekeepinggenes
Non-housekeepinggenes
Housekeepinggenes
Non-Housekeepinggenes
A B C
G H
D E F
XA
Male cells (S2)Female cells (Kc167)
X (S2 only)A (S2 only)
Figure 2. RNA stability correlates positively with steady state transcript levels and negatively with mRNA length; correlations with poly(A) tail lengthdepend on gene function. (A) Average RNA half-life for the X-chromosome (black) and the autosomes (orange) for bins with equal numbers of genes andof increasing transcript levels (GeTMM) for S2 cells (left) and Kc167 cells (right). (B and C) Average transcript levels (GeTMM) per chromosome and forthe main autosome arms plotted against their respective average RNA half-life in S2 cells (B) and in Kc167 cells (C). (D) Average RNA half-life for S2 cells(blue) and Kc167 cells (pink) for bins of equal numbers of genes and of increasing RNA length (bp) for housekeeping genes (left) and non-housekeepinggenes (right). (E) Average RNA length (bp) per chromosome and for the main autosome arms plotted against average RNA half-life in S2 cells. TheSpearman correlations between RNA length and RNA half-life are: -0.23 (P = 1.66*10–13) and -0.25 (P-value = 5.94*10–70) for the X-chromosomeand autosomes respectively. (F) Average RNA length (bp) per chromosome and for all autosomes plotted against average RNA half-life in Kc167 cells.The Spearman correlations between RNA length and RNA half-life are: -0.29 (P = 2.09*10–21) and -0.33 (P = 2.09*10–121) for the X-chromosome andautosomes respectively. (G) Average RNA half-life for the X-chromosome (black) and the autosomes (orange) for 5 bins with equal numbers of genesand of increasing poly(A) tail length for housekeeping genes (left) and non-housekeeping genes (right). The Spearman correlation between poly(A) taillength and RNA half-life for housekeeping genes is -0.14 (P = 1.8*10–15) and it is 0.10 (P = 5.10*10–5) for non-housekeeping genes. The overall Spearmancorrelation is -0.08 (P = 5.46*10–9). (H) Average poly(A) tail length per chromosome and for all autosomes plotted against average RNA half-life in S2cells. All error bars represent the 95% confidence interval of the mean.
relative stabilization of transcripts of the X-chromosome isobserved only in MSL2 depleted cells (Figure 3E).
Finally, we calculated the log2 ratios of half-lives of oursamples, using yfp RNAi as a reference (Figure 3F). Wenote that the RNAi treatment itself causes a slight relativeincrease in the half-life of the X-chromosome transcripts.However, msl2 RNAi results in a larger and statistically sig-nificant increase in the X-chromosome half-lives while mleRNAi does not reveal any convincing difference.
We conclude that impairing the function of the MSLcomplex via msl2 knock-down leads to a relative increasein the chromosomal average RNA half-life of the X-chromosome’s transcripts and a relative decrease in the
chromosomal average RNA half-life of the fourth chro-mosome’s transcripts specifically. Additionally, the non-housekeeping genes of the X-chromosome seem to drive theshift in RNA stability.
RNA stability counteracts induced transcriptional distur-bances and enhances adapted differential transcription bothin Drosophila and human cells
The shift in RNA stability observed with msl2 RNAi (Fig-ure 3B) could be explained by two different scenarios. First,higher stability of RNAs from the X-chromosome com-pared to autosomes may have had a role in dosage com-
Dow
nloaded from https://academ
ic.oup.com/nar/article/50/8/4372/6564801 by guest on 15 July 2022
4380 Nucleic Acids Research, 2022, Vol. 50, No. 8
A B C
D E
msl2
mle
yfp
0 5 10 15
00.050.100.15
00.050.100.15
00.050.100.15
RNA half-life (h)
Den
sity
−1.0 −0.5 0 0.5 1.0 −1.0 −0.5 0 0.5 1.00
0.5
1.0
1.5
2.0
msl2/yfp ratio of RNA half-lives (log2)
Den
sity
Non-housekeepinggenes
Housekeepinggenes
7
8
9
10
11
msl2
Aver
age
RN
A ha
lf-life
(h)
X A 4
mleX A 4
yfpX A 4
p = 5.35*10-5
p = 1.37*10-3
1 2 3 4 5
msl2
mle
yfp
X A X A X A X A X A
8101214
8
101214
8101214
Aver
age
RN
A h
alf−
life
(h)
Bins of increased transcript levels:
XA4
XA4
−0.4
−0.2
0
0.2
msl2/yfp mle/yfp S2/yfp
Rat
io o
f tra
nscr
ipt l
evel
s (lo
g2)
XA
F
0
0.05
0.10
msl2/yfp mle/yfp S2/yfp
Rat
io o
f RN
A h
alf-l
ives
(log
2)
XA
Figure 3. msl2 knockdown leads to increased RNA stability of X-chromosomal transcripts and decreased RNA stability of fourth chromosomal transcripts.(A) Log2 ratios of transcript levels for the X-chromosome (black) and the autosomes (orange) with yfp RNAi as a reference. (B) Average RNA half-life forthe X chromosome ‘X’, the main autosome arms ‘A’, and the fourth chromosome ‘4’, respectively, with msl2, mle and yfp RNAi. The P-values correspondto the Mann–Whitney U-test. (C) Density plots of RNA half-lives for all three RNAi experiments and for the X-chromosome (black), the main autosomearms (orange) and the fourth chromosome (yellow). The peak at 16 h represents all the RNAs that have a half-life equal to or above 16 h. (D) Densityplots showing ratios of half-lives between the msl2 RNAi sample and the yfp RNAi sample on log2 scale, separated between housekeeping genes (left) andnon-housekeeping genes (right) for the X-chromosome (black), the autosomes (orange) and the fourth chromosome (yellow). (E) Average RNA half-lifefor the X-chromosome (black) and the autosomes (orange), in all three RNAi samples, for bins with equal numbers of genes with increasing transcriptlevels (GeTMM). (F) Log2 ratios of RNA half-lives for the X-chromosome (black) and the autosomes (orange) with yfp RNAi as a reference. S2 representsS2 cells without any RNAi treatment. All error bars indicate the 95% confidence interval of the mean.
pensation prior to the existence of the chromosome-specifictargeting of a fully functional MSL complex and what weobserve are the evolutionary remains of such an ancientfunction. If so, the differential RNA stabilities should bespecific to the X-chromosome. Alternatively, RNA stabilitymay counteract induced changes in transcription output re-gardless of chromosome and the observed larger effect onthe X-chromosome in msl2 RNAi compared to autosomesis due to the fact that knock-down of MSL2 mainly downregulates transcription from the X-chromosome.
To test these two different hypotheses, we took advan-tage of the fact that msl2 RNAi leads to globally differ-ential transcript levels, mainly affecting the X-chromosomebut indirectly also the autosomes. We therefore compareddifferential RNA stabilities to differential transcript lev-els. We divided all genes into 10 bins of equal numbersof genes, based on increasing differential transcript levels,and calculated the average differential RNA half-life forthe X-chromosome and the autosomes (Figure 4A–C), thehousekeeping and non-housekeeping genes (Figure 4D–F),quartiles of increasing RNA length (Supplementary FigureS3A–C) and quartiles of increasing poly(A) tail length (Sup-plementary Figure S3D–F).
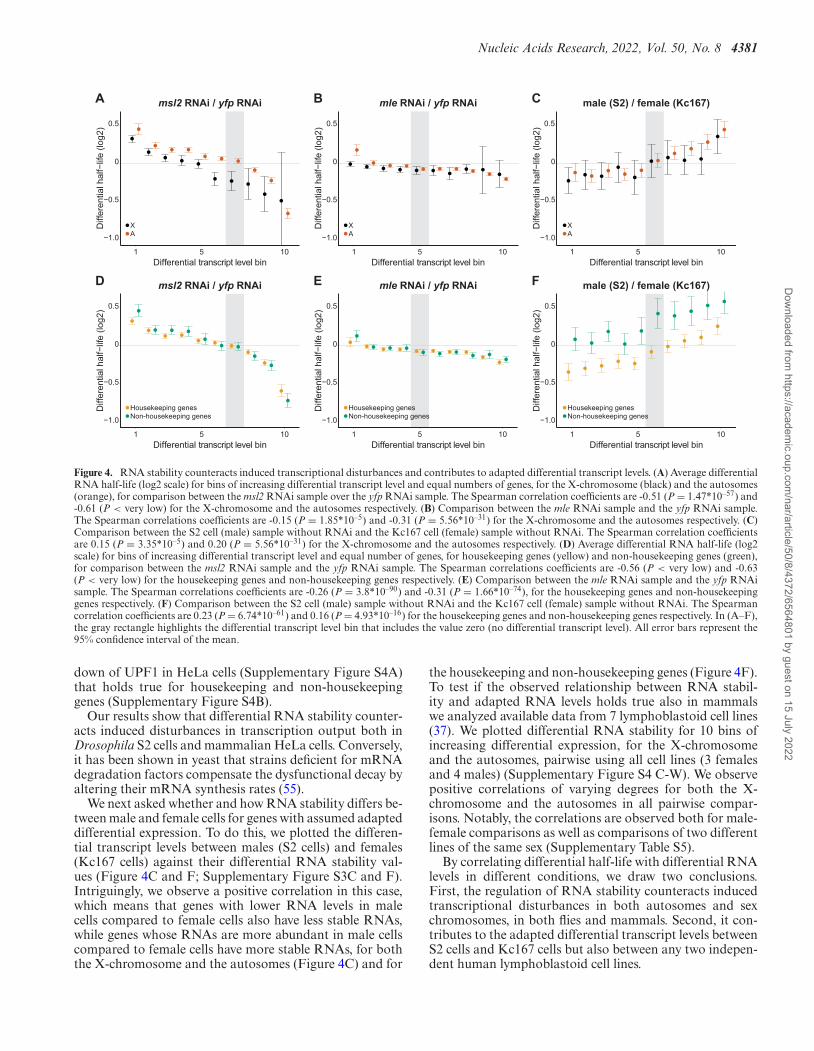
Comparing msl2 RNAi to yfp RNAi, we observe aconsequent and statistically significant negative correla-
tion between differential RNA stabilities and differentialRNA levels, for both the X-chromosome and the auto-somes (Figure 4A) as well as for housekeeping and non-housekeeping genes (Figure 4D). The negative correlationholds true when genes are separated into quartiles of in-creasing RNA length or poly(A) tail length (Supplemen-tary Figure S3A and S3D, respectively). The results showthat, upon induced transcriptional differences using msl2RNAi, RNA under-transcription is counteracted by RNAstabilization, and reciprocally, RNA over-transcription iscounteracted by RNA destabilization. We observed simi-lar correlations for mle RNAi, although, as expected theamplitude was reduced (Figure 4B and E; SupplementaryFigure S3B and E). Next, to check if similar correlationscould be found in mammalian cells we used a BRIC-seqdata set with depletion of UPF1 (Upstream frameshift 1)(50). UPF1 is an ATP-dependent RNA helicase and a corefactor of nonsense-mediated mRNA decay (NMD) (51,52).It has previously been shown that UPF1 RNAi causesglobal changes in both RNA stabilities and transcription(18,36,53,54) and we therefore asked whether the RNAi-induced global differences in RNA stability and RNA levelscorrelate. In line with the results obtained in Drosophila, weobserved a general negative correlation between differen-tial RNA levels and differential RNA stability upon knock-
Dow
nloaded from https://academ
ic.oup.com/nar/article/50/8/4372/6564801 by guest on 15 July 2022
Nucleic Acids Research, 2022, Vol. 50, No. 8 4381
Non-housekeeping genesHousekeeping genes
−1.0
−0.5
0
0.5
1 5
Diff
eren
tial h
alf−
life
(log2
)
1 5 10Differential transcript level bin
1 5 10
−1.0
−0.5
0
0.5
1 5 10
Diff
eren
tial h
alf−
life
(log2
)
1 5 10Differential transcript level bin
1 5 10
msl2 RNAi / yfp RNAi mle RNAi / yfp RNAi male (S2) / female (Kc167)
msl2 RNAi / yfp RNAi mle RNAi / yfp RNAi male (S2) / female (Kc167)
XA −1.0
−0.5
0
0.5
Diff
eren
tial h
alf−
life
(log2
)
−1.0
−0.5
0
0.5
Diff
eren
tial h
alf−
life
(log2
)
−1.0
−0.5
0
0.5
Diff
eren
tial h
alf−
life
(log2
)
−1.0
−0.5
0
0.5D
iffer
entia
l hal
f−lif
e (lo
g2)
Non-housekeeping genes Housekeeping genes
Differential transcript level binDifferential transcript level bin
Differential transcript level binDifferential transcript level bin
D
A B C
E F
XA
XA
Non-housekeeping genesHousekeeping genes
10
Figure 4. RNA stability counteracts induced transcriptional disturbances and contributes to adapted differential transcript levels. (A) Average differentialRNA half-life (log2 scale) for bins of increasing differential transcript level and equal numbers of genes, for the X-chromosome (black) and the autosomes(orange), for comparison between the msl2 RNAi sample over the yfp RNAi sample. The Spearman correlation coefficients are -0.51 (P = 1.47*10–57) and-0.61 (P < very low) for the X-chromosome and the autosomes respectively. (B) Comparison between the mle RNAi sample and the yfp RNAi sample.The Spearman correlations coefficients are -0.15 (P = 1.85*10–5) and -0.31 (P = 5.56*10–31) for the X-chromosome and the autosomes respectively. (C)Comparison between the S2 cell (male) sample without RNAi and the Kc167 cell (female) sample without RNAi. The Spearman correlation coefficientsare 0.15 (P = 3.35*10–5) and 0.20 (P = 5.56*10–31) for the X-chromosome and the autosomes respectively. (D) Average differential RNA half-life (log2scale) for bins of increasing differential transcript level and equal number of genes, for housekeeping genes (yellow) and non-housekeeping genes (green),for comparison between the msl2 RNAi sample and the yfp RNAi sample. The Spearman correlations coefficients are -0.56 (P < very low) and -0.63(P < very low) for the housekeeping genes and non-housekeeping genes respectively. (E) Comparison between the mle RNAi sample and the yfp RNAisample. The Spearman correlations coefficients are -0.26 (P = 3.8*10–90) and -0.31 (P = 1.66*10–74), for the housekeeping genes and non-housekeepinggenes respectively. (F) Comparison between the S2 cell (male) sample without RNAi and the Kc167 cell (female) sample without RNAi. The Spearmancorrelation coefficients are 0.23 (P = 6.74*10–61) and 0.16 (P = 4.93*10–16) for the housekeeping genes and non-housekeeping genes respectively. In (A–F),the gray rectangle highlights the differential transcript level bin that includes the value zero (no differential transcript level). All error bars represent the95% confidence interval of the mean.
down of UPF1 in HeLa cells (Supplementary Figure S4A)that holds true for housekeeping and non-housekeepinggenes (Supplementary Figure S4B).
Our results show that differential RNA stability counter-acts induced disturbances in transcription output both inDrosophila S2 cells and mammalian HeLa cells. Conversely,it has been shown in yeast that strains deficient for mRNAdegradation factors compensate the dysfunctional decay byaltering their mRNA synthesis rates (55).
We next asked whether and how RNA stability differs be-tween male and female cells for genes with assumed adapteddifferential expression. To do this, we plotted the differen-tial transcript levels between males (S2 cells) and females(Kc167 cells) against their differential RNA stability val-ues (Figure 4C and F; Supplementary Figure S3C and F).Intriguingly, we observe a positive correlation in this case,which means that genes with lower RNA levels in malecells compared to female cells also have less stable RNAs,while genes whose RNAs are more abundant in male cellscompared to female cells have more stable RNAs, for boththe X-chromosome and the autosomes (Figure 4C) and for
the housekeeping and non-housekeeping genes (Figure 4F).To test if the observed relationship between RNA stabil-ity and adapted RNA levels holds true also in mammalswe analyzed available data from 7 lymphoblastoid cell lines(37). We plotted differential RNA stability for 10 bins ofincreasing differential expression, for the X-chromosomeand the autosomes, pairwise using all cell lines (3 femalesand 4 males) (Supplementary Figure S4 C-W). We observepositive correlations of varying degrees for both the X-chromosome and the autosomes in all pairwise compar-isons. Notably, the correlations are observed both for male-female comparisons as well as comparisons of two differentlines of the same sex (Supplementary Table S5).
By correlating differential half-life with differential RNAlevels in different conditions, we draw two conclusions.First, the regulation of RNA stability counteracts inducedtranscriptional disturbances in both autosomes and sexchromosomes, in both flies and mammals. Second, it con-tributes to the adapted differential transcript levels betweenS2 cells and Kc167 cells but also between any two indepen-dent human lymphoblastoid cell lines.
Dow
nloaded from https://academ
ic.oup.com/nar/article/50/8/4372/6564801 by guest on 15 July 2022
4382 Nucleic Acids Research, 2022, Vol. 50, No. 8
Ribosome density varies across chromosomes and gene func-tions
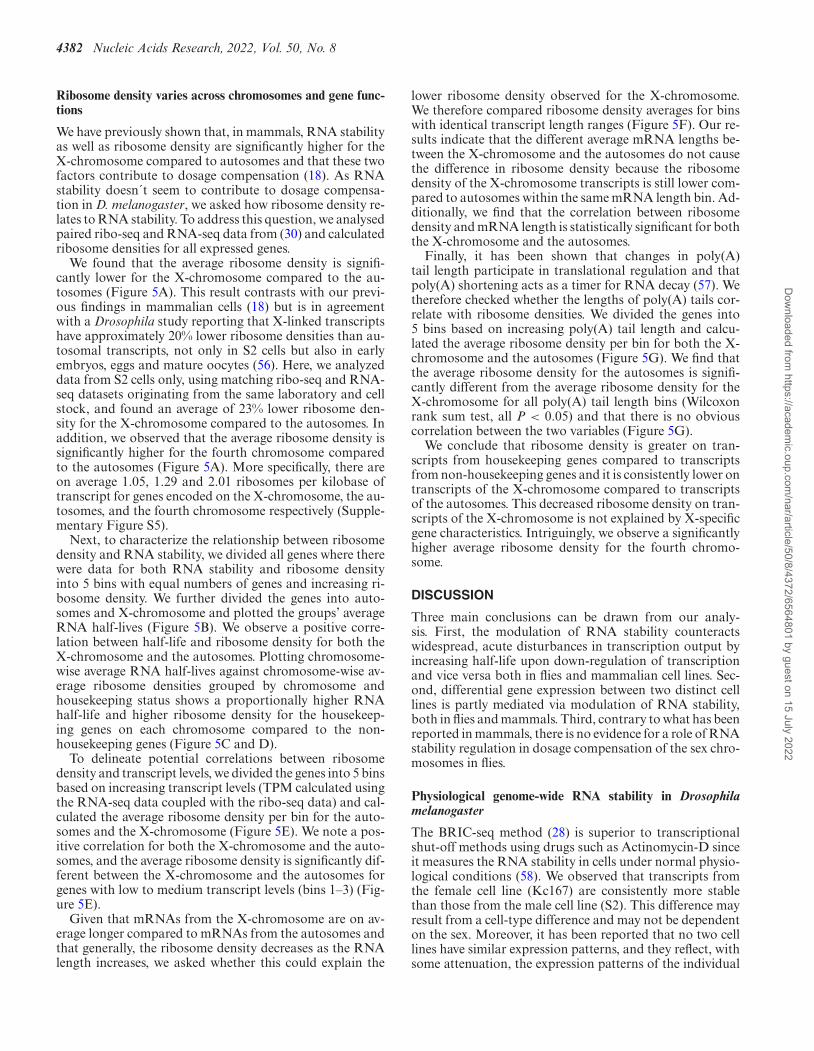
We have previously shown that, in mammals, RNA stabilityas well as ribosome density are significantly higher for theX-chromosome compared to autosomes and that these twofactors contribute to dosage compensation (18). As RNAstability doesn´t seem to contribute to dosage compensa-tion in D. melanogaster, we asked how ribosome density re-lates to RNA stability. To address this question, we analysedpaired ribo-seq and RNA-seq data from (30) and calculatedribosome densities for all expressed genes.
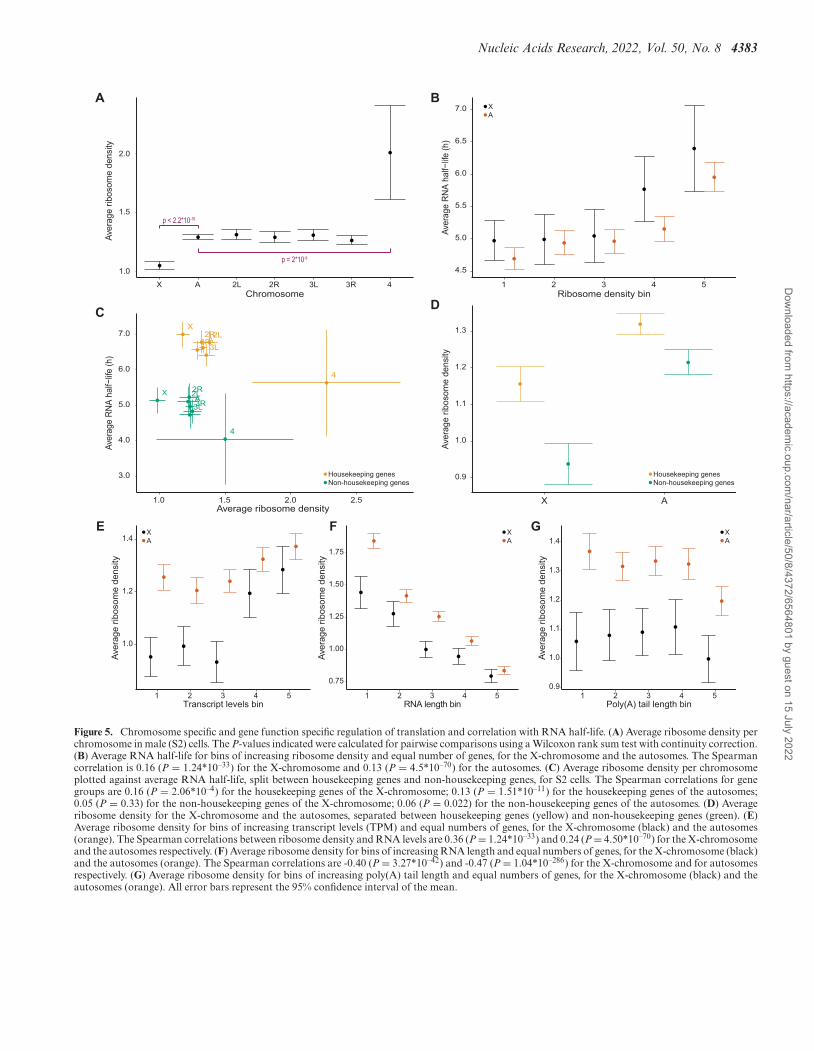
We found that the average ribosome density is signifi-cantly lower for the X-chromosome compared to the au-tosomes (Figure 5A). This result contrasts with our previ-ous findings in mammalian cells (18) but is in agreementwith a Drosophila study reporting that X-linked transcriptshave approximately 20% lower ribosome densities than au-tosomal transcripts, not only in S2 cells but also in earlyembryos, eggs and mature oocytes (56). Here, we analyzeddata from S2 cells only, using matching ribo-seq and RNA-seq datasets originating from the same laboratory and cellstock, and found an average of 23% lower ribosome den-sity for the X-chromosome compared to the autosomes. Inaddition, we observed that the average ribosome density issignificantly higher for the fourth chromosome comparedto the autosomes (Figure 5A). More specifically, there areon average 1.05, 1.29 and 2.01 ribosomes per kilobase oftranscript for genes encoded on the X-chromosome, the au-tosomes, and the fourth chromosome respectively (Supple-mentary Figure S5).
Next, to characterize the relationship between ribosomedensity and RNA stability, we divided all genes where therewere data for both RNA stability and ribosome densityinto 5 bins with equal numbers of genes and increasing ri-bosome density. We further divided the genes into auto-somes and X-chromosome and plotted the groups’ averageRNA half-lives (Figure 5B). We observe a positive corre-lation between half-life and ribosome density for both theX-chromosome and the autosomes. Plotting chromosome-wise average RNA half-lives against chromosome-wise av-erage ribosome densities grouped by chromosome andhousekeeping status shows a proportionally higher RNAhalf-life and higher ribosome density for the housekeep-ing genes on each chromosome compared to the non-housekeeping genes (Figure 5C and D).
To delineate potential correlations between ribosomedensity and transcript levels, we divided the genes into 5 binsbased on increasing transcript levels (TPM calculated usingthe RNA-seq data coupled with the ribo-seq data) and cal-culated the average ribosome density per bin for the auto-somes and the X-chromosome (Figure 5E). We note a pos-itive correlation for both the X-chromosome and the auto-somes, and the average ribosome density is significantly dif-ferent between the X-chromosome and the autosomes forgenes with low to medium transcript levels (bins 1–3) (Fig-ure 5E).
Given that mRNAs from the X-chromosome are on av-erage longer compared to mRNAs from the autosomes andthat generally, the ribosome density decreases as the RNAlength increases, we asked whether this could explain the
lower ribosome density observed for the X-chromosome.We therefore compared ribosome density averages for binswith identical transcript length ranges (Figure 5F). Our re-sults indicate that the different average mRNA lengths be-tween the X-chromosome and the autosomes do not causethe difference in ribosome density because the ribosomedensity of the X-chromosome transcripts is still lower com-pared to autosomes within the same mRNA length bin. Ad-ditionally, we find that the correlation between ribosomedensity and mRNA length is statistically significant for boththe X-chromosome and the autosomes.
Finally, it has been shown that changes in poly(A)tail length participate in translational regulation and thatpoly(A) shortening acts as a timer for RNA decay (57). Wetherefore checked whether the lengths of poly(A) tails cor-relate with ribosome densities. We divided the genes into5 bins based on increasing poly(A) tail length and calcu-lated the average ribosome density per bin for both the X-chromosome and the autosomes (Figure 5G). We find thatthe average ribosome density for the autosomes is signifi-cantly different from the average ribosome density for theX-chromosome for all poly(A) tail length bins (Wilcoxonrank sum test, all P < 0.05) and that there is no obviouscorrelation between the two variables (Figure 5G).
We conclude that ribosome density is greater on tran-scripts from housekeeping genes compared to transcriptsfrom non-housekeeping genes and it is consistently lower ontranscripts of the X-chromosome compared to transcriptsof the autosomes. This decreased ribosome density on tran-scripts of the X-chromosome is not explained by X-specificgene characteristics. Intriguingly, we observe a significantlyhigher average ribosome density for the fourth chromo-some.
DISCUSSION
Three main conclusions can be drawn from our analy-sis. First, the modulation of RNA stability counteractswidespread, acute disturbances in transcription output byincreasing half-life upon down-regulation of transcriptionand vice versa both in flies and mammalian cell lines. Sec-ond, differential gene expression between two distinct celllines is partly mediated via modulation of RNA stability,both in flies and mammals. Third, contrary to what has beenreported in mammals, there is no evidence for a role of RNAstability regulation in dosage compensation of the sex chro-mosomes in flies.
Physiological genome-wide RNA stability in Drosophilamelanogaster
The BRIC-seq method (28) is superior to transcriptionalshut-off methods using drugs such as Actinomycin-D sinceit measures the RNA stability in cells under normal physio-logical conditions (58). We observed that transcripts fromthe female cell line (Kc167) are consistently more stablethan those from the male cell line (S2). This difference mayresult from a cell-type difference and may not be dependenton the sex. Moreover, it has been reported that no two celllines have similar expression patterns, and they reflect, withsome attenuation, the expression patterns of the individual
Dow
nloaded from https://academ
ic.oup.com/nar/article/50/8/4372/6564801 by guest on 15 July 2022
Nucleic Acids Research, 2022, Vol. 50, No. 8 4383
1.0
1.5
2.0
X A 2L 2R 3L 3R 4
Aver
age
ribos
ome
dens
ity
4.5
5.0
5.5
6.0
6.5
7.0
1 2 3 4 5Ribosome density bin
Aver
age
RN
A ha
lf−life
(h)
2L
2L
2R
2R
3L
3L
3R
3R
4
4
A
A
X
X
3.0
4.0
5.0
6.0
7.0
1.0 1.5 2.0 2.5Average ribosome density
Aver
age
RNA
half−
life (h
)
0.9
1.0
1.1
1.2
1.3
X A
Aver
age
ribos
ome
dens
ity
1.0
1.2
1.4
1 2 3 4 5Transcript levels bin
Aver
age
ribos
ome
dens
ity
0.75
1.00
1.25
1.50
1.75
1 2 3 4 5RNA length bin
Aver
age
ribos
ome
dens
ity
0.9
1.0
1.1
1.2
1.3
1.4
1 2 3 4 5Poly(A) tail length bin
Aver
age
ribos
ome
dens
ityGE F
A B
C D
Non-housekeeping genesHousekeeping genes
Non-housekeeping genesHousekeeping genes
XA
XA
XA
XA
p < 2.2*10-16
p = 2*10-9
Chromosome
Figure 5. Chromosome specific and gene function specific regulation of translation and correlation with RNA half-life. (A) Average ribosome density perchromosome in male (S2) cells. The P-values indicated were calculated for pairwise comparisons using a Wilcoxon rank sum test with continuity correction.(B) Average RNA half-life for bins of increasing ribosome density and equal number of genes, for the X-chromosome and the autosomes. The Spearmancorrelation is 0.16 (P = 1.24*10–33) for the X-chromosome and 0.13 (P = 4.5*10–70) for the autosomes. (C) Average ribosome density per chromosomeplotted against average RNA half-life, split between housekeeping genes and non-housekeeping genes, for S2 cells. The Spearman correlations for genegroups are 0.16 (P = 2.06*10–4) for the housekeeping genes of the X-chromosome; 0.13 (P = 1.51*10–11) for the housekeeping genes of the autosomes;0.05 (P = 0.33) for the non-housekeeping genes of the X-chromosome; 0.06 (P = 0.022) for the non-housekeeping genes of the autosomes. (D) Averageribosome density for the X-chromosome and the autosomes, separated between housekeeping genes (yellow) and non-housekeeping genes (green). (E)Average ribosome density for bins of increasing transcript levels (TPM) and equal numbers of genes, for the X-chromosome (black) and the autosomes(orange). The Spearman correlations between ribosome density and RNA levels are 0.36 (P = 1.24*10–33) and 0.24 (P = 4.50*10–70) for the X-chromosomeand the autosomes respectively. (F) Average ribosome density for bins of increasing RNA length and equal numbers of genes, for the X-chromosome (black)and the autosomes (orange). The Spearman correlations are -0.40 (P = 3.27*10–42) and -0.47 (P = 1.04*10–286) for the X-chromosome and for autosomesrespectively. (G) Average ribosome density for bins of increasing poly(A) tail length and equal numbers of genes, for the X-chromosome (black) and theautosomes (orange). All error bars represent the 95% confidence interval of the mean.
Dow
nloaded from https://academ
ic.oup.com/nar/article/50/8/4372/6564801 by guest on 15 July 2022
4384 Nucleic Acids Research, 2022, Vol. 50, No. 8
cells from which they originate, combined with the conse-quences of chromosomal rearrangements they underwentto reach immortality (59,60). In addition, it is likely that theBrU labeling was more stressful to the Kc167 cells than theS2 cells; indeed, we observed cell toxicity at lower BrU con-centrations in Kc167 compared to S2 cells and this couldslightly alter global RNA stabilities. In support of this hy-pothesis, it has recently been shown that stress conditionsleading to global transcription attenuation such as UV ex-posure can provoke general stabilization of cellular mRNAsin mammals (61). In our case, the incorporation of BrU intotranscripts could potentially affect transcription dynamics,and thereafter RNA stability.
We show that RNA stability is linked to gene function,which is in line with previous observations in mammals andyeast, i.e. housekeeping genes have greater RNA stabilitycompared to genes having functions in e.g. transcriptionregulation or apoptosis (28,43,46). Differential RNA sta-bility of individual gene transcripts is beneficial for the cellas it allows rapid changes in key RNA levels in response tochanging conditions while saving the energy required to re-new transcripts that are meant to be expressed continuouslyat stable levels (2,43,62). Our results expand the relationshipbetween RNA stability and gene function to flies and sug-gest that it is conserved across species.
Finally, contrary to the results obtained in mammals (18),we did not find any convincing difference between the sta-bility of the X-chromosome and autosomal transcripts, nei-ther in male cells (S2) nor in female cells (Kc167), whichindicates that the role of RNA stability in dosage compen-sation in D. melanogaster is at most minimal.
Significantly higher RNA stability is observed for highly ex-pressed genes, genes coding for shorter mRNAs and house-keeping genes with shorter poly(A) tail length
The correlation of RNA stability with transcript levels wasexpected, partly because RNA stability contributes to mea-sured transcript levels. At equal transcription rates, a longerRNA half-life leads to higher RNA levels. Furthermore,RNAs that are constantly required at high levels are likelyselected to be more stable, saving the energetic costs of tran-scribing and degrading transcripts.
We find that transcripts from long genes are in generalless stable than those from short genes in D. melanogaster.It has been hypothesized that long genes are more likely toundergo mechanical damage or random endonucleolytic at-tacks than short genes simply due to their length (48). Ad-ditionally, long RNAs are statistically more likely to har-bor transcription errors that would target them for decay.We found a slight but significant general negative correla-tion between RNA stability and poly(A) tail length in S2cells, consistent with the findings in HeLa cells and 3T3cells from (31). This negative correlation contradicts theprevailing idea that the longer a poly(A) tail the more sta-ble the transcript (57). However, this view is being refinedwith the development of methods that measure poly(A)tail length genome-wide. It has been reported that mRNAscoding for ribosomal proteins or other housekeeping genesare enriched in shorter poly(A) tail lengths in humans, fly,yeast, zebrafish and plants (31,63). Interestingly, when we
separated genes into housekeeping and non-housekeeping,it appeared that the two groups had an opposite, strongercorrelation between RNA half-life and poly(A) tail length.Taken together, this suggests that the poly(A) tail length ofhousekeeping gene transcripts is regulated specifically. Thisis supported by (64), who discovered a sequence-encodedenhancer–core-promoter specificity that separates the reg-ulatory programs of developmental genes from those ofhousekeeping genes in Drosophila. It is plausible that thesetranscriptional programs include factors influencing thelength and modifications of the poly(A) tail of the tran-script that they activate, and thus carry information aboutthe associated stability. Moreover, it has been proposedthat short-tailed housekeeping genes could be locked in aclosed loop state that promotes translation and stabilizesthe RNA, favoring constitutive expression (63).
The modulation of RNA stability buffers RNA levels genome-wide upon induced changes in transcription output and partic-ipates to differential RNA expression between individuals
We describe two RNA stability mediated responses to al-terations in gene expression. The first one buffers suddenperturbations in transcription by shifting RNA stability inthe opposite direction of the transcriptional change andwas observed both in insect and mammalian cells. Ourfinding is supported by a recent study in mammals thatfound that global alterations in transcriptional dynamicsled cells to rapidly and specifically adjust the expressionof their RNA degradation machinery in order to coun-teract the changes and buffer mRNA levels (61). More-over, our observations are in line with previous observa-tions of buffering in D. melanogaster (4–6). The response ofRNA stability to transcript level change appears more pro-nounced for non-housekeeping genes compared to house-keeping genes. Interestingly, we have previously shown us-ing microarray analyses in flies that in monosomic regions,non-housekeeping genes are more strongly buffered thanhousekeeping genes, i.e. their RNA levels are closer to thewild-type levels (5,65). This parallel suggests that upon im-pairment of the MSL complex, the same, general, non-MSL-complex-dependent buffering mechanism still oper-ates (or takes over), prioritising stabilization of the RNAsof non-housekeeping genes, that are often short-lived in re-lation to their function. We speculate that changes in RNAstability constitute a general response that partially buffersacute disturbances in transcript levels such as those re-sulting from loss of a chromosome segment, an impaireddosage compensation mechanism or a new mutation thatbroadly alters RNA levels. There is evidence that mRNAdecay is coupled to translation, which is coupled to mRNAexport, maturation and transcription (66–68), and these bi-ological links could constitute the foundations for a mech-anism that modulates RNA stability in relation to changesof its transcription output. The increase in RNA stabilityupon loss of MSL2, buffers the RNA levels and may ex-plain why, experimentally, a knockdown of the MSL com-plex does not result in a two-fold decrease in transcript lev-els (6,38–41,69). The increased RNA stability is not suffi-cient to rescue lost MSL complex function but might havebeen enough to transiently alleviate the negative pheno-
Dow
nloaded from https://academ
ic.oup.com/nar/article/50/8/4372/6564801 by guest on 15 July 2022
Nucleic Acids Research, 2022, Vol. 50, No. 8 4385
types associated with the progressive degeneration of the Y-chromosome. This way it could have allowed the evolutionof the more effective and specific MSL complex dependentmechanism.
The second response supports and strengthens the inter-individual differential gene expression. We correlated dif-ferential RNA stability with differential RNA levels of twoembryo derived insect cell lines S2 (male) and Kc167 (fe-male) cells and of seven human lymphoblastoid cell linesof mixed sexes. The RNA stability response shows no sex-chromosome bias and leads to greater stability in the caseof genes exhibiting higher RNA levels in a specific cell line.This response (in contrast to buffering that minimizes thedifferences in transcript levels) will contribute to the differ-ential transcript levels measured here. Finally, we speculatethat RNA stability could also be used among other mecha-nisms to control adaptive expression during speciation.
The fourth chromosome is much smaller than the otherchromosome arms and has fewer genes, thus it is challeng-ing to detect significant differences compared to the otherchromosomes. Still, we find that with msl2 RNAi, the fourthchromosome has a much, and highly significantly, lowerRNA stability compared to the autosomes. It is unclear asto why this happens, and we speculate that elements of theanswer lie within one or several of its unique characteristics.The fourth chromosome is enriched in repetitive elements,it is replicated late, and in principle, the entire chromosomecan be considered heterochromatic (70,71). Despite its het-erochromatic nature, we and others have previously shownthat average transcript levels from the fourth chromosomeare comparable to, or even higher than, those of genes onother chromosomes (72,73). In addition, the fourth chro-mosome displays unusually high tolerance of dosage differ-ences and mis-expression (5,73–76) and it has been shownthat it was ancestrally an X-chromosome that has revertedto being an autosome (34,35,77).
Gene expression from the X-chromosome and fourth chromo-some is regulated at the translational level on a chromosomespecific basis
We observe a lower ribosome density on transcripts fromthe X-chromosome in untreated male cells (S2) which con-firms previous findings (56). They hypothesized that thereduced ribosome density is consistent with slower trans-lation initiation and not faster translation elongation be-cause X-linked transcripts have stronger mRNA structuresnear start codons and longer 5´UTRs, both features beingknown to slow translation initiation (56). The cited articlealso confirms previous findings that X-chromosome tran-scripts in Drosophila have a higher codon usage bias thanthose from other chromosomes (78). Codon optimality hasbeen shown to facilitate translation elongation in yeast (79–81). Ribosome density is used here as a proxy for transla-tional activity, but it is an imperfect measure because ribo-some densities can be used to compare the translation ef-ficiency of genes only if their translation elongation ratesare equal (82). A recent study showed that optimal codonsspeed up translation elongation in a Drosophila cell-free sys-tem (83), and if this also occurs in vivo, it favours the fastertranslation elongation hypothesis for the X-chromosome
transcripts. If translation elongation is indeed faster fortranscripts from the Drosophila X-chromosome, this is inline with our observed lower ribosome density.
Additionally, we find a significantly higher ribosome den-sity on the transcripts of the fourth chromosome. Thefourth chromosome of Drosophila has a low codon usagebias and a high level of repetitive sequences and is highlyheterochromatic (77). According to the findings of (83),a low codon usage bias slows down translation elonga-tion and could thus explain the higher ribosome densitywe observe. In particular, a low ribosome density in un-treated cells corresponds to increased RNA stability withmsl2 RNAi (X-chromosome) and a high ribosome densityin untreated cells corresponds to decreased RNA stabilitywith msl2 RNAi (chromosome 4). It is plausible that in msl2RNAi cells, the reduced number of X-chromosome tran-scripts leads to increased translation initiation rates drivenby feedback loop regulation processes, which in turn in-creases RNA stability. The opposite effect may apply for thefourth chromosome.
Ribosome densities on the X-chromosomal and the au-tosomal RNAs differ significantly for genes with low tomedium transcript levels but not for genes with high tran-script levels. This suggests that genes with low to mediumtranscript levels are more likely to be regulated at the trans-lational level than genes with high transcript levels, becausethe latter are likely to be saturated at the translational level.
The chromosome-wise average RNA half-lives are notsignificantly different from each other; however, the ribo-some densities are. Even though ribosome density correlatesnegatively with gene length, and the X-chromosome has,on average longer genes, for each gene length bin, the X-chromosome still has a lower ribosome density on its tran-scripts than the autosomes. This suggests that the chromo-some specific regulation (dosage compensation) of gene ex-pression is acting mainly at the transcriptional and trans-lational levels rather than through the regulation of RNAstability in Drosophila melanogaster.
In summary, we postulate that the regulation of RNA sta-bility constitutes a versatile tool for the cell, used to con-trol gene expression in several ways. Firstly, it can be usedrapidly to buffer shifts in transcription output, provoked bye.g. some mutation that results in broad alterations of tran-scription such as for general transcription factors or genesinvolved in dosage compensation, and thus minimize the ef-fects of faulty transcription output. Second, the modulationof RNA stability has a supporting role to establish differen-tial RNA levels between individuals or cell types genome-wide. Lastly, as shown in mammals by (2), it can be used toaccelerate the operation of expression off-switches (devel-opmental or in response to stress) by selectively increasingthe rate of decay of unwanted RNAs.
ACCESSION NUMBERS
The BRIC-seq and RNA-seq data reported in this paperhave been deposited in the European Nucleotide Archivewith accession number PRJEB15335.
SUPPLEMENTARY DATA
Supplementary Data are available at NAR Online.
Dow
nloaded from https://academ
ic.oup.com/nar/article/50/8/4372/6564801 by guest on 15 July 2022
4386 Nucleic Acids Research, 2022, Vol. 50, No. 8
ACKNOWLEDGEMENTS
We thank Maria Kim, Tracy Nissan and Per Stenberg forsuggestions and comments on the manuscript. We thankThomas Kallman for bioinformatics advice in the contextof the Swedish Bioinformatics Advisory Program. We thankJubao Duan and Nobuyoshi Akimitsu for sharing withus their RNA stability and expression data for the lym-phoblastoid cell lines and the UPF1 depleted HeLa cells,respectively. We also thank the Science for Life Laboratory(SciLifeLab), Stockholm, Sweden; the National GenomicsInfrastructure (NGI), Stockholm, Sweden; and UPPMAX,Uppsala, Sweden, for assistance with the RNA sequencingand for providing the computational infrastructure.Author contributions: M.L.F. and J.L. conceived the exper-iments and the analyses. M.L.F. and A.M.J. performed theBRIC-seq experiments and M.L.F. performed the bioin-formatics analyses. M.L.F. and J.L. analyzed the data andM.L.F. wrote the first draft of the manuscript and visual-ized the data. M.L.F. and J.L. finalized the manuscript. Allauthors read and approved the manuscript.
FUNDING
Swedish Research Council [2016–03306, 2020–03561 toJ.L.]; Knut and Alice Wallenberg Foundation [2014.0018 toJ.L.]; Swedish Cancer Foundation [CAN 2017/342, 20 0779PjF to J.L.]. Funding for open access charge: Swedish Re-search Council [2020–03561].Conflict of interest statement. None declared.
REFERENCES1. Chan,L.Y., Mugler,C.F., Heinrich,S., Vallotton,P. and Weis,K. (2018)
Non-invasive measurement of mRNA decay reveals translationinitiation as the major determinant of mRNA stability. Elife, 7,e32536.
2. Elkon,R., Zlotorynski,E., Zeller,K.I. and Agami,R. (2010) Majorrole for mRNA stability in shaping the kinetics of gene induction.BMC Genomics, 11, 259.
3. Thomsen,S., Anders,S., Janga,S.C., Huber,W. and Alonso,C.R.(2010) Genome-wide analysis of mRNA decay patterns during earlyDrosophila development. Genome Biol., 11, R93.
4. Philip,P. and Stenberg,P. (2013) Male X-linked genes in Drosophilamelanogaster are compensated independently of the Male-SpecificLethal complex. Epigenet. Chromatin, 6, 35.
5. Stenberg,P., Lundberg,L.E., Johansson,A.M., Ryden,P.,Svensson,M.J. and Larsson,J. (2009) Buffering of segmental andchromosomal aneuploidies in Drosophila melanogaster. PLoS Genet.,5, e1000465.
6. Zhang,Y., Malone,J.H., Powell,S.K., Periwal,V., Spana,E.,Macalpine,D.M. and Oliver,B. (2010) Expression in aneuploidDrosophila S2 cells. PLoS Biol., 8, e1000320.
7. Bachtrog,D. (2013) Y-chromosome evolution: emerging insights intoprocesses of Y-chromosome degeneration. Nat. Rev. Genet., 14,113–124.
8. Chandler,C.H. (2017) When and why does sex chromosome dosagecompensation evolve?Ann. N.Y. Acad. Sci., 1389, 37–51.
9. Galupa,R. and Heard,E. (2018) X-chromosome inactivation: acrossroads between chromosome architecture and gene regulation.Ann. Rev. Genet., 52, 535–566.
10. Gupta,V., Parisi,M., Sturgill,D., Nuttall,R., Doctolero,M.,Dudko,O.K., Malley,J.D., Eastman,P.S. and Oliver,B. (2006) Globalanalysis of X-chromosome dosage compensation. J. Biol., 5, 3.
11. Nguyen,D.K. and Disteche,C.M. (2006) Dosage compensation of theactive X chromosome in mammals. Nat. Genet., 38, 47–53.
12. Yildirim,E., Sadreyev,R.I., Pinter,S.F. and Lee,J.T. (2012)X-chromosome hyperactivation in mammals via nonlinear
relationships between chromatin states and transcription. Nat. Struct.Mol. Biol., 19, 56–61.
13. Xiong,Y., Chen,X., Chen,Z., Wang,X., Shi,S., Wang,X., Zhang,J. andHe,X. (2010) RNA sequencing shows no dosage compensation of theactive X-chromosome. Nat. Genet., 42, 1043–1047.
14. Deng,X., Hiatt,J.B., Nguyen,D.K., Ercan,S., Sturgill,D., Hillier,L.W.,Schlesinger,F., Davis,C.A., Reinke,V.J., Gingeras,T.R. et al. (2011)Evidence for compensatory upregulation of expressed X-linked genesin mammals, Caenorhabditis elegans and Drosophila melanogaster.Nat. Genet., 43, 1179–1185.
15. Kharchenko,P.V., Xi,R. and Park,P.J. (2011) Evidence for dosagecompensation between the X chromosome and autosomes inmammals. Nat. Genet., 43, 1167–1169.
16. Lin,H., Halsall,J.A., Antczak,P., O’Neill,L.P., Falciani,F. andTurner,B.M. (2011) Relative overexpression of X-linked genes inmouse embryonic stem cells is consistent with Ohno’s hypothesis.Nat. Genet., 43, 1169–1170.
17. Wang,Z.-Y., Leushkin,E., Liechti,A., Ovchinnikova,S., Moßinger,K.,Bruning,T., Rummel,C., Grutzner,F., Cardoso-Moreira,M., Janich,P.et al. (2020) Transcriptome and translatome co-evolution inmammals. Nature, 588, 642–647.
18. Faucillion,M.L. and Larsson,J. (2015) Increased expression ofX-linked genes in mammals is associated with a higher stability oftranscripts and an increased ribosome density. Genome Biol. Evol., 7,1039–1052.
19. Prestel,M., Feller,C. and Becker,P.B. (2010) Dosage compensationand the global re-balancing of aneuploid genomes. Genome Biol., 11,216–216.
20. Stenberg,P. and Larsson,J. (2011) Buffering and the evolution ofchromosome-wide gene regulation. Chromosoma, 120, 213–225.
21. Samata,M. and Akhtar,A. (2018) Dosage compensation of the Xchromosome: a complex epigenetic assignment involving chromatinregulators and long noncoding RNAs. Annu. Rev. Biochem., 87,323–350.
22. Ekhteraei-Tousi,S., Lewerentz,J. and Larsson,J. (2020) Painting ofFourth and the X-linked 1.688 satellite in D. melanogaster is involvedin chromosome-wide gene regulation. Cells, 9, 323.
23. Kuroda,M.I., Hilfiker,A. and Lucchesi,J.C. (2016) Dosagecompensation in Drosophila-a model for the coordinate regulation oftranscription. Genetics, 204, 435–450.
24. Lucchesi,J.C. and Kuroda,M.I. (2015) Dosage compensation inDrosophila. Cold Spring Harb. Perspect. Biol., 7, a019398.
25. Ferrari,F., Alekseyenko,A.A., Park,P.J. and Kuroda,M.I. (2014)Transcriptional control of a whole chromosome: emerging models fordosage compensation. Nat. Struct. Mol. Biol., 21, 118–125.
26. Ferrari,F., Plachetka,A., Alekseyenko,A.A., Jung,Y.L., Ozsolak,F.,Kharchenko,P.V., Park,P.J. and Kuroda,M.I. (2013) “Jump start andgain” model for dosage compensation in Drosophila based on directsequencing of nascent transcripts. Cell Rep., 5, 629–636.
27. Ferrari,F., Jung,Y.L., Kharchenko,P.V., Plachetka,A.,Alekseyenko,A.A., Kuroda,M.I. and Park,P.J. (2013) Comment on“Drosophila dosage compensation involves enhanced Pol IIrecruitment to male X-linked promoters”. Science, 340, 273.
28. Imamachi,N., Tani,H., Mizutani,R., Imamura,K., Irie,T., Suzuki,Y.and Akimitsu,N. (2014) BRIC-seq: a genome-wide approach fordetermining RNA stability in mammalian cells. Methods, 67, 55–63.
29. Smid,M., Coeberghvanden Braak,R.R.J., vandeWerken,H.J.G.,vanRiet,J., vanGalen,A., deWeerd,V., vanderVlugt-Daane,M.,Bril,S.I., Lalmahomed,Z.S., Kloosterman,W.P. et al. (2018) Genelength corrected trimmed mean of M-values (GeTMM) processing ofRNA-seq data performs similarly in intersample analyses whileimproving intrasample comparisons. BMC Bioinf., 19, 236.
30. Luo,S., He,F., Luo,J., Dou,S., Wang,Y., Guo,A. and Lu,J. (2018)Drosophila tsRNAs preferentially suppress general translationmachinery via antisense pairing and participate in cellular starvationresponse. Nucleic Acids Res., 46, 5250–5268.
31. Subtelny,A.O., Eichhorn,S.W., Chen,G.R., Sive,H. and Bartel,D.P.(2014) Poly(A)-tail profiling reveals an embryonic switch intranslational control. Nature, 508, 66–71.
32. Chintapalli,V.R., Wang,J. and Dow,J.A. (2007) Using Flyatlas toidentify better Drosophila melanogaster models of human disease.Nat. Genet., 39, 715–720.
33. Huang da,W., Sherman,B.T. and Lempicki,R.A. (2009) Systematicand integrative analysis of large gene lists using DAVIDbioinformatics resources. Nat. Protoc., 4, 44–57.
Dow
nloaded from https://academ
ic.oup.com/nar/article/50/8/4372/6564801 by guest on 15 July 2022
Nucleic Acids Research, 2022, Vol. 50, No. 8 4387
34. Vicoso,B. and Bachtrog,D. (2015) Numerous transitions of sexchromosomes in Diptera. PLoS Biol., 13, e1002078.
35. Vicoso,B. and Bachtrog,D. (2013) Reversal of an ancient sexchromosome to an autosome in Drosophila. Nature, 499, 332–335.
36. Tani,H., Imamachi,N., Salam,K.A., Mizutani,R., Ijiri,K., Irie,T.,Yada,T., Suzuki,Y. and Akimitsu,N. (2012) Identification of hundredsof novel UPF1 target transcripts by direct determination of wholetranscriptome stability. RNA Biol., 9, 1370–1379.
37. Duan,J., Shi,J., Ge,X., Dolken,L., Moy,W., He,D., Shi,S.,Sanders,A.R., Ross,J. and Gejman,P.V. (2013) Genome-wide surveyof interindividual differences of RNA stability in humanlymphoblastoid cell lines. Sci. Rep., 3, 1318.
38. Kim,M., Faucillion,M.L. and Larsson,J. (2018) RNA-on-X 1 and 2 inDrosophila melanogaster fulfill separate functions in dosagecompensation. PLoS Genet, 14, e1007842.
39. Hamada,F.N., Park,P.J., Gordadze,P.R. and Kuroda,M.I. (2005)Global regulation of X chromosomal genes by the MSL complex inDrosophila melanogaster. Genes Dev., 19, 2289–2294.
40. Straub,T., Grimaud,C., Gilfillan,G.D., Mitterweger,A. andBecker,P.B. (2008) The chromosomal high-affinity binding sites forthe Drosophila dosage compensation complex. PLoS Genet., 4,e1000302.
41. Deng,X., Koya,S.K., Kong,Y. and Meller,V.H. (2009) Coordinatedregulation of heterochromatic genes in Drosophila melanogastermales. Genetics, 182, 481–491.
42. Munchel,S.E., Shultzaberger,R.K., Takizawa,N. and Weis,K. (2011)Dynamic profiling of mRNA turnover reveals gene-specific andsystem-wide regulation of mRNA decay. Mol. Biol. Cell, 22,2787–2795.
43. Yang,E., van Nimwegen,E., Zavolan,M., Rajewsky,N., Schroeder,M.,Magnasco,M. and Darnell,J.E., Jr. (2003) Decay rates of humanmRNAs: correlation with functional characteristics and sequenceattributes. Genome Res., 13, 1863–1872.
44. Friedel,C.C., Dolken,L., Ruzsics,Z., Koszinowski,U.H. andZimmer,R. (2009) Conserved principles of mammaliantranscriptional regulation revealed by RNA half-life. Nucleic AcidsRes., 37, e115.
45. Fores-Martos,J., Forte,A., Garcıa-Martınez,J. and Perez-Ortın,J.E.(2021) A trans-omics comparison reveals common gene expressionstrategies in four model organisms and exposes similarities anddifferences between them. Cells, 10, 334.
46. Wang,Y., Liu,C.L., Storey,J.D., Tibshirani,R.J., Herschlag,D. andBrown,P.O. (2002) Precision and functional specificity in mRNAdecay. Proc. Natl. Acad. Sci. U.S.A., 99, 5860.
47. Geisberg,J.V., Moqtaderi,Z., Fan,X., Ozsolak,F. and Struhl,K. (2014)Global analysis of mRNA isoform half-lives reveals stabilizing anddestabilizing elements in yeast. Cell, 156, 812–824.
48. Feng,L. and Niu,D.K. (2007) Relationship between mRNA stabilityand length: an old question with a new twist. Biochem. Genet., 45,131–137.
49. Chang,H., Lim,J., Ha,M. and Kim,V.N. (2014) TAIL-seq:genome-wide determination of poly(A) tail length and 3′ endmodifications. Mol. Cell, 53, 1044–1052.
50. Tani,H., Mizutani,R., Salam,K.A., Tano,K., Ijiri,K., Wakamatsu,A.,Isogai,T., Suzuki,Y. and Akimitsu,N. (2012) Genome-widedetermination of RNA stability reveals hundreds of short-livednoncoding transcripts in mammals. Genome Res., 22, 947–956.
51. Lykke-Andersen,S. and Jensen,T.H. (2015) Nonsense-mediatedmRNA decay: an intricate machinery that shapes transcriptomes.Nat. Rev. Mol. Cell Biol., 16, 665–677.
52. Kim,Y.K. and Maquat,L.E. (2019) UPFront and center in RNAdecay: UPF1 in nonsense-mediated mRNA decay and beyond. RNA,25, 407–422.
53. Imamachi,N., Salam,K.A., Suzuki,Y. and Akimitsu,N. (2017) AGC-rich sequence feature in the 3′ UTR directs UPF1-dependentmRNA decay in mammalian cells. Genome Res., 27, 407–418.
54. Maekawa,S., Imamachi,N., Irie,T., Tani,H., Matsumoto,K.,Mizutani,R., Imamura,K., Kakeda,M., Yada,T., Sugano,S. et al.(2015) Analysis of RNA decay factor mediated RNA stabilitycontributions on RNA abundance. BMC Genomics, 16, 154.
55. Sun,M., Schwalb,B., Pirkl,N., Maier,K.C., Schenk,A.,Failmezger,H., Tresch,A. and Cramer,P. (2013) Global analysis ofeukaryotic mRNA degradation reveals Xrn1-dependent buffering oftranscript levels. Mol. Cell, 52, 52–62.
56. Zhang,Z. and Presgraves,D.C. (2016) Drosophila X-linked genes havelower translation rates than autosomal genes. Mol. Biol. Evol., 33,413–428.
57. Eckmann,C.R., Rammelt,C. and Wahle,E. (2011) Control of poly(A)tail length. Wiley Interdiscip. Rev.: RNA, 2, 348–361.
58. Tani,H. and Akimitsu,N. (2012) Genome-wide technology fordetermining RNA stability in mammalian cells: historical perspectiveand recent advantages based on modified nucleotide labeling. RNABiol., 9, 1233–1238.
59. Neal,S.J., Gibson,M.L., So,A.K. and Westwood,J.T. (2003)Construction of a cDNA-based microarray for Drosophilamelanogaster: a comparison of gene transcription profiles from SL2and Kc167 cells. Genome, 46, 879–892.
60. Cherbas,L., Willingham,A., Zhang,D., Yang,L., Zou,Y., Eads,B.D.,Carlson,J.W., Landolin,J.M., Kapranov,P., Dumais,J. et al. (2011)The transcriptional diversity of 25 Drosophila cell lines. Genome Res.,21, 301–314.
61. Slobodin,B., Bahat,A., Sehrawat,U., Becker-Herman,S.,Zuckerman,B., Weiss,A.N., Han,R., Elkon,R., Agami,R., Ulitsky,I.et al. (2020) Transcription dynamics regulate poly(A) tails andexpression of the RNA degradation machinery to balance mRNAlevels. Mol. Cell, 78, 434–444.
62. Schwanhausser,B., Busse,D., Li,N., Dittmar,G., Schuchhardt,J.,Wolf,J., Chen,W. and Selbach,M. (2011) Global quantification ofmammalian gene expression control. Nature, 473, 337–342.
63. Castellano,L.A. and Bazzini,A.A. (2017) Poly(A) tails: longer is notalways better. Nat. Struct. Mol. Biol., 24, 1010–1011.
64. Zabidi,M.A., Arnold,C.D., Schernhuber,K., Pagani,M., Rath,M.,Frank,O. and Stark,A. (2015) Enhancer–core-promoter specificityseparates developmental and housekeeping gene regulation. Nature,518, 556–559.
65. Lundberg,L.E., Figueiredo,M.L.A., Stenberg,P. and Larsson,J.(2012) Buffering and proteolysis are induced by segmental monosomyin Drosophila melanogaster. Nucleic Acids Res., 40, 5926–5937.
66. Haimovich,G., Medina,D.A., Causse,S.Z., Garber,M.,Millan-Zambrano,G., Barkai,O., Chavez,S., Perez-Ortın,J.E.,Darzacq,X. and Choder,M. (2013) Gene expression is circular:factors for mRNA degradation also foster mRNA synthesis. Cell,153, 1000–1011.
67. Komili,S. and Silver,P.A. (2008) Coupling and coordination in geneexpression processes: a systems biology view. Nat. Rev. Genet., 9,38–48.
68. Gilbertson,S., Federspiel,J.D., Hartenian,E., Cristea,I.M. andGlaunsinger,B. (2018) Changes in mRNA abundance drive shuttlingof RNA binding proteins, linking cytoplasmic RNA degradation totranscription. Elife, 7, e37663.
69. Vaquerizas,J.M., Cavalli,F.M., Conrad,T., Akhtar,A. andLuscombe,N.M. (2013) Response to comments on “Drosophiladosage compensation involves enhanced Pol II recruitment to maleX-linked promoters”. Science, 340, 273.
70. Riddle,N.C. and Elgin,S.C. (2006) The dot chromosome ofDrosophila: insights into chromatin states and their change overevolutionary time. Chromosome Res., 14, 405–416.
71. Filion,G.J., van Bemmel,J.G., Braunschweig,U., Talhout,W., Kind,J.,Ward,L.D., Brugman,W., de Castro,I.J., Kerkhoven,R.M.,Bussemaker,H.J. et al. (2010) Systematic protein location mappingreveals five principal chromatin types in Drosophila cells. Cell, 143,212–224.
72. Haddrill,P.R., Waldron,F.M. and Charlesworth,B. (2008) Elevatedlevels of expression associated with regions of the Drosophila genomethat lack crossing over. Biol. Lett., 4, 758–761.
73. Johansson,A.-M., Stenberg,P., Allgardsson,A. and Larsson,J. (2012)POF regulates the expression of genes on the fourth chromosome inDrosophila melanogaster by binding to nascent RNA. Mol. Cell. Biol.,32, 2121–2134.
74. Hochman,B. (1976) In: Ashburner,M. and Novitski,E. (eds). TheGenetics and biology of Drosophila. Academic Press, NY, Vol. 1B, pp.903–928.
75. Johansson,A.M., Stenberg,P., Bernhardsson,C. and Larsson,J. (2007)Painting of fourth and chromosome-wide regulation of the 4th
chromosome in Drosophila melanogaster. EMBO J., 26, 2307–2316.76. Johansson,A.M., Stenberg,P., Pettersson,F. and Larsson,J. (2007)
POF and HP1 bind expressed exons, suggesting a balancingmechanism for gene regulation. PLoS Genet., 3, e209.
Dow
nloaded from https://academ
ic.oup.com/nar/article/50/8/4372/6564801 by guest on 15 July 2022
4388 Nucleic Acids Research, 2022, Vol. 50, No. 8
77. Riddle,N.C. and Elgin,S.C.R. (2018) The Drosophila dotchromosome: where genes flourish amidst repeats. Genetics, 210, 757.
78. Singh,N.D., Davis,J.C. and Petrov,D.A. (2005) X-linked genes evolvehigher codon bias in Drosophila and Caenorhabditis. Genetics, 171,145–155.
79. Tuller,T., Waldman,Y.Y., Kupiec,M. and Ruppin,E. (2010)Translation efficiency is determined by both codon bias and foldingenergy. Proc. Natl. Acad. Sci. U.S.A., 107, 3645–3650.
80. Presnyak,V., Alhusaini,N., Chen,Y.H., Martin,S., Morris,N.,Kline,N., Olson,S., Weinberg,D., Baker,K.E., Graveley,B.R. et al.(2015) Codon optimality is a major determinant of mRNA stability.Cell, 160, 1111–1124.
81. Hanson,G., Alhusaini,N., Morris,N., Sweet,T. and Coller,J. (2018)Translation elongation and mRNA stability are coupled through theribosomal A-site. RNA, 24, 1377–1389.
82. Quax,T.E.F., Claassens,N.J., Soll,D. and van der Oost,J. (2015)Codon bias as a means to fine-tune gene expression. Mol. Cell, 59,149–161.
83. Zhao,F., Yu,C.H. and Liu,Y. (2017) Codon usage regulates proteinstructure and function by affecting translation elongation speed inDrosophila cells. Nucleic Acids Res., 45, 8484–8492.
Dow
nloaded from https://academ
ic.oup.com/nar/article/50/8/4372/6564801 by guest on 15 July 2022
Top Related
Copyright © 2022 FDOKUMEN

