


Bahasa
Halaman
Hukum


Model-Derived Dispersal Pathways from Multiple SourcePopulations Explain Variability of Invertebrate LarvalSupplyCarla P. Domingues1*, Rita Nolasco2, Jesus Dubert2, Henrique Queiroga1
1 Centro de Estudos do Ambiente e do Mar (CESAM) and Departamento de Biologia, Universidade de Aveiro, Campus Universitario de Santiago, Aveiro, Portugal, 2 Centro
de Estudos do Ambiente e do Mar (CESAM) and Departamento de Fısica, Universidade de Aveiro, Campus Universitario de Santiago, Aveiro, Portugal
Abstract
Background: Predicting the spatial and temporal patterns of marine larval dispersal and supply is a challenging task due tothe small size of the larvae and the variability of oceanographic processes. Addressing this problem requires the use ofnovel approaches capable of capturing the inherent variability in the mechanisms involved.
Methodology/Principal Findings: In this study we test whether dispersal and connectivity patterns generated from a bio-physical model of larval dispersal of the crab Carcinus maenas, along the west coast of the Iberian Peninsula, can predict thehighly variable daily pattern of wind-driven larval supply to an estuary observed during the peak reproductive season(March–June) in 2006 and 2007. Cross-correlations between observed and predicted supply were significant (p,0.05) andstrong, ranging from 0.34 to 0.81 at time lags of 26 to +5 d. Importantly, the model correctly predicted observed cross-shelfdistributions (Pearson r = 0.82, p,0.001, and r = 0.79, p,0.01, in 2006 and 2007) and indicated that all supply events werecomprised of larvae that had been retained within the inner shelf; larvae transported to the outer shelf and beyond neverrecruited. Estimated average dispersal distances ranged from 57 to 198 km and were only marginally affected by mortality.
Conclusions/Significance: The high degree of predicted demographic connectivity over relatively large geographic scales isconsistent with the lack of genetic structuring in C. maenas along the Iberian Peninsula. These findings indicate that thedynamic nature of larval dispersal can be captured by mechanistic biophysical models, which can be used to providemeaningful predictions of the patterns and causes of fine-scale variability in larval supply to marine populations.
Citation: Domingues CP, Nolasco R, Dubert J, Queiroga H (2012) Model-Derived Dispersal Pathways from Multiple Source Populations Explain Variability ofInvertebrate Larval Supply. PLoS ONE 7(4): e35794. doi:10.1371/journal.pone.0035794
Editor: Sharyn Jane Goldstien, University of Canterbury, New Zealand
Received December 27, 2011; Accepted March 21, 2012; Published April 25, 2012
Copyright: � 2012 Domingues et al. This is an open-access article distributed under the terms of the Creative Commons Attribution License, which permitsunrestricted use, distribution, and reproduction in any medium, provided the original author and source are credited.
Funding: Fundacao para a Ciencia e a Tecnologia (FCT) supported a PhD grant to CPD (SFRH/BD/21593/2005). This work is part of the ‘‘Connect - Connectivity ofmarine populations assessed with genetic and numerical modeling tools’’ (No. PTDC/BIA-BDE/65425/2006) and ‘‘ISCAD - Inner shelf circulation and dispersionpatterns: Interactions with estuarine systems’’ (No. PTDC/MAR/65760/2006) research projects, both funded by FCT under the European Regional DevelopmentFund. The funders had no role in study design, data collection and analysis, decision to publish, or preparation of the manuscript.
Competing Interests: The authors have declared that no competing interests exist.
* E-mail: [email protected]
Introduction
Most marine populations are demographically open, as
individuals are regularly exchanged among sets of local popula-
tions, either through the transport of planktonic propagules by
currents or by the movement of adults [1], [2]. Consequently, local
populations of marine species depend, in part, on processes that
occur elsewhere that influence the production, movement, and
survival of dispersers. Understanding how networks of populations
(i.e., metapopulations) are connected by dispersal is therefore
crucial for understanding gene flow, evolution, biodiversity
patterns and resilience of marine populations [3] as well as for
developing effective management measures capable of providing
local benefits.
In the case of benthic marine animals, where the adult is sessile
or sedentary, dispersal is accomplished by a planktonic larva.
Although results from theoretical modelling [1], genetic studies
[4], [5], [6], [7], [8], and the use of site-specific natural tags [9],
[10] suggest that moderate levels of larval exchange over a range
of spatial scales likely typifies many marine metapopulations, the
largely unbounded aquatic medium where larval dispersal takes
place and the small size of the larvae create insurmountable
logistical challenges in obtaining direct empirical evidence to
confirm these findings for most marine species. A further difficulty
in obtaining empirical evidence of dispersal and connectivity is
caused by eddy diffusion and by larval mortality. Turbulent
mixing spreads larvae over larger areas, effectively redistributing
the larvae over large volumes of the ocean [11]. Instantaneous
mortality rates for marine larval stages are on the order of 0.0161
to 1.0100 [12]. Combined, these processes further decrease the
likelihood of detecting larvae by conventional sampling methods,
particularly ones that are dispersed large distances away from their
population of origin [13].
In the present study we provide a novel test of the connectivity
framework by: (1) generating 4-month empirical time series of
daily larval supply of the shore crab Carcinus maenas to the Ria de
Aveiro, an estuary on the west coast of the Iberian Peninsula
during the peak reproductive seasons in 2006 and 2007, and (2)
PLoS ONE | www.plosone.org 1 April 2012 | Volume 7 | Issue 4 | e35794

comparing these time series to predicted larval supply time series
derived from a coupled oceanographic and biological numerical
model (biophysical model). Because biophysical models provide a
simulation environment integrating abiotic variability of the
marine environment with biological processes at multiple temporal
and spatial scales [14] they are a powerful tool to understand
dispersal, supply and connectivity of populations in the ocean [15].
Biophysical models of larval dispersal have been used to provide
theoretical expectations of the effects of various forcing factors on
transport [16], [17], [18], [19] or to predict the resulting spatial
distributions of adults [20], [21] recruits [22], or larvae, against in
situ observations of larval concentration [17], [23], [24], [25].
Recently, biophysical models have also been used as basis for
seascape genetic models and applied to explain phylogeographic
patterns and spatial distribution of allele frequencies [26], [27]. A
limitation of the biophysical larval dispersal models used so far is
the appropriate choice of the response variable and of the spatial
and temporal scales of the comparisons between the observations
and the predictions of the model [15]. For instance, the use of
settlement or recruitment data may not be appropriate because
several physical [28] and biological [29] processes may decouple
larval abundance in the water column from subsequent spatial
densities of recruits. Additionally, a mechanistic understanding of
the dispersal and supply processes requires data collected at daily
time scales, which is the typical temporal scale of changes in larval
abundance near settlement habitats [30], [31], [32].
In the present study, by recording larval supply at daily
frequencies over the reproductive season, we were able to connect
the temporal dynamics of the larval supply process with the spatio-
temporal dynamics of the dispersal and connectivity process. To
our knowledge, this is the first investigation into the linkages
between larval dispersal and larval supply in a marine system. The
simulations were performed using the Regional Ocean Modeling
System (ROMS) and a Lagrangian particle-tracking submodel that
includes advection and diffusion, as well as diel vertical migration,
temperature-dependent growth and mortality. The observed
megalopal supply series obtained during two years were compared
with predictions of the model using a stepwise approach where we
tested different behavioural, growth and mortality scenarios that
progressively constrained potential dispersal distance. The average
and maximum potential dispersal distances during the planktonic
larval phase were then estimated. The model successfully predicted
wind-driven supply with time lags of 26 to +5 d, with estimates of
average dispersal distances ranging from 57 to 175 km. The
strength of the predictions provides compelling evidence for the
utility of biophysical models in general to produce dispersal
pathways of individual larvae, allowing for testing of complex
hypotheses about dispersal scales, demographic connectivity and
gene flow, as well as providing fundamental ecological information
necessary for management of natural resources and ecosystems in
a cost-effective way.
Methods
Ethics StatementSamples of larvae were collected with passive plankton nets
deployed from a floating pier of the Clube de Vela da Costa Nova,
located in the Canal de Mira, Ria de Aveiro. This area is included
in the bird Special Protection Area (SPA) of the Ria de Aveiro,
which is the only nature conservation legal diploma applicable to
the area. Since collection of biological material with the use of
plankton nets is not forbidden under the statutes of this SPA,
permits are not required from the legal management body.
Permits were however obtained from the direction of the Clube de
Vela da Costa Nova to use the floating pier. Carcinus maenas is not
an endangered or protected species. To the best of our knowledge,
none of the unidentified zooplanktonic species that may be present
in the samples is in any way endangered or protected.
The biological modelWe developed our biological model to mimic the early life-
history characteristics of the portunid shore crab, Carcinus maenas, a
keystone predator and invasive species that forms large popula-
tions in coastal ecosystems worldwide. In southern Europe C.
maenas lives mostly in estuarine systems. The larval phase
comprises four planktotrophic zoeae and one megalopa [33] that
develop in the water column from four to six weeks, depending on
water temperature [34]. Berried C. maenas females move to the
lower estuary where larvae are released during nocturnal neap ebb
tides following quarter moons, resulting in pulses of abundance of
first zoeae that last for 3 to 5 days and recur at fortnight intervals
[35], [36] from winter to early summer. First zoeae migrate to
surface waters immediately after hatching and are exported from
the estuary by the strong ebb currents, usually before the turn of
the tide [36]. The megalopa is the stage that reinvades estuaries by
selective tidal stream transport [37]. C. maenas larvae display diel
vertical migration behaviour in coastal waters [36], [38] and their
dispersal pathways deviate strongly from expectations based on
assumptions made by passive dispersal models [39].
Time series of supplyTime series of supply of Carcinus maenas megalopae were
obtained in the Ria de Aveiro, a bar-built estuary located on the
northwest coast of Portugal (Figure 1). Circulation in the Ria de
Aveiro is dominated by tides, which are semidiurnal with an
average range of 2.1 m. Collections of larvae were made with two
passive plankton nets that were deployed daily from a floating pier
in the Canal de Mira, Ria de Aveiro (Figure 1). These nets were
designed to be continuously submersed, but to sample megalopae
only during the flood tide, with a baffle inside the nets to prevent
the loss of material during ebb tide. Both nets were deployed
facing the inlet, one net below the water’s surface and the other
above the bottom, and both were recovered each morning for
enumeration of megalopae. The sampling periods covered much
of the species’ larval season of two different years: March 7 to June
29, 2006, and March 11 to June 30, 2007. The data reported in
the present paper are daily averages of the number of megalopae
collected by the two nets. Field sampling methods and original
data are fully described in [32], [40].
The oceanographic modelThe simulations were conducted using a 3-D free-surface,
terrain-following primitive equation hydrostatic model configur-
able for fully realistic regional applications, based on the Regional
Ocean Modeling System (ROMS) [41]. The present configuration
represents an improvement and extension of the configuration
used by Peliz et al. [42] and Oliveira et al. [43] to the Atlantic
margin of the Iberian Peninsula. For a realistic simulation of the
Western Iberian margin it is necessary to include local aspects like
the Gibraltar Strait exchange (Mediterranean inflow/outflow) and
the wind-driven dynamics. The remote circulation influencing the
western limit of the study region associated with the Azores
Current (AC) and the Iberian Poleward Flow (IPC) should also be
accounted for. The large scale AC is related to the origin of water
mass distribution observed along the western Iberian margin, and
should be taken into account in order to obtain a good
representation of the properties of the water masses in the region.
The role of IPC is double: on one hand it is a mechanism of
Model-Derived Dispersal Pathways and Larval Supply
PLoS ONE | www.plosone.org 2 April 2012 | Volume 7 | Issue 4 | e35794
transport in the poleward direction, and on the other hand it
represents a mechanism of retention for larvae [44], forming a
kind of barrier to avoid offshore dispersal of larvae. To resolve the
large and small scale circulation, two grids were used (Figure 1): a
first domain grid (FD, Figure 1A), with a resolution of 1/10u (ca.
10 Km), from 32uW to 0.5uW and 30uN to 48uN. This FD was
used to provide initial and boundary conditions, through offline
nesting, to the large domain (LD, Figure 1B), which has a
horizontal resolution of 1/27u (i.e. a mean resolution of 3.5 km),
and 60 vertical levels, including the western Iberian margin, from
the Gulf of Cadiz (34.5uN) to the Bay of Biscay 45.5uN, and from
12.5uW to the Strait of Gibraltar at 5.5uW. The LD covers an area
of 12006600 km and constitutes the target domain used for the
dispersal simulations. The FD was first initialized from rest using
monthly temperature and salinity climatologies from Levitus &
Boyer [45] and Levitus et al. [46] at the boundaries, and was forced
using monthly surface fluxes from Comprehensive Ocean-
Atmosphere Data Set (COADS) [47]. Monthly geostrophic and
Ekman velocities were applied along the open lateral boundaries.
The methodology used is similar to that used in climatological
studies of the coastal transition zone of the California current
system [48]. This FD configuration reached equilibrium solutions
after four years. At this stage, the Mediterranean Water (MW) was
represented using a nudging term. After that period, and once the
ocean reaches equilibrium, realistic forcing at the surface (instead
of a climatological one) was used. The forcing consisted of the
NCEP2 air-sea fluxes (www.ncep.noaa.gov) and QuikScat reana-
lyzed satellite winds from CERSAT (cersat.ifremer.fr) for the
period 2001 to 2009, with a spatial resolution of 0.5u. The outputs
of the FD were used to initialize and provide boundary conditions
to the target domain, LD, through offline nesting. Forcing of the
LD was the same as for the FD, ensuring consistency of forcing for
both domains and avoiding problems at the boundaries. For the
target domain, LD, the Mediterranean Undercurrent (MU), which
originates at the Strait of Gibraltar and flows along the southwest
and west margins of the Iberian Peninsula, was imposed by a
boundary inflow/outflow condition at the Strait of Gibraltar [42].
The inflow of freshwater to the ocean originated from the main
rivers of the region was included in the form of realistic river
outflow (provided by INAG, Water Institute of Portugal), when
available. When there were no registers of river outflow during a
period of time a climatological value for seasonal river outflow was
imposed. The outputs of the model, consisting of temperature,
salinity, and three-dimensional velocity fields, were stored every
four hours in order to be used for the Lagrangian module
described below.
The Lagrangian offline modelIn order to simulate hatching, behaviour, growth and mortality
of Carcinus maenas larvae an Individual Based Model (IBM) was
coupled to ROMS using ROFF (ROMS Offline) [49], which is a
drifter-tracking code that simulates larval trajectories from stored
ROMS velocity and hydrological fields. The drifter-tracking code
simulates larval trajectories from stored ROMS velocity and
hydrological fields using a high order predictor corrector scheme
to integrate the motion equation dX/dt = Uroms(X,t), with X being
the position vector (x,y,z), and Uroms being the modelled 3D
velocity vector over time, given an initial condition X(t0) = X0. We
first tested, on a subset of the simulations, that this offline
procedure yields qualitatively and quantitatively similar results to
the online procedure, in which case the larvae were advected with
the time step of the model (300 s). Additionally to the advection
generated by the model velocities, and similarly to Peliz et al. [24],
the particle movements included random velocities in the vertical
direction, which were used to parameterize unresolved turbulent
processes. A diel vertical migration (DVM) scheme inferred from
Queiroga [50] and dos Santos et al. [38] was also explicitly
introduced in most of the model experiments. The DVM scheme
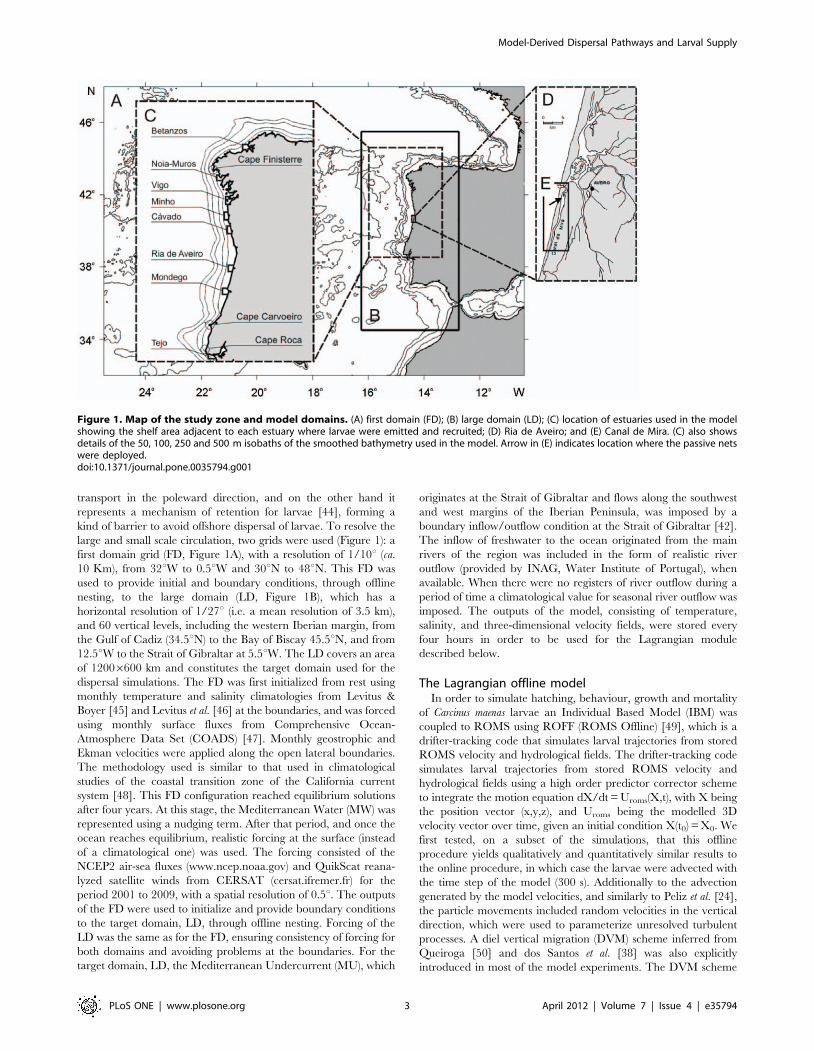
Figure 1. Map of the study zone and model domains. (A) first domain (FD); (B) large domain (LD); (C) location of estuaries used in the modelshowing the shelf area adjacent to each estuary where larvae were emitted and recruited; (D) Ria de Aveiro; and (E) Canal de Mira. (C) also showsdetails of the 50, 100, 250 and 500 m isobaths of the smoothed bathymetry used in the model. Arrow in (E) indicates location where the passive netswere deployed.doi:10.1371/journal.pone.0035794.g001
Model-Derived Dispersal Pathways and Larval Supply
PLoS ONE | www.plosone.org 3 April 2012 | Volume 7 | Issue 4 | e35794

consisted of forcing the larvae to drift at depth between 06 h and
20 h, and at the surface between 22 h and 04 h, every day, while
during the remaining periods the larvae migrated between the
surface and the deep levels (defined as the bottom layer of the
model if the local depth is shallower than 60 m, or 60 m if the
local depth is deeper).
Planktonic larval duration (PLD) and mortality rate caused by
physiological stress from varying temperature and salinity were
modelled pooling information from laboratory studies where
larvae were reared without substrate [34]. The proportional effects
of temperature on PLD, and of temperature and salinity on
mortality, based on the time a larva was exposed to a specific
temperature in the case of PLD, or to a specific combination of
temperature and salinity in the case of mortality, were estimated
by linearly interpolating between the laboratory data for each
larval stage. Age and the probability of death were assessed at each
time step of the model (300 s). Larvae were killed randomly based
on the proportional death rate during the previous time interval. If
a larva survived physiological stress it would grow from age 0 at
hatching to 4 at the moult to megalopa, corresponding to stages
zoeae 1 to 4; megalopae lived and remained competent until age 5
and then died. No other temporally or spatially distributed source
of mortality (e.g. predation) was used because of lack of
information.
In order to simulate hatching patterns a set of 900 virtual larvae,
released over four days (225 larvae d21 estuary21), was introduced
in the surface layer near each of eight estuarine systems (Betanzos,
Noia-Muros, Vigo, Minho, Cavado, Aveiro, Mondego and Tejo;
Figure 1), every fortnight during nocturnal ebb tides, from
February to July of 2006 and 2007. The position, age and
probability of death of a total number of 86400 larvae per year
(900 larvae/estuary612 release periods68 estuaries) were stored
with a time step of two hours. To decrease computation time we
only used estuaries separated by at least 40 km. Additionally,
according to initial trial simulations larvae hatched from estuaries
beyond Betanzos and Tejo would not recruit to the Ria de Aveiro,
and estuaries beyond these were not included in the simulations.
Because estuarine inlets were not conveniently represented by the
model we released and recruited larvae in an area of the shelf
adjacent to each estuary (approximate 12612 km), which roughly
corresponds to the area of the influence of the estuarine plume,
and defined supply to the estuaries as the number of particles that
crossed that respective area (Figure 1C). Tides were not used in the
model because previous studies have shown that tidal currents do
not affect the net horizontal advection of larvae that undergo
DVM over the west Iberian shelf [51].
Model experiments and validation strategyWe used a stepwise approach in order to validate the IBM
model and to test its response to different behavioural, growth and
mortality scenarios, progressing from the least constrained to the
most restrictive scenario in terms of potential dispersal distance.
DVM has the potential to strongly affect cross-shelf distribution
of larvae and other zooplankton in coastal upwelling systems [39],
[52], by positioning these organisms in a less advective
environment close to the bottom during the day. Therefore, we
first examined the influence of DVM on the cross-shore
distribution of larvae and retention of larvae on the shelf, by
running two Base experiments that did not include mortality or
any type of estuary-reinvasion behaviour, one without DVM and
the other with DVM. These Base experiments used the growth
rates directly estimated from published data. We compared
predictions of the model against data obtained during the Heincke
09 cruise [50], which sampled 6 transects extending from the inner
shelf to ca. 175 km offshore between 40.0 N and 41.5uN, in April
of 1991, using oblique hauls by a multi-net that was towed from
the surface to within 5 m of the bottom or to a 200 m depth level.
As a measure of the predicted distribution of larvae during the
whole planktonic development period, we calculated distributions
of larval trajectory densities as the accumulated number of larvae
that crossed each vertical array of cells in the model in a section
delimited by the 40.0 N and 41.5uN parallels. The trajectory
densities were then correlated with the cross-shelf abundance of all
pooled Carcinus maenas larval stages collected during the Heincke
09 cruise, normalized by area of sea surface. The Base model with
DVM predicted abundance maxima on the middle shelf, matching
the observed distribution of larval density [50]. In contrast, the
Base model without DVM predicted that very few larvae would
remain in shelf waters after the expected PLD, which departed
strongly from the observed distribution. We therefore developed
the subsequent steps building on the Base model with DVM.
In the Base experiments we did not recruit the megalopae to the
estuaries, but kept them in the model and recorded them every
time they crossed the area adjacent to the Ria de Aveiro. Under
this option we were interested in the potential trajectories of the
larvae in the shelf, without imposing any behavioural constraint
regarding proximity of the estuaries. Animations produced from
the model indicated that the larvae that recruited to the Ria de
Aveiro and other estuaries never left the inner shelf and had
trajectories parallel to the shore, increasing the probability of
recruitment of competent megalopae to estuaries. This led us to
the Invasion experiments, where the megalopae were made to
recruit to each estuary once they crossed the respective adjacent
shelf area (i. e. the megalopae entered the estuaries and were not
counted afterwards). Dispersal distance is partly correlated with
PLD [53]. Because of the uncertainty of larval development times
estimated from laboratory rearings, in a first set of Invasion
experiments we tested normal, fast and slow growth rates, where
the normal growth rate was that estimated from the literature data,
and the fast and slow growth rates were obtained by arbitrarily
accelerating or decelerating growth by 1 d per larval stage (ca.
20% of the total estimated PLD). Comparison between the
predicted and observed time series of supply using cross-
correlation indicated that changes in growth rate did not
consistently increase or decrease fit in the two years. A further
refinement of growth rate was therefore not attempted.
Mortality was introduced in a second set of Invasion
experiments, separately for each of the growth rates tested
previously. Because mortality was modelled as a random process,
the output of the model would always change with each
simulation, independently of the predicted oceanography. In
order to incorporate this variability we ran the offline IBM model
three times for each growth rate. Cross-correlation analysis of pairs
of time series produced by each of the three runs per growth rate
were consistently above 0.99 at 0 d time lags (p%0.001), and we
therefore averaged the outputs of the three runs in order to
compare the predictions of the Invasion experiments with
mortality with the observed times series of supply.
Statistical analysisThe adjustment of the predicted time series relative to the
observations was assessed using cross-correlation analysis [54], by
lagging the observed relative to the predicted series. This
procedure produces negative lags when predicted maxima precede
observations, and positive lags when observed maxima precede
predictions. In order to reduce noise and remove strong
autocorrelation at 1 d lag in both predictions and observations
the series were smoothed, with a moving average of period 5 d,
Model-Derived Dispersal Pathways and Larval Supply
PLoS ONE | www.plosone.org 4 April 2012 | Volume 7 | Issue 4 | e35794

and differenced at a lag of 21 d. Predicted time-series from
experiments with mortality were treated similarly before being
cross-correlated.
Results
Observed time series of megalopal supplyObserved supply of Carcinus maenas megalopae to the Ria de
Aveiro in 2006 and 2007 (Figures 2A and 3A) showed periods of
several weeks with zero or very low supply punctuated with supply
events driven by along-shore winds, as well as several instances
when supply events occurred with semilunar periodicity during
spring tides in spring and summer, particularly in 2006. In both
years the highest supply events followed several days of strong
southerly winds and coastal convergence [40].
Influence of DVM on cross-shelf distribution of larvaltrajectories in the Base experiments
The Base experiments without DVM resulted in very high levels
of larval wastage from the shelf, compared with those with DVM,
with a decrease of one order of magnitude in supply and only a few
tens of particles successfully recruiting to the Ria de Aveiro. The
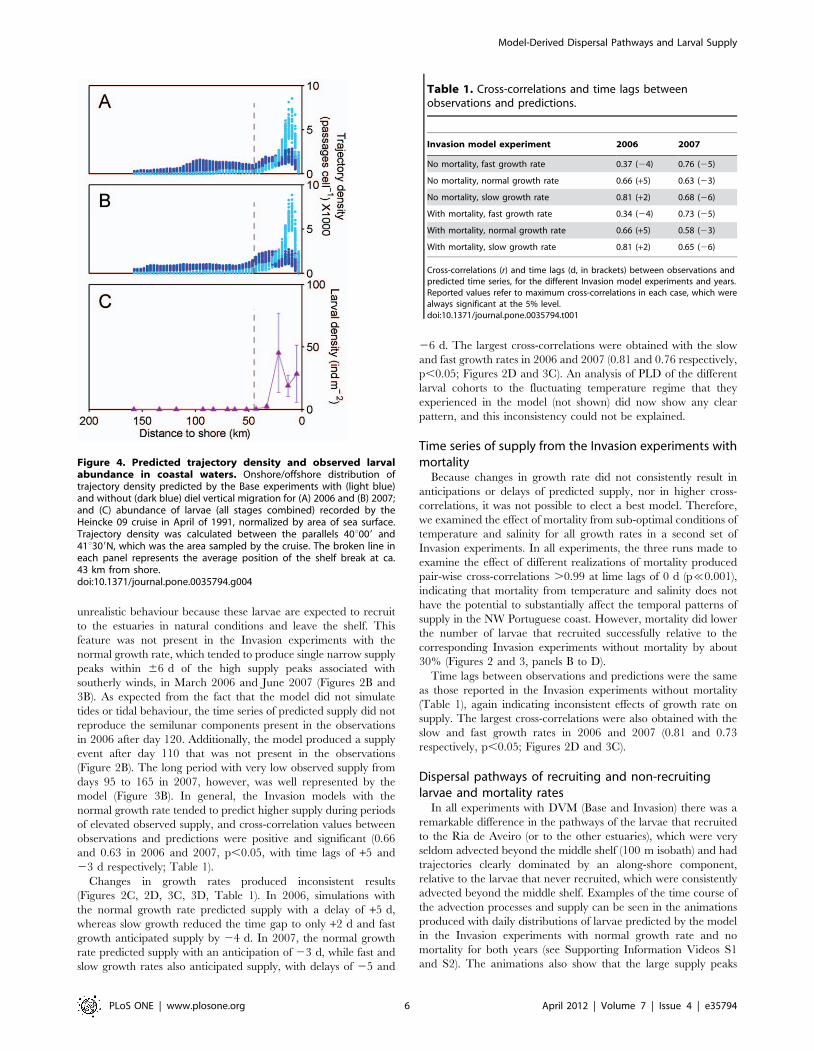
cross-shelf distribution of trajectory densities predicted by the Base
experiments with DVM, for both years, fit several features of the
observed cross-shelf distribution of larval densities recorded during
the Heincke 09 cruise [50], contrary to the Base experiments
without DVM (Figure 4). The observations indicate maximum
densities in the inner shelf, a rapid decline to very low values at ca.
35 km from the shore and near-zero values off the shelf break,
similarly to the predictions of the Base experiments with DVM.
Bonferroni-corrected Pearson correlations of log-observed average
abundance of larvae with log-predicted average trajectory density
were positive and significant in the case of the simulations with
DVM (r = 0.82, p,0.001 and r = 0.79, p,0.01, in 2006 and 2007)
and non-significant when DVM was not included (r = 0.33,
p.0.25 and r = 0.05, p.0.85, in 2006 and 2007).
Time series of supply from the Invasion experimentswithout mortality
An additional feature of the Base experiments was that they
produced wide bimodal peaks around periods of maximum
observed supply, caused by successive passages of individual
competent larvae in the shelf area adjacent to the Ria. This is an
Figure 2. Observed and predicted time series of supply in2006. (A) Daily numbers of observed megalopal supply (continuousline), along-shore wind stress (dashed line) and spring tides (tidal rangelarger than long-term average range, grey bars) in the Ria de Aveiro in2006; and predicted time series of supply by the Invasion experimentswith (B) normal, (C) fast and (D) slow growth rates with (dashed line)and without (continuous line) mortality, for the same year.doi:10.1371/journal.pone.0035794.g002
Figure 3. Observed and predicted time series of supply in2007. (A) Daily numbers of observed megalopal supply (continuousline), along-shore wind stress (dashed line) and spring tides (tidal rangelarger than long-term average range, grey bars) in the Ria de Aveiro in2007; and predicted time series of supply by the Invasion experimentswith (B) normal, (C) fast and (D) slow growth rates with (dashed line)and without (continuous line) mortality, for the same year.doi:10.1371/journal.pone.0035794.g003
Model-Derived Dispersal Pathways and Larval Supply
PLoS ONE | www.plosone.org 5 April 2012 | Volume 7 | Issue 4 | e35794
unrealistic behaviour because these larvae are expected to recruit
to the estuaries in natural conditions and leave the shelf. This
feature was not present in the Invasion experiments with the
normal growth rate, which tended to produce single narrow supply
peaks within 66 d of the high supply peaks associated with
southerly winds, in March 2006 and June 2007 (Figures 2B and
3B). As expected from the fact that the model did not simulate
tides or tidal behaviour, the time series of predicted supply did not
reproduce the semilunar components present in the observations
in 2006 after day 120. Additionally, the model produced a supply
event after day 110 that was not present in the observations
(Figure 2B). The long period with very low observed supply from
days 95 to 165 in 2007, however, was well represented by the
model (Figure 3B). In general, the Invasion models with the
normal growth rate tended to predict higher supply during periods
of elevated observed supply, and cross-correlation values between
observations and predictions were positive and significant (0.66
and 0.63 in 2006 and 2007, p,0.05, with time lags of +5 and
23 d respectively; Table 1).
Changes in growth rates produced inconsistent results
(Figures 2C, 2D, 3C, 3D, Table 1). In 2006, simulations with
the normal growth rate predicted supply with a delay of +5 d,
whereas slow growth reduced the time gap to only +2 d and fast
growth anticipated supply by 24 d. In 2007, the normal growth
rate predicted supply with an anticipation of 23 d, while fast and
slow growth rates also anticipated supply, with delays of 25 and
26 d. The largest cross-correlations were obtained with the slow
and fast growth rates in 2006 and 2007 (0.81 and 0.76 respectively,
p,0.05; Figures 2D and 3C). An analysis of PLD of the different
larval cohorts to the fluctuating temperature regime that they
experienced in the model (not shown) did now show any clear
pattern, and this inconsistency could not be explained.
Time series of supply from the Invasion experiments withmortality
Because changes in growth rate did not consistently result in
anticipations or delays of predicted supply, nor in higher cross-
correlations, it was not possible to elect a best model. Therefore,
we examined the effect of mortality from sub-optimal conditions of
temperature and salinity for all growth rates in a second set of
Invasion experiments. In all experiments, the three runs made to
examine the effect of different realizations of mortality produced
pair-wise cross-correlations .0.99 at lime lags of 0 d (p%0.001),
indicating that mortality from temperature and salinity does not
have the potential to substantially affect the temporal patterns of
supply in the NW Portuguese coast. However, mortality did lower
the number of larvae that recruited successfully relative to the
corresponding Invasion experiments without mortality by about
30% (Figures 2 and 3, panels B to D).
Time lags between observations and predictions were the same
as those reported in the Invasion experiments without mortality
(Table 1), again indicating inconsistent effects of growth rate on
supply. The largest cross-correlations were also obtained with the
slow and fast growth rates in 2006 and 2007 (0.81 and 0.73
respectively, p,0.05; Figures 2D and 3C).
Dispersal pathways of recruiting and non-recruitinglarvae and mortality rates
In all experiments with DVM (Base and Invasion) there was a
remarkable difference in the pathways of the larvae that recruited
to the Ria de Aveiro (or to the other estuaries), which were very
seldom advected beyond the middle shelf (100 m isobath) and had
trajectories clearly dominated by an along-shore component,
relative to the larvae that never recruited, which were consistently
advected beyond the middle shelf. Examples of the time course of
the advection processes and supply can be seen in the animations
produced with daily distributions of larvae predicted by the model
in the Invasion experiments with normal growth rate and no
mortality for both years (see Supporting Information Videos S1
and S2). The animations also show that the large supply peaks
Figure 4. Predicted trajectory density and observed larvalabundance in coastal waters. Onshore/offshore distribution oftrajectory density predicted by the Base experiments with (light blue)and without (dark blue) diel vertical migration for (A) 2006 and (B) 2007;and (C) abundance of larvae (all stages combined) recorded by theHeincke 09 cruise in April of 1991, normalized by area of sea surface.Trajectory density was calculated between the parallels 40u009 and41u309N, which was the area sampled by the cruise. The broken line ineach panel represents the average position of the shelf break at ca.43 km from shore.doi:10.1371/journal.pone.0035794.g004
Table 1. Cross-correlations and time lags betweenobservations and predictions.
Invasion model experiment 2006 2007
No mortality, fast growth rate 0.37 (24) 0.76 (25)
No mortality, normal growth rate 0.66 (+5) 0.63 (23)
No mortality, slow growth rate 0.81 (+2) 0.68 (26)
With mortality, fast growth rate 0.34 (24) 0.73 (25)
With mortality, normal growth rate 0.66 (+5) 0.58 (23)
With mortality, slow growth rate 0.81 (+2) 0.65 (26)
Cross-correlations (r) and time lags (d, in brackets) between observations andpredicted time series, for the different Invasion model experiments and years.Reported values refer to maximum cross-correlations in each case, which werealways significant at the 5% level.doi:10.1371/journal.pone.0035794.t001
Model-Derived Dispersal Pathways and Larval Supply
PLoS ONE | www.plosone.org 6 April 2012 | Volume 7 | Issue 4 | e35794

associated with southerly winds occur during periods of onshore
convergence and northward flow.
Estimates of survival to successful recruitment ranged from 10
to 17% of the total number of larvae hatched from all estuaries,
with an average of 13%. Pooling years, recruitment rate increased
with increasing growth rate (10, 13 and 16% for slow, normal and
fast growth rates, respectively). Pooling growth rates, recruitment
rate was 12% in 2006 and 14% in 2007. Mortality due to
physiological stress, estimated from the percentage of the total
number of larvae that died from this cause in the Invasion models
that include mortality, ranged from 34% to 40%, averaging 37%.
Pooling years, there was a consistent decrease in this component of
mortality with growth rate (34, 37 and 40%, for slow, normal and
fast growth rates, respectively). Pooling growth rates, mortality was
identical in the two years (37%). Larval wastage, estimated from
the complement of physiologic mortality plus recruitment,
changed little with growth rate and year, averaging 50% (50%
for all growth rates when pooling years; and 50% and 49% in
2006 and 2007, respectively, when pooling growth rates).
Dispersal distanceThe number of larvae predicted to recruit to the Ria de Aveiro
by the Invasion models, as well as the contribution of each source
estuary to the Ria, changed with year, growth rate and mortality
(Figure 5). In 2006 northern estuaries contributed more to the Ria
than southern estuaries, but this pattern reversed in 2007. Self-
recruitment to the Ria was also about 3 times higher in 2007. All
Invasion experiments predicted that estuaries from the Mondego
to Noia supplied larvae to the Ria de Aveiro. The Tejo estuary
never contributed to supply to the Ria. Invasion experiments
predicted a weak supply from Betanzos, except those with
mortality in 2006 that predicted no supply from this estuary.
Maximum realized dispersal distance (i.e., dispersal distance of
successfully recruiting larvae, negative from south, positive from
north) therefore depended on the direction of dispersal and on the
inclusion of mortality in the models. Maximum realized dispersal
of larvae supplied from south was constant at 257 km (all larvae
originated from the Mondego estuary) whereas maximum realized
dispersal of larvae supplied from north was 377 km or 232 km
depending on whether there was supply from Betanzos or not.
Despite these trends, the estimates of the average realized
dispersal of successfully recruiting larvae did not change much
(Table 2). Larvae supplied from southern estuaries always
dispersed 57 km, as they all originated from the Mondego estuary.
Average dispersal distances of larvae supplied from northern
estuaries ranged from 155 to 198 km, with an average of 175 km.
Mortality had a very small effect on average realized dispersal
decreasing it only by 1 km in the experiment with slow growth rate
in 2007. On the contrary, growth rate had a consistent effect on
dispersal distance when larvae were supplied from multiple
estuaries (those located to the north of the Ria de Aveiro), which
increased from slow to fast growth rates. This is evident by the
strong negative correlation between dispersal distance by larvae
supplied from the north and age at recruitment (both years, all
growth rates; Figure 6), which was 0.98 (p,0.001, n = 6).
Discussion
The Base experiment without DVM predicted that the larvae
would be advected, on average, to distances as far as 200 km off
the coast. These predictions depart strongly from observed field
distributions of Carcinus maenas larval stages, which show the
highest concentrations within 22 km from shore and no larvae
present beyond the shelf break [38], [50]. Importantly, field
observations indicate that Carcinus maenas larvae do display strong
nocturnal vertical migration behaviour [38] and a previous
modelling attempt indicated that, for a vertically migrating larvae,
upwelling could be beneficial for retention given the time that
larvae would spend in the compensating bottom undercurrent
[39]. This suggests that DVM may limit dispersal in coastal
environments that experience upwelling, a conclusion supported
by the present study as all modelling experiments with DVM
showed that successfully recruiting larvae never left the inner shelf.
Figure 5. Predicted supply of each source estuary to Ria deAveiro. Average daily contribution of each estuary to the Ria de Aveiroas a function of distance to source estuary predicted by the Invasionmodels for (A) 2006 and (B) 2007.doi:10.1371/journal.pone.0035794.g005
Figure 6. Effect of PLD on larval distance. Average dispersaldistance of successfully recruiting larvae supplied to the Ria de Aveirofrom northern estuaries as a function of planktonic larval durationpredicted by the Invasion models.doi:10.1371/journal.pone.0035794.g006
Model-Derived Dispersal Pathways and Larval Supply
PLoS ONE | www.plosone.org 7 April 2012 | Volume 7 | Issue 4 | e35794

Overall, the dispersal patterns obtained with DVM are consistent
with recent findings from other upwelling systems indicating that
larval development of many coastal invertebrates takes place in the
inner shelf environment [55].
The prediction that most of the non-periodic changes in larval
supply results from along-shore advection is a major suggestion of
the model. Along-shore circulation has been associated with
changes in supply and recruitment of coastal invertebrates by
interacting with coastal topography and redistributing the larvae
regionally. For instance, crab and sea urchin larvae in the
upwelling system of northern California larvae trapped in the lee
of Point Reyes and in the Gulf of the Farallones are released
following relaxation of upwelling winds, resulting in transport of
larvae and increased settlement to northward locations [56]. We
suggest that the mechanism operating on the northwest coast of
Iberia has a different nature. In the stretch of coast where larvae
recruiting to the Ria de Aveiro develop, which extends from the
Estremadura promontory to Cape Finisterre, there are no major
capes nor gulfs that could act as larval traps. Instead, the location
of larval pools along the coast and the delivery of competent larvae
to settlement habitats depend on local larval production, growth
and alternating along-shore advection history. The positive or
negative time lags obtained in the various Invasion experiments
likely arise from the topographically un-trapped pools and the
current uncertainty in larval growth rates and the location, timing
and magnitude of larval production events. This pattern of
advection and the inner-shelf retention of a significant fraction of
the larval pool also suggest a conceptually new mechanism for
estuarine reinvasion of crab megalopae. Instead of being
exclusively dependent on mechanisms for cross-shore advection,
competent megalopae have an increased probability of being
mixed into the estuarine plumes during along-shelf dispersal.
Megalopae of estuarine crabs have been shown to react to
estuarine water by arresting swimming and dropping to the
bottom under daylight conditions [57]. This reaction results from
the inhibitory effect of chemicals present in estuarine water
produced by the decomposition of organic matter. The successive
passage of megalopae close to estuarine inlets and the effect of
chemical cues could result in the accumulation of competent
larvae in the bottom close to estuaries and provide a trapping
mechanism that would enhance supply into estuaries during night
flood tides [58], [59], [60], [61].
In the Invasion experiments, mortality caused by physiological
stress from temperature and salinity averaged 37%, while wastage
was around 50%. Mortality did not affect predictions of average
realized larval dispersal because there are no strong temperature
gradients in the area to which dispersal is constrained, and the
observed and predicted salinity values are widely tolerated by
Carcinus maenas larvae [34]. Mortality did lower maximum realized
dispersal distance by reducing to zero the contribution of the
distant populations, a consequence that is acknowledged by
theoretical [62] and modelling [13], [63] studies. The effects of
mortality on larval dispersal and connectivity derived from
modelling studies, however, should be approached with care,
because the number of larvae that the models are able to simulate
is many orders of magnitude lower than the number of propagules
actually produced by most marine populations, and the thinning
effect of mortality may not be felt in distant sources because
dispersal is actually constrained by the physics of the ocean, which
limits dispersal and sets a maximum distance at which the farthest
sources can be located.
An unexpected prediction of the modelling experiments was
that the dispersal distance of successful recruiting larvae supplied
from northern estuaries decreased with increasing PLD. It is
generally considered that realized dispersal distance increases as
PLD increases, and comparative empirical evidence available from
a variety of species with contrasting life history traits supports this
view [53]. The counter-intuitive result obtained in the present
study derives from the increase in physiologic mortality rate with
longer PLD, a well-known effect [12] that was captured by the
model, which decreased the chance of successful recruitment from
distant sources. The suggestion that, in the environment where
marine larvae disperse, travelling fast in short time intervals may
be the best way to travel far may be pertinent for other species and
oceanographic regimes and may explain part of the variability in
intra- and inter-specific realized distance.
The estimates of average realized dispersal were 257 and
175 km (for larvae supplied from southern and northern estuaries,
respectively). The net result of dispersal along the western Iberian
shelf would therefore be southwards, which is consistent with the
dominance of upwelling events during spring and summer [64].
Besides successfully predicting the observed cross-shelf distribution
of larvae, the predictions of the model are remarkably consistent
with estimates of average larval dispersal distances for Carcinus
maenas based on the range increase of the species in invaded
ecosystems (63 and 173 km) [53], with observations of genetic
homogeneity among populations from the Gulf of Cadiz, South
Spain, to Wales, UK, a range of approximately 3000 km [8], and
with the lack of sweepstakes reproduction in the species [65]. Since
the model predicts maximum dispersal distances of 377 km from
Table 2. Estimates of the average realized dispersal of successfully recruiting larvae.
Invasion model experiment 2006 2007
From South From North From South From North
No mortality, fast growth rate 257 183 257 197
No mortality, normal growth rate 257 165 257 183
No mortality, slow growth rate 257 155 257 169
Average 257 168 257 183
With mortality, fast growth rate 257 183 257 198
With mortality, normal growth rate 257 165 257 183
With mortality, slow growth rate 257 155 257 168
Average 257 167 257 183
Average dispersal distance (km) of successfully recruiting larvae (realized dispersal) for the different Invasion model experiments and years.doi:10.1371/journal.pone.0035794.t002
Model-Derived Dispersal Pathways and Larval Supply
PLoS ONE | www.plosone.org 8 April 2012 | Volume 7 | Issue 4 | e35794

the north and 57 km from the south, homogenization of allele
frequencies along this 3000 km range must take several genera-
tions. The model also predicts that each larval event is a mixture of
larvae from different estuaries and therefore it lends support to the
observations of no genetic differences among supply events and
between larvae and the adult population found previously [65].
Modelling approaches that simultaneously include key physical
dynamics and biological traits provide a way forward to investigate
dispersal and connectivity of marine populations. In order to
increase their broad applicability, biophysical models need further
development in order to resolve several key issues such as two-way
coupling across different scales when using nested models, near-
shore and other boundary currents, non-hydrostatic flows, forcing
factors at event time scales and sub-grid scale parameterizations,
as well as a better understanding of larval behaviour, mortality
factors and other biological traits [66]. A limitation of the present
model is the difficulty in resolving processes in the sticky near-
shore zone, which increasingly seems to be relevant for littoral
species [67], that is caused by constraints imposed on grid size and
by the inability of hydrostatic models such as ROMS to deal with
waves. In the present case however one can argue that this does
not seriously affect the predictions of the model, since Carcinus
maenas larvae are ejected from estuaries with the estuarine plume
and will likely escape the very near-shore. Other limitations with a
greater potential to affect the fit of the model are the absence of
tidal behaviour in the individual based model, and of seasonal or
spatial variation in larval hatching. Therefore, the model cannot
reproduce semi-lunar or seasonal patterns of larval reinvasion and
supply, nor incorporate the interaction between spatially and
temporally changing reproductive outputs [68].
In spite of these limitations, the biophysical model used in the
present study appears to provide realistic estimates of the spatial
and temporal scales of the dispersal driven by along-shore winds,
which is the main factor regulating variability of oceanic currents
in upwelling continental shelves. The use of this model also
enabled us to link descriptions of the dispersal and supply
processes, which so far have been addressed independently given
the challenges imposed by the disparate spatial and temporal
scales involved [15], [66]. Finally, we wish to note that this study
indicates that, provided the relevant information is available,
spatial and temporal patterns of larval dispersal and supply can be
described by mechanistic bio-physical models, challenging the
paradigm that dispersal and recruitment in marine populations is
essentially a stochastic phenomenon [69].
Supporting Information
Video S1 Time evolution of larval trajectories for the complete
larval series (first zoea to megalopa) for the Invasion experiment
with normal growth rate without mortality in 2006. Left panel:
trajectories of the larvae that never recruited to the Ria de Aveiro,
right panel: trajectories of the larvae that recruited to the Ria de
Aveiro. Arrows close to estuaries indicate periodic hatching of
larvae and moving arrows represent direction and intensity of the
wind. Larvae are colour-coded according to natal estuary and
become grey at moult to megalopae. Red, blue and green flashing
circles indicate recruitment events in the observations and the
model, in the observations only, and in the model only,
respectively. Recruitment events are defined as when daily
observed and predicted supply of megalopae exceeded average
levels for at least 3 consecutive days.
(AVI)
Video S2 Time evolution of larval trajectories for the complete
larval series (first zoea to megalopa) for the Invasion experiment
with normal growth rate without mortality in 2007. Left panel:
trajectories of the larvae that never recruited to the Ria de Aveiro,
right panel: trajectories of the larvae that recruited to the Ria de
Aveiro. Arrows close to estuaries indicate periodic hatching of
larvae and moving arrows represent direction and intensity of the
wind. Larvae are colour-coded according to natal estuary and
become grey at moult to megalopae. Red, blue and green flashing
circles indicate recruitment events in the observations and the
model, in the observations only, and in the model only,
respectively. Recruitment events are defined as when daily
observed and predicted supply of megalopae exceeded average
levels for at least 3 consecutive days.
(AVI)
Acknowledgments
We are grateful to all the people who helped with larval collections in
particular to Silke Waap and Pedro Moreira, and to Dr Stephen Swearer
for his helpful comments.
Author Contributions
Conceived and designed the experiments: CPD RN JD HQ. Performed the
experiments: CPD RN JD HQ. Analyzed the data: CPD RN JD HQ.
Contributed reagents/materials/analysis tools: JD HQ. Wrote the paper:
CPD HQ. Performed modeling work: RN JD.
References
1. Roughgarden J, Iwasa Y, Baxter C (1985) Demographic theory for an open
marine population with space-limited recruitment. Ecology 66: 54–67.
2. Sale PF, Hanski I, Kritzer JP (2006) The merging of metapopulations theory and
marine ecology: establishing the historical context. In: Kritzer JP, Sale PF, eds.
Marine Metapopulations. Amsterdam: Academic Press. pp 3–29.
3. Levin LA (2006) Recent progress in understanding larval dispersal: new
directions and digressions. Integrative and Comparative Biology 46: 282–297.
4. Hellberg ME (1994) Relationships between inferred levels of gene flow and
geographic distance in a philopatric coral, Balanophyllia elegans. Evolution 48:
1829–1854.
5. Doherty PJ, Planes S, Mather P (1995) Gene flow and larval duration in 7
species of fish from the Great Barrier Reef. Ecology 76: 2373–2391.
6. Shulman MJ, Bermingham E (1995) Early-life histories, ocean currents, and the
population genetics of Caribbean reef fishes. Evolution 49: 897–910.
7. Sotka EE, Wares JP, Barth JA, Grosberg RK, Palumbi SR (2004) Strong genetic
clines and geographical variation in gene flow in the rocky intertidal barnacle
Balanus glandula. Molecular Ecology 13: 2143–2156.
8. Domingues CP, Creer S, Taylor MI, Queiroga H, Carvalho GR (2010) Genetic
structure of Carcinus maenas within its native range: larval dispersal and
oceanographic variability. Marine Ecology Progress Series 410: 111–123.
9. Swearer SE, Caselle JE, Lea DW, Warner RR (1999) Larval retention and
recruitment in an island population of a coral-reef fish. Nature 402: 799–802.
10. Becker BJ, Levin LA, Fodrie FJ, McMillan PA (2007) Complex larvalconnectivity patterns among marine invertebrate populations. Proceedings of
the National Academy of Sciences 104: 3267–3272.
11. Okubo A (1994) The role of diffusion and related physical processes in dispersal
and recruitment of marine populations. In: Sammarco PW, Heron ML, eds.The bio-physics of marine larval dispersal. Washington, DC: American
Geophysical Union. pp 5–32.
12. Morgan SG (1995) Life and death in the plankton: larval mortality and
adaptation. In: McEdward L, ed. Ecology of marine invertebrate larvae. Boca
Raton, FL: CRC Press. pp 279–321.
13. Cowen RK, Lwiza KMM, Sponaugle S, Paris CB, Olson DB (2000)
Connectivity of Marine Populations: Open or Closed? Science 287: 857–859.
14. Miller TJ (2007) Contribution of individual-based coupled physical-biological
models to understanding recruitment in marine fish populations. MarineEcology Progress Series 347: 127–138.
15. Metaxas A, Saunders M (2009) Quantifying the ‘‘Bio-’’ Components inBiophysical Models of Larval Transport in Marine Benthic Invertebrates:
Advances and Pitfalls. Biological Bulletin 216: 257–272.
16. Siegel DA, Kinlan BP, Gaylord B, Gaines SD (2003) Lagrangian descriptions of
marine larval dispersion. Marine Ecology Progress Series 260: 83–96.
17. Paris CB, Cowen RK (2004) Direct evidence of a biophysical retention
mechanism for coral reef fish larvae. Limnology and Oceanography 49:
1964–1979.
Model-Derived Dispersal Pathways and Larval Supply
PLoS ONE | www.plosone.org 9 April 2012 | Volume 7 | Issue 4 | e35794
18. Cowen RK, Paris CB, Srinivasan A (2006) Scaling of connectivity in marine
populations. Science 311: 522–527.
19. Aiken CM, Navarrete SE, Castillo MI, Castilla JC (2007) Along-shore larval
dispersal kernels in a numerical ocean model of the central Chilean coast.
Marine Ecology Progress Series 339: 13–24.
20. Incze LS, Naimie CE (2000) Modelling the transport of lobster (Homarus
americanus) larvae and postlarvae in the Gulf of Maine. Fisheries Oceanography
9: 99–113.
21. James MK, Armsworth PR, Mason LB, Bode L (2002) The structure of reef fish
metapopulations: modelling larval dispersal and retention patterns. Proceedings
of the Royal Society of London Series B: Biological Sciences 269: 2079–2086.
22. Pfeiffer-Herbert AS, McManus MA, Raimondi PT, Chao Y, Chai F (2007)
Dispersal of barnacle larvae along the central california coast : A modeling
study. Limnology and oceanography 52: 11.
23. Ellien C, Thiebaut E, Dumas F, Salomon JC, Nival P (2004) A modelling study
of the respective role of hydrodynamic processes and larval mortality on larval
dispersal and recruitment of benthic invertebrates: example of Pectinaria koreni
Annelida: Polychaeta) in the Bay of Seine (English Channel). Journal of Plankton
Research 26: 117–132.
24. Peliz A, Marchesiello P, Dubert J, Marta-Almeida M, Roy C, et al. (2007) A
study of crab larvae dispersal on the Western Iberian Shelf: Physical processes.
Journal of Marine Systems 68: 215–238.
25. Erftemeijer PLA, van Beek JKL, Bolle LJ, Dickey-Collas M, Los HFJ (2009)
Variability in transport of fish eggs and larvae. I. Modelling the effects of coastal
reclamation. Marine Ecology Progress Series 390: 167–181.
26. Galindo HM, Olson DB, Palumbi SR (2006) Seascape Genetics: A coupled
oceanographic-genetic model predicts population structure of caribbean corals.
Current Biology 16: 1622–1626.
27. Galindo HM, Pfeiffer-Herbert AS, McManus MA, Chao YI, Chai FEI, et al.
(2010) Seascape genetics along a steep cline: using genetic patterns to test
predictions of marine larval dispersal. Molecular Ecology 19: 3692–3707.
28. Pineda J (2000) Linking larval settlement to larval transport: assumptions,
potentials, and pitfalls. Oceanography of the Eastern Pacific, I 1: 84–105.
29. Hunt HL, Scheibling RE (1997) Role of early post-settlement mortality in
recruitment of benthic marine invertebrates. Marine Ecology Progress Series
155: 269–301.
30. Thorrold SR, Shenker JM, Mojica R, Maddox ED, Wishinsky E (1994)
Temporal patterns in the larval supply of summer-recruiting reef fishes to Lee-
Stocking island, Bahamas. Marine Ecology Progress Series 112: 75–86.
31. Shanks AL (1998) Abundance of post-larval Callinectes sapidus, Penaeus spp., Uca
spp., and Libinia spp. collected at an outer coastal site and their cross-shelf
transport. Marine Ecology Progress Series 168: 57–69.
32. Queiroga H, Almeida MJ, Alpuim T, Flores AAV, Francisco S, et al. (2006)
Tide and wind control of megalopal supply to estuarine crab populations on the
Portuguese west coast. Marine Ecology Progress Series 307: 21–36.
33. Rice AL, Ingle RW (1975) The larval development of Carcinus maenas (L.) and C.
mediterraneus Czerniavsky (Crustacea, Brachyura, Portunidae) reared in the
laboratory). Bull Br Mus nat Hist (Zool) 28: 103–119.
34. Nagaraj M (1993) Combined effects of temperature and salinity on the zoeal
development of the green crab, Carcinus maenas (Linnaeus, 1758) (Decapoda:
Portunidae). Scientia Marina 57: 1–8.
35. Queiroga H, Costlow JD, Moreira MH (1994) Larval abundance patterns of
Carcinus maenas (Decapoda, Brachyura) in Canal de Mira (Ria de Aveiro,
Portugal). Marine Ecology Progress Series 111: 63–72.
36. Queiroga H, Costlow JD, Moreira MH (1997) Vertical migration of the crab
Carcinus maenas first zoea in an estuary: implications for tidal stream transport.
Marine Ecology Progress Series 149: 121–132.
37. Queiroga H (1998) Vertical migration and selective tidal stream transport in the
megalopa of the crab Carcinus maenas. Hydrobiologia 375/376: 137–149.
38. dos Santos A, Santos AMP, Conway DVP, Bartilotti C, Lourenco P, et al. (2008)
Diel vertical migration of decapod larvae in the Portuguese coastal upwelling
ecosystem: implications for offshore transport. Marine Ecology Progress Series
359: 171–183.
39. Marta-Almeida M, Dubert J, Peliz A, Queiroga H (2006) Influence of vertical
migration pattern on retention of crab larvae in a seasonal upwelling system.
Marine Ecology Progress Series 307: 1–19.
40. Domingues CP, Almeida MJ, Dubert J, Nolasco R, Cordeiro N, et al. (2011)
Supply of crab larvae to an estuary in the eastern Atlantic upwelling system
exhibits predictable and haphazard variation at different temporal scales.
Marine Ecology Progress Series 425: 113–124.
41. Shchepetkin AF, McWilliams JC (2005) The regional oceanic modeling system
(ROMS): a split-explicit, free-surface, topography-following-coordinate oceanic
model. Ocean Modelling 9: 347–404.
42. Peliz A, Dubert J, Marchesiello P, Teles-Machado A (2007) Surface circulation
in the Gulf of Cadiz: model and mean flow structure. Journal of Geophysical
Research-Oceans 112: 20.
43. Oliveira PB, Nolasco R, Dubert J, Moita T, Peliz A (2009) Surface temperature,
chlorophyll and advection patterns during a summer upwelling event off centralPortugal. Continental Shelf Research 29: 759–774.
44. Santos AMP, Peliz A, Dubert J, Oliveira PB, Angelico MM, et al. (2004) Impact
of a winter upwelling event on the distribution and transport of sardine (Sardina
pilchardus) eggs and larvae off western Iberia: a retention mechanism. Continental
Shelf Research 24: 149–165.45. Levitus S, Boyer T (1994) World ocean atlas 1994 volume 4: Temperature.
NOAA Atlas NESDIS 4, US Department of Commerce, Washington, DC.
46. Levitus S, Burgett R, Boyer T (1994) World Ocean Atlas 1994 Volume 3:Salinity. NOAA Atlas NESDIS 3, US Department of Commerce, Washington,
DC.47. da Silva A, Young C, Levitus S (1994) Atlas of Surface Marine Data 1994.
NOAA Atlas NEDIS.48. Marchesiello P, McWilliams JC, Shchepetkin A (2001) Open boundary
conditions for long-term integration of regional oceanic models. Ocean
Modelling 3: 1–20.49. Carr SD, Capet XJ, Mcwilliams JC, Pennington JT, Chavez FP (2008) The
influence of diel vertical migration on zooplankton transport and recruitment inan upwelling region: estimates from a coupled behavioral-physical model.
Fisheries Oceanography 17: 1–15.
50. Queiroga H (1996) Distribution and drift of the crab Carcinus maenas (L.)(Decapoda, Portunidae) larvae over the continental shelf off northern Portugal in
April 1991. Journal of Plankton Research 18: 1981–2000.51. Marta-Almeida M, Dubert J (2006) The structure of tides in the Western Iberian
region. Continental Shelf Research 26: 385–400.52. Peterson W (1998) Life cycle strategies of copepods in coastal upwelling zones.
Journal of Marine Systems 15: 313–326.
53. Shanks AL, Grantham BA, Carr MH (2003) Propagule dispersal distance andthe size and spacing of marine reserves. Ecological Applications 13:
S8159–8169.54. Chatfield C (1996) The analysis of time series data: an introduction, 5th edn.
Chapman & Hall, London.
55. Morgan SG, Fisher JL, Miller SH, McAfee ST, Largier JL (2009) Nearshorelarval retention in a region of strong upwelling and recruitment limitation.
Ecology 90: 3489–3502.56. Wing SR, Botsford LW, Largier JL, Morgan LE (1995) Spatial structure of
relaxation events and crab settlement in the northern California upwellingsystem. Marine Ecology Progress Series 128: 199–211.
57. Forward RB, Rittschof D (1994) Photoresponses of crab megalopae in offshore
and estuarine waters - implications for transport. Journal of ExperimentalMarine Biology and Ecology 182: 183–192.
58. De Vries MC, Tankersley RA, Forward RB, Kirbysmith WW, Luettich RA(1994) Abundance of estuarine crab larvae is associated with tidal hydrologic
variables. Marine Biology 118: 403–413.
59. Tankersley RA, McKelvey LM, Forward RB (1995) Responses of estuarine crabmegalopae to pressure, salinity and light - implications for flood tide transport.
Marine Biology 122: 391–400.60. Welch JM, Forward RB (2001) Flood tide transport of blue crab, Callinectes
sapidus, postlarvae: behavioral responses to salinity and turbulence. MarineBiology 139: 911–918.
61. Reyns NB, Eggleston DB, Luettich RA (2007) Dispersal dynamics of post-larval
blue crabs, Callinectes sapidus, within a wind-driven estuary. Fisheries Oceanog-raphy 16: 257–272.
62. Jackson GA, Strathmann RR (1981) Larval mortality from offshore mixing as alink between precompetent and competent periods of development. American
Naturalist 118.
63. Watson JR, Mitarai S, Siegel DA, Caselle JE, Dong C, et al. (2010) Realized andpotential larval connectivity in the Southern California Bight. Marine Ecology
Progress Series 401: 31–48.64. Wooster WS, Bakun A, McLain DR (1976) The seasonal upwelling cycle along
the eastern boundary of the North Atlantic. Journal of Marine Research 34:
131–141.65. Domingues CP, Creer S, Taylor MI, Queiroga H, Carvalho GR (2011)
Temporal genetic homogeneity among shore crab (Carcinus maenas) larval eventssupplied to an estuarine system on the Portuguese northwest coast. Heredity
106: 832–840.66. Werner FE, Cowen RK, Paris CB (2007) Coupled biological and physical
models: present capabilities and necessary developments for future studies of
population connectivity. Oceanography 20: 54–69.67. Morgan SG, Fisher JL, Mace AJ, Akins L (2009) Cross-shelf distributions and
recruitment of crab postlarvae in a region of strong upwelling. Marine EcologyProgress Series 380: 173–185.
68. Kordos LM, Burton RS (1993) Genetic differentiation of Texas Gulf Coast
populations of the blue crab Callinectes sapidus. Marine Biology 117: 227–233.69. Siegel DA, Mitarai S, Costello CJ, Gaines SD, Kendall BE, et al. (2008) The
stochastic nature of larval connectivity among nearshore marine populations.Proceedings of the National Academy of Sciences 105: 8974–8979.
Model-Derived Dispersal Pathways and Larval Supply
PLoS ONE | www.plosone.org 10 April 2012 | Volume 7 | Issue 4 | e35794
Top Related
Copyright © 2022 FDOKUMEN

