


Bahasa
Halaman
Hukum


418 Nuclear Instruments and Methods in Physics Research B49 (1990) 418-424
North-Holland
MICROPROBE TECHNIQUES AND INSTRUMENTATION
G.J.F. LEGGE and A. SAINT
Proton microprobes employ a wide range of techniques. Most of the possible interactions between a heam particle and the
specimen may be utihsed to analyse or image the specimen. Though the commonest analytical technique adopted is PIXE. this is
frequently combined with other techniques which greatly enhance its power. These techniques may be used to supplement the PIXE
data set, normalise it_ confirm its validity or identify its origin. PIXE is also used to supplement data from other techniques.
Instrumentation now available can anaIyse many features of a specimen. commonly at resolutions of microns, and image at
resolutions down to 50 nm.
1. lntroductian
in moving From macro to micro PIXE, we find that the information content of the data set is much greater. Most of the analytical techniques available to macro ion beam analysis are available also to microbeam analysis and events previously associated with a single energy parameter (from a radiation detector) are now also associated with 2 or 3 coordinates. What was previously treated as a homogeneous specimen is now assumed to have microscopic structure and we are faced with imag- ing as well as analytical challenges. Bound up with these considerations are questions of specimen preparation, authenticity and stability. In this paper there is space to touch only lightly on the more traditional microprobe techniques. though stressing their major importance. Emphasis is placed on new techniques and new light on old considerations.
First let us ask what. as microanalysts, we seek to know about our specimens - ideally the nature and position in 3 dimensions of every atom. But. even with a count rate of l@js, we would need 2000 h to sample once every atom in a pm3 of carbon. So, to be more practical, we shall speak not of individual atoms. but of elements. We aim to determine (it the spectrum of elements present: (ii) the lateral distribution of those elements with re-
spect to observable and identifiable structure within the sample;
(iii) the depth distribution of elements; and (iv) the nature of any structure. These four aims are associated with different techniques and instrumentation and they all have associated limits to their accuracy.
For determination of the elemental spectrum, by far the most efficient technique, and the most sensitive for many elements, is PIXE [I]. I-Iowever for lighter ele- ments we need nuclear reaction analysis (NRA). back-
0168-583X/~/$03.50 G Elsevier Science Publishers B.V.
(North-HoIland)
scattering or forward scattering or recoil elastic analysis [2]. For determination of the lateral distribution. it is necessary to probe the specimen with a finely focussed beam 131. For depth profiling, we again need scattering
or NRA. Thus although PIXE is the analytical tech- nique most commonly employed with proton or nuclear
microprobes and a Si(Li) detector is to be found in most microprobe specimen chambers, it is only one of several analytical techniques for which provision must be made. The &ompet~t~on for space inside and around the speci- men chamber continues to increase with the develop- ment of new imaging techniques. This is illustrated in
fig. 1, the schematic plan of a multipurpose microprobe specimen chamber 141.
2. Elemental spectra
X-rays are almost invariably collected with a Si(Li) detector which, for thin specimens. must he placed as close as possible to the beam spot on the specimen. Even then the sensitivity limit for micro PIXE is typi- tally an order of magnitude worse than that for macro PIXE because of low statistics. A Si(Li) detector is the main analytical instrument for biological and medical specimens and for mineralogical specimens. The rare earth elements are normally detectable via their L lines but severe overlap of these lines generally occurs, be- cause of the mixture of several such elements. Wave- length dispersive detectors (crystal spectrometers) can separate these lines but these detectors have very low efficiency and can only detect one element at a time. The few high energy microprobes in existence un- doubtedly will be useful in identifying rare earth ele- ments by their simpler spectrum of K lines. These lines can be excited readily with proton energies of 40 MeV
[51. Some allowance should be made for the possible

G.J.F. Legge, A. Saint / Microprobe techniques and imtruntentatwn 419
Fig. 1. Schematic plan of a microprobe specimen chamber. showing layout of multiple detectors and other items. B: backscatter
detector; C: cold plate; Dl: drum for objectives (turret); D2: drum for prism and diaphragms; E: electron detector; F: forward
scatter detector; FC: Faraday cup; G: glancing angle detector; L: light; Ml: mirror for transmission illumination; M2: mirror for
front viewing; P: prism for microscope eyepiece above; QL: quadrupole lens; Rl-6: rings for movement of detectors etc.; S:
specimen on 2-axis goniometer and XYZ micrometer stage; SC: scanning coils: SZ: stereozoom front viewing microscope; T:
transmission detector; V: vacuum lock below for specimen changing; W: window; WD: space for wavelength dispersive detector or for gamma detector: X: Si(Li) detector above at 135 o (retractable).
need to incorporate a NaI(T1) crystal or germanium detector into the chamber. Because of the relatively low cross section of most nuclear reactions, such detectors need to subtend a very large solid angle at the specimen. NRA has found most application in the extensive work of light element distributions and profiles in metals [6]. The commonest analytical tool has been the (d, p) reac- tion. This is an important field of microprobe applica- tions but the relatively low cross sections for nuclear
reactions usually means that some spatial resolution must be sacrificed in favour of better statistics.
3. Depth profiling and channeling contrast microscopy
The depth distribution of near surface elements. as measured by RBS. is of most significance in the analysis
of semiconductors and other new materials. Here spa- tial resolution is maintained by use of a normally inci- dent beam - frequently 2 MeV alpha particles - and depth sensitivity optimised to about 3 nm by use of a grazing exit angle. Spatial resolution is sufficient to channel into individual grains of polycrystalline Si, for example, with a beam of restricted convergence [7] and a window placed on the energy spectrum of the stored data block can then generate maps of channeling con- trast. With a two-axis goniometer, the microprobe be- comes a uniquely powerful tool for investigating ele- ment distributions and crystalline properties of fine structures and small devices [8]. This is certain to be a field of ever-growing importance, because of the micro-
probe’s ability to map 3-dimensional structures [9] and because the resolution of the microprobe matches so well the dimensions of current interest in device fabrica- tion. Recently Maggiore et al. have shown that channel- ing can be combined with activation analysis in a mi- croprobe to give sensitive, highly localised detection of light elements [lo].
4. Imaging
Our fourth aim, which also has a bearing on our second one. requires us to investigate all ways of imag- ing the very varied range of specimens. We have already discussed X-rays, nuclear reaction products and backscattered, forward scattered and channeled par- ticles as tools for mapping or imaging the specimen.
The basic imaging instrument must be a high powered optical microscope. This is essential for observing the shape of the focussed beam and for locating structure in the specimen. For opaque specimens, such as metals and many minerals, a front viewing (reflection) micro- scope is needed ~ often an external stereozoom micro- scope with internal mirror, though a TV camera has also been used [ll]. For transparent specimens, such as most biological specimens, a rear viewing (transmission) microscope is needed and should be of high resolution in order to identify cells clearly. The objective lens then has to be mounted in the chamber. but it and any associated mirror or prism must be removable from the beam path if the specimen is transparent to the beam.
VII. MICROPROBES

420 G.J. F. I-egg, A. Saint / Microprobe techmques and instrumentution
Although an optical microscope of some from is essential, a secondary electron imaging system is also advisable, because it enables the beam scan to be located precisely over the area of interest on the specimen 1121. With thick electrically insulating specimens precautions must be taken to avoid long nonconducting paths, or charge buildup will affect the image - this occurs gener- ally prior to interference with PIXE spectra. The elec- tron detector may be a scintillator-photomultiplier combination [12], a channeltron 1131, an electron multi- plier or a similar device which can be biassed to attract electrons from the specimen.
5. Scanning ~~smission ion microscopy
The technique of scanning transmission ion mi- croscopy (STIM), used by Escovitz et al. on a low
energy (sputter) ion microprobe [14], was shown on a proton microprobe 115,161 to provide a powerful new imaging tool which generated valuable quantitative in- formation with high spatial resolution and sensitivity for thin specimens. The ion beam is allowed to pass through the specimen to be collected in a detector at 0 O. The energy lost in the specimen is a measure of the specimen area1 density (mass per unit area). This tech- nique is almost 100% efficient and has a thickness sensitivity of approximately 3 nm in biological material. Because the beam is stopped down to very small object and aperture values, the spatial resolution is very small, being limited by mechanical and electrical stability of the microprobe beatnline to a present minimum of about 50 nm [17]. Thus, with a very stable beamline. this technique offers an order of magnitude improve- ment in spatial resolution. The applications are not limited to biology and medicine, but these areas will see
most application because they make the most use of thin (transparent to the beam) specimens and because
they present the most serious problems in identification of significant ~crostructure. There is not much finestructure identifiable in an unstained freeze-dried cryosection of mammalian tissue.
Both brightfield and darkfield imaging are possible [I81 and the contrast mode may be scattering or energy loss - unlike the situation in electron energy loss spec- trometry (EELS), the energy loss in STIM carries infor- mation mostly about the specimen matrix. Energy loss data may be presented in the form of energy slices through the data block [lS] but it is generally more informative if the complete data block is presented in the form of one greyscale map of average energy loss for each pixel [19]. With some data, it is better to show this map in false colour contrast or in three-dimensional contours [17]. Ovetley et al. showed that for sharp edges the median is a better estimate of the average than the mean 1201. Fig. 2 is a greyscale plot of energy loss for a
WHOLEA.BIN GS=32
t 68 UM
Fig. 2. Example of the contrast available with a greyscale
STlM image - an unstained freeze-dried cryosection (5 micron
thick) of mouse ilium, showing the tip of one vitlus with other
villi on either side. The image was collected with a 100 nm
probe of 2 MeV alpha particles. It shows epithelial cells around
the edge of the vilius tip, lamina propria (central region) a
goblet cell (centre bottom of image) and other features. includ-
ing the brushborder (microvilli) along the edges of the villi.
(Bench and Kirby.)
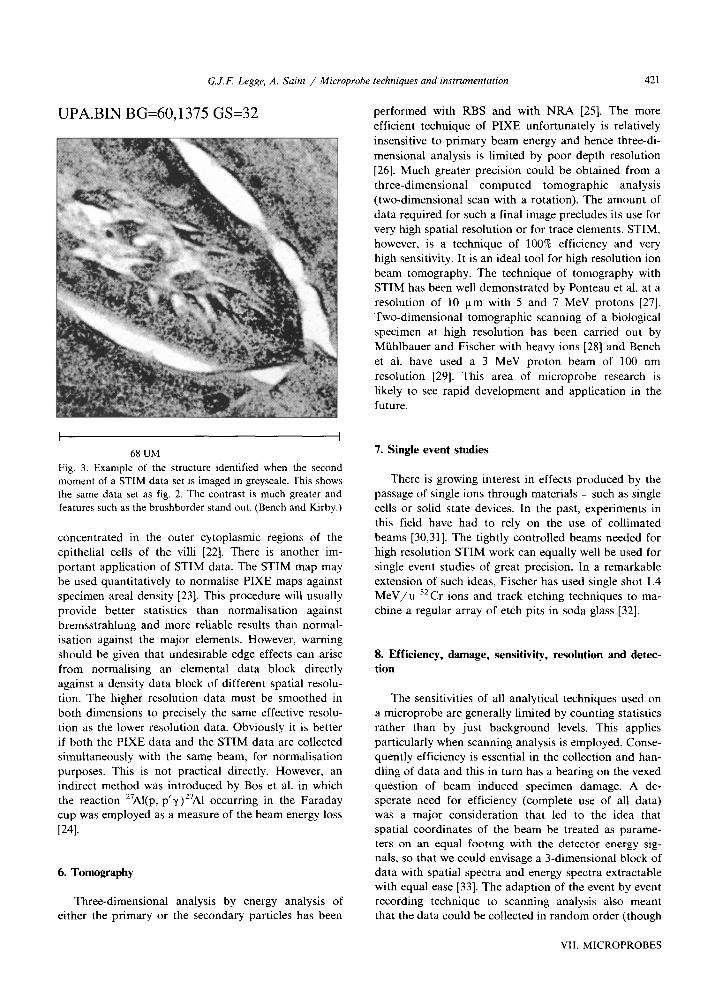
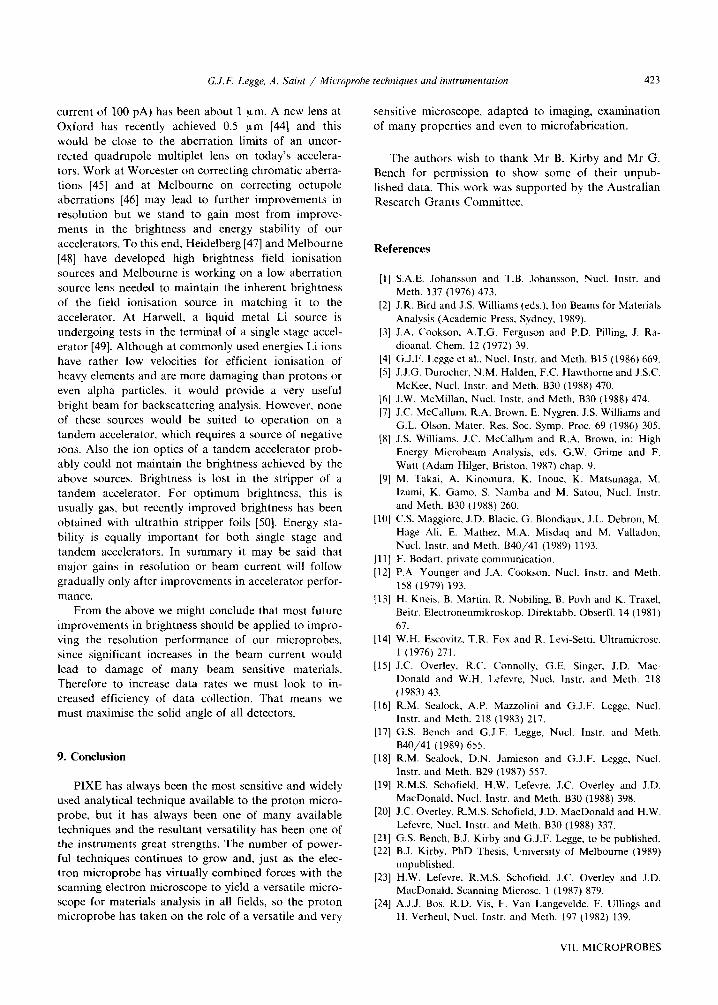
2 MeV alpha beam scanning a freeze-dried cryosection of ileum tissue from a mottled mouse [21]. In this STIM image of dimensions 68 pm by 68 pm and spatial resolution 100 nm, we see a central villus with neighbouring villi on either side. There is considerable structure visible and the edges of villi in many regions show a faint but definite indication of the brushhorder. which apparently is slightly denser than the neighhour- ing tissue. Since the brushborder is composed entirely of densely packed microvilli (approximately 2 pm long and 0.1 pm in diameter), we would expect the structure in this border to exhibit wide variations in energy loss for different beam particles within the one pixel. Over- ley et al. pointed out that such data will show large contrast in a plot of the second moment rather than the mean or median [ZO]. This is indeed so, and fig 3 shows the brushborder and some other features very clearly demarcated in such a plot [21]. The information ob- tained from such STIM plots is valuable in the interpre- tation of PIXE elemental maps. Fig. 4 shows a map of the trace element iron superimposed on a light greyscale STIM image of the villi [21]. The iron is seen to he
G.J.F. Leg@, A. Saint / Microprobe techniques and instrumentation 421
UPA.BIN BG=60.1375 GS=32
I I
68 UM
Fig. 3. Example of the structure identified when the second moment of a STIM data set is imaged in greyscale. This shows
the same data set as fig. 2. The contrast is much greater and
features such as the brushborder stand out. (Bench and Kirby.)
concentrated in the outer cytoplasmic regions of the epithelial cells of the villi [22]. There is another im- portant application of STIM data. The STIM map may be used quantitatively to normalise PIXE maps against specimen area1 density [23]. This procedure will usually provide better statistics than normalisation against bremsstrahlung and more reliable results than normal- isation against the major elements. However, warning should be given that undesirable edge effects can arise from normalising an elemental data block directly against a density data block of different spatial resolu- tion. The higher resolution data must be smoothed in both dimensions to precisely the same effective resolu- tion as the lower resolution data. Obviously it is better if both the PIXE data and the STIM data are collected simultaneously with the same beam, for normalisation purposes. This is not practical directly. However, an indirect method was introduced by Bos et al. in which the reaction 27Al(p, p’~)~‘Al occurring in the Faraday cup was employed as a measure of the beam energy loss
~241.
6. Tomography
Three-dimensional analysis by energy analysis of either the primary or the secondary particles has been
performed with RBS and with NRA [25]. The more
efficient technique of PIXE unfortunately is relatively insensitive to primary beam energy and hence three-di-
mensional analysis is limited by poor depth resolution [26]. Much greater precision could be obtained from a three-dimensional computed tomographic analysis (two-dimensional scan with a rotation). The amount of
data required for such a final image precludes its use for very high spatial resolution or for trace elements. STIM, however, is a technique of 100% efficiency and very high sensitivity. It is an ideal tool for high resolution ion beam tomography. The technique of tomography with STIM has been well demonstrated by Ponteau et al. at a resolution of 10 urn with 5 and 7 MeV protons [27]. Two-dimensional tomographic scanning of a biological specimen at high resolution has been carried out by Mtihlbauer and Fischer with heavy ions [28] and Bench
et al. have used a 3 MeV proton beam of 100 nm resolution [29]. This area of microprobe research is likely to see rapid development and application in the future.
7. Single event studies
There is growing interest in effects produced by the passage of single ions through materials - such as single cells or solid state devices. In the past, experiments in this field have had to rely on the use of collimated beams [30,31]. The tightly controlled beams needed for high resolution STIM work can equally well be used for single event studies of great precision. In a remarkable extension of such ideas, Fischer has used single shot 1.4 MeV/u 52Cr ions and track etching techniques to ma- chine a regular array of etch pits in soda glass [32].
8. Efficiency, damage, sensitivity, resolution and detec- tion
The sensitivities of all analytical techniques used on a microprobe are generally limited by counting statistics rather than by just background levels. This applies particularly when scanning analysis is employed. Conse- quently efficiency is essential in the collection and han- dling of data and this in turn has a bearing on the vexed question of beam induced specimen damage. A de- sperate need for efficiency (complete use of all data) was a major consideration that led to the idea that spatial coordinates of the beam be treated as parame- ters on an equal footing with the detector energy sig- nals, so that we could envisage a 3-dimensional block of data with spatial spectra and energy spectra extractable with equal ease [33]. The adaption of the event by event recording technique to scanning analysis also meant that the data could be collected in random order (though
VII. MICROPROBES

422 G.J.F. Legge. A. Saint / Microprobe techniques and insrrumenfaiion
Fig.
EEA.BIN GS=32
1 I 68 UM
4. Example of the use of a STIM image in interpreting PIXE data - the low statistics map of the trace element
,rimposed on a greyscale STIM image of the villus tip, to show that the Fe is predominantly located in the outer cytoplasm
epitheliaI%ells. This is not the same specimen as imaged in figs. 2 and 3. (Bench and Kirby.)
Fe is of the
the time sequence was recorded for analysis of any damage) and hence the beam spot could be kept in continuous rapid motion over the area of the scan [33]. In a further move to minimise beam damage to biologi- cal specimens, the maximum possible scanning frequen- cies were raised to 20 kHz in each direction [34]. High frequency scanning is also needed for rapid imaging of the specimen with secondary electrons when setting up, though any electronic delays may cause deterioration of image resolution. Although extensive measurements of elemental losses were made [16,35-391, the significance of the scan frequency was not fully investigated.
The question of beam damage has recently been discussed again in light of the push to higher resolution and consequent higher current density in the beam spot [40]. Obviously damage due to ionisation alone should not be dependent on dose rate or scan rate, but solely on the net dose per unit area. However, thermal damage should depend on all three parameters. Cookson calcu- lated the temperature rise in a biological specimen, assuming only conductive cooling [41]. In a very signifi- cant recent paper [42], he has argued that radiative cooling is insignificant for the small area of a micro- probe scan and shown that scan frequencies indeed
need to be of the order of kHz to be thermally effective, that the effect in any case is not great and that even the area of the scan and the area of the beam spot are of secondary importance compared to the total beam cur- rent. This leaves open the question of ionisation effects and the nature of the changes that undoubtedly occur in the specimen [37]. These conclusions with regard to thermal damage are significant because they indicate that thermal damage should not drastically increase when we improve the resolution of the beam, scan smaller areas or, as is likely, do both. They also indicate that, if we are currently close to the thermal limits in irradiating thin biological specimens, we cannot expect to increase the present low count rates solely by increas- ing the beam current; it will be necessary to increase also the conductivity of the foil. (This is a complex question involving also the relative thicknesses of the specimen and its support foil).
The interaction between a beam and a crystal lattice is also complex; the beam which gives rise to atomic displacement can also anneal and the effects depend critically on both beam and material [43].
For some years the resolution limit of the proton microprobe (at the generally agreed minimum analysis
G.J.F. Legge. A. Saint / Microprobe techniques and instrumentation 423
current of 100 PA) has been about 1 km. A new lens at Oxford has recently achieved 0.5 pm [44] and this
would be close to the aberration limits of an uncor- rected quadrupole multiplet lens on today’s accelera- tors. Work at Worcester on correcting chromatic aberra- tions [45] and at Melbourne on correcting octupole aberrations [46] may lead to further improvements in resolution but we stand to gain most from improve- ments in the brightness and energy stability of our accelerators. To this end, Heidelberg [47] and Melbourne [48] have developed high brightness field ionisation sources and Melbourne is working on a low aberration source lens needed to maintain the inherent brightness
of the field ionisation source in matching it to the accelerator. At Harwell. a liquid metal Li source is undergoing tests in the terminal of a single stage accel- erator [49]. Although at commonly used energies Li ions have rather low velocities for efficient ionisation of heavy elements and are more damaging than protons or even alpha particles, it would provide a very useful bright beam for backscattering analysis. However, none of these sources would be suited to operation on a tandem accelerator. which requires a source of negative ions. Also the ion optics of a tandem accelerator prob- ably could not maintain the brightness achieved by the above sources. Brightness is lost in the stripper of a tandem accelerator. For optimum brightness, this is usually gas, but recently improved brightness has been obtained with ultrathin stripper foils [SO]. Energy sta- bility is equally important for both single stage and tandem accelerators. In summary it may be said that major gains in resolution or beam current will follow gradually only after improvements in accelerator perfor- mance.
From the above we might conclude that most future improvements in brightness should be applied to impro- ving the resolution performance of our microprobes.
since significant increases in the beam current would lead to damage of many beam sensitive materials. Therefore to increase data rates we must look to in- creased efficiency of data collection. That means we must maximise the solid angle of all detectors.
9. Conclusion
PIXE has always been the most sensitive and widely used analytical technique available to the proton micro- probe, but it has always been one of many available techniques and the resultant versatility has been one of the instruments great strengths. The number of power- ful techniques continues to grow and, just as the elec- tron microprobe has virtually combined forces with the scanning electron microscope to yield a versatile micro- scope for materials analysis in all fields, so the proton microprobe has taken on the role of a versatile and very
sensitive microscope, adapted to imaging, examination of many properties and even to microfabrication.
The authors wish to thank Mr B. Kirby and Mr G. Bench for permission to show some of their unpub- lished data. This work was supported by the Australian Research Grants Committee.
References
Ul
VI
[31
[41
[51
[61
[71
Bl
[91
PO1
1111
WI
u31
u41
P51
1161
[I71
U81
[I91
WI
PI L=l
v31
v41
S.A.E. Johansson and T.B. Johansson, Nucl. Instr. and Meth. 137 (1976) 473. J.R. Bird and J.S. Williams (eds.), Ion Beams for Materials Analysis (Academic Press, Sydney, 1989).
J.A. Cookson. A.T.G. Ferguson and P.D. Pilling, J. Ra-
dioanal. Chem. 12 (1972) 39.
G.J.F. Legge et al.. Nucl. Instr. and Meth. B15 (1986) 669.
J.J.G. Durocher. N.M. Halden, F.C. Hawthorne and J.S.C.
McKee, Nucl. Instr. and Meth. B30 (1988) 470.
J.W. McMillan, Nucl. Instr. and Meth. B30 (1988) 474.
J.C. McCallum, R.A. Brown, E. Nygren. J.S. Williams and
G.L. Olson, Mater. Res. Sot. Symp. Proc. 69 (1986) 305.
J.S. Williams. J.C. McCallum and R.A. Brown, in: High
Energy Microbeam Analysis, eds. G.W. Grime and F.
Watt (Adam Hilger. Briston, 1987) chap. 9.
M. Takai, A. Kinomura, K. Inoue, K. Matsunaga, M.
Izumi, K. Gamo, S. Namba and M. Satou, Nucl. Instr.
and Meth. B30 (1988) 260.
C.S. Maggiore. J.D. Blacic. G. Blondiaux. J.L. Debron, M.
Hage Ah, E. Mathez, M.A. Misdaq and M. Valladon,
Nucl. Instr. and Meth. B40/41 (1989) 1193.
F. Bodart. private communication.
P.A. Younger and J.A. Cookson. Nucl. Instr. and Meth.
158 (1979) 193.
H. Kneis, B. Martin. R. Nobiling. B. Povh and K. Traxel.
Beitr. Electronenmikroskop. Direktabb. Obserfl. 14 (1981)
67.
W.H. Escovitz. T.R. Fox and R. Levi-Setti. Ultramicrosc.
l(l976) 271.
J.C. Overley. R.C. Connolly. G.E. Singer, J.D. Mac-
Donald and W.H. Lefevre, Nucl. Instr. and Meth. 218
(1983) 43.
R.M. Sealock. A.P. Mazzolini and G.J.F. Legge, Nucl.
Instr. and Meth. 218 (1983) 217.
G.S. Bench and G.J.F. Legge. Nucl. Instr. and Meth.
B40/41 (1989) 655.
R.M. Sealock, D.N. Jam&on and G.J.F. Legge. Nucl.
Instr. and Meth. B29 (1987) 557.
R.M.S. Schofield, H.W. Lefevre, J.C. Overley and J.D.
MacDonald, Nucl. Instr. and Meth. B30 (1988) 398.
J.C. Overley, R.M.S. Schofield. J.D. MacDonald and H.W.
Lefevre. Nucl. Instr. and Meth. B30 (1988) 337.
G.S. Bench. B.J. Kirby and G.J.F. Legge. to be published.
B.J. Kirby. PhD Thesis, University of Melbourne (19X9)
unpublished.
H.W. Lefevre. R.M.S. Schofield. J.C. Overley and J.D.
MacDonald. Scanning Microsc. 1 (1987) 879.
A.J.J. Bos. R.D. Vis. F. Van Langevelde, F. Ullings and
H. Verheul, Nucl. Instr. and Meth. 197 (1982) 139.
VII. MICROPROBES

424 G.J.F. Legge. A. Samt / Microprobe techniques and instrumentation
1251
1261
[271
P81
1291
[301
[311
1321
[331
B.L. Doyle, Nucl. Instr. and Meth. B15 (1986) 654.
M. JaksiC, M. VajiC, S. FaziniC. D. ReudiC, T. Tadic and
V. ValkoviC. Nucl. Instr. and Method. B40/41 (1989) 643.
A.E. Pontau. A.J. Antolak. D.H. Morse, A.A. Ver
Berkmoes, J.M. Brase, D.W. Heikkinen, H.E. Martz and
I.D. Proctor, Nucl. Instr. and Meth. B40/41 (1989) 646.
C. Mtihlbauer and B.E. Fischer. GSI Scientific Report
(1988).
G.S. Bench, to be published.
L.A. Braby and W.D. Reece, Nucl. Instr. and Meth.
B40/41 (1989) 1284.
W.E. Price and J.R. Goss, Nucl. Instr. and Meth. B40/41
(1989) 1306.
B.E. Fischer, Nucl. Instr. and Meth. B30 (1988) 284.
G.J.F. Legge, Abstr. 48th ANZAAS Cong. (1977) 25;
G.J.F. Legge and I. Hammond, J. Microsc. 117 (1979)
201.
[371
[381
[391
[401
M. Cholewa and G.J.F. Legge. Nucl. Instr. and Meth. B40/41 (1989) 651.
H.W. Kraner and K.W. Jones. IEEE Trans. Nucl. Sci.
NS-28 (1981) 1421.
R.D. Vis, The Proton Microprobe: Applications in the
Biomedical Field (CRC press. Baca Raton, Florida, 1986).
Y. Llabador. J.C. Gouillaud and P. Moretto. these Pro-
ceedings (5th Int. Conf. on PIXE, Amsterdam, The
Netherlands. 1989) Nucl. Instr. and Meth. B49 (1990) 435.
J.A. Cookson. Nucl. Instr. and Meth. 181 (1981) 115.
J.A. Cookson, Nucl. Instr. and Meth. B30 (1988) 324.
J.S. Williams, J.C. McCallum and R.A. Brown, Nucl.
Instr. and Meth. B30 (1988) 480.
D.N. Jamieson. G.W. Grime and F. Watt, Nucl. Instr.
and Meth. B40/41 (1989) 669.
F.W. Martin and R. Galoskie. Appl. Phys. Lett. 40 (1982)
191.
[341
1351
G.J.F. Legge, D.N. Jamieson. P.M. O’Brien and A.P.
Mazzolini, Nucl. Instr. and Meth. 197 (1982) 85.
G.J.F. Legge and A.P. Mazzolini, Nucl. Instr. and Meth.
168 (1980) 563; A.P. Mazzolini. G.J.F. Legge and C.K.
Pallaghy. Nucl. Instr. and Meth. 191 (1981) 583;
A.P. Mazzolini, C.K. Pallaghy and G.J.F. Legge, New
Phytol. 100 (1985) 483:
P.M. O’Brien and G.J.F. Legge, Biol. Trace Element Res.
13 (1987) 159;
G.J.F. Legge, P.M. O’Brien, B.J. Kirby and G.L. Allan,
Ultramicrosc. 24 (1988) 283.
F. Watt, G.W. Grime and C.C. Perry. Nucl. Instr. and
Meth. B30 (1988) 331.
1411
~421
[431
[441
[451
[461
[471
(481
[491
D.N. Jamieson and G.J.F. Legge,
B34 (1988) 411.
K. Blihringer. K. Jousten and S.
and Meth. B30 (1988) 289.
G.L. Allan, G.J.F. Legge and J.
Meth. B34 (1988) 122.
[501
P.M. Read, G.D. Alton and J.T. Maskrey. Nucl. Instr.
and Meth. B30 (1988) 293 and G.D. Alton, private com-
munication.
U.A.S. Tapper. R. Hellborg and K.G. Malmqvist. Nucl.
Instr. and Meth. B34 (1988) 407.
[361
Nucl. Instr. and Meth.
Kalbitzer. Nucl. Instr.
Zhu, Nucl. Instr. and
Top Related
Copyright © 2022 FDOKUMEN

