1907306-Instrumentation Lab Manual.pdf - SRM VALLIAMMAI ...
60
1 SRM VALLIAMMAI ENGINEERING COLLEGE (An Autonomous Institution) SRM Nagar, Kattankulathur – 603 203 DEPARTMENT OF MEDICAL ELECTRONICS LABORATORY MANUAL 1907306 –Instrumentation Laboratory Regulation – 2019 III Semester MDE Academic Year 2020 – 21 (Odd Semester) Prepared by Mr.S.Venkatesh Assistant Professor (O. G) / EEE
-
Upload
khangminh22 -
Category
Documents
-
view
1 -
download
0
Transcript of 1907306-Instrumentation Lab Manual.pdf - SRM VALLIAMMAI ...

1
SRM VALLIAMMAI ENGINEERING COLLEGE (An Autonomous Institution)
SRM Nagar, Kattankulathur – 603 203
DEPARTMENT OF MEDICAL ELECTRONICS
LABORATORY MANUAL
1907306 –Instrumentation Laboratory
Regulation – 2019
III Semester MDE
Academic Year 2020 – 21 (Odd Semester)
Prepared by
Mr.S.Venkatesh Assistant Professor (O. G) / EEE

2
SRM VALLIAMMAI ENGINEERING COLLEGE (An Autonomous Institution)
SRM Nagar, Kattankulathur – 603 203
DEPARTMENT OF MEDICAL ELECTRONICS
VISION OF THE INSTITUTE
Educate to excel in social transformation
MISSION OF THE INSTITUTE
To contribute to the development of human resources in the form of professional
engineers and managers of international excellence and competence with high
motivation and dynamism, who besides serving as ideal citizen of our country will
contribute substantially to the economic development and advancement in their
chosen areas of specialization.
To build the institution with international repute in education in several areas at
several levels with specific emphasis to promote higher education and research
through strong institute-industry interaction and consultancy.
VISION OF THE DEPARTMENT
To develop an excellent progressive quality education, translational research through
inventive collaborations as per industry requirements to improve the healthcare and
well-being of humankind
MISSION OF THE DEPARTMENT
To Acquaint students with the current technology to provide consultations and
technical support to hospitals, healthcare and service sectors.
To educate students with the fundamental knowledge, interdisciplinary problem
solving skills and confidence required to excel in medical electronics through
progressive learning.
To propagate creativity, responsibility, commitment and leadership qualities and
exhibit professional ethics and values.

3
SRM VALLIAMMAI ENGINEERING COLLEGE (An Autonomous Institution)
SRM Nagar, Kattankulathur – 603 203
DEPARTMENT OF MEDICAL ELECTRONICS PROGRAM OUTCOMES
1. Engineering knowledge: Apply the knowledge of mathematics, science, engineering
fundamentals, and an engineering specialization to the solution of complex engineering
problems.
2. Problem analysis: Identify, formulate, review research literature, and analyze complex
engineering problems reaching substantiated conclusions using first principles of
mathematics, natural sciences, and engineering sciences.
3. Design/development of solutions: Design solutions for complex engineering problems
and design system components or processes that meet the specified needs with
appropriate consideration for the public health and safety, and the cultural, societal, and
environmental considerations.
4. Conduct investigations of complex problems: Use research-based knowledge and
research methods including design of experiments, analysis and interpretation of data, and
synthesis of the information to provide valid conclusions.
5. Modern tool usage: Create, select, and apply appropriate techniques, resources, and
modern engineering and IT tools including prediction and modeling to complex
engineering activities with an understanding of the limitations.
6. The engineer and society: Apply reasoning informed by the contextual knowledge to
assess societal, health, safety, legal and cultural issues and the consequent responsibilities
relevant to the professional engineering practice.
7. Environment and sustainability: Understand the impact of the professional engineering
solutions in societal and environmental contexts, and demonstrate the knowledge of, and
need for sustainable development.
8. Ethics: Apply ethical principles and commit to professional ethics and responsibilities
and norms of the engineering practice.
9. Individual and team work: Function effectively as an individual, and as a member or
leader in diverse teams, and in multidisciplinary settings.
10. Communication: Communicate effectively on complex engineering activities with the
engineering community and with society at large, such as, being able to comprehend and
write effective reports and design documentation, make effective presentations, and give
and receive clear instructions.
11. Project management and finance: Demonstrate knowledge and understanding of the
engineering and management principles and apply these to one’s own work, as a member
and leader in a team, to manage projects and in multidisciplinary environments.
12. Life-long learning: Recognize the need for, and have the preparation and ability to
engage in independent and life-long learning in the broadest context of technological
change.
PROGRAM SPECIFIC OUTCOMES
PSO1: Ability to apply the acquired knowledge of basic skills, mathematical foundations,
principles of electronics, Modeling and design of electronics-based systems in solving
engineering Problems in healthcare.
PSO2: Ability to use the advanced technology for measurement and develop innovative
sustained solutions in health care.
PSO3: Ability to examine indigenous clinical gadgets through the application of their core
area ideas and emerging ICTs.
PSO4: Ability to perform effectively as a part of a team with professional behavior and ethics
to achieve a successful career.
4
SYLLABUS
1907306 INSTRUMENTATION LABORATORY L T P C
0 0 4 2
COURSE OBJECTIVES:
To study the characteristics of sensors, signal conditioning circuits and their
applications
To make the students learn about the measurement using sensors and converter
To provide knowledge about the principles involved in LVDT
To make the students aware about the measurement of resistance, capacitance and
inductance using bridge circuits
To make the students familiar with analog to digital and digital to analog converters.
LIST OF EXPERIMENTS:
1. Characteristics of Strain gauges
2. Displacement measurement using LVDT.
3. Characteristics of temperature sensors.
4. Measurement of skin temperature – contact method
5. Measurement of skin temperature – non-contact method
6. Characteristics of Light sensors-Photodiode, Photo Transistor
7. Bridge Circuits for Measurement of Resistance, capacitance and inductance
8. Measurement of Speed & Torque calculation for medical equipment drives.
9. Characteristics of A/D converter.
10. Characteristics of D/A converter.
TOTAL : 60 PERIODS
COURSE OUTCOMES:
At the end of the course, the student will be able to:
Design measurement system for various applications.
Analyze the characteristics of sensors and signal conditioning circuits.
Understand different temperature measurements.
Perform A/D and D/A conversion operation.
Demonstrate measurement using bridge circuits.

5
CONTENTS
S. No NAME OF THE EXPERIMENT Page
No
1 Characteristics of Strain gauges 7
2 Displacement measurement using LVDT. 11
3 Characteristics of temperature sensors. 14
4 Measurement of skin temperature – contact method 24
5 Measurement of skin temperature – non-contact method 27
6 Characteristics of Light sensors-Photodiode, Photo Transistor 29
7 Bridge Circuits for Measurement of Resistance, capacitance and inductance 34
8 Measurement of Speed & Torque calculation for medical equipment drives. 46
9 Characteristics of A/D converter. 51
10 Characteristics of D/A converter. 54
11 Calibration of Ammeter and Voltmeter. (experiment beyond syllabus) 57
6
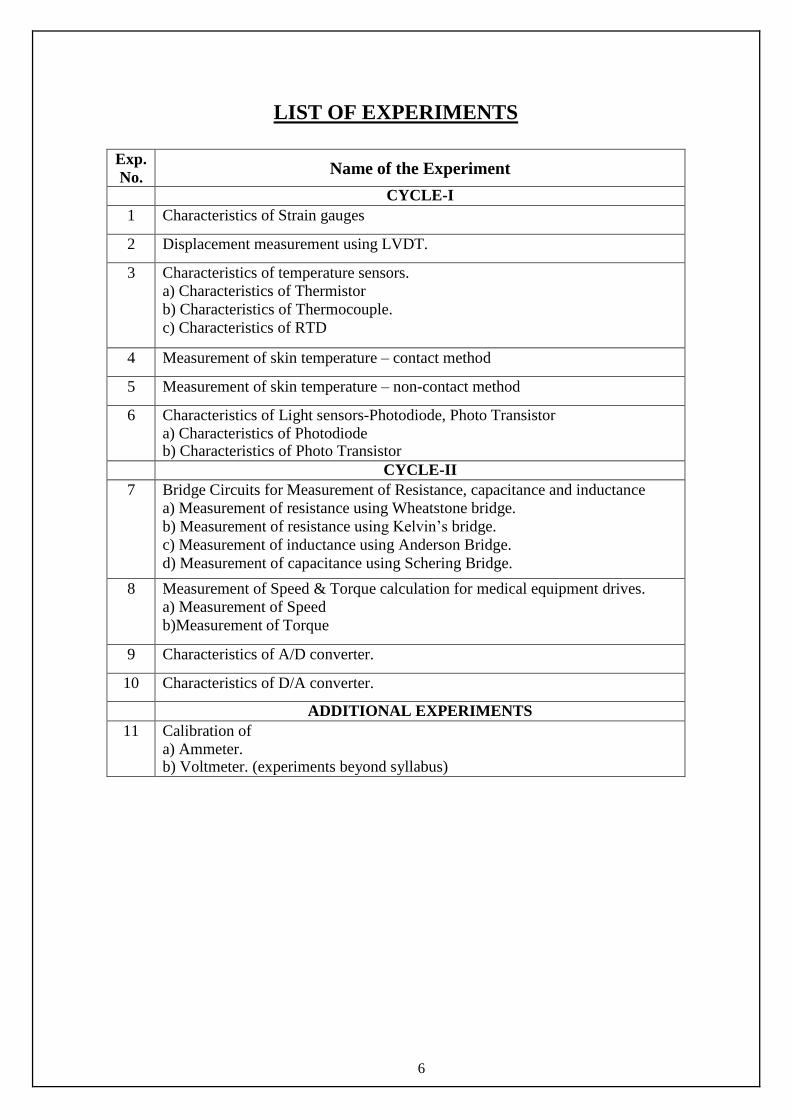
LIST OF EXPERIMENTS
Exp.
No. Name of the Experiment
CYCLE-I
1 Characteristics of Strain gauges
2 Displacement measurement using LVDT.
3 Characteristics of temperature sensors.
a) Characteristics of Thermistor
b) Characteristics of Thermocouple.
c) Characteristics of RTD
4 Measurement of skin temperature – contact method
5 Measurement of skin temperature – non-contact method
6 Characteristics of Light sensors-Photodiode, Photo Transistor
a) Characteristics of Photodiode b) Characteristics of Photo Transistor
CYCLE-II
7 Bridge Circuits for Measurement of Resistance, capacitance and inductance
a) Measurement of resistance using Wheatstone bridge.
b) Measurement of resistance using Kelvin’s bridge.
c) Measurement of inductance using Anderson Bridge.
d) Measurement of capacitance using Schering Bridge.
8 Measurement of Speed & Torque calculation for medical equipment drives.
a) Measurement of Speed
b)Measurement of Torque
9 Characteristics of A/D converter.
10 Characteristics of D/A converter.
ADDITIONAL EXPERIMENTS
11 Calibration of
a) Ammeter. b) Voltmeter. (experiments beyond syllabus)

7
Exp No.:1 CHARACTERISTICS OF STRAIN GAUGE
Date:
Aim:
To study the characteristics of strain gauge.
Apparatus required:
S. No. Components / Equipment Specification Quantity
1. Strain Gauge Kit --- 1
2. Digital Multimeter --- 1
3. Standard weights 100g, 200g & 500g 1,2 & 1
Pre-Lab Exercise:
1. What is the principle employed in measurement using strain gauge?
2. Strain gauge type of sensor.
3. What is meant by gauge factor.
4. What is the difference between active and passive transducer?
5. What are the types of strain gauges?
6. What is Rosettes?
Theory:
If a metal conductor is stretched or compressed, its resistance changes on account of
the fact that both length and diameter of conductor change. Also there is a change in the value
of resistivity of the conductor when it is strained and this property is called piezo resistive
effect. Therefore resistance strain gauge is also known as piezo resistive gauges. The strain
gauges are used for measurement of strain and associated stress in experimental stress
analysis.
The change in the value of resistance by straining the gauge may be partly explained
by the normal dimensional behavior of elastic material. If a strip of elastic material is
subjected to tension or in other words positively strained, its longitudinal dimension will
increase while there will be reduction in the lateral dimension. So, when a gauge is stretched
to a positive strain, its length increases while its area of cross section decreases. Since the
resistance of the conductor is proportional to its length and inversely proportional to its area
of cross section the resistance of the gauge increases with positive strain. The extra change in
the value of resistance is attributed to a change in the value of resistivity of a conductor when
strained.
Let us consider in the case the value of resistance is attributed to a change in the value
of resistivity. Length = L, area = A, diameter = D before strained. The material of the wire
has a resistivity Therefore resistance of a strained gauge R = L/A. Let a tensile stress S be
applied to the wire. This produces a positive strain. The length is to increase and area to
decrease. Let L = change in length, A = change in area, D = change in diameter and R
= change in resistance
dR
ρ . L
ρL . A
L ρ .......................................... (1)
ds A s 𝑑𝑦A2
𝑑𝑥 ρL
s A s
Divide by resistance R , we have A
1 dR
1 . L
1
. A
1 ρ
.........................................(2) R ds L s A s ρ s
It is evident from the equation 2, that the per unit change resistance is due to

8
The equation 12 is valid only for piezo electric effect. The poisson ratio for all metals is
found to be between 0 and 0.5. This gives a gauge factor of approximately 2. The common
values of gauge factor for wire wound strain gauges are:
Material Gauge factor Material Gauge factor
Nickel
Manganin
Nichrome
Constantan
- 12.1
+ 0.47
+ 2.0 + 2.1
Platinum
Carbon
Doped crystals
Soft iron
+ 4.8
+ 20
100 to 5000 + 4.2

9
Module Diagram:
Procedure:
1. Connect the trainer with the load applying column.
2. Connect the multimeter at the output terminal.
3. Switch ON the kit.
4. Initially at no load, zero adjustment has to be done.
5. Gradually increase the load and note down the corresponding output voltage.
Graph: Plot the graph: Strain Vs Load and Output Voltage Vs Load.
Tabular column:
S.No. Load
(g)
Strain
(Ω)
% error Output Voltage
(V) Theoritical Practical
Model graph:

10
Post-Lab Exercise:
1. State piezoreistive effect.
2. What is the importance of gauage factor of a strain gauge?
3. What are the applications of strain gauges?
4. Define Poisson’s ratio.
5. What are the advantages of semiconductor strain gauge?
6. What are the disadvantages of semiconductor strain gauges?
Result:
Thus the characteristics of strain gauge were studied and the graphs were plotted for
different weights.

11
Exp No.:2 DISPLACEMENT MEASUREMENT USING LVDT
Date:
Aim:
To study the operation and characteristics of Linear Variable Differential Transformer
(LVDT) and to perform displacement measurement from it.
Apparatus Required:
S. No. Components / Equipments Specification Quantity
1. LVDT Trainer Kit --- 1
2. Digital Multimeter --- 1
Pre-Lab Exercise:
1. Expand LVDT .
2. What are primary and secondary transducers?
3. Give example for primary and secondary transducer.
4. Is LVDT is (Resistive / Capacitive/ Inductive) transducer.
5. Explain working principle of LVDT.
Theory:
LVDT is the most commonly and extensively used transducer, for linear displacement
measurement. The LVDT consists of three symmetrical spaced coils wound onto an insulated
bobbin. A magnetic core, which moves through the bobbin without contact, provides a path
for the magnetic flux linkage between the coils. The position of the magnetic core controls
the mutual inductance between the primary coil and with the two outside or secondary coils.
When an AC excitation is applied to the primary coil, the voltage is induced in secondary
coils that are wired in a series opposing circuit. When the core is centered between two
secondary coils, the voltage induced in the secondary coils are equal, but out of phase by
180°. The voltage in the two coils cancels and the output voltage will be zero.
Circuit Operation:
The primary is supplied with an alternating voltage of amplitude between 5V to 25V
with a frequency of 50 cycles per sec to 20 K cycles per sec. The two secondary coils are
identical & for a centrally placed core the induced voltage in the secondaries Es1&Es2 are
equal. The secondaries are connected in phase opposition. Initially the net o/p is zero. When
the displacement is zero the core is centrally located. The output is linear with displacement
over a wide range but undergoes a phase shift of 180°. It occurs when the core passes through
the zero displacement position.
Generalized Diagram:

12
Trainer kit Diagram:
Procedure:
1. Connect the multimeter at the output terminal of the LVDT kit.
2. Switch ON the LVDT kit.
3. Move the core to different positions using screw guage and measure the secondary
voltages Es1&Es2
4. Tabulate the readings & calculate the output voltage (E0).
Graph:Plot the graph between core displacement (X-axis) and Output Voltage (Y-axis).

13
Tabular column:
Screw
Guage
Reading
Core displacement
(mm)
LVDT Output
(mV) E0 = (Es1 - Es2)
0 -10
2 -8
4 -6
6 -4
8 -2
10 0
12 2
14 4
16 6
18 8
20 10
Note : -ve Sign indicates the direction of displacement.
Model graph:
Post-Lab Exercise:
1. Explain how LVDT is used for displacement measurement?
2. What are the other applications of LVDT?
3. Why E0= Es1 – Es2 ?
4. What causes residual voltage at null displacement?
5. What are the different types of displacement transducers?
6. What is Null voltage?
7. What are the advantages of LVDT?
Result:
Thus the operation and characteristics of LVDT was studied and its characteristic is
plotted.

14
Exp No.:3(a) CHARACTERISTICS OF THERMISTOR
Date:
Aim:
To determine the characteristics of thermistor.
Apparatus Required:
S. No. Components / Equipments Specification Quantity
1. Thermistors --- 1
2. Digital Multimeter --- 1
3. Thermometer Max. 100 °C 1
4. Water Bath --- 1
Pre-Lab Exercise:
1. What is thermistor?
2. Name the different temperature transducers.
3. Give naming convention of thermistor.
4. What are the materials used for constructing thermistor?
5. What is meant by temperature coefficient of resistance?
Theory:
Thermistors are semiconductors with high negative temperature coefficient of
resistance. The high sensitivity of the thermistor makes it useful for precision temperature
measurement. Oxides of titanium and nickel are among the materials used. They are very
sensitive with temperature coefficients that range from -2 to -6Ω /°C. They are capable of
detecting minute changes in temperature. Their resistance at 25°C ranges from 100 to
100K with 5000 being a very common value. Their linearity is the poorest of those of
all temperature sensors. The usual range of thermistors is from -200°C to 1000°C. A single
thermistor cannot be used over such a large range.
For Thermistor
RT = R0 e [ (1 / T ) - ( 1 / T0 ) ]
RT - Resistance of thermistor at T deg K
R0 - Resistance at room temperature
- Thermistor constant

15
Circuit Diagram:
Experiment setup:
Procedure:
1. Immerse the thermistor & thermometer into the water bath.
2. Connect the leads from the thermistor to the multimeter.
3. Switch ON the water bath.
4. Measure the temperature using the thermometer of water and the corresponding resistance
of thermistor using multimeter.
5. For every 5 °C rise, the reading on the thermistor and thermometer are noted until the
temperature reaches the max. temperature(100 °C).
Graph: Plot the graph between Temperature (X-axis) and Output Resistance (Y-axis).

16
Tabular Column:
S.No. Temperature
(C)
Output Resistance
(k)
Model graph:
Post-Lab Exercise:
1. What is the temperature range of thermistor?
2. Is temperature coefficient of resistance is positive or negative for thermistor? Justify your
answer.
3. What is the difference between RTD and thermistor?
4. What about resolution and sensitivity of thermistor?
5. What are the advantages of thermister over other temperature transducers?
6. What are the applications of thermistor?
Result:
Thus the characteristics of thermistor is determined and the graph is plotted.

17
Exp No.:3(b) CHARACTERISTICS OF THERMOCOUPLE
Date:
Aim:
To study the characteristics of Thermocouple.
Apparatus Required:
S. No. Components / Equipments Specification Quantity
1. Thermocouple --- 1
2. Digital Multimeter --- 1
3. Thermometer Max. 100°C 1
4. Water Bath --- 1
Pre-Lab Exercise:
1. State the principle employed in thermocouple.
2. Is thermocouple is active or passive transducer? Justify your answer.
3. What are the materials used for fabricating thermocouple?
4. What are the different types of thermocouples?
5. What is the function of signal conditioning circuit?
Theory:
Thermocouple is a temperature transducer based on seebeck effect. It is the most
common and widely used single device for temperature measurement in industrial
applications. Its measurements cover the temperature range of 0°F to 4000°F. Thermocouple
is a self-generating transducer and it has a pair of dissimilar metallic conductors .If this
dissimilar metallic conductor are connected in a circuit with one junction at T1 and the other
at T2, an emf is developed due to difference in temperature. The relation between E, T1 and
T2 is called the Seebeck effect. Commonly used materials in the thermocouple are Platinum,
Rhodium, Chromel, Alumel, Copper–Constantan and Iron–Constantan. The range of
chromel• constantan is 700 to 1200 °C.
The cold junction of thermocouple is taken as the reference junction and its
temperature is kept constant. The hot junction is kept at the place where temperature is to
be measured. In lab, it is possible to keep the temperature of cold junction constant but
in industries it is not possible. So the variation in thermos emf of thermocouple due to
variation in cold junction temperature is to be compensated for exact temperature
measurement. Here the compensation is made using Wheatstone bridge in which RTD is
placed at one of its arms. Thermocouple output is connected to the non-inverting terminal of
operational amplifier. The gain of the amplifier is set to be 10. The bridge excitation comes
from a separate D.C. Supply. Finally about 50mV of excitation is made available to the
bridge. As the ambient temperature goes changing, the RTD’s resistance also changes
and small output voltage is developed across the bridge. The bridge output is fed to the
inverting input of the amplifier. With higher ambient temperature thermocouple
transducer tends to produce lower output voltage.
The RTD bridge circuit automatically takes care of this tendency of the thermocouple
by applying a small voltage of proper polarity to the inverting terminal of the amplifier. That
is how cold junction compensation is achieved. Condenser connected across the terminals of
IC suppresses any unwanted disturbances coming to amplifier. The output of operational
amplifier is connected to a pot (MAX.) on the panel and is useful for carrying out the
calibration operation. Offset Null Pot is useful for zero adjustment.

18
Block Diagram:
Experiment Setup:
Procedure:
1. Immerse the thermocouple & thermometer into the water bath.
2. Connect the leads from the thermocouple to the respective meter.
3. Switch ON the water bath.
4. Measure the temperature of water using thermometer and the corresponding output
voltage of thermocouple using multimeter.
5. For every 5°C rise, the reading of the thermocouple are noted until the temp reaches
the maximum temperature (100 °C).Tabulate the readings.
Graph: Plot the graph between temperature (X-axis) and thermocouple Output voltage (Y-
axis).

19
Tabular column:
S.
No.
Thermometer
Reading (C)
Thermocouple
Output voltage
(mV)
Model Graph:
Post-Lab Exercise:
1. What is the temperature range of thermocouple?
2. Thermocouple is suitable for range of temperature measurement.
3. Why cold junction compensation is needed?
4. Why signal conditioning circuit is needed at the output of thermocouple?
5. State the industrial applications of Thermocouples.
6. What are the advantages and disadvantages of thermocouple?
7. Compare the performance of thermister with thermocouple.
Result:
Thus the characteristics of thermocouple is studied and its characteristic curve is
plotted.

20
Exp No.:3(c) CHARACTERISTICS OF RTD
Date:
Aim:
To analyse characteristics of Resistance Temperature Detector (RTD).
Apparatus Required:
S. No. Components / Equipments Specification Quantity
1. RTD PT100 1
2. Digital Multimeter --- 1
3. Thermometer Max. 100 C 1
4. Water Bath --- 1
5. Stop Clock --- 1
Pre-Lab Exercise:
1. Expand RTD
2. What is the principle of RTD?
3. What are the requirements of a conductor to be used in RTD?
4. RTD has temperature coefficient.
5. What are the materials used for constructing RTD?
6. RTD is suitable for temperature measurement application.
Theory:
The principle of operation of RTD is based on the fact that electrical resistance of
many metals increases almost directly to the temperature and gives high degree of accuracy.
These characteristics are well known as Co-efficient of resistance and is defined by the
approximate formula Rt =Ro (1+ t) Where, - Temperature Co-efficient of resistance and Ro. - Resistance of wire at 0c.
RTD is connected to one of the arms of a bridge circuit. The other two arms are
connected by constant resistance. An adjustment and a fixed resistance are attached to the
adjacent arm of the bridge. When the RTD is at 0°C the helical potentiometer is set to 0
position by adjusting the MIN control on the panel. The bridge output is given to the meter
which also initially indicates zero. The resistance of the RTD changes due to the temperature
change. The resistance of the adjacent arm is changed by the introduction of corresponding
amount of known resistance until balance is achieved. The change in the resistance of RTD
can be measured by noting the revolution of the helical pot.
Generalized Diagram:

21
3- Wire RTD configuration:
In order to minimize the effects of the lead resistances, a three-wire configuration can
be used. Using this method the two leads to the sensor are on adjoining arms. There is a lead
resistance in each arm of the bridge so that the resistance is cancelled out, so long as the two
lead resistances are accurately the same.
In a three-wire circuit two constant current sources are used, in order to compensate
for the disadvantages described above for the two-wire circuits. Similar to the two-wire
circuit the current source IK2 is used to measure the temperature dependent resistance RT
including the lead and terminal contact resistances. The additional current source IK1
together with a third lead is used to separately compensate the lead and terminal contact
resistances. Assuming the exact same lead and terminal contact resistances for all three leads,
the effect on the accuracy of the temperature measurements can be eliminated. But practice
has shown that it is not always possible to assure that the terminal contact resistances are
always identical.
3-Wire RTD Sensor using Bridge Circuit:
4- Wire RTD Configuration:
The four-wire resistance thermometer configuration increases the accuracy and
reliability of the resistance being measured: the resistance error due to lead wire resistance
is zero. In the diagram above a standard two-terminal RTD is used with another pair of
wires to form an additional loop that cancels out the lead resistance. The above wheatstone
bridge method uses a little more copper wire and is not a perfect solution. Below is a better
configuration, four wire kelvin connection. It provides full cancellation of spurious effects;
cable resistance of up to 15 Ω can be handled. With the 4-wire configuration, the instrument
will pass a constant current (I) through the outer leads, 1 and 4. The voltage drop is
measured across the inner leads, 2 and 3. So from V = IR we learn the resistance of the
element alone, with no effect from the lead wire resistance. This offers an advantage over 3-
wire configurations only if dissimilar lead wires are used, and this is rarely the case.
4- Wire RTD sensor using Bridge Circuit:

22
Experiment setup:
Procedure:
1. Connect the leads from the RTD to the respective meter.
2. The water bath heater is switched ON.
3. Immerse the RTD in water bath .when the water temperature rises note the resistance of
RTD for the corresponding temperature
4. Start the stop clock and tabulate the resistance of RTD for every 5 seconds.
Graph: Draw the graph between temperature (X – axis) and RTD resistance in ohms(Y –
axis).
Tabular Column:
S.No. Temperature
C RTD Resistance
( Ohms)

23
Model Graph:
Post-Lab Exercise:
1. What is meant by pt-100?
2. RTD has temperature coefficient.
3. What are the limitations of RTD?
4. What are the advantages of RTD over thermocouple?
5. How error due to lead resistance is corrected in RTD?
6. What are advantages of four wire RTD over three wire RTD ?
7. State the industrial applications of RTD.
8. Compare the performance of thermistor, thermocouple and RTD.
Result:
Thus the characteristics of RTD is analyzed and its characteristic curve is drawn.

24
Exp No.:4 MEASUREMENT OF SKIN TEMPERATURE – CONTACT METHOD
Date:
Aim:
To measure temperature of the skin using the contact method and also to determine
the average skin temperature of human.
Apparatus Required:
Mercury Thermometer
Electronic Thermometer
Pre-Lab Exercise:
1. What is the normal skin temperature of human?
2. List the contact type thermometers.
3. How filled in system thermometer works?
4. What is the disadvantage of mercury filled thermometer?
5. Which is the most commonly used thermometer?
Theory:
Thermometer can be used to check the body temperature to see whether a person has
a fever. There are two ways to measure body temperature that is by measuring core
temperature and surface temperature.
Core temperature measurement means, measurement of temperature in deep tissues
such as oral cavity, ear canal, and rectum.
Surface temperature measurement means, measurement of temperature in surface skin
tissues such as forehead and armpit.
Since surface temperature is more susceptible to changes in the surroundings, it is
considered less accurate and is recommended for use only when there is difficulty in
measuring the core temperature.
Mercury-in-glass/ Alcohol-in-glass Thermometer
Thermal expansion property of mercury / alcohol is used for skin temperature
measurement. These thermometers can be used to measure oral, rectal or armpit body
temperature through the thermal expansion of mercury/ ethanol.
As mercury spill is hazardous to environment and health, the use of mercury thermometer
should be avoided as far as possible.
The tips of oral thermometer and rectal thermometer are different in shape (slender vs. round)
and must not be cross-used.

25
Electronic (digital) Thermometer
Measures oral, rectal or armpit body temperature by means of thermistor with its resistance
varying according to the temperature. Temperature difference among oral, rectal and armpit
body temperature should be noted.
Proper Use of Thermometer:
1. Compare the accuracy, suitability, convenience and price of thermometers before purchase.
2. Choose a thermometer and method of measurement which suit the individual‘s age and
health condition; Consult healthcare professionals if in doubt.
3. Patients with communicable diseases should use personal thermometers to avoid cross-
infection.
4. Familiarize with the correct use of thermometer and temperature reading by referring to the
user instructions provided by manufacturer.
5. Avoid activities that would distort temperature measurement (e.g. drinking hot water
immediately before taking oral temperature).
6. Clean and maintain the thermometer according to the procedures recommended by the user
instructions.
7. In case body temperature needs to be taken regularly, take the temperature at the same time
of each day and use the same temperature taking method to allow comparison.
8. If there is any doubt about the body temperature reading, please consult healthcare
professionals.
Measurement Methods and Specific Precautions:

26
Comparison Among Different Measurement Methods:
Procedure:
Mercury-in-glass/ Alcohol-in-glass Thermometer
1. Thermometer should be reset by shaking the mercury/ ethanol level down below 35°C
(95°F) each time before using.
2. Place thermometer at oral, rectal or armpit for a while and note down the temperature.
Electronic (digital) Thermometer
Temperature difference among oral, rectal and armpit body temperature should be noted.
Tabular Column:
S.No. Name of Person Temperature (°C)
Oral Armpit
Average Body Temperature of
Human
Post-Lab Exercise:
1. How body temperature is measured?
2. Why surface skin tissue temperature measurement alone is not sufficient to determine
body temperature?
3. What are the components needed in fabricating electronic thermometer?
4. What is the principle employed in electronic thermometers?
5. Mention the precautions to be considered in oral and armpit method.
6. Is forehead method suitable for contact method? Justify your answer.
7. What are the recommended methods for contact type body temperature measurement?
Result:
Thus the skin temperature and also the average skin temperature of human is measured
using contact method of measurement.

27
Exp No.:5 MEASUREMENT OF SKIN TEMPERATURE – NON-CONTACT METHOD
Date:
Aim:
To measure temperature of the skin without contact using fiber optic temperature
sensor (Infrared Thermometer) and to compare it with contact method.
Apparatus Required:
Fibre optic temperature measurement unit
Mercury thermometer or Electronic thermometer
Pre-Lab Exercise
1. What are the measuring methods used for non-contact method?
2. Is non-contact method is accurate?
3. What is the purpose of non-contact method of temperature measurement?
4. What is the advantage of non-contact method?
5. What is meant by refractive index?
Theory:
Non-contact infrared temperature sensors measures thermal radiation (infrared)
emitted from ear and forehead to infer body temperature
For ear thermometer, a new ear-probe jacket should be used for different person; the
ear canal must be pulled straight when measuring.
Forehead thermometer should only be used for screening instead of diagnostic purpose due to
greater measurement error.
Fibre optic temperature sensor consists of fibre optic assembly, infrared detector and
electronic console. Thermal radiation emitted from human body falls in IR spectrum. This
radiation proportional to temperature is introduced along optical fibre. As fibres sensitive
only to IR portion of the spectrum, single or several fibres gathers the IR radiation from hot
skin surface. Infrared detector converts detected IR signal radiated from skin into voltage and
is calibrated to temperature scale using electronic consoie

28
Fiber optic temperature sensor using Phase interference:
Procedure:
1. Note temperature measured using non-contact method for different persons
2. Note temperature measured using contact method for the same set of persons
3. Compute the error in non-contact method with reference to contact method.
Tabular Column:
S.No. Observed Temperature (0C) Error in
Temperaure
(0C) Non-contact
method
Contact method
Post-Lab Exercise
1. What is the principle of fiber optic sensor?
2. Write the advantages of fiber optic sensor.
3. What are the elements present in non-contact fibre optic temperature sensor?
4. Radiation from hot human body falls in --------- spectrum.
5. How fiber optic helps in effectively sensing human temperature?
6. What is the function of IR detector and electronic console?
Result:
Thus the measurement of temperature of skin is done using non-contact method and it
is compared with contact method.

29
Exp No.:6(a) CHARACTERISTICS OF PHOTODIODE
Date:
Aim:
To determine the characteristics of photodiode.
Apparatus Required:
S. No. Components / Equipments Specification Quantity
1. Ammeter (0-25) mA 1
2. Voltmeter (0-30) V 1
3. Power Supply (0-30)V 1
4. Light source Few Watts 1
5. Resistors 1KΩ 1
6. Photodiode IPL 34C 1
7. Bread Board --- 1
8. Connecting wires --- Few
Pre-Lab Exercise:
1. What is the difference between ordinary diode and photo diode?
2. Why it is called as photo diode?
3. State the principle of ”Photo conductive effect”.
4. What are the materials used for fabricating photodiode?
Theory:
Both Photo diode and Photo transistor operates based on the principle of ” Photo
conductive effect”. When radiation is incident on a semiconductor, it absorbs some light, as a
result its conductivity varies directly with the intensity of light and its resistances varies
inversely with the intensity of light. This effect is called as Photo conductive effect.
Photo diode:
It is a semiconductor PN-junction device whose region of operation is limited to the
reverse biased region. Photo diode is connected in reverse biased condition .The depletion
region width is large under normal condition, it carries small reverse current due to the
minority charge carriers in μA. If the Photo diode is forward biased, the current flowing
through it is in mA. The applied forward biased voltage takes the control of the current
instead of the light. The change in current due to light is negligible and cannot be noticed.
The resistances of forward biased diode are not affected by the light. Hence to have
significant effect of light on the current and to operate photo diode as a variable resistor, it is
always operated (or) connected in reverse bias. When there is no light, it is called as dark
current because there is no current flow due to infinite résistance. When there is a light, more
current flows doe to very less resistance. Under reverse bias current control due to light only
instead of applied voltage.
Photodiode is used in cameras, medical devices, safety equipment, optical
communication devices, position sensors, bar code scanners, automotive devices and
surveying instruments

30
Symbol of Photodiode:
Circuit Diagram:
Procedure:
1. Connections are given as per the circuit diagram.
2. Place the photo diode at a particular distance from the illumination.
3. Voltage is varied using R.P.S insteps of 1V and corresponding current is noted.
4. Readings are tabulated for various distances and the graph is drawn between voltage and
current
Tabular Column:
D1 = (cm) D2 = (cm)
VR (V) IR (mA) VR (V) IR (mA)
Model Graph:

31
Post-Lab Exercise:
1. How photodiode works?
2. What is the function of the photodiode?
3. Why the Photo diode is always operated in reverse bias?
4. Define dark current in photodiode.
5. State the applications of photodiode.
Result:
Thus the characteristics of photodiode is determined and the graph is plotted for various
distances of light source.

32
Exp No.:6(b) CHARACTERISTICS OF PHOTO TRANSISTOR
Date:
Aim:
To determine the characteristics of photo transistor.
Apparatus Required:
S. No. Components / Equipments Specification Quantity
1. Ammeter (0-50) mA 1
2. Voltmeter (0-30) V 1
3. Power Supply (0-30)V 1
4. Light source Few Watts 1
5. Resistors 1KΩ 1
6. Photo transistor L14G3 1
7. Bread Board --- 1
8. Connecting wires --- Few
Pre-Lab Exercise:
1. State the principle of ”Photo conductive effect”.
2. What is the difference between photodiode and phototransistor?
3. What is the difference between ordinary transistor and photo transistor?
4. Why it is called as photo transistor ?
5. What are the materials used for fabricating phototransistor?
Theory:
Both Photo diode and Photo transistor operates based on the principle of” Photo
conductive effect”. When radiation is incident on a semiconductor, it absorbs some light, as
a result its conductivity varies directly with the intensity of light and its resistances varies
inversely with the intensity of light. This effect is called as Photo conductive effect.
The photo transistor has a light sensitive collector to base junction .A lens is used in
transistor package to expose to an incident ligh. When no light is incident, a small leakage
current flow from collector to emitter called ICEO , due to small thermal generation .This is
very small current, of the order of nA this is called a dark current.
When the base is exposed to the light, the base current is produced which is proportional
to the light intensity. As light intensity increases, the base current increases exponentially.
Similarly the collector current also increases corresponding to the increase in the light
intensity.
Photo transistor can be both a two lead (and) three lead devices. For two lead devices,
the base is not electrically available and the device use is totally light dependent
Photo transistor Terminal Convention:

33
Circuit Diagram:
Procedure:
1. Connections are given as per the circuit diagram.
2. Phototransistor is placed at a particular distance from the illumination.
3. Voltage is varied using RPS in steps of 1 volts and corresponding current is noted.
4. Readings are tabulated for various distances and the graph is drawn between voltage and
current
Tabular Column:
S.No. Voltage (V)
Photo Current (mA)
D1 = (cm) D2 = (cm)
Model Graph:
Post-Lab Exercise:
1. What is the difference between photodiode and phototransistor?
2. How many terminals are there in phototransistor?
3. How phototransistor works?
4. How phototransistor is fabricated?
5. State the applications of phototransistor.
Result:
Thus the characteristics of photo transistor is determined and the graph is plotted for
various distances.

34
1 3
Exp No.:7(a) MEASUREMENT OF RESISTANCE USING WHEATSTONE’S BRIDGE
Date:
Aim:
To measure the value of unknown resistance in the medium resistance range using
Wheatstone’s Bridge.
Apparatus Required:
S. No. Components / Equipments Specification Quantity
1. Resistors 1KΩ 2
2. Unknown Resistors Different value 4
3. Decade Resistance Box --- 1
4. Power Supply 0-30V 1
5. Digital Multimeter --- 1
6. Bread Board --- 1
7. Connecting wires --- Few
Pre-Lab Exercise:
1. What are called resistance bridges?
2. Name the bridge used for medium range and high range of resistance measurement.
3. How unknown resistance can be measured using Wheatstone bridge?
4. What is called as decade resistance box?
5. When the bridge is said to be balanced?
Theory:
The medium range of resistance is from 1KΩ to some mega ohms. The wheatstone
bridge operates upon null indication principle. This means the indication is independent of
the calibration of the null indicating instrument or any of its characteristics. For this reason,
very high degree of accuracy can be achieved using Wheatstone bridge. Accuracy of 0.1% is
quite common with a wheatstone bridge as opposed to accuracies of 3% to 5% with ordinary
ohmmeter for measurement of medium resistances. The bridge has 4 resistance arms,
consisting of resistances R1, R2, R3 and Rx together with a source of emf and a null detector
usually a galvanometer G or other sensitive current meter. The current through the
galvanometer depends on the potential difference between the points B and D. the bridge is
said to be balanced when there is no current through the galvanometer or when the potential
difference across the galvanometer is zero.
For bridge balance, I1R1 I2 R2 (1)
For the galvanometer current to be zero, the following condition also exists:
I I E
R1 R2
(2)
I2 I4 E
Rx R2
(3)
E = emf of the battery.
Combining equations (1), (2) and (3) and simplifying, we obtain R1
R1 R2
R
X (4) RX R3
From which, R2 RX R1R3 (5)

35
Equation (5) is the well known expression for the balance of Wheatstone bridge. If three of
the resistances are known, the fourth may be determined from equation (5)
R R R1
X 3
2
Where Rx is the unknown resistance R3 is called the ‘standard arm’ of the bridge and R1 and
R2 are called the ‘ratio arms.
Circuit Diagram:
Formulae:
% Error Measured Value True Value
100
True Value
R R R
1
X 3
2
Procedure:
1. Connections are given as per the circuit diagram.
2. Supply is switched ON.
3. Check the zero balance initial condition.
4. When the unknown resistance Rxis connected, the bridge becomes unbalanced.
5. The bridge is balanced by varying the DRB (R3).
6. The value of unknown resistance is calculated by the given formulae.
7. The above steps are repeated for different value of unknown resistances.
8. Calculate the % error using the given formula.
Tabular Column:
S. No Resistance R3 (k)
Unknown Resistance Rx
% error True (k) Measured(k)
R
R

36
Post-Lab Exercise:
1. What are the applications of Wheatstone bridge?
2. What are standard arm and ratio arm in wheat stone bridge?
3. What is the relationship among the resistors under balanced condition?
4. What are the detectors used for DC bridges?
5. What do you meant by sensitivity?
6. What is the relationship between sensitivity and accuracy of Wheatstone bridge?
7. Why Wheatstone bridge is not suitable for low resistance measurement?
Result:
Thus the Wheatstone bridge is constructed and the unknown resistors were
determined.

37
Exp No.:7(b) MEASUREMENT OF RESISTANCE USING KELVIN’S DOUBLE BRIDGE
Date:
Aim:
To find the unknown value of low resistance using Kelvin’s Double Bridge.
Apparatus Required:
S. No. Components / Equipments Specification Quantity
1. Resistors 1K 4
2. Unknown Resistors Different value 4
3. Decade Resistance Box --- 1
4. Power Supply --- 1
5. Digital Multimeter --- 1
6. Bread Board --- 1
7. Connecting wires --- Few
Pre-Lab Exercise:
1. What are the methods of measuring low resistance?
2. Why this bridge is called Kelvin’s double bridge?
3. Kelvin’s double bridge is suitable for ---------------- resistance measurement.
4. Kelvin’s double bridge is the modified form of --------------------
Theory:
Kelvin’s double bridge is a modification of Kelvin’s bridge and provides more
accuracy in measurement of low resistances. It incorporates two sets of ratio arms and the use
of four terminal resistors for the low resistance arms, as shown in circuit diagram.
Rx is the resistance under test and S is the resistor of the same higher current rating
than one under test. Two resistances Rx and S are connected in series with a short link of as
low value of resistance r as possible. P, Q, p, q are four known non inductive resistances, one
pair of each (P and p, Q and q) are variable. A sensitive galvanometer G is connected across
dividing points PQ and pq . The ratio P/Q is kept the same as p/q , these ratios have been
varied until the galvanometer reads zero.
Balance Equation:

38
Circuit Diagram:
Formulae used:
% Error Measured Value True Value
100
True Value
Procedure:
1. Connections are given as per the circuit diagram.
2. Switched ON the supply.
3. Check the initial zero balance condition.
4. The bridge becomes unbalanced when unknown resistance Rx is connected.
5. The bridge is balanced by varying standard resistance.
6. Unknown resistance Rx is calculated using balance equation.
7. The above steps are repeated for various values of unknown resistance Rx.
Tabular Column:
S.No
P ()
Q ()
S () Unknown Resistance Rx () % Error
True Measured

39
Model Calculation:
Post-Lab Exercise:
1. What are the advantages of kelvin’s double bridge?
2. What are the limitations of kelvin’s double bridge?
3. Explain how Kelvin’s double bridge can be used for measuring low resistance?
4. What is the advantage of Kelvin’s double bridge over Wheatstone’s bridge?
5. Derive the balance equation of Kelvin’s double bridge.
Result:
Thus the given unknown resistors value is measured using Kelvin’s double bridge.

40
Exp No.:7(c) MEASUREMENT OF SELF INDUCTANCE USING ANDERSON’S BRIDGE
Date:
Aim:
To measure the unknown self-inductance of the coil using Anderson’s Bridge.
Apparatus Required:
S. No. Components / Equipments Specification Quantity
1. Resistors 1K,1K,560,5.6K Each one
2. Unknown Resistors Different value 4
3. Decade Inductance Box --- 1
4. Digital Multimeter --- 1
5. CRO 30 MHz 1
6. Bread Board --- 1
7. Connecting wires --- Few
Pre-Lab Exercise:
1. Name the bridges used for inductance measurement.
2. Is Anderson’s bridge is AC or DC bridge?
3. What are the detectors used in AC bridges?
4. input must be given to Anderson’s bridge.
Theory:
The unknown inductance can be measured using the Anderson’s bridge trainer. To
measure any other value of inductance, the resistance r & r1 have to be correspondingly
changed either by increasing or decreasing the resistance. The resistance in any of the arms of
the bridge is increased by externally connecting some resistance in series or decreased by
connecting in parallel for which the provision has been given in the trainer. The bridge
consists of a built in power supply, 1 kHz oscillator & a detector.
Balance Equations:
Let L1=self-inductance to be measured
R1=resistance of self-inductor r1=resistance connected in series with self-inductor
R, R2, R3, R4 = known non-inductive resistances
C=fixed standard capacitor
At balance I1=I3 and I2=Ic+I4
I1R3 Ic1
jωC Ic I1 jωCR3
Writing the other balance equations
Substituting the value of Ic in the above equations, we have
I1 r1 R1 jLω1 I2 R2 I1 jωCR3.r or I1 r1 R1 jLω1 jωCR3 I2 R2
(1)

41
𝑗𝜔𝐶𝑅3 𝐼1 ( r +
1
𝑗𝜔𝐶) = I2 I1 jωCR3 R4 or I1 jωCR3r jωR3R4 R3 I2R2 (2)
From equations (1) and (2), we obtain
Equating the real and imaginary parts
Circuit Diagram:
Phasor Diagram:
Formula used:
% Error Measured Value True Value
100
True Value
𝐿1 = 𝐶 𝑅3
[𝑅(𝑅4 + 𝑅2) + 𝑅2𝑅4] 𝑅1 = 𝑅2𝑅3
− 𝑟1 𝑅4 𝑅4

42
Procedure: 1. Switch on the trainer & connect the unknown inductance in the arm marked R1.
2. Connect the CRO between the ground & the output point and check for the balance
condition.
3. Observe the sine wave at the secondary of the isolation transformer by using CRO. 4. Vary the resistance R from minimum position in a clockwise direction.
5. For further fine balance vary the resistance r1 which will compensate for the resistive
Component of the inductor. 6. Remove the wiring and measure the values of R and r1 using DMM. 7. The above steps (3, 4, 5&6) are repeated for different values of unknown inductance.
Tabular Column:
S.
No
R()
r1
()
R2()
R3()
R4()
R1()
Q ωL1
R1
L1(mH) %Error True Measured
Model Calculation:
Post-Lab Exercise:
1. What do you mean by Q-factor? What is its significance?
2. What are the other bridges used to measure inductance?
3. State the merits and demerits of Anderson’s bridge?
4. What will happen to the measured inductance value if frequency of the input is not
maintained constant?
5. What are the limitations of Anderson Bridge?
Result:
Thus the unknown inductance of the coil is measured using Anderson’s Bridge.

43
Exp No.:7(d) MEASUREMENT OF CAPACITANCE USING SCHERING’S BRIDGE
Date:
Aim:
factor.
To measure the value of unknown capacitance using Schering’s bridge& dissipation
Apparatus required:
S. No. Components / Equipments Specification Quantity
1. Resistors 1K,1K,560,5.6K Each one
2. Decade Resistance Box
3. Decade Conductance Box --- 1
4. Digital Multimeter --- 1
5. CRO --- 1
6. Bread board --- 1
7. Connecting wires --- Few
Pre-Lab Exercise:
1. Name the bridges used for capacitance measurement.
2. Why Schering’s Bridge is called as AC bridge?
3. State the two conditions for balancing an AC bridge?
4. What kind of input should be applied to Schering’s Bridge?
Theory:
In this bridge the arm BC consists of a parallel combination of resistor & a Capacitor
and the arm AC contains capacitor. The arm BD consists of a set of resistors varying from 1
to 1 M. In the arm AD the unknown capacitance is connected. The bridge consists of a built
in power supply, 1 kHz oscillator and a detector.
Balance Equations: Let C1=Capacitor whose capacitance is to be measured.
R1= a series resistance representing the loss in the capacitor C1.
C2= a standard capacitor. R3= a non-inductive resistance.
C4= a variable capacitor. R4= a variable non-inductive resistance in parallel with variable capacitor C4.
At balance,
Equating the real and imaginary terms, we obtain
44
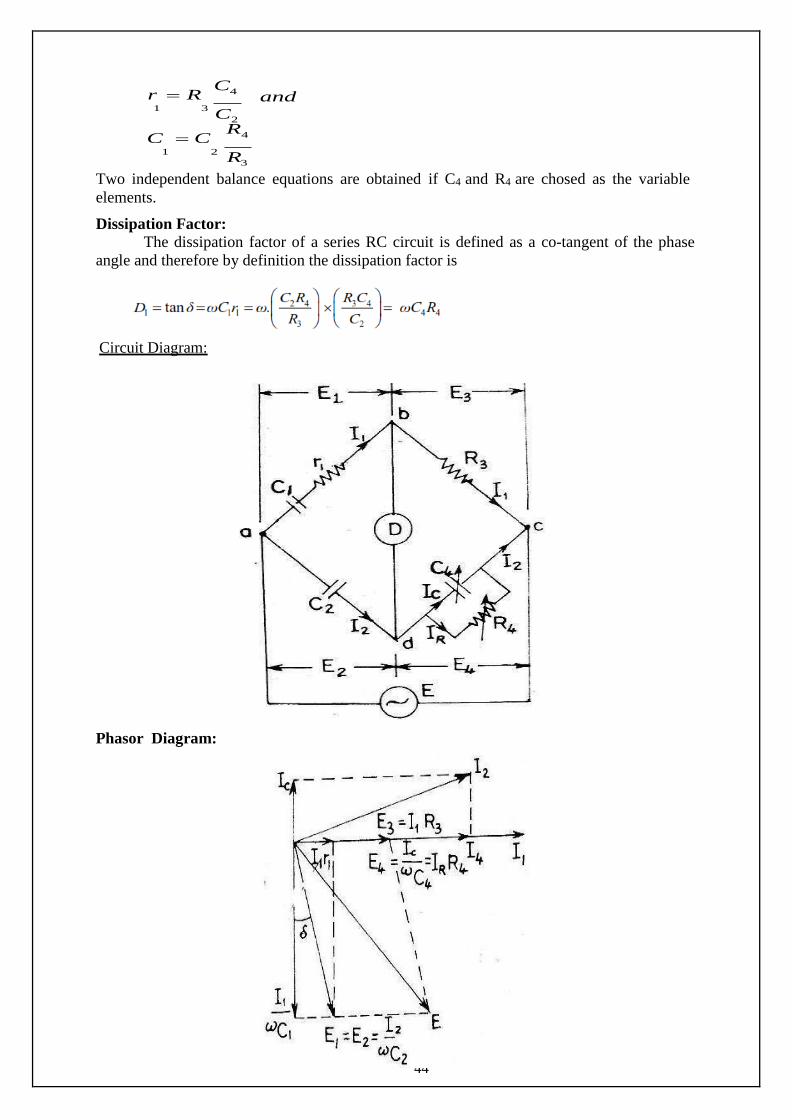
r R C
4 and
1 3
2
C C R
4
1 2
3
Two independent balance equations are obtained if C4 and R4 are chosed as the variable
elements.
Dissipation Factor:
The dissipation factor of a series RC circuit is defined as a co-tangent of the phase
angle and therefore by definition the dissipation factor is
Circuit Diagram:
Phasor Diagram:
C
R

45
Formulae Used:
% Error Measured Value True Value
100
True Value
where C4=Cx& R4=Rx
Procedure:
1. Switch on the trainer board and connect the unknown in the arm marked Cx.
2. Observe the sine wave at the output of oscillator and patch the ckt by using the wiring
diagram.
3. Observe the sine wave at secondary of isolation transformer on CRO. Select some value
of R2. 4. Connect the CRO between ground and the output point of imbalance amplifier.
5. Vary R1( 500 ohms potentiometer ) from minimum position in the clockwise direction.
6. If the selection of R2 is correct, the balance point (DC line) can be observed on CRO.
(That is at balance the output waveform comes to a minimum voltage for a particular
value of R1 and then increases by varying R1 in the same clockwise direction). If that is
not the case, select another value of R2.
7. Capacitor C1 is also varied for fine balance adjustment. The balance of the bridge can be
observed by using loud speaker.
8. Connect the loud speaker at the output of the detector. Alternatively adjust R1 and proper
selection of R2 for a minimum sound in the loud speaker. 9. Tabulate the readings and calculate the unknown capacitance and dissipation factor.
Tabular Column:
S.No.
C1(pF)
C3(F)
R1()
R2()
Rx()
Cx(F)
Dissipation
factor (D1) True
value
Measured
Value
Model Calculation:
Post-Lab Exercise:
1. Explain how Schering’s Bridge is used for measuring capacitance?
2. What do you mean by dissipation factor?
3. Give the relationship between Q and D.
4. Derive the balance equations.
5. What are the limitations of Schering’s bridge?
Result:
Thus the unknown capacitance & dissipation factor were measured using
Schering’s Bridge.

46
Exp No.:8(a) MEASUREMENT OF SPEED USING PHOTOELECTRIC TACHOMETER
Date:
Aim:
To determine the speed of motor using photoelectric tachometer and also to study the
characteristics of tachometer.
Apparatus Required:
S. No. Components / Equipments Specification Quantity
1. Tachometer --- 1
2. DC Motor --- 1
Pre-Lab Exercise:
1. What are the elements involved in photoelectric transducer?
2. How photoelectric transducer works?
3. State the different types of photoelectric transducer.
4. What is meant by tachometer?
5. Rotational speed is measured using-------------
6. What is RPM?
Theory:
A tachometer is an instrument measuring the rotation speed of a shaft or disk, as in a
motor or other machine. The device usually displays the revolutions per minute (RPM) on
digital display.
This is a device that produces a voltage proportional to the speed of a rotating shaft. Common
examples include the rev' counter found in many vehicles. This measures the rotation of the
engine crank shaft. The speedometer in vehicles measures the wheel rotation speed. Wind
speed gauges use a similar system. Here is a convenient way to detect the rotation of a shaft.
As the notched wheel rotates, the light beam is interrupted. This appears as a small
square(ish) wave output from the photodiode. When the shaft rotates faster, more pulses are
produced but the pulses are also shorter. This means that the average output remains constant.
To make a useful measuring device, the variable length pulses from the photodiode need to
be converted into fixed length pulses. A monostable circuit achieves this. The monostable
needs to be triggered by short pulses
Generalized Diagram:

47
Procedure:
1. Switch ON the DC motor.
2. Keep the photoelectric tachometer against the shaft of the DC motor and note down
the speed (RPM) of the disc, which displays on tachometer display.
3. Repeat the same for different speeds by varying the DC motor supply.
Tabular column:
DC motor
supply
voltage
(Volts)
Photoelectric
Tachometer Reading
(RPM)
% error Model graph
Observed Actual
Post-Lab Exercise:
1. Explain how photoelectric tachometer used to measure the speed of shaft?
2. What are the advantages of photoelectric transducers?
3. What are the disadvantages of photoelectric transducers?
4. State the working principle of Stroboscope.
5. Name the other methods used to find the speed of the shaft.
Result:
Thus the speed measurement using photoelectric tachometer is done and its variation
with input voltage is plotted.

48
Exp No.:8(b) MEASUREMENT OF TORQUE
Date:
Aim:
To determine the torque due to dead weights using strain torsion meter and to determine
the unknown weight.
Apparatus Required:
i) Strain gauge torsion meter.
ii) Dead weight.
Pre-Lab Exercise:
1. Define torque.
2. What are the methods used for Torque measurement?
3. What is the unit of torque?
4. What are the advantages of digital torque measurement?
Theory:
Torque is generally referred to as an angular twist (i.e.) the force that is being applied at a
particular angle. Torque can be obtained by measuring force at a known distance.
Torque is given by T = Fr Nm
Where, F = Force in Newton,
r = Distance at which the force is measured in meter.
The torque measuring device used here makes use of four strain gauges that are arranged
in a Wheatstone bridge model. When an angular force or a torque is applied two of the strain
gauges undergo a compressive force while two other strain gauge undergo tensile force. This
result in the change as far as the dimensions of the strain gauge element is concern which in
turn changes the resistance. This change in resistance ensures a production of an output
voltage which is a measure of the applied torque.
Procedure:
1. Connect the strain gauge torsion meter to the power supply.
2. Check for calibration of initial zero torque.
3. Now change or fix the hanger so that the shaft is subjected to torque.
4. Now keep the deadweights in the hanger gently.
5. Note the indicated torque value from the strain gauge torsion indicator.
6. Repeat the same for different weights and tabulate the readings.
7. Now repeat the same procedure for the given unknown weight.
8. The unknown weight is interpreted from the graph.
9. The graph is plotted between deadweights and indicated torque value.

49
Circuit Diagram:

50
Tabular Column:
S.No Length
(cm)
Dead Weights
(gms)
Torque indicated
(KgM)
Theoretical torque
(gm)
Model Calculation:
Model Graph:
Post-Lab Exercise:
1. State the principle of strain gauge.
2. Explain how torque is measured using strain gauge.
3. What is the principle of inductive torque transducer?
4. What is the principle of magnetostrictive torque transducer?
5. What are the advantages of digital torque measurement?
6. Give comparison among different torque measurement methods?
Result:
Thus the torque due to deadweights is determined using Strain torsion meter the value
of unknown weight is determined.

51
Exp No.:9 CHARACTERISTICS OF A/D CONVERTER
Date:
Aim:
To test the characteristics of analog to digital converter using DAC.
Apparatus required:
S. No. Components / Equipments Specification Quantity
1. Op-amp IC 741 1
2. Binary counter IC 7493 1
3. AND Gate IC 7408 1
4. Resistors 3.3 k, 6.8 k, Each one
5. Resistor 1.5 k 2
6. Digital trainer kit - 1
7. Regulated Power Supply (0-15) V 1
8. Connecting wires --- Few
Pre-Lab Exercise:
1. What is ADC?
2. What are the types of ADC?
3. What is the need for ADC?
4. State Shannon's sampling theorem?
Theory:
An analog-to-digital converter, or ADC as it is more commonly called, is a device
that converts analog signals into digital signals. A/D converters are electronic circuits that
have the following characteristics;
The input to the A/D converter is a voltage.
The output of the A/D converter is an n-bit binary signal corresponding to the voltage at
the input at a specific instance. Therefore Analog to Digital conversion is a mapping from
continuous ranges to binary numbers.
The conversion involves quantization of the input, so it necessarily introduces a
known amount of error, called quantization error or quantization noise. The resolution of the
converter is the number of discrete values it can produce over the range of analog values. The values are usually stored electronically in binary form, so the resolution is usually expressed
in bits. For example, an ADC with a resolution of 8 bits can encode an analog input to one in 256 different levels. Resolution can also be expressed in volts. In that case the resolution is
Q= Vrange /(2n-1). where Q is the resolution of ADC, ‘n, is the resolution of ADC in bits, Vrange
is the whole voltage range at the input.
Analog to Digital converters can be designed with or without the use of DAC as part
of their circuitry. The commonly used types of ADC’s incorporating DAC are:
a. Successive Approximation type. b. Counting or Ramp type.
The block diagram of a counting type ADC using a DAC is shown in the figure. When the
clock pulses are applied, the contents of the register/counter are modified by the control
circuit. The binary output of the counter/register is converted into an analog voltage Vp by
the DAC. Vp is then compared with the analog input voltage Vin .This process continues
until Vp>=Vin. After which the contents of the register /counter are not changed. Thus the
output of the register /counter is the required digital output.

52
Circuit Diagram:
Procedure:
1. By making use of the R-2R ladder DAC circuit set up the circuit as shown in the figure.
2. Apply various input voltages in the range of 0 to 10V at the analog input terminal.
3. Apply clock pulses and observe the stable digital output at QD,QC,QB and QA for each
analog input voltage.
Tabular Column:
S.No. Analog Input Voltage
(V)
Digital Output Voltage
(binary form)
53
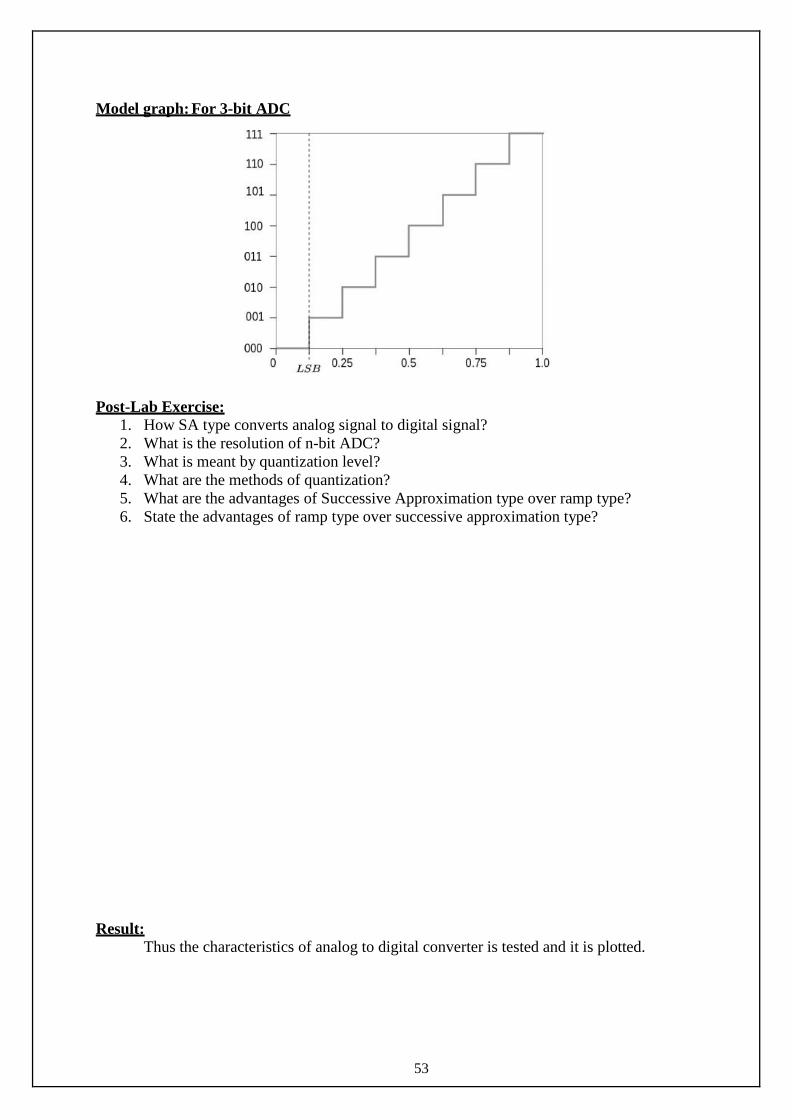
Model graph: For 3-bit ADC
Post-Lab Exercise:
1. How SA type converts analog signal to digital signal?
2. What is the resolution of n-bit ADC?
3. What is meant by quantization level?
4. What are the methods of quantization?
5. What are the advantages of Successive Approximation type over ramp type?
6. State the advantages of ramp type over successive approximation type?
Result:
Thus the characteristics of analog to digital converter is tested and it is plotted.

54
Exp No.:10 CHARACTERISTICS OF D/A CONVERTER
Date:
Aim:
To design and test a 4 bit D/A Converter by R - 2R ladder network.
Apparatus required:
S. No. Components / Equipments Specification Quantity
1. Op-amp IC 741 1
2. Resistors 11 k 4
3. Resistors 22 k 6
4. Digital trainer kit - 1
5. DMM - 1
6. Regulated Power Supply (0-15) V 1
7. Connecting wires --- Few
Pre-Lab Exercise:
1. Draw the block diagram of DAC
2. What are the different types of DAC?
3. Define Resolution and Quantization
5. Define aperture time.
Theory:
The input is an n-bit binary word ‘D’ and is combined with a reference voltage ‘VR’ to give
an analog output signal. The output of D/A converter can either be a voltage or current . For a
voltage output D/A converter is described as
Where, V0 is the output voltage, d1, d2, d3 and dn are n bit binary word with the decimal
point located at the lift. , d1 is the MSB with a weight of Vfs /2 , dn is the LSB with a weight
of Vfs / 2n

55
Circuit Diagram:
Formulae used:
Procedure:
1) Set up the circuit as shown in the circuit diagram
2) Measure the output voltage for all binary inputs (0000 to 1111).
3) Plot the graph for binary input versus output voltage.

56
Tabular Column:
S.No. Digital Input Analog Output
D1 D2 D3 D4 Theoretical Output (V) Practical Output (V)
1 0 0 0 0
2 0 0 0 1
3 0 0 1 0
4 0 0 1 1
5 0 1 0 0
6 0 1 0 1
7 0 1 1 0
8 0 1 1 1
9 1 0 0 0
10 1 0 0 1
11 1 0 1 0
12 1 0 1 1
13 1 1 0 0
14 1 1 0 1
15 1 1 1 0
16 1 1 1 1
Model graph:
Model Calculation:
Post-Lab Exercise:
1. What are the resistor values used in R-2R ladder type DAC?
2. Resistor values used in Weighted resistor type DAC --------
3. What are the advantages of R-2R ladder type DAC over Weighted resistor type DAC?
4. Explain how digital input is converted into analog using R-2R ladder type DAC.
5. Explain how digital input is converted into analog using Weighted resistor type DAC.
Result:
Thus the characteristics of digital to analog converter is tested and is plotted.

57
Exp No.11(a) CALIBRATION OF AMMETER
Date:
Aim:
To calibrate the given ammeter using standard ammeter.
Apparatus Required:
S. No. Components / Equipments Specification Quantity
1. RPS 0-30V 1
2. Standard Ammeter (MC) 0-500µA 1
3. Ammeter to be calibrated
(MC) 0-500µA 1
4. Single phase auto
transformer - 1
5. Lamp load unit - 1
6. Resistor 10KΩ 1
7. Bread Board --- 1
8. Connecting wires --- Few
Pre-Lab Exercise:
1. What is meant by calibration?
2. Why periodic calibration is needed?
3. What are the types of instruments used as ammeters?
4. What are the types of errors which occur in most of the ammeters?
Theory:
D.C ammeters are used to measure current from one micro ampere to several hundred
amperes. The D’Arsonval movement is used in most DC ammeter as a current detector.
Typical lab meters of this type can withstand 1 mA of their full scale reading. Since the coil
winding is small and light, it can carry very small current only. When heavy currents are to
be measured the major part of the current is bypassed through a low resistance called a
SHUNT.
Circuit Diagram:

58
Procedure:
1. Connect the circuits as shown in the circuit diagram.
2. Switch ON the supply.
3. Adjust the voltage using RPS & compare both the values that are shown by the standard
ammeter & the meter to be calibrated.
4. Find out the % error by using the formula.
Graph: Plot the error graph by taking % error along y axis & current along x axis.
Tabular Column:
S.No
Load
(Watt)
Voltmeter
Reading
(V)
Std. ammeter
reading (A)
( True reading)
Meter to be
calibrated(A)
( Measured reading )
% Error
Model Graph:
Formula used:
% Error Measured Value True Value
100
True Value
Model Calculation:
Post-Lab Exercise:
1. What is the use shunt in ammeter?
2. What are the requirements of shunts?
3. What are the materials used for constructing shunt resistance?
4. Define multiplying power of shunt.
Result:
Thus the given ammeter is calibrated against the given standard ammeter and the
percentage error graph is plotted.
59
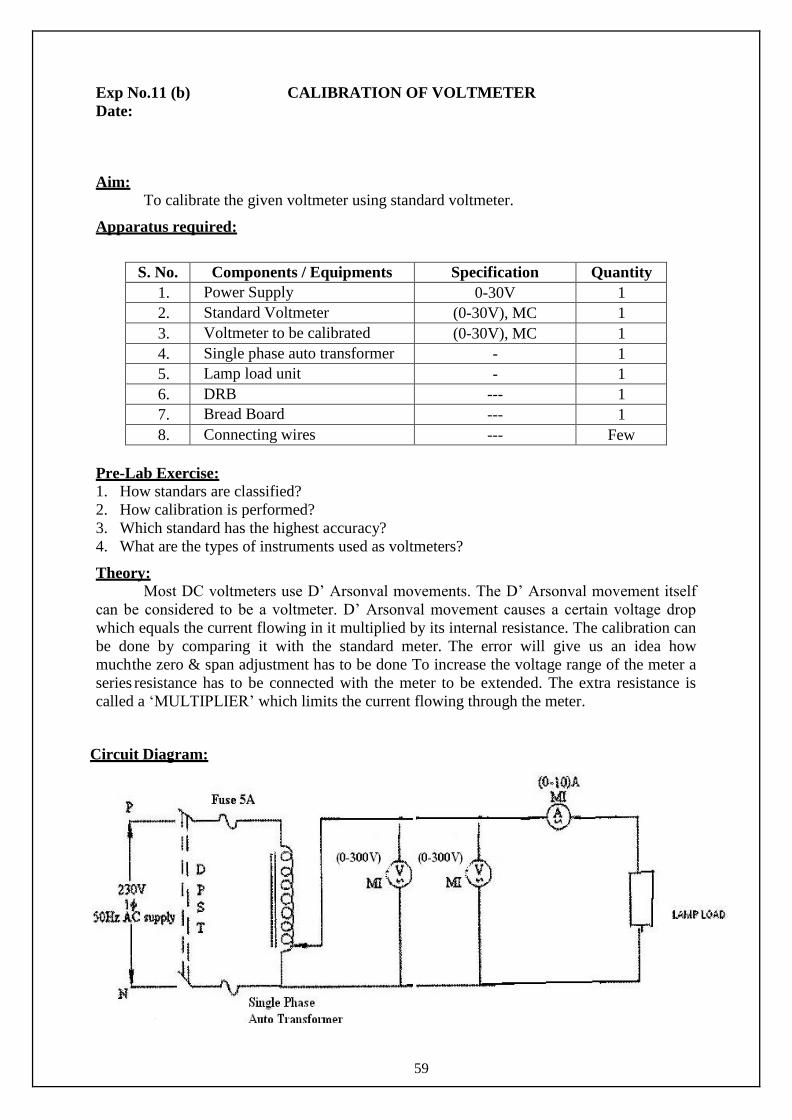
Exp No.11 (b) CALIBRATION OF VOLTMETER
Date:
Aim:
To calibrate the given voltmeter using standard voltmeter.
Apparatus required:
S. No. Components / Equipments Specification Quantity
1. Power Supply 0-30V 1
2. Standard Voltmeter (0-30V), MC 1
3. Voltmeter to be calibrated (0-30V), MC 1
4. Single phase auto transformer - 1
5. Lamp load unit - 1
6. DRB --- 1
7. Bread Board --- 1
8. Connecting wires --- Few
Pre-Lab Exercise:
1. How standars are classified?
2. How calibration is performed?
3. Which standard has the highest accuracy?
4. What are the types of instruments used as voltmeters?
Theory:
Most DC voltmeters use D’ Arsonval movements. The D’ Arsonval movement itself
can be considered to be a voltmeter. D’ Arsonval movement causes a certain voltage drop
which equals the current flowing in it multiplied by its internal resistance. The calibration can
be done by comparing it with the standard meter. The error will give us an idea how
much the zero & span adjustment has to be done To increase the voltage range of the meter a
series resistance has to be connected with the meter to be extended. The extra resistance is
called a ‘MULTIPLIER’ which limits the current flowing through the meter.
Circuit Diagram:

60
Procedure:
1. Connect the circuits as shown in the circuit diagram (a) and switch on the supply.
2. Adjust the voltage using RPS & compare both the values that are shown by the std.
voltmeter & the meter to be calibrated.
3. Find out the % error by using the formula.
Graph:Plot the error graph by taking % error along Y axis & voltage along X axis.
Tabular Column:
S. No
Std. voltmeter reading (V)
( True reading)
Meter to be calibrated (V)
(Measured reading) % Error
ModelGraph:
Formulae used:
% Error
Measured Value True Value 100
True Value
Model Calculation:
Post-Lab Exercise:
1. What are the types of errors which occur in most of the voltmeters?
2. What is multiplier?
3. What are the essential requirements of multiplier?
4. What are the materials used for constructing multiplier?
5. Explain the effect of temperature changes in voltmeters.
Result:
Thus for the given voltmeter percentage error was calculated and the same was
plotted.