


Bahasa
Halaman
Hukum


BioMed CentralBMC Genomics
ss
Open AcceResearch articleMicroarray and comparative genomics-based identification of genes and gene regulatory regions of the mouse immune systemJohn J Hutton, Anil G Jegga, Sue Kong, Ashima Gupta, Catherine Ebert, Sarah Williams, Jonathan D Katz and Bruce J Aronow*Address: Department of Pediatrics and Biomedical Informatics, University of Cincinnati and Cincinnati Children's Hospital Research Foundation, Cincinnati, Ohio 45229, USA
Email: John J Hutton - [email protected]; Anil G Jegga - [email protected]; Sue Kong - [email protected]; Ashima Gupta - [email protected]; Catherine Ebert - [email protected]; Sarah Williams - [email protected]; Jonathan D Katz - [email protected]; Bruce J Aronow* - [email protected]
* Corresponding author
AbstractBackground: In this study we have built and mined a gene expression database composed of 65diverse mouse tissues for genes preferentially expressed in immune tissues and cell types. Usingexpression pattern criteria, we identified 360 genes with preferential expression in thymus, spleen,peripheral blood mononuclear cells, lymph nodes (unstimulated or stimulated), or in vitro activatedT-cells.
Results: Gene clusters, formed based on similarity of expression-pattern across either all tissuesor the immune tissues only, had highly significant associations both with immunological processessuch as chemokine-mediated response, antigen processing, receptor-related signal transduction,and transcriptional regulation, and also with more general processes such as replication and cellcycle control. Within-cluster gene correlations implicated known associations of known genes, aswell as immune process-related roles for poorly described genes. To characterize regulatorymechanisms and cis-elements of genes with similar patterns of expression, we used a new versionof a comparative genomics-based cis-element analysis tool to identify clusters of cis-elements withcompositional similarity among multiple genes. Several clusters contained genes that shared 5–6 cis-elements that included ETS and zinc-finger binding sites. cis-Elements AP2 EGRF ETSF MAZF SP1FZF5F and AREB ETSF MZF1 PAX5 STAT were shared in a thymus-expressed set; AP4R E2FFEBOX ETSF MAZF SP1F ZF5F and CREB E2FF MAZF PCAT SP1F STAT cis-clusters occurred inactivated T-cells; CEBP CREB NFKB SORY and GATA NKXH OCT1 RBIT occurred in stimulatedlymph nodes.
Conclusion: This study demonstrates a series of analytic approaches that have allowed theimplication of genes and regulatory elements that participate in the differentiation, maintenance,and function of the immune system. Polymorphism or mutation of these could adversely impactimmune system functions.
Published: 25 October 2004
BMC Genomics 2004, 5:82 doi:10.1186/1471-2164-5-82
Received: 30 March 2004Accepted: 25 October 2004
This article is available from: http://www.biomedcentral.com/1471-2164/5/82
© 2004 Hutton et al; licensee BioMed Central Ltd. This is an open-access article distributed under the terms of the Creative Commons Attribution License (http://creativecommons.org/licenses/by/2.0), which permits unrestricted use, distribution, and reproduction in any medium, provided the original work is properly cited.
Page 1 of 16(page number not for citation purposes)

BMC Genomics 2004, 5:82 http://www.biomedcentral.com/1471-2164/5/82
BackgroundThe immune system is composed of a multiplicity of indi-vidual cell types that derive from a relatively smallnumber of immuno-hematopoietic progenitors thatundergo complex developmental and exposure-drivendifferentiation and activation. Cell-type specific geneexpression is driven to a large measure by complex tran-scriptional regulation that orchestrates differential expres-sion of a wide variety of genes necessary to accomplishimmune effector functions. A number of specific tran-scription factors (TFs) which regulate gene expression inimmune system cell types have been identified, largelythrough gene knockout experiments and isolation of pro-tein complexes that bind to regulatory regions of targetgenes. Examples include PU.1/Ets, Ikaros, E2A, EBF,PAX5, GATA3, NFAT, cMYB, and OCT-2 [1-4]. These pro-teins bind to clusters of cis-regulatory elements in multi-ple diverse combinations to give rise to specific patterns ofgene expression [5]. However, the layout of regulatoryand coding regions is not known for most genes that arepreferentially expressed in lymphocytes and immune tis-sues (see, for examples, [6-11]). Based on the nearly com-pleted nucleotide sequences of the mouse and humangenomes (http://genome.ucsc.edu[12]; http://www.ensembl.org[13]), we have sought to expand ourknowledge of the structure and function of compartment-specific genes, and in particular, to find clusters of cis-ele-ments that bind TFs and regulate gene expression duringbiological processes. DNA sequences of both codingregions and non-coding regions which harbor cis-ele-ments that govern expression, are phylogenetically con-served [14-16]. This conservation of functionallyimportant regions of DNA underpins current methods ofidentifying putative regulatory regions by comparativesequence analysis. In practice, finding relevant clusters ofcis-elements is difficult and computationally intensive.
High-throughput gene expression profiling provides apowerful approach to the investigation of relative tran-scriptional activity as a function of biological differentia-tion across a variety of cells and tissues. Publishedexamples that probe a wide variety of distinct, differenti-ated materials include the Human Gene Expression(HuGE) Index database http://www.hugeindex.org[17]and the GNF (Genomics Institute of the Novartis ResearchFoundation; http://web.gnf.org/) database of human andmouse gene expression [18]. These resources provideaccess to patterns of expression of a significant fraction(15–25%) of all mouse and human genes in several dozentissues and cell types. We have created a large databaselocally, which has permit investigators from our campusto profile gene expression in mouse tissues and cell typesspecific to their interests [19]. To do this, we used theIncyte Mouse GEM1 microarray, an 8638 element spottedcDNA gene expression platform and a universal reference
design that employed poly A+ mRNA was prepared fromwhole day-1 postnatal mouse. Two channel Cy3-Cy5microarray hybridization technology was used to identifyrelative strength of signals from each element of the arrayfor a specific tissue. From this database, we identified 360cDNAs on the microarray that exhibit preferential expres-sion in immune tissues such as lymph nodes, thymus, andactivated T-cells relative to most other types of tissues. Weidentified 333 genes that encode these sequences andhave grouped them by biological functions and by pat-terns of expression.
Cis-element clusters that are conserved in pairs oforthologs are strong predictors of regulatory regionswithin mammalian genes [15,20,21]. We have used thismethod to identify putative regulatory modules, whichare clusters of conserved cis-regulatory elements that occurin coordinately regulated genes of the immune systemand may play a role in controlling their expression duringdevelopment or mature cell function. Several of the mod-ules identified through this approach contain cis-elementswhose biological relevance has been experimentally vali-dated in previous studies. Other computationally identi-fied modules from this immunomic database have notbeen studied in detail, but the results and a tool to analyzethem further, are provided at the website http://cismols.cchmc.org[22]. Taken together these data providevaluable guidance to the design of experiments that seekto identify regulatory modules in genes with specific pat-terns of expression.
ResultsSelection of set of immune genesOur goal is to identify genes, which are essential for thedifferentiation, maintenance, and function of theimmune system, and their associated regulatory elements.Polymorphisms or mutation in these might underlie well-known variation among individuals in effectiveness oftheir immune response. Mouse immune genes were iden-tified from our gene expression database constructedusing the 8638 element microarray and probed withmRNA prepared from 65 normal adult and fetal tissues.We chose to select relevant genes by collecting thoseexpressed above a threshold value rather than by statisti-cal analysis of variance. Given the small number of repli-cates and the large number of comparisons being made,we would not have enough statistical power to detect dif-ferentially expressed genes by using traditional statisticaltests with appropriate specificity. In addition, with thereduced specificity of statistical tests, the biologically non-significant, but somewhat reproducible differences ingene expression will obscure changes that are of biologi-cally significant magnitude, but vary from replicate to rep-licate. Expression of genes is not discontinuous fromtissue to tissue, but varies quantitatively over a wide range.
Page 2 of 16(page number not for citation purposes)

BMC Genomics 2004, 5:82 http://www.biomedcentral.com/1471-2164/5/82
The threshold to distinguish expressed from non-expressed genes was set to identify the hundred or so mosthighly expressed gene in each relevant tissue.
Genes were considered to be "immune genes" if they weremore highly expressed in one or more of 6 immune tis-sues (lymph nodes from normal and antigen stimulatedmice, thymus, activated T-cells, spleen, peripheral bloodmononuclear cells) than in most other normal adult andfetal mouse tissues. 680 genes were identified where theamount of cDNA hybridized from one or more immunetissues was 3 or more times greater than hybridization ofcDNAs from the reference whole mouse (Figure 1A). Toincrease specificity, the 680 genes were then filtered toremove those with 2-fold or greater expression in normalbrain, spinal cord, heart, kidney, pancreas or stomach.These tissues were chosen because they do not play a rolein the immune response, contain very few cells of theimmune system, and should not express immune-specificgenes. By contrast, no effort was made to remove genesexpressed in the intestinal tract, lung, or fetus where cellsof the immune system might be expected. The resultingset of 483 genes was examined by hierarchical clusteranalysis. Spleen and peripheral blood mononuclear cellswere noted to express genes encoding proteins of imma-ture erythroid cells and polymorphonuclear leukocytes.To remove these, the set was restricted to genes that wereexpressed 2 fold or greater in at least one of stimulatedand unstimulated lymph nodes, activated T cells, or thy-mus. The end result is a set of 360 expressed sequences,which we call "immune" genes (Figure 1A and 1B). 265 ofthe expressed sequences were linked to specific genes andgene symbols, using the Mouse Genome Database (MGD)http://informatics.jax.org[23] and NCBI-LocusLink [24].The remainders were analyzed using MouseBLAST andBLAT [12] to find sequence homologies with knowngenes. An additional 78 sequences could be linked to spe-cific genes, 9 (seven occurring twice and one occurringthrice) of these were redundant, so that a total of 333 pre-viously known unique genes were represented by the 360expressed sequences. 292 of these genes were assigned aprobable function, using criteria described in Methods. 5sequences were repetitive elements and 12 sequencescould not be linked to a known gene or function. Genesymbols, names, functions, and extensive additionalannotations are provided in the supplementary materials(Additional file 1). Human orthologs of these mouseimmune genes were sought by sequence homology.Where found, pairs of mouse-human orthologs wereannotated with regard to function and were analyzed forphylogenetically conserved regulatory regions.
Hierarchical clustering of genes and tissuesHierarchical tree clustering of the 360 sequences and 65normal adult and fetal tissues was carried out by Pearson
correlation using the log of the average of the relativeexpression ratio for each gene as measured in replicatearrays (Figure 1A). While the band of high expressionextends across the 6 immune tissues, relative expression ofeach gene within the immune tissues shows distinct pat-terning (Figure 1B). For intestinal and fetal tissues, theareas of high expression are localized and do not includethe majority of the immune genes. Function of the genesexpressed in these tissues will be described.
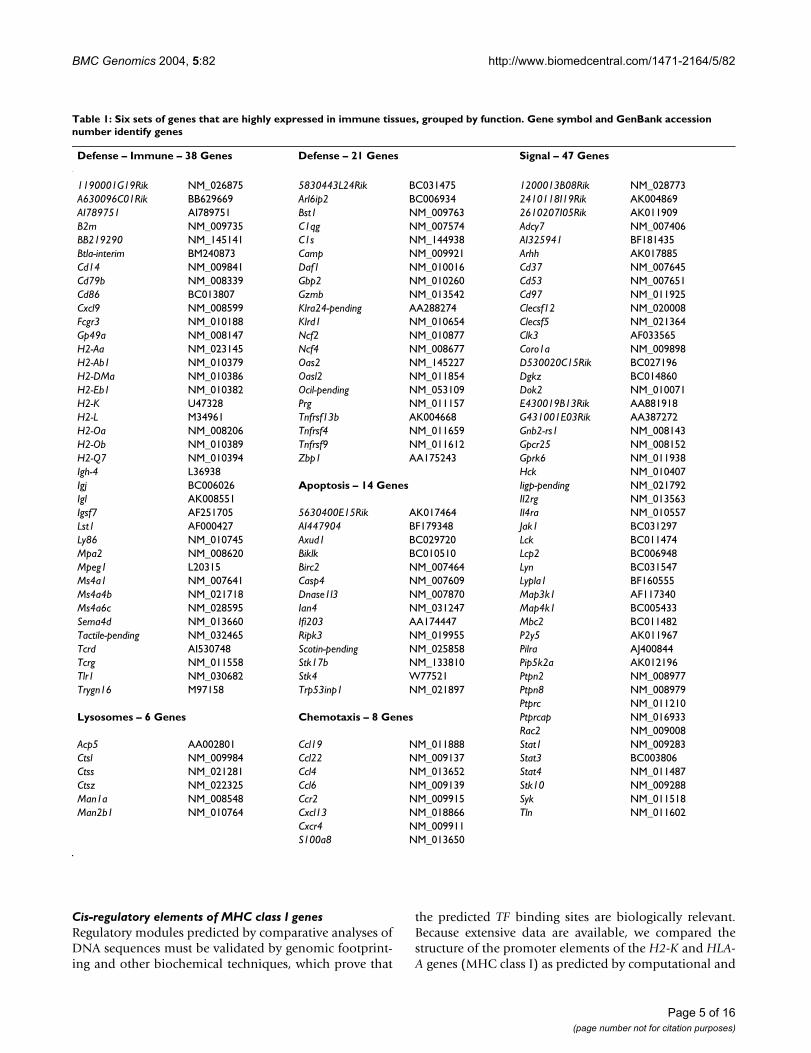
Function of the immune genesA putative function could be assigned to 298 expressedsequences (Additional file 1) based on one or moreknown functional annotation or sequence analysis-basedstructural classifiers. This annotation is independent ofpattern of expression and gives an overview of the types offunctions carried out by immune genes. Six functionalgroups derived from these annotations are shown in Table1. The HGNC http://www.gene.ucl.ac.uk/nomenclature[25] and MGI http://informatics.jax.org[23] approvedgene symbols are used in the table, although many ofthese genes are better known by their aliases as providedin supplementary materials. Table 1 shows 59 genes thathave functions associated with defense-immune ordefense response (immune is a subcategory of defense inGO annotations). Defense-immune genes were moredirectly related to antigen recognition and receptor signal-ing of T- and B-lymphocytes than defense genes, althoughthe separation of defense and immune is somewhat arbi-trary. 47 genes in Table 1 are involved in cell signaling, 14in apoptosis, 8 in chemotaxis, and 6 in lysosomes. Addi-tional lists of genes grouped by function and shown in thesupplementary materials include 39 in transcription, 23in DNA replication/cell cycle control, 20 in protein syn-thesis, 13 in transport, and 10 in adhesion. Smaller groupsof genes that are important in function of the immune sys-tem include protein trafficking and degradation, andmaintenance of the cytoskeleton. Functions carried out bysome of the genes that are highly expressed in immune tis-sues are common to cells and tissues that are actively pro-liferating and synthesizing proteins. These include, forexample, genes involved in DNA synthesis and the cellcycle such as the minichromosome maintenance proteins,Mcm2 through Mcm7; the DNA polymerases and primase,Pola2, Cdc6, Prim1; the processivity factor Pcna, and cyclinE1, Ccne1. They play a role in regulation of chromosomalreplication in many types of cells [26]. In the immune tis-sues, high expression of these genes is characteristic ofactivated T-cells, which are proliferating. Similarly, otherimmune genes are involved in protein synthesis and arenot specific to the immune system. Twelve immune genesencode ribosomal proteins.
There are sets of genes that work together to produce thecellular and humoral immune responses. For example,
Page 3 of 16(page number not for citation purposes)

BMC Genomics 2004, 5:82 http://www.biomedcentral.com/1471-2164/5/82
molecules of the major histocompatibility complexpresent foreign peptides to T cells. They are encoded bygenes such H2-Aa, H2-Ab1, H2-DMa, H2-Eb1, H2-K, H2-L,H2-Oa, H2-Ob, H2-Q7, and B2m (Table 1, Defense –Immune). Signal transduction pathways are abundantand play critical roles in the function of lymphocytes.They link the recognition of antigens or chemokines byreceptors on the cell surface to the transcription of genesrequired for cell division and new protein synthesis. Thisprocess of lymphocyte activation requires an intracellularsignaling cascade with participation of protein kinases, G-proteins, and products of cleavage of membrane phos-pholipids [27-29] (Table 1, Signal). Janus kinases,encoded by genes such as Jak1, phosphorylate both signaltransducers and activators of transcription (Stat1, Stat3,and Stat4) as part of the lymphocytes' response tocytokines. The product of Rac2 is a G protein that partici-pates in the cascade of kinases leading to activation of TFs.Chemokines are a family of small proteins that activatecells such as lymphocytes as part of the host response to
infection. Genes that encode the chemokines (Ccl4, Ccl6,Ccl19, Ccl22, Cxcl13) and chemokine receptors (Cxcr4 andCcr2) (Table 1, Chemotaxis) are highly expressed inimmune tissues.
Twenty-one sequences representing 19 known genes werehighly expressed in gastrointestinal tissue (Figure 1B). Ofthese, 5 were classified as "Defense – Immune", includingB2m, H2-Q7, Tcrg, Tlr1, and H2-K. Of the 51 genesexpressed in fetal tissues (Figure 1B), 46 are annotated.Sixteen genes functioned in protein synthesis and 13 incell cycle/DNA synthesis. No "Defense" or "Defense-Immune" genes were highly expressed in fetal tissues.Genes expressed in fetal tissues reflect active growth andproliferation of cells. In immune tissues, these same genesare particularly well expressed in activated T-cells and thy-mus, where cell proliferation is occurring.
Expression profiles of sequences across tissuesFigure 1Expression profiles of sequences across tissues: Hierarchical tree clustering of genes and tissues was carried out using Pearson correlation and the log of the average of the relative expression ratio for each gene, as measured in replicate arrays. Sequences with similar expression patterns across all tissues are clustered together in the resulting trees, the closeness of the sequences in sub trees is a measure of how closely correlated their expression is. (A) Hierarchical tree clustering of genes across 65 normal adult and fetal tissues. 680 sequences were identified that were highly expressed in thymus, unstimulated and stimulated lymph nodes, spleen, peripheral blood mononuclear cells, and in vitro activated T-cells. To increase specificity, 320 sequences were removed because they were also highly expressed in one or more non-lymphoid tissues, as described in the text. The pattern of expression of the remaining 360 "immune genes" across tissues is shown. (B) Hierarchical tree clustering of 360 immune genes across 18 normal adult and fetal tissues. There are 3 major groups of tissues that show clusters of highly expressed "immune genes" These include the 6 immune tissues, various segments of adult intestine, and fetal day 16.5 lung and intestine. Less prominent clusters are seen in adult lung and liver. Genes in these clusters are described in the text. While the band of high expression extends across all genes for the 6 immune tissues, relative expression of each gene within the immune tissues shows distinct patterning.
Page 4 of 16(page number not for citation purposes)
BMC Genomics 2004, 5:82 http://www.biomedcentral.com/1471-2164/5/82
Cis-regulatory elements of MHC class I genesRegulatory modules predicted by comparative analyses ofDNA sequences must be validated by genomic footprint-ing and other biochemical techniques, which prove that
the predicted TF binding sites are biologically relevant.Because extensive data are available, we compared thestructure of the promoter elements of the H2-K and HLA-A genes (MHC class I) as predicted by computational and
Table 1: Six sets of genes that are highly expressed in immune tissues, grouped by function. Gene symbol and GenBank accession number identify genes
Defense – Immune – 38 Genes Defense – 21 Genes Signal – 47 Genes
1190001G19Rik NM_026875 5830443L24Rik BC031475 1200013B08Rik NM_028773A630096C01Rik BB629669 Arl6ip2 BC006934 2410118I19Rik AK004869AI789751 AI789751 Bst1 NM_009763 2610207I05Rik AK011909B2m NM_009735 C1qg NM_007574 Adcy7 NM_007406BB219290 NM_145141 C1s NM_144938 AI325941 BF181435Btla-interim BM240873 Camp NM_009921 Arhh AK017885Cd14 NM_009841 Daf1 NM_010016 Cd37 NM_007645Cd79b NM_008339 Gbp2 NM_010260 Cd53 NM_007651Cd86 BC013807 Gzmb NM_013542 Cd97 NM_011925Cxcl9 NM_008599 Klra24-pending AA288274 Clecsf12 NM_020008Fcgr3 NM_010188 Klrd1 NM_010654 Clecsf5 NM_021364Gp49a NM_008147 Ncf2 NM_010877 Clk3 AF033565H2-Aa NM_023145 Ncf4 NM_008677 Coro1a NM_009898H2-Ab1 NM_010379 Oas2 NM_145227 D530020C15Rik BC027196H2-DMa NM_010386 Oasl2 NM_011854 Dgkz BC014860H2-Eb1 NM_010382 Ocil-pending NM_053109 Dok2 NM_010071H2-K U47328 Prg NM_011157 E430019B13Rik AA881918H2-L M34961 Tnfrsf13b AK004668 G431001E03Rik AA387272H2-Oa NM_008206 Tnfrsf4 NM_011659 Gnb2-rs1 NM_008143H2-Ob NM_010389 Tnfrsf9 NM_011612 Gpcr25 NM_008152H2-Q7 NM_010394 Zbp1 AA175243 Gprk6 NM_011938Igh-4 L36938 Hck NM_010407Igj BC006026 Apoptosis – 14 Genes Iigp-pending NM_021792Igl AK008551 Il2rg NM_013563Igsf7 AF251705 5630400E15Rik AK017464 Il4ra NM_010557Lst1 AF000427 AI447904 BF179348 Jak1 BC031297Ly86 NM_010745 Axud1 BC029720 Lck BC011474Mpa2 NM_008620 Biklk BC010510 Lcp2 BC006948Mpeg1 L20315 Birc2 NM_007464 Lyn BC031547Ms4a1 NM_007641 Casp4 NM_007609 Lypla1 BF160555Ms4a4b NM_021718 Dnase1l3 NM_007870 Map3k1 AF117340Ms4a6c NM_028595 Ian4 NM_031247 Map4k1 BC005433Sema4d NM_013660 Ifi203 AA174447 Mbc2 BC011482Tactile-pending NM_032465 Ripk3 NM_019955 P2y5 AK011967Tcrd AI530748 Scotin-pending NM_025858 Pilra AJ400844Tcrg NM_011558 Stk17b NM_133810 Pip5k2a AK012196Tlr1 NM_030682 Stk4 W77521 Ptpn2 NM_008977Trygn16 M97158 Trp53inp1 NM_021897 Ptpn8 NM_008979
Ptprc NM_011210Lysosomes – 6 Genes Chemotaxis – 8 Genes Ptprcap NM_016933
Rac2 NM_009008Acp5 AA002801 Ccl19 NM_011888 Stat1 NM_009283Ctsl NM_009984 Ccl22 NM_009137 Stat3 BC003806Ctss NM_021281 Ccl4 NM_013652 Stat4 NM_011487Ctsz NM_022325 Ccl6 NM_009139 Stk10 NM_009288Man1a NM_008548 Ccr2 NM_009915 Syk NM_011518Man2b1 NM_010764 Cxcl13 NM_018866 Tln NM_011602
Cxcr4 NM_009911S100a8 NM_013650
Page 5 of 16(page number not for citation purposes)
BMC Genomics 2004, 5:82 http://www.biomedcentral.com/1471-2164/5/82
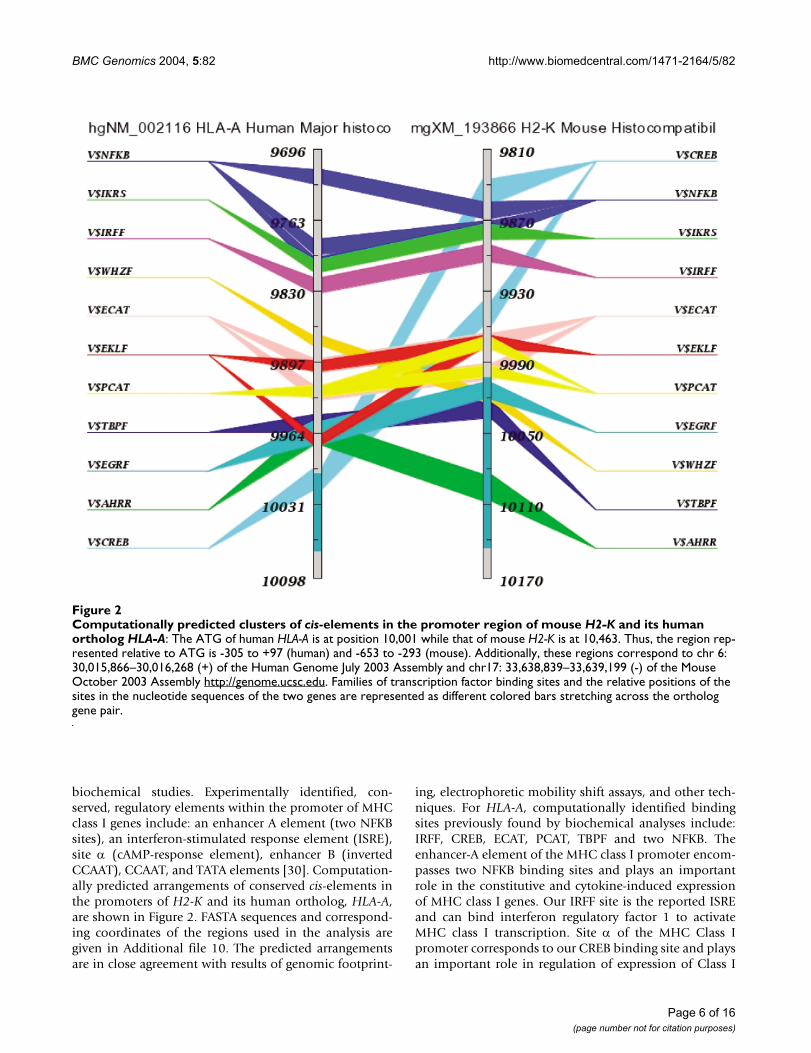
biochemical studies. Experimentally identified, con-served, regulatory elements within the promoter of MHCclass I genes include: an enhancer A element (two NFKBsites), an interferon-stimulated response element (ISRE),site α (cAMP-response element), enhancer B (invertedCCAAT), CCAAT, and TATA elements [30]. Computation-ally predicted arrangements of conserved cis-elements inthe promoters of H2-K and its human ortholog, HLA-A,are shown in Figure 2. FASTA sequences and correspond-ing coordinates of the regions used in the analysis aregiven in Additional file 10. The predicted arrangementsare in close agreement with results of genomic footprint-
ing, electrophoretic mobility shift assays, and other tech-niques. For HLA-A, computationally identified bindingsites previously found by biochemical analyses include:IRFF, CREB, ECAT, PCAT, TBPF and two NFKB. Theenhancer-A element of the MHC class I promoter encom-passes two NFKB binding sites and plays an importantrole in the constitutive and cytokine-induced expressionof MHC class I genes. Our IRFF site is the reported ISREand can bind interferon regulatory factor 1 to activateMHC class I transcription. Site α of the MHC Class Ipromoter corresponds to our CREB binding site and playsan important role in regulation of expression of Class I
Computationally predicted clusters of cis-elements in the promoter region of mouse H2-K and its human ortholog HLA-AFigure 2Computationally predicted clusters of cis-elements in the promoter region of mouse H2-K and its human ortholog HLA-A: The ATG of human HLA-A is at position 10,001 while that of mouse H2-K is at 10,463. Thus, the region rep-resented relative to ATG is -305 to +97 (human) and -653 to -293 (mouse). Additionally, these regions correspond to chr 6: 30,015,866–30,016,268 (+) of the Human Genome July 2003 Assembly and chr17: 33,638,839–33,639,199 (-) of the Mouse October 2003 Assembly http://genome.ucsc.edu. Families of transcription factor binding sites and the relative positions of the sites in the nucleotide sequences of the two genes are represented as different colored bars stretching across the ortholog gene pair.
Page 6 of 16(page number not for citation purposes)

BMC Genomics 2004, 5:82 http://www.biomedcentral.com/1471-2164/5/82
genes. Our PCAT and ECAT sites include sequences con-sistent with the CCAAT site and our TBPF is a TATA bind-ing site, as reported in the MHC class I promoterimmediately upstream of the transcription start site [30].Computational analysis identifies additional potentialbinding sites that have not yet been tested for biologicalrelevance. These include families IKRS, WHZF, EKLF,EGRF, and AHRR. Several of these may play a specific rolein the immune system. For instance, the IKRS family ofsites bind Ikaros zinc finger transcription factors, whichare regulators of lymphocyte differentiation; the WHZfamily of TFs includes members that are critical to theproper expression of genes during development of thethymus [31]; the EGR family of zinc finger transcriptionfactors is induced as a consequence of activation of themitogen-activated protein kinase (MAPK) signaling path-way during positive selection in the thymus [32]; and AhRis known to effect immunosuppression by inducing bonemarrow stromal cells to deliver a death signal to lym-phocytes [33]. We conclude that computational analysesboth identify previously reported TF binding sites and pre-dict phylogenetically conserved sites that should be exam-ined for biological relevance in future biochemicalstudies.
Cis-Regulatory elements in genes grouped by patterns of expressionLocally developed programs, TraFaC and CisMols, wereused to identify and display putative regulatory modulesin genes grouped by patterns of expression. The algo-rithms use a moving 200 bp window to scan regions ofDNA for specific sequences characteristic of TF bindingsites (Figure 3).
Cluster analysis of genome wide expression data frommicroarrays permits the grouping together of genes withsimilar patterns of expression across cells, tissues or exper-imental conditions. Clustering of genes by patterns ofexpression was first applied on a large scale to yeast [34],where control of important variables like genotype, phaseof cell cycle, and growth conditions permits precise iden-tification of coordinately regulated genes. Clustering hasalso been used to catalog mammalian genes that are dif-ferentially expressed in normal and malignant immunecells [35,36]. While yeast genes with similar patterns ofexpression have been found to share regulatory elements[37], identification of such elements in clustered genes ofmammals is complex and not very successful [38,39].Conservation of functionally important regions of DNAunderpins current methods of identifying putative regula-tory regions by computational analysis of nucleotidesequences [14-16]. Using K-means clustering in Gene-Spring (Version 4.2.1), 160 genes, which had been anno-tated using SOURCE [40] early in our studies, weredivided into distinct sets based on similarity of expression
patterns across 15 tissues. Tissues were given equal weight,the number of clusters was set at 20, and similarity wasmeasured by standard correlation. For technical reasons,GeneSpring did not assign 4 genes to clusters. The clustersets are shown in Additional file 2.
K-cluster set 15K-cluster set 15 contained 14 genes. While these genes hadsimilarities in patterns of expression across a group of 15tissues, their most prominent shared characteristic waspreferential expression in thymus. They were diverse infunction. For instance, the group comprised transcriptionfactors Ets1 and Tcf12, chromatin matrix associated pro-tein Smarcf1 (recently renamed Arid1a), the ATP-bindingcassette transporter Abcg1 (transports peptides duringantigen processing), the 2'-5'-oligoadenylate synthetaseOasl2 that is induced by interferon, and the histocompat-ibility antigen H2-K that plays a role in antigen presenta-tion and processing. Sequences of both the mouse geneand its human ortholog were available for seven genes(Abcg1, Ctsl, Man2b1, Sgpl1, Arid1a, Tcf12, and Zfp162).The 3 kb upstream regions of all 7 genes were comparedto identify modules of shared cis-elements. The search cri-teria were limited by (1) requiring modules to contain atleast 3 TF binding sites, one of which is a lymphoid ele-ment (see this list of lymphoid elements in Methods), (2)to be evolutionarily conserved, that is, to occur within thephylogenetic footprints in the aligned mouse-humanorthologs, and (3) to be located within 3 kb upstream and100 bp downstream of the first bp of exon 1 (transcriptionstart). Examples of modules of cis-elements are shown inTable 2. Arid1a, Abcg1 and Sgpl1 are most similar to oneanother. They also have the most similar patterns ofexpression across tissues, when clustered in hierarchicaltrees. One module, AP2F EGRF MAZF SP1F ZBPF, con-tains 5 cis-elements within a 200 bp window and ispresent within 3 kb upstream of transcription start inArid1a, Abcg1 and Sgpl1. The conserved modules contain-ing multiple transcription factor binding sites (Table 2and Figures 3 and 4; Additional file 11 gives fastasequences, list of binding sites and coordinates) are likelyto play a role in regulation of expression of these genes,but this hypothesis must be experimentally verified. Ctsl,Man2b1, Zfp162 and Tcf12 did not share modules (withinupstream 3 kb region and having at least one "lymphoidelement") with the other genes.
Figure 4 shows the computationally predicted arrange-ment of cis-elements immediately upstream of the tran-scription start site (promoters) of specific individualgenes: Arid1a, Abcg1, and Zfp162. Elements were requiredto be within 500 bp of transcription start to be shown inFigure 4, which focuses on sequence conservation inclassical promoters of pairs of orthologs and does notrequire that elements be shared with other genes. Modules
Page 7 of 16(page number not for citation purposes)

BMC Genomics 2004, 5:82 http://www.biomedcentral.com/1471-2164/5/82
in Table 2 were within 3 kb of transcription start, whichcould include both classical promoters and upstreamenhancers, and were shared by more than one pair oforthologs. A number of the elements of modules listed inTable 2 are also present in the predicted promoters. Forexample, MAZF and SP1F are also present in the promot-ers of Arid1a, Abcg1 and Zfp162.
K-cluster Set 7K-Cluster set 7 includes 19 genes. As a group the geneswere better expressed in stimulated lymph nodes and acti-vated T-cells than in the other tissues. Expression wascharacteristically low in peripheral blood mononuclearcells and in other non-immune adult and fetal tissues.Among the genes in set 7 are the integral surface mem-
Example of a CisMols display of location and composition of clusters of cis-elements that are putative regulatory modulesFigure 3Example of a CisMols display of location and composition of clusters of cis-elements that are putative regula-tory modules. The genes are those with high expression in thymus. The algorithm used by TraFac and CisMols to display reg-ulatory modules uses a moving 200 bp window to scan regions of DNA for specific sequences characteristic of TF binding sites (cis-elements). Clusters of these cis-elements are not generally distributed evenly across a segment of DNA, but are highly localized to specific segments which are likely to play a role in regulation of gene expression. Because the scanning window is limited to 200 bp and the scan changes the frame of sequences within the window, a regulatory module that contains multiple cis-elements may not be displayed as one list of multiple elements, but rather as a list of several modules of different composi-tion and arrangement within one small segment of DNA. Each colored cube indicates a cluster of 3 or more cis-elements with at least one "lymphoid element". The region searched is upstream 3 kb and downstream 100 bp of transcription start site (as defined by the respective mRNAs from NCBI's RefSeq database). The legend in the lower left half indicates the composition of each of the modules and the genes that share them. In the lower right hand panel is the Trafac image of one of the cis-element dense region with multiple shared modules of Arid1a gene.
Page 8 of 16(page number not for citation purposes)

BMC Genomics 2004, 5:82 http://www.biomedcentral.com/1471-2164/5/82
brane protein CD72 found on B-cells, the transcriptionregulators Irf5 and Icsbp1, the tyrosine kinases Hck, Stk10,and Lyn that are a part of the intracellular signaling cas-cade, the mitogen activated protein kinases Map3k1 andMap4k1 that participate in the very earliest steps of induc-tion of new gene expression after lymphocytes areexposed to antigen, and the ATP-binding cassette trans-porters Abca7 and Tap1 of the type that transport peptidesduring antigen processing. Other less well-characterizedgenes in these sets may have functions similar to the genesthat are better annotated. Sequences of 11 genes from Set7 and their human orthologs were examined for the pres-ence of clusters of TF binding sites, at least one of which isa lymphoid element, as defined in Methods. The 11 genesshared relatively few clusters of TF binding sites. Therewere 7 clusters shared by 3 genes. The largest cluster con-tained 6 elements, AP2F CDEF EGRF SP1F ZBPF ZF5F andwas shared by Irf5 and Stk10. There were 21 clustersshared by 2 genes and containing 3 to 6 TF binding sites.The composition and location of these are shown inimages from CisMols (Additional files 3,4,5,6,7,8 and 9).
Highly expressed genesIn addition to searching for potential regulatory regionswithin sets of genes clustered by similarities of patterns ofexpression across sets of tissues and within regions imme-diately upstream of exon 1, we also sought to identifygenes characterized by high expression in specificimmune tissues. It is not known whether clustering bypattern of expression across tissues and/or grouping byhigh expression in specific tissues (or neither) will be auseful way to group genes for computational identifica-
tion of regulatory elements and regulatory regions. It isclear, however, that although modules of cis-elements thatregulate expression of genes in tissues can occur at manydifferent locations relative to a gene's promoter, at leastsome regulatory elements are located within promoterregions and this is the region we have searched mostintensively for conservation of known TF binding sites.For the purposes of this analysis, we defined genes thatwere highly expressed based on their normalized expres-sion being at least 4 times higher in an individualimmune tissue relative to their median signal across theentire database. High expression in a single tissue doesnot preclude significant expression in other tissues, sohigh expression is not synonymous with unique expres-sion. We examined highly expressed mouse genes andtheir human orthologs for the presence of clusters of TFbinding sites, with the additional constraint that at leastone of the cis elements present in the cluster was a lym-phoid element, as defined in Methods. Grouped by tissue,suitable paired mouse/human orthologs were: activatedT-cells, 17 genes: Ctsz, Kpnb1, Tnfrsf9, Tnfrsf4, Myc, Mcm2,Mcm5, Mcm6, Mcm7, Gzmb, Ncf4, Gapd, Ccl4, Pcna, Rpl13,Cd86, Icsbp1; thymus, 7 genes: Satb1, Hdac7a, Sgpl1,Abca1, Prss16, Abcg1, C1qg; stimulated lymph node, 4genes, Stk10, Irf5, Cxcl9, Tnfrsf1. Identical analyses of 6genes highly expressed in skeletal muscle (Ckm, Myf6,Aldo1, Myog, Dmd, Chrm3) and 8 in liver (G6pc, Cyp7a1,Proc, Ttr, Aldo2, Ins2, Igf1, Pah) served as negative controls,i.e. not tissues that play a critical role in lymphocyte dif-ferentiation or the immune response. The MCM familyand Myc are involved in replication of DNA and chromo-somes. The TNF and TNFR families of genes encode recep-
Table 2: Examples of modules of shared cis-elements in K-cluster, set 15 genes. All elements of a module are within a 200 bp window and are present in both the human and mouse orthologs. Modules are located within 3-kb upstream of the transcription start site.
Genes
Modules of shared cis-elements Arid1a Abcg1 Sgpl1 Man2b1 Ctsl Zfp162 Tcf12
AP2F EGRF MAZF SP1F ZBPF + + + - - - -AP2F EGRF SP1F ZBPF + + + - - - -AP2F MAZF SP1F ZBPF + + + - - - -AP2F HESF MAZF SP1F + + + - - - -MAZF SP1F ZBPF + + + - - - -AP2F MAZF SP1F + + + - - - -AP2F SP1F ZBPF + + - - - - -EGRF MAZF ZBPF + + + - - - -ETSF SP1F ZBPF + + + - - - -AP2F EGRF ETSF SP1F ZBPF + + + - - - -AP2F MAZF MZF1 SP1F ZBPF + + - - - - -AP2F MAZF MZF1 SP1F + + - - - - -AP2F MZF1 SP1F ZBPF + + - - - - -ETSF MAZF SP1F + - + - - - -EGRF ETSF ZBPF + - + - - - -
Page 9 of 16(page number not for citation purposes)

BMC Genomics 2004, 5:82 http://www.biomedcentral.com/1471-2164/5/82
tors and ligands that couple directly to signaling pathwaysfor cell proliferation, survival and differentiation [41].Prss16 encodes a thymus specific protease which is specif-ically expressed by epithelial cells in the thymic cortex andplays a role in T-cell development and, perhaps, in suscep-tibility to autoimmunity [42]. Hdac7a encodes a histonedeacetylase. Members of the Hdac family of genes modifyhistones and play a role in the regulation of expression ofgenes such as those functioning in the cell cycle, apopto-sis, and transcription [43]. Cxcl9 is an inflammatorychemokine induced by interferon. Its promoter containsbinding sites for CREB, STAT1, and NFKB [44].
The results of the above approach are shown in Table 3,which lists examples of putative computationally identi-fied regulatory modules of immune genes and the cis-ele-ments that they contain. When modules of genes highlyexpressed in thymus, stimulated lymph nodes, or acti-vated T-cells were compared with one another and tomodules of genes expressed in muscle and liver, it is clearthat the composition (cis-elements) of modules are notunique to a specific gene. However there is some evidenceof unique arrangements of elements within modules.There are also cis-elements that are not commonly shared.For example, the individual cis-elements HESF, HAML,MYT1 and P53F were not found in modules of genes otherthan those highly expressed in thymus. Likewise, E2FF
Clusters of TF binding sites immediately upstream of the transcription start site in 3 genes of cluster set 15 (co-expressed genes with high expression in thymus)Figure 4Clusters of TF binding sites immediately upstream of the transcription start site in 3 genes of cluster set 15 (co-expressed genes with high expression in thymus): The upper panels compare the location of TF binding sites sur-rounding and upstream regions of transcription start site (based on the corresponding mRNA annotations from NCBI's RefSeq database) of human and mouse Arid1a, Abcg1 and Zfp162 genes in GenomeTrafac database http://genometrafac.cchmc.org. The bottom panels list the gene descriptions and each of the binding sites in their order of occurrence from distal (top) to proximal (bottom) to exon 1 of the human gene, which is on the left within each panel. Binding sites in bold are known "lymphoid ele-ments". The first nucleotide of exon 1 is at bp 40,001. Each of the colored bars represents a class of TF binding sites and con-nects homologous binding sites in genes of the two species. The orthologous genes may differ in the number and location of specific TF's binding sites. The corresponding coordinates of the regions on human (NCBI Build 35, May 2004) genome assem-bly are: chr1: 26,706,590–26,706,986 (+), chr21: 42,512,113 42,512,317 (+) and chr11: 64,302,720–64,302,924 (-) for human ARID1A, ABCG1 and SF1 respectively. Coordinates in the mouse genome assemblies (Build 33 Mouse Assembly, May 2004) are: chr4: 132,206,952–132,207,348 (-), chr19: 6,151,958–6,152,162 (+) and chr17: 29,663,342–29,663,546 (+) for Arid1a, Abcg1 and Zfp162 respectively.
Page 10 of 16(page number not for citation purposes)

BMC Genomics 2004, 5:82 http://www.biomedcentral.com/1471-2164/5/82
was only present in modules of activated T-cells, butclearly does not play a unique role in the immune system.Members of the E2F family of TFs are key participants incell proliferation, apoptosis, and differentiation [45].E2FF is found in promoters of Mcm2, Mcm5, Mcm6,Mcm7, and Myc. These genes are highly expressed in pro-liferating cells generally, an example of which is the acti-vated T-cell.
Regulatory modules, which have been proved biologicallyto regulate expression of genes, contain multiple TFbinding sites, much as is shown in Figures 2, 3 and 4.Examples of modules of shared cis-elements (i.e., within a200 bp window) in highly expressed genes are listed inTable 3. For example, of the modules highly expressed inthymus SP1F MAZF ZBPF was present in paired orthologsof Abca1, C1qg, Abcg1 and Sgpl1; module AP2F EGRFHESF MAZF SP1F ZBPF was present in Sgpl1 and Abcg1. Ofthe modules highly expressed in stimulated lymph nodes,AP2F CDEF EGRF SP1F ZBPF ZF5F was present in Stk10and Irf5; module GATA HOXF NKXH was present in Stk10and Irf5. Of the modules highly expressed in activated T-cells, E2FF EBOX ETSF MAZF SP1F ZF5F was present inKpnb1 and Mcm6; module BCL6 CREB E2FF STAT waspresent in Icsbp1 and Tnfrsf4.
DiscussionIndividual differentiated biological states can be charac-terized by gene expression profiling. Large-scale compari-sons of profiles of cells, tissues, and developmental stageshave the potential to identify a wealth of coordinately reg-ulated groups of genes that reflect the interplay of theirfunctional relationships and transcriptional controlmechanisms. We have built a database comprised of the
mRNA expression profiles of 65 normal adult and fetalC57BL/6J mouse tissues using the Incyte Mouse GEM1,8638 element, clone set. Using microarray analysis, 680sequences were identified that were highly expressed inone or more of 6 immune tissues. Many were alsoexpressed in certain other tissues. Some of these other tis-sues were organs such as heart, kidney, and brain whichdo not normally contain lymphocytes in large numbersand do not play a role in the immune response. Others,such as intestine and lung, interface with the externalenvironment, contain significant numbers of lym-phocytes, and can mount an immune response. The 680expressed sequences were filtered to remove 320 that wereexpressed in "non-immune" brain or heart or kidney. Thisresulted in a list of 360 expressed sequences called"immune genes" that were less broadly expressed in tis-sues without immune function than were the 680. Muta-tions and polymorphisms in both the 680 expressedsequences and the 360 immune genes have a significantchance of specifically affecting immune function. We pre-dict this will be more common with changes in the 360immune genes. We tested this by comparing reports ofdisease causing mutations in the 360 immune genes withthose reported for the 320 genes that were more broadlyexpressed (Online Mendelian Inheritance in Man). Of the360 mouse immune genes, 32 had an ortholog with genesymbol in OMIM and17 had annotations that described afunction clearly linked to development or function of theimmune system. Mutations in 2 (LCP2 and PARVG) causesevere immunodeficiency disease. Examples of other dis-eases caused by mutations in these 32 genes were B- andT-cell malignancies, autoimmune disorders, and reducedviral or bacterial resistance. Of the 320 genes removedfrom the list of 680, 37 had orthologs with gene symbols
Table 3: Examples of modules of shared cis-elements found in highly expressed genes in 3 immune tissues. Elements were clustered with at least 2 other cis-elements within a 200 bp window, indicating the presence of a putative regulatory module which contained at least 3 transcription factor binding sites, one of which was required to be a lymphoid element. All are located within 3 kb upstream and 100 bp downstream of the first bp of exon 1. The modules were present in the mouse and human orthologs of at least 2 genes from sets of genes that were highly expressed in thymus, stimulated lymph nodes, or activated T-cells. The number of genes for which orthologs were available: thymus, 7; lymph node, 4; activated T-cells, 17.
Thymus Stimulated Lymph Node Activated T-cell
MAZF SP1F ZBPF AP2F CDEF EGRF SP1F ZBPF ZF5F MAZF SP1F ZBPFEGRF MAZF SP1F ZBPF LHXF NKXH OCT1 RBIT CREB SP1F ZBPFETSF SP1F ZBPF EGRF ETSF NFKB E2FF MAZF SP1FAP2F EGRF HESF MAZF SP1F ZBPF GATA HOXF NKXH ECAT PCAT SP1F ZBPFETSF MAZF SP1F STAT ZBPF LHXF NKXH OCT1 ETSF MAZF MZF1AP2F EGRF ETSF SP1F ZBPF NKXH OCT1 RBIT EGRF SP1F ZBPFEGRF MAZF P53F SP1F IKRS MAZF NFKBGATA HAML MYT1 E2FF EBOX ETSF MAZF SP1F ZF5F
BCL6 CREB E2FF STATHOXF LEFF LHXF OCT1MAZF MZF1 NFKB PAX5
Page 11 of 16(page number not for citation purposes)

BMC Genomics 2004, 5:82 http://www.biomedcentral.com/1471-2164/5/82
listed in OMIM. 4 genes were expressed in lymphocytesand mutation in one, Bruton's tyrosine kinase, causesagammaglobulinemia. Mutations in other genes causeddisorders of coagulation, red cells, or granulocytes, ratherthan the immune system. We conclude that the list of 360immune genes includes a higher percentage of genes pref-erentially expressed in immunocompetent tissues andwith more specific immune-related functions than doesthe full list of 680 sequences expressed in immune tissues,but also with expression in non-immune tissues.
The 360 immune genes represent a portion of the com-plete set of genes that encode proteins and processes nec-essary for the differentiation, maintenance, and functionof the immune system. These genes are functionallydiverse and represent both ubiquitous and specialized cel-lular processes. 10 or more genes are in specific functionalclusters that carry out general processes such as DNA andchromosomal replication, cell cycle regulation, transcrip-tion, and translation. Other genes are in functional clus-ters that carry out specialized functions, largely restrictedto immune tissues. These include genes that encode pro-teins involved in antigen recognition and transport,chemokine synthesis, chemokine recognition, and theintracellular signaling cascade necessary to initiate tran-scription and new protein synthesis in lymphocytes, aspart of the host response to antigen. Functional annota-tion of these genes is a work in progress. While probablefunctions have been assigned to most of the expressedsequences and the genes that encode them, using infor-mation shown in the Additional file 1, there is much workto be done. Most functional annotations are based on thesharing of presently known protein domains andsequence homologies and provide general clues to therole a gene or protein may play in cells that participate inthe immune response to antigen. A more precise under-standing will come about as new laboratory data are cor-related with studies of the expression of specific immunegenes, their coordination with expression of other genes,and the structure and function of their products.
For several reasons, the "immune genes" that we haveidentified are not all of the genes that are expressed inimmune tissues: (1) the Incyte set of 8638 genes probablycontains representative cDNAs from 25% or less of allmouse genes; (2) genes that are essential to immunefunction, but are expressed at similar levels in immuneand other tissues will not be included in the immune set;and (3) a gene with a very low level of expression will bemissed, if cDNA made from its RNA is not present in suf-ficient quantity to give a signal on the microarray. Genesmay be included or excluded in error because of the largenumber of genes screened for expression with a limitednumber of replicates. Incyte cDNA microarrays are nolonger manufactured and no Incyte arrays or public data-
bases are available to check expression of our immunegenes in other species. There are two relevant publiclyavailable Novartis gene expression databases (GenomicsInstitute of the Novartis Research Foundation, [18]),which can be accessed. One uses Affymetrix chip U74Av2and a set of 90 mouse tissues and cell lines and the seconduses Affymetrix HG U133 and 158 human tissues andcells. Relating Affymetrix probes to Incyte cDNA probes iscomplex and the Novartis tissue sets do not contain thesame tissues we have used. However, our immune genes,when expressed on the Novartis arrays, are generallyclustered in tissues of the immunohematopoietic system,the gastrointestinal tract, and lung. These types of publiclyavailable databases will permit identification and func-tional annotation of new immune genes with consequentavailability of larger sets of coordinately regulated genesfor searches of conserved regulatory modules.
Using comparative genomics-based, cis-element analyses(http://trafac.cchmc.org[15] and http://genometrafac.cchmc.org[46]), we identified compositionally similarclusters of cis-elements in upstream regions of mouse/human orthologs of several immune genes. There was anexcellent agreement between the computationally pre-dicted and experimentally determined arrangements ofcis-elements in the promoters of the mouse H2-K andhuman HLA-A genes. Analyses of other immune genesidentified a wealth of potential immune system-specificregulatory modules. For example (Table 2), Arid1a, Abcg1,and Sgpl1 are members of a K-clustered set of immunegenes and share a phylogenetically conserved module of 5cis-elements: AP2F EGRF MAZF SP1F and ZBPF, all withina 200 bp interval. Other examples of clustered TF bindingsites that could be within regulatory modules of geneshighly expressed in specific tissues are given in RESULTS.Striking examples of putative modules include the 6 cis-element module AP2F EGRF HESF MAZF SP1F ZBPF ingenes highly expressed in thymus; the 6 cis-element mod-ule E2FF EBOX ETSF MAZF SP1F ZFSF in genes highlyexpressed in activated T-cells; and the 6 element moduleAP2F CDEF EGRF SP1F ZBPF ZF5F in genes highlyexpressed in stimulated lymph nodes (Table 3). Putativeregulatory modules are not distributed randomly acrossan entire segment of DNA, but are highly clustered withindistinct short segments that are the computationally iden-tified promoters and enhancers (Figure 3). Because of thenature of the scanning algorithm with its 200 bp window,variations of multiple modules may occur within one seg-ment. These phenomena are more easily understood byexamining Figure 3. Our data support the hypothesis that(1) regulatory modules of genes are highly clustered in afew sites that can be computationally identified, (2) mod-ules in different genes may share cis-elements that bindTFs, and (3) certain combinations of TF binding sites arephylogenetically conserved and appear to be reused across
Page 12 of 16(page number not for citation purposes)

BMC Genomics 2004, 5:82 http://www.biomedcentral.com/1471-2164/5/82
genes when specific patterns of expression are required.Cis-elements from the same family have a high probabil-ity of interacting with similar groups of transcription fac-tors, although they will not necessarily be in the sameposition relative to the transcription start site. We haveidentified genes and putative regulatory modules that playa role in the differentiation, maintenance, and function ofthe immune system. These results serve to advance bothour understanding of normal gene and immune systemfunction and also to identify genes and regulatory regionswhose mutation or polymorphic variation lead to immu-nologic disease.
MethodsC57BL/6J mice from The Jackson Laboratory were thesource of normal adult and fetal tissues. The completepanel of tissues for microarray analyses by our group hasbeen described [47]. Peripheral blood mononuclear cellswere separated from whole blood on Ficoll/Hypaque gra-dients; unstimulated lymph nodes, spleen, and thymuswere each collected from unimmunized mice and pooledseparately; "stimulated" lymph nodes were collected frommice 10 days after they were immunized with hen egg-white lysozyme (HEL) in complete Freund's adjuvant;activated T cells were prepared by enriching T cells fromperipheral blood and treating them with anti-CD3 andanti-CD28. Except for activated T-cells and pancreatic isletcells, all cells and tissues were collected in duplicate. 128preparations of poly (A)-RNA were made from 65 differ-ent tissues, checked for quality, and quantified as previ-ously described [19,47].
Microarray analyses were carried out using Incyte mouseGEM1 cDNA arrays (Incyte Genomics, Palo Alto, CA), asdescribed previously for our group [19,47]. Relative abun-dance of probes was calculated as the ratio of the samplevalue against the value from the labeled whole mouse ref-erence cDNA for each gene on each array. Data analyseswere carried out with GeneSpring version 4.2.1 (SiliconGenetics) software, including filtering, K-means and hier-archical clustering. A list of all tissues in the full set of 65normal adult and fetal tissues is provided in Additionalfile 12. Our analyses focused on comparison gene expres-sion in 18 tissues that were selected to represent a varietyof adult and fetal tissues (Figure 1B), most with immuno-logical function. 6 of the 18 tissues were the "immunetissues" – unstimulated and stimulated lymph nodes,spleen, peripheral blood mononuclear cells, activated T-cells, and thymus. The remaining 12 tissues of the 18 tis-sue set were: fetal day 16.5 intestine and lung; adult duo-denum, jejunum, ileum, proximal and distal colon; adultlung and liver, and joint synovium from normal adultmice and mice with acute and chronic arthritis. All perti-nent microarray data are available through the Children'sHospital Research Foundation expression database web
server http://genet.chmcc.org within the ExpressionDBfolders of the Incyte Mouse GEM1 chip genome.
Genes on the Incyte array were identified by NCBI Gen-Bank accession and systematic numbers and by gene sym-bol, where available. For those sequences that could notbe assigned a gene symbol, sequence homologies toknown mouse genes were sought using MouseBLAST [23],BLAT [12], MGD [23], and LocusLink [24]. BLAST com-parisons of the human and mouse confirmed Ensemblpredictions of human orthologs of mouse genes. Identityof genes was confirmed by BLAST comparison of the Gen-Bank sequences from NCBI http://www.ncbi.nlm.nih.gov[48] with Ensembl [13] sequences.When downloading the genomic sequences with flankingsequences, it was important to have an mRNA that con-tained exon 1, so the site of initiation of transcription wascorrectly identified. Presence of an upstream exon 1 in anisoform would lead to re-defining of the promoter andintronic regions. Criteria for presence of exon 1 included:comparison of the number and location of exons inorthologous genes, alignment of transcripts of the gene asreported by different databases, and alignment of the 5'end of the transcript with the putative start site and signalsin the gene. In cases where we encountered multiple highscoring transcript hits against the genome, we manuallylooked into the alignments to rule out the occurrence ofpseudogenes that frequently lacked introns when com-pared to the "true" genes. Additional information aboutsequences of both the transcript and the gene wasobtained from UCSC Golden Path [12]. Confirmation ofthe presence of exon 1 in orthologs was particularlyimportant because of the need to locate the start site oftranscription. Computational prediction of exons is errorprone. DNA sequences of genes were downloaded toinclude at least 10,000 flanking base pairs upstream anddownstream of the first and last exons respectively. TheNovember 2002 and April 2003 assemblies of human andthe February 2002 and February 2003 assemblies ofmouse genome were used for this purpose dependingupon their availability at the time of our analyses (Addi-tional files 10 and 11 list relevant FASTA sequences andgenomic coordinates).
The GO and MGI databases were searched for annotationsof the immune genes, using Stanford SOURCE http://source.stanford.edu[40]. For genes not found or incom-pletely annotated, manual annotation was done using cri-teria similar to the Gene Ontology (GO) [49], MouseGenome Informatics (MGI) [23], and LocusLink classifi-cations http://www.ncbi.nlm.nih.gov/LocusLink[50]. Afunction was assigned if the encoded protein containeddistinctive InterPro functional domains, or sequence sim-ilarity to paralogs previously annotated, or sequence sim-ilarity to functionally characterized SwissProt/TrEMBL
Page 13 of 16(page number not for citation purposes)
BMC Genomics 2004, 5:82 http://www.biomedcentral.com/1471-2164/5/82
proteins. Using the information about structure and func-tion, the authors simplified annotations and groupedgenes by major functions, such as antigen binding andprocessing (defense – immune function), transcription,protein synthesis, apoptosis, cell division. Highly detailedannotations are provided in the supplementary materials(Additional file 1).
To identify putative consensus cis-acting regulatorysequences in genes that were coordinately regulated, wefirst selected groups of genes based on their expressionpatterns in different immune tissues. The completegenomic sequences (with flanking upstream and down-stream regions of 40 kb) of the selected genes and theirorthologs were extracted from the Ensembl/UCSC humanand mouse databases [12,13]. Where available the NCBI-RefSeq mRNAs were used as references for downloadingthe genomic sequences with upstream and downstreamgene flanking regions of 40 kb. The transcription start sitewas thus at 40,000 in the downloaded sequences used incomparative genomic analysis for identification of poten-tial regulatory clusters using Trafac server [15]. Repeat ele-ments were masked using the RepeatMasker http://ftp.genome.washington.edu[51]. Conserved clusters ofregulatory elements in the evolutionarily conserved non-coding regions of mouse and human orthologs were dis-played using the TraFaC http://trafac.cchmc.org[15] orGenomeTraFaC http://genometrafac.cchmc.org[46] serv-ers which integrate results from MatInspector Professional(Version 4.1, 2004; 356 individual matrices in 138 fami-lies) http://www.genomatix.de[52] and Advanced Pip-Maker (chaining option) http://pipmaker.bx.psu.edu/cgi-bin/pipmaker?advanced[53] programs. We comparedconserved putative cis-regulatory regions of each of thedifferent groups of genes from mouse and human to iden-tify known TF binding sites. The CisMols analyzer http://cismols.cchmc.org[22] permits selection of TFs that mustbe present in clusters of TFs that constitute a putative reg-ulatory module. To convey specificity to the search formodules relevant to regulation of gene expression inimmune tissues, we required the presence of one or moreof the following TFs, which we call "lymphoid elements".They have been reported to play a role in some aspect oflymphoid biology (see for example, [1-3]: BCL6, CMYB,CREB, EGRF, ETSF, GATA, IKRS, IRFF, MZF1, NFAT,NFKB, OCT1 (site also binds OCT2), PAX5, SP1F, VMYB,and WHZF. ECAT and PCAT were also included becauseof their frequent occurrence in promoters at the start oftranscription. The search was limited to a region 3 kbupstream and 100 bp downstream of the start site of exon1 (based on the NCBI-RefSeq mRNA annotations). This iswhere the promoter and associated regulatory elementswould be expected, given that additional regulatory ele-ments (enhancers/silencers) are almost certain to belocated elsewhere. Images of the CisMols analyses of
genes to identify regulatory elements are also provided insupplementary materials (Additional files 3 to 9). Oneexample is shown in Figure 3.
Authors' contributionsJJH and BJA were primarily responsible for the design,coordination and conduct of the study. AGJ and AG wereresponsible for regulatory region analyses and softwaredevelopment. AGJ was responsible for ortholog analysisand novel ortholog assignments. JJH, BJA and AGJ draftedthe manuscript and figures and JJH, BJA and AGJ contrib-uted editorial revisions. SK, SW and CE were responsiblefor generating, quality assurance, and initial assembly ofthe gene chip data. JDK provided purified lymphoid cells,read the manuscript and provided comments and discus-sion. All authors read and approved the final manuscript.
Additional material
Additional File 1List and annotation of 360 expressed sequences ("immune genes").Click here for file[http://www.biomedcentral.com/content/supplementary/1471-2164-5-82-S1.xls]
Additional File 10FASTA sequences and the corresponding coordinates on the human and mouse genome assemblies (May 2004) of the promoter regions used in the analysis and displayed in figures 2 and 4.Click here for file[http://www.biomedcentral.com/content/supplementary/1471-2164-5-82-S10.doc]
Additional File 2Using K-means clustering in GeneSpring (Version 4.2.1), 160 annotated genes, were divided into distinct sets based on similarity of expression pat-terns across 15 tissues. Tissues were given equal weight, the number of clusters was set at 20, and similarity was measured by standard correlation.Click here for file[http://www.biomedcentral.com/content/supplementary/1471-2164-5-82-S2.xls]
Additional File 11FASTA sequences and the corresponding coordinates on the human and mouse genome assemblies (May 2004) of the promoter regions used in the analysis and displayed in figures 2 and 4.Click here for file[http://www.biomedcentral.com/content/supplementary/1471-2164-5-82-S11.doc]
Additional File 3CisMols display of location and composition of clusters of cis-elements that are putative regulatory modules for the genes in various groups (test and control). Each colored cube indicates a cluster of 3 or more cis-elements with at least one "lymphoid element". The region searched is upstream 3 kb and downstream 100 bp of transcription start site (as defined by the respective mRNAs from NCBI's RefSeq database). The legend in the lower left half of the figure indicates the composition of each of the modules and the genes that share them.
Page 14 of 16(page number not for citation purposes)
BMC Genomics 2004, 5:82 http://www.biomedcentral.com/1471-2164/5/82
AcknowledgementsThis work was supported in part by an award from the Howard Hughes Medical Institute to the University of Cincinnati for the development of Bio-informatics Core Resources, and by grants NIEHS U01 ES11038 and ES06096 Mouse Centers Genomics Consortium, Center for Environmental Genetics, NCI Mouse Models of Human Cancer Consortium and the National Library of Medicine G08 LM007853 IAIMS. We thank Amy Sher-man of Incyte Genomics, Andrew Conway of Silicon Genetics, Paul Spell-man and Rodney DeKoter for valuable discussion.
References1. Glimcher LH, Singh H: Transcription factors in lymphocyte
development--T and B cells get together. Cell 1999, 96:13-23.2. O'Riordan M, Grosschedl R: Transcriptional regulation of early
B-lymphocyte differentiation. Immunol Rev 2000, 175:94-103.3. Schebesta M, Heavey B, Busslinger M: Transcriptional control of
B-cell development. Curr Opin Immunol 2002, 14:216-223.4. Li R, Pei H, Watson DK: Regulation of Ets function by protein -
protein interactions. Oncogene 2000, 19:6514-6523.5. Rothenberg EV, Anderson MK: Elements of transcription factor
network design for T-lineage specification. Dev Biol 2002,246:29-44.
6. Aronow BJ, Ebert CA, Valerius MT, Potter SS, Wiginton DA, WitteDP, Hutton JJ: Dissecting a locus control region: facilitation ofenhancer function by extended enhancer-flankingsequences. Mol Cell Biol 1995, 15:1123-1135.
7. Boss JM: Regulation of transcription of MHC class II genes.Curr Opin Immunol 1997, 9:107-113.
8. Agarwal S, Rao A: Long-range transcriptional regulation ofcytokine gene expression. Curr Opin Immunol 1998, 10:345-352.
9. Hawwari A, Burrows J, Vadas MA, Cockerill PN: The human IL-3locus is regulated cooperatively by two NFAT-dependentenhancers that have distinct tissue-specific activities. JImmunol 2002, 169:1876-1886.
Click here for file[http://www.biomedcentral.com/content/supplementary/1471-2164-5-82-S3.pdf]
Additional File 4CisMols display of location and composition of clusters of cis-elements that are putative regulatory modules for the genes in various groups (test and control). Each colored cube indicates a cluster of 3 or more cis-elements with at least one "lymphoid element". The region searched is upstream 3 kb and downstream 100 bp of transcription start site (as defined by the respective mRNAs from NCBI's RefSeq database). The legend in the lower left half of the figure indicates the composition of each of the modules and the genes that share them.Click here for file[http://www.biomedcentral.com/content/supplementary/1471-2164-5-82-S4.pdf]
Additional File 5CisMols display of location and composition of clusters of cis-elements that are putative regulatory modules for the genes in various groups (test and control). Each colored cube indicates a cluster of 3 or more cis-elements with at least one "lymphoid element". The region searched is upstream 3 kb and downstream 100 bp of transcription start site (as defined by the respective mRNAs from NCBI's RefSeq database). The legend in the lower left half of the figure indicates the composition of each of the modules and the genes that share them.Click here for file[http://www.biomedcentral.com/content/supplementary/1471-2164-5-82-S5.pdf]
Additional File 6CisMols display of location and composition of clusters of cis-elements that are putative regulatory modules for the genes in various groups (test and control). Each colored cube indicates a cluster of 3 or more cis-elements with at least one "lymphoid element". The region searched is upstream 3 kb and downstream 100 bp of transcription start site (as defined by the respective mRNAs from NCBI's RefSeq database). The legend in the lower left half of the figure indicates the composition of each of the modules and the genes that share them.Click here for file[http://www.biomedcentral.com/content/supplementary/1471-2164-5-82-S6.pdf]
Additional File 7CisMols display of location and composition of clusters of cis-elements that are putative regulatory modules for the genes in various groups (test and control). Each colored cube indicates a cluster of 3 or more cis-elements with at least one "lymphoid element". The region searched is upstream 3 kb and downstream 100 bp of transcription start site (as defined by the respective mRNAs from NCBI's RefSeq database). The legend in the lower left half of the figure indicates the composition of each of the modules and the genes that share them.Click here for file[http://www.biomedcentral.com/content/supplementary/1471-2164-5-82-S7.pdf]
Additional File 8
CisMols display of location and composition of clusters of cis-elements that are putative regulatory modules for the genes in various groups (test and control). Each colored cube indicates a cluster of 3 or more cis-elements with at least one "lymphoid element". The region searched is upstream 3 kb and downstream 100 bp of transcription start site (as defined by the respective mRNAs from NCBI's RefSeq database). The legend in the lower left half of the figure indicates the composition of each of the modules and the genes that share them.Click here for file[http://www.biomedcentral.com/content/supplementary/1471-2164-5-82-S8.pdf]
Additional File 9CisMols display of location and composition of clusters of cis-elements that are putative regulatory modules for the genes in various groups (test and control). Each colored cube indicates a cluster of 3 or more cis-elements with at least one "lymphoid element". The region searched is upstream 3 kb and downstream 100 bp of transcription start site (as defined by the respective mRNAs from NCBI's RefSeq database). The legend in the lower left half of the figure indicates the composition of each of the modules and the genes that share them.Click here for file[http://www.biomedcentral.com/content/supplementary/1471-2164-5-82-S9.pdf]
Additional File 12Tissue lists used in the generation of microarray profile data.Click here for file[http://www.biomedcentral.com/content/supplementary/1471-2164-5-82-S12.xls]
Page 15 of 16(page number not for citation purposes)

BMC Genomics 2004, 5:82 http://www.biomedcentral.com/1471-2164/5/82
10. Goebel P, Montalbano A, Ayers N, Kompfner E, Dickinson L, WebbCF, Feeney AJ: High frequency of matrix attachment regionsand cut-like protein x/CCAAT-displacement protein and Bcell regulator of IgH transcription binding sites flanking Ig Vregion genes. J Immunol 2002, 169:2477-2487.
11. Oeltjen JC, Malley TM, Muzny DM, Miller W, Gibbs RA, Belmont JW:Large-scale comparative sequence analysis of the humanand murine Bruton's tyrosine kinase loci reveals conservedregulatory domains. Genome Res 1997, 7:315-329.
12. Karolchik D, Baertsch R, Diekhans M, Furey TS, Hinrichs A, Lu YT,Roskin KM, Schwartz M, Sugnet CW, Thomas DJ, Weber RJ, HausslerD, Kent WJ: The UCSC Genome Browser Database. NucleicAcids Res 2003, 31:51-54.
13. ENSEMBL [http://www.ensembl.org]14. Hardison R, Slightom JL, Gumucio DL, Goodman M, Stojanovic N,
Miller W: Locus control regions of mammalian beta-globingene clusters: combining phylogenetic analyses and experi-mental results to gain functional insights. Gene 1997,205:73-94.
15. Jegga AG, Sherwood SP, Carman JW, Pinski AT, Phillips JL, Pestian JP,Aronow BJ: Detection and visualization of compositionallysimilar cis-regulatory element clusters in orthologous andcoordinately controlled genes. Genome Res 2002, 12:1408-1417.
16. Loots GG, Locksley RM, Blankespoor CM, Wang ZE, Miller W, RubinEM, Frazer KA: Identification of a coordinate regulator ofinterleukins 4, 13, and 5 by cross-species sequencecomparisons. Science 2000, 288:136-140.
17. Haverty PM, Weng Z, Best NL, Auerbach KR, Hsiao LL, Jensen RV,Gullans SR: HugeIndex: a database with visualization tools forhigh-density oligonucleotide array data from normal humantissues. Nucleic Acids Res 2002, 30:214-217.
18. Su AI, Cooke MP, Ching KA, Hakak Y, Walker JR, Wiltshire T, OrthAP, Vega RG, Sapinoso LM, Moqrich A, Patapoutian A, Hampton GM,Schultz PG, Hogenesch JB: Large-scale analysis of the humanand mouse transcriptomes. Proc Natl Acad Sci U S A 2002,99:4465-4470.
19. Bates MD, Erwin CR, Sanford LP, Wiginton D, Bezerra JA, SchatzmanLC, Jegga AG, Ley-Ebert C, Williams SS, Steinbrecher KA, WarnerBW, Cohen MB, Aronow BJ: Novel genes and functional rela-tionships in the adult mouse gastrointestinal tract identifiedby microarray analysis. Gastroenterology 2002, 122:1467-1482.
20. Loots GG, Ovcharenko I, Pachter L, Dubchak I, Rubin EM: rVista forcomparative sequence-based discovery of functional tran-scription factor binding sites. Genome Res 2002, 12:832-839.
21. Wasserman WW, Palumbo M, Thompson W, Fickett JW, LawrenceCE: Human-mouse genome comparisons to locate regula-tory sites. Nat Genet 2000, 26:225-228.
22. CisMolsAnalyzer [http://cismols.cchmc.org]23. Blake JA, Richardson JE, Bult CJ, Kadin JA, Eppig JT: MGD: the
Mouse Genome Database. Nucleic Acids Res 2003, 31:193-195.24. NCBI-LocusLink [http://www.ncbi.nlm.nih.gov/LocusLink]25. HGNC [http://www.gene.ucl.ac.uk/nomenclature]26. Kelly TJ, Brown GW: Regulation of chromosome replication.
Annu Rev Biochem 2000, 69:829-880.27. Leo A, Wienands J, Baier G, Horejsi V, Schraven B: Adapters in
lymphocyte signaling. J Clin Invest 2002, 109:301-309.28. Hermiston ML, Xu Z, Majeti R, Weiss A: Reciprocal regulation of
lymphocyte activation by tyrosine kinases and phosphatases.J Clin Invest 2002, 109:9-14.
29. Schindler CW: Series introduction. JAK-STAT signaling inhuman disease. J Clin Invest 2002, 109:1133-1137.
30. van den Elsen PJ, Gobin SJ, van Eggermond MC, Peijnenburg A: Reg-ulation of MHC class I and II gene transcription: differencesand similarities. Immunogenetics 1998, 48:208-221.
31. Schorpp M, Hofmann M, Dear TN, Boehm T: Characterization ofmouse and human nude genes. Immunogenetics 1997,46:509-515.
32. Kaye J: Regulation of T cell development in the thymus. Immu-nol Res 2000, 21:71-81.
33. Yamaguchi K, Near RI, Matulka RA, Shneider A, Toselli P, TrombinoAF, Sherr DH: Activation of the aryl hydrocarbon receptor/transcription factor and bone marrow stromal cell-depend-ent preB cell apoptosis. J Immunol 1997, 158:2165-2173.
34. Eisen MB, Spellman PT, Brown PO, Botstein D: Cluster analysisand display of genome-wide expression patterns. Proc NatlAcad Sci U S A 1998, 95:14863-14868.
35. Staudt LM, Brown PO: Genomic views of the immune system*.Annu Rev Immunol 2000, 18:829-859.
36. Alizadeh AA, Staudt LM: Genomic-scale gene expression profil-ing of normal and malignant immune cells. Curr Opin Immunol2000, 12:219-225.
37. Spellman PT, Sherlock G, Zhang MQ, Iyer VR, Anders K, Eisen MB,Brown PO, Botstein D, Futcher B: Comprehensive identificationof cell cycle-regulated genes of the yeast Saccharomyces cer-evisiae by microarray hybridization. Mol Biol Cell 1998,9:3273-3297.
38. Tavazoie S, Hughes JD, Campbell MJ, Cho RJ, Church GM: System-atic determination of genetic network architecture. Nat Genet1999, 22:281-285.
39. Ohler U, Niemann H: Identification and analysis of eukaryoticpromoters: recent computational approaches. Trends Genet2001, 17:56-60.
40. Diehn M, Sherlock G, Binkley G, Jin H, Matese JC, Hernandez-Bous-sard T, Rees CA, Cherry JM, Botstein D, Brown PO, Alizadeh AA:SOURCE: a unified genomic resource of functional annota-tions, ontologies, and gene expression data. Nucleic Acids Res2003, 31:219-223.
41. Locksley RM, Killeen N, Lenardo MJ: The TNF and TNF receptorsuperfamilies: integrating mammalian biology. Cell 2001,104:487-501.
42. Cheunsuk S, Sparks R, Noveroske JK, Hsu T, Justice MJ, GershwinME, Gruen JR, Bowlus CL: Expression, genomic structure andmapping of the thymus specific protease prss16: a candidategene for insulin dependent diabetes mellitus susceptibility. JAutoimmun 2002, 18:311-316.
43. de Ruijter AJ, van Gennip AH, Caron HN, Kemp S, van KuilenburgAB: Histone deacetylases (HDACs): characterization of theclassical HDAC family. Biochem J 2003, 370:737-749.
44. Hiroi M, Ohmori Y: The transcriptional coactivator CREB-binding protein cooperates with STAT1 and NF-kappa B forsynergistic transcriptional activation of the CXC ligand 9/monokine induced by interferon-gamma gene. J Biol Chem2003, 278:651-660.
45. DeGregori J: The genetics of the E2F family of transcriptionfactors: shared functions and unique roles. Biochim Biophys Acta2002, 1602:131-150.
46. GenomeTraFaC [http://genometrafac.cchmc.org]47. Zhang J, Xu M, Aronow B: Expression profiles of 109 apoptosis
pathway-related genes in 82 mouse tissues and experimentalconditions. Biochem Biophys Res Commun 2002, 297:537-544.
48. NCBI-GenBank [http://www.ncbi.nlm.nih.gov]49. GeneOntology [http://www.geneontology.org]50. Baldarelli RM, Hill DP, Blake JA, Adachi J, Furuno M, Bradt D, Corbani
LE, Cousins S, Frazer KS, Qi D, Yang L, Ramachandran S, Reed D, ZhuY, Kasukawa T, Ringwald M, King BL, Maltais LJ, McKenzie LM, SchrimlLM, Maglott D, Church DM, Pruitt K, Eppig JT, Richardson JE, KadinJA, Bult CJ: Connecting sequence and biology in the labora-tory mouse. Genome Res 2003, 13:1505-1519.
51. Repeat Masker [http://ftp.genome.washington.edu]52. Quandt K, Frech K, Karas H, Wingender E, Werner T: MatInd and
MatInspector: new fast and versatile tools for detection ofconsensus matches in nucleotide sequence data. Nucleic AcidsRes 1995, 23:4878-4884.
53. Schwartz S, Zhang Z, Frazer KA, Smit A, Riemer C, Bouck J, Gibbs R,Hardison R, Miller W: PipMaker--a web server for aligning twogenomic DNA sequences. Genome Res 2000, 10:577-586.
Page 16 of 16(page number not for citation purposes)
Top Related
Copyright © 2022 FDOKUMEN

