


Bahasa
Halaman
Hukum

Leadership Institute
Leadership Institute Faculty Publications
University of Nebraska - Lincoln Year
Measuring cognitive ability with the
overclaiming technique
Delroy L. Paulhus∗ Peter D. Harms†
∗University of British Columbia Faculty of Medicine, [email protected]†University of Nebraska - Lincoln, [email protected]
This paper is posted at DigitalCommons@University of Nebraska - Lincoln.
http://digitalcommons.unl.edu/leadershipfacpub/10

297
Published in Intelligence 32 (2004), pp. 297–314; doi:10.1016/j.intell.2004.02.001 Copyright © 2004 Elsevier Inc. Used by permission. http://www.sciencedirect.com
Submitted August 30, 2001; revised February 5, 2004; accepted February 11, 2004; published online April 2, 2004.
Measuring cognitive ability with the overclaiming technique
Delroy L. Paulhus & P. D. Harms Department of Psychology, University of British Columbia, Vancouver, Canada V6T 1Z4
Corresponding author — D. L. Paulhus, tel 604 822-3286, fax 604 822-6923, email [email protected]
Abstract The overclaiming technique requires respondents to rate their familiarity with a list of general knowledge items (persons, places, things). Because 20% of the items are foils (i.e., do not exist), the response pattern can be analyzed with signal detection methods to yield the accuracy and bias scores for each respondent. In Study 1, the accuracy in-dex showed strong associations with two standard IQ tests (β = .50–.59). Study 2 rep-licated the validity of the accuracy index with IQ and showed coherent associations with school grades, peer ratings, and self-ratings. Study 3 ensured that the validity of the accuracy index is invulnerable to a warning about foils. Study 4 showed that valid-ity is maintained even when the ratings are completed at home. The discussion focuses on the advantages of this self-report approach over standard ability tests, namely, min-imal stress, lack of time limit, or need for supervision, and flexibility of content.
Keywords: overclaiming, questionnaire, cognitive ability
1. Introduction
For good reasons, most psychometricians are skeptical that cognitive ability can be measured with a self-report instrument. Such skepticism is justifiable in light of surveys indicating that the huge majority of surveyed individuals claim that they are above average in intelligence (e.g., Brown, 1997). This high rate of self-perceived intelligence can be explained by the fact that people use id-iosyncratic definitions of intelligence that ensure a high ranking for themselves (Dunning & Co-hen, 1992).
A recent review of self-report intelligence measures (including multi-item composites) indi-cated that their validities rarely exceed .25 in college samples and .40 in the general population (Paulhus, Lysy, & Yik, 1998). Although these validities are no worse than typical self-report per-

298 D. L. Pau L h u s & P. D. har ms i n Int el l I g en c e 32 (2004)
sonality measures, ability researchers have consistently opted for more objectively scored ability measures such as standard IQ tests. Nonetheless, the search for a better self-report measure per-sists because of its potential for overcoming the stressful administration context of standard per-formance tests.
1.1. The overclaiming technique
A potential solution—the overclaiming technique—was introduced by Paulhus and Bruce (1990). Respondents are asked to rate their familiarity with a large set of items (e.g., people, places, books, etc.). A set of 150 items was compiled systematically from comprehensive lists provided by Hirsch (1988) in the appendix of his book, Cultural Literacy. Hirsch argued that the 4600 items in his book capture the corpus of knowledge necessary to be an educated American: One should be able to recognize and provide some context for each of them. Paulhus and Bruce organized the items into eight categories: historical names and events, fine arts, language, books and poems, authors and characters, social science and law, physical sciences, and life sciences. Two additional categories of items, 20th century culture and consumer products, were added to yield a grand total of 150 items in 10 categories. The instrument was dubbed the Overclaiming Questionnaire (OCQ-150).
Respondents are asked to rate their familiarity with each item on a scale ranging from 0 (never heard of it) to 6 (know it very well). One sample page from the OCQ-150 is presented in Table 1. Within each category, 3 out of every 15 items are foils, that is, they do not actually exist. Hence, any degree of familiarity with them constitutes overclaiming. The three foils for each category were selected to resemble the 12 real items and thus appeared plausible to a nonexpert. In total, overclaiming is possible on 30 of 150 items spread across a variety of topics. Given the general ac-ademic content of the items, a respondent’s pattern of familiarity ratings on the OCQ-150 can be used to estimate the individual’s cognitive ability (and response style as well). The rationale is that a person’s general knowledge (i.e., crystallized intelligence) can be indexed by the proportion of valid familiarity claims relative to the proportion of overclaiming.
1.2. Signal detection analysis
Given the nature of responses to such familiarity items, we concluded that signal detection analy-sis (Swets, 1964) was ideal. Within this framework, responses are assumed to fall into one of four
Table 1. Format of the Overclaiming Questionnaire (OCQ-150)
0 1 2 3 4 5 6 Never heard of it Know it well
Using the above scale as a guideline, write a number from 0 to 6 beside each item to indicate how familiar you are with it. Physical sciences
____ Manhattan Project ____ Asteroid ____ Nuclear fusion ____ Cholarine* ____ Atomic number ____ Hydroponics ____ Alloy ____ Plate tectonics ____ Photon ____ Ultralipid* ____ Centripetal force ____ Plates of parallax* ____ Nebula ____ Particle accelerator ____ Satellite
The items with asterisks are foils. Nine other categories of items are included.
me as ur i n g c o g n i ti v e ab i L i ty w i th th e o v er c L ai mi n g tec h n i q u e 299
categories: (1) hits: rating real items as familiar, (2) false alarms: rating foils as familiar, (3) misses: rating real items as unfamiliar, and (4) correct rejections: rating foils as unfamiliar. Signal detection analysis employs these proportions of such responses in the calculation of separate indexes for accuracy and response bias. Accuracy can be indexed (in various formulas) by the number of hits relative to the number of false alarms. The best known of the formulas is d prime, although other formulas such as the difference between hit rate and false-alarm rate (difference score) are more in-tuitively compelling (Macmillan & Creelman, 1991; Paulhus & Petrusic, 2002; Swets, 1986). An ac-curate individual, then, is not the one scoring the most hits, but the one scoring the most hits rel-ative to false alarms.
A distinct advantage of the signal detection approach is the information added by the second parameter, response bias. A high score indicates a stylistic tendency to say ‘‘Yes, I recognize that item’’ versus ‘‘No, I do not recognize that item.’’ This bias is assumed to operate on the ratings of both existent and nonexistent items. Various operationalizations of bias have their pros and cons (Macmillan & Creelman, 1990). The most popular index, beta, has statistical properties that rule it out for the analysis of familiarity data.1 Instead, we opted for “c,” the location of the criterion, and the overall yes rate as our indexes of bias (Paulhus & Petrusic, 2002). To avoid confusion, we will score all bias indexes such that a high score reflects a tendency to say “yes.”
In our preliminary study (Paulhus & Bruce, 1990), the accuracy scores derived from the OCQ-150 showed all positive (and often substantial) intercorrelations across the 10 content domains. A factor analysis of the 10 scores revealed a dominant first principal component showing all positive loadings and explaining 44% of the variance. This convergence suggests a general knowledge fac-tor tapping crystallized intelligence (Horn & Cattell, 1966; Rolfhus & Ackerman, 1996). The bias scores also showed substantial intercorrelations across the 10 domains of knowledge. This consis-tency suggested that the same individuals were overclaiming across all domains.
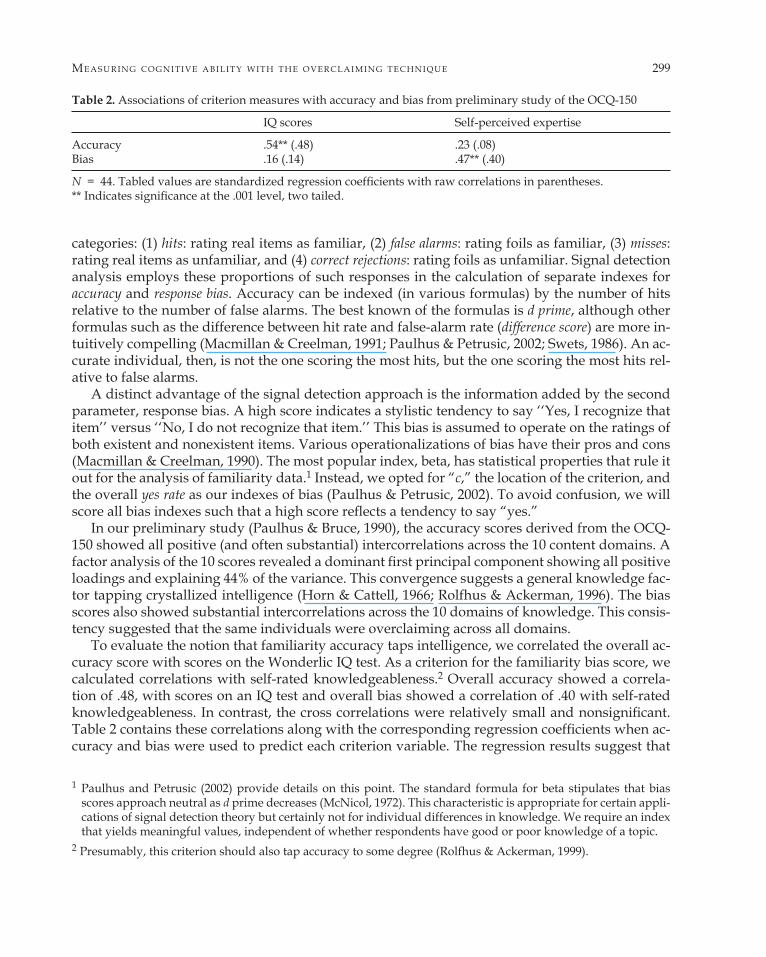
To evaluate the notion that familiarity accuracy taps intelligence, we correlated the overall ac-curacy score with scores on the Wonderlic IQ test. As a criterion for the familiarity bias score, we calculated correlations with self-rated knowledgeableness.2 Overall accuracy showed a correla-tion of .48, with scores on an IQ test and overall bias showed a correlation of .40 with self-rated knowledgeableness. In contrast, the cross correlations were relatively small and nonsignificant. Table 2 contains these correlations along with the corresponding regression coefficients when ac-curacy and bias were used to predict each criterion variable. The regression results suggest that
Table 2. Associations of criterion measures with accuracy and bias from preliminary study of the OCQ-150
IQ scores Self-perceived expertise
Accuracy .54** (.48) .23 (.08) Bias .16 (.14) .47** (.40)
N = 44. Tabled values are standardized regression coefficients with raw correlations in parentheses. ** Indicates significance at the .001 level, two tailed.
1 Paulhus and Petrusic (2002) provide details on this point. The standard formula for beta stipulates that bias scores approach neutral as d prime decreases (McNicol, 1972). This characteristic is appropriate for certain appli-cations of signal detection theory but certainly not for individual differences in knowledge. We require an index that yields meaningful values, independent of whether respondents have good or poor knowledge of a topic.
2 Presumably, this criterion should also tap accuracy to some degree (Rolfhus & Ackerman, 1999).
300 D. L. Pau L h u s & P. D. har ms i n Int el l I g en c e 32 (2004)
accuracy scores tap ability whereas bias scores tap both ability and self-enhancement. Although the sample size was too small (N = 44) to draw firm conclusions, these preliminary results were encouraging.
1.3. The present studies
To follow up that preliminary work, we conducted four studies evaluating the ability of the fa-miliarity accuracy index to predict diverse measures of cognitive ability. Study 1 confirmed its predictive validity using two established performance measures (i.e., IQ tests). Study 2 ex-panded the criterion measures to include a wide variety of indicators of cognitive ability. Study 3 demonstrated the robustness of the accuracy index’s validity under faking instructions. Study 4 demonstrated that validity is maintained even when participants completed the familiarity ratings at home.
2. Study 1: Establishing predictive validity
We began with a direct evaluation of the validities of both the accuracy and bias indexes of the OCQ-150. The validity of each index was operationalized as the convergent correlation with ac-cepted trait measures of cognitive ability and response bias. Two standard ability tests, the Won-derlic IQ test and the Quick Word Test, were chosen for their brevity and documented validity. The criterion for response bias was the Narcissistic Personality Inventory (NPI), considered by most commentators to be the best available measure of trait self-enhancement. The tendency to claim superior competence is a central part of the concept of ‘‘normal narcissism.’’
2.1. Method
Participants were 128 students, 55 male and 73 female, enrolled in third-year psychology courses at a large Canadian university. Various tests were administered and scored for class demonstra-tion purposes. After the course was completed, the participants were asked if their data could be analyzed for research purposes. All agreed.
2.1.1. Instruments 2.1.1.1. Cognitive ability. Two well-documented measures were chosen. The Wonderlic IQ test (Wonderlic, 1977) comprises 50 items sampled from verbal, quantitative, and analytic domains. Although a 12-minute time limit is imposed, the Wonderlic behaves more like a power test than a speeded test because the items are presented in ascending order of difficulty (McKelvie, 1989).
The measure is very popular in applied settings because of its ease of administration and com-prehensive norms combined with ample reliability and validity evidence (Dodrill, 1981). Expert reviews have been highly favorable (e.g., Aiken, 1996; Schmidt, 1985; Schoenfeldt, 1985). Test–re-test reliabilities range from .82 to .94 (Wonderlic, 1992). Previous studies in college populations have demonstrated its predictive validity for college grades (McKelvie, 1989), self-ratings of intel-ligence (Paulhus et al., 1998), and supervisory rankings (Wonderlic, 1992).
Our second ability measure was the Quick Word Test (Borgatta & Corsini, 1964). The 100-item power vocabulary test was designed to serve as a substitute for longer measures of cog-

me as ur i n g c o g n i ti v e ab i L i ty w i th th e o v er c L ai mi n g tec h n i q u e 301
nitive ability: The rationale was that verbal knowledge is a strong indicator of overall mental ability, yet, is relatively easy to measure. Substantial validation has accumulated over 40 years, including demonstrations of concurrent validity with standard tests such as the WAIS (e.g., Bass, 1974; Glynn, Okun, Muth, & Britton, 1983). Our participants were given an 8-minute time limit.
2.1.1.2. Trait self-enhancement. The NPI (Raskin & Hall, 1979) is a well-validated measure of nor-mal narcissism. The 40-item forced choice version shows strong convergent validity with expert judgment and self-enhancement behavior (Emmons, 1984, 1987; John & Robins, 1994; Rhodewalt & Morf, 1995; Robins & Beer, 2001). Among its strongest and most robust behavioral correlates is self-enhancement (e.g., John & Robins, 1994; Gosling, John, Craik, & Robins, 1998; Paulhus, 1998). A sample narcissistic option is: ‘‘I would make a great leader,’’ and a sample nonnarcissistic op-tion is ‘‘I am just an average person.’’
2.2. Procedure
The four measures were administered in separate sessions—all in large group settings. The time limits for the Wonderlic and Quick Word Test tests were 12 and 8 min, respectively. No time limit was placed on responses to the OCQ-150 but no one took longer than 15 min. On all four mea-sures, the participants were asked to mark their identity with their student numbers.
2.3. Results
2.3.1. Signal detection indexes All signal detection indexes are calculated from hit and false alarm rates (Swets, 1964). For each of our participants, the hit rate was calculated as the proportion of the 120 real items with which the individual claimed some familiarity. The false-alarm rate was the corresponding proportion of the 30 foils with which the participant claimed some familiarity. From these values, two pairs of ac-curacy and bias indexes were calculated using standard signal detection formulas (MacMillan & Creelman, 1991). The first pair, we label the standard pair, where the accuracy index was d prime and the bias index was the location of the criterion (c). The second pair, chosen partially for their simplicity, was labeled the common-sense pair, where the accuracy index was the difference score (hit rate minus false-alarm rate) and the bias index was the yes rate (hit rate plus false-alarm rate). To exploit all the data, these calculations were performed at each cut-off on the seven-point re-sponse scale. Hence, for each respondent, there were actually six pairs of hit and false-alarm rates forming an ROC curve. Thus, six accuracy scores were calculated, standardized, and averaged. The same sequence was followed for the six bias scores.3
2.3.2. Reliabilities The overall ’s for the accuracy and bias pairs were .89 and .84 for the standard pair and .90 and .79 for the common-sense pair. Accuracy and bias correlated –.26 and –.30 for the standard and common-sense pairs, respectively.
3 For more detail on the choice of indexes, see Paulhus and Petrusic (2002).

302 D. L. Pau L h u s & P. D. har ms i n Int el l I g en c e 32 (2004)
To examine the consistency across domains, we calculated the 10 standard accuracy indexes separately. A principal components analysis was conducted on the 10 × 10 matrix of correlations among the 10 accuracy indexes. All domains loaded strongly on the first unrotated factor, which explained 51% of the variance. Similar results were found when the common-sense index of accu-racy was used.
The alpha reliability for the NPI was .84. Reliabilities for the ability tests were estimated by stepped-up odd–even correlations (McKelvie, 1989). Those values were .82 for the Wonderlic IQ test and .84 for the Quick Word Test.
2.3.3. Validities Table 3 presents the associations of the accuracy and bias measures with the three criterion mea-sures. The tabled values are the standardized regression coefficients of accuracy and bias when entered together to predict one of the criterion measures (the raw correlations are included in pa-rentheses). The two accuracy indexes show substantial associations with the Wonderlic IQ test (.51 and .52) and with the QuickWord Test (.54 and .59). The familiarity bias index also shows mod-erate associations (.26 and .32) with its criterion measure—the NPI. In all cases, the cross associa-tions are much smaller than the convergent associations.
Table 3 also reveals what happened when we partitioned the Wonderlic into verbal (34 items) and nonverbal (16 items) subscales. The subscale validities have been prorated with the Spear-man–Brown formula to estimate the values if both subscales had 50 items. Consistent with Rolf-hus and Ackerman (1999), the validities for items with the verbal content are higher than those for the nonverbal content.
2.4. Discussion
Study 1 has confirmed the early promise of the overclaiming technique developed by Paulhus and Bruce (1990). When calculated on the 150-item OCQ, the familiarity-accuracy and familiarity-bias in-dexes appear to tap individual differences in cognitive ability and response style, respectively. The accuracy index showed substantial associations with two standard performance measures. Hence, the ability to distinguish real general knowledge items from foils is indicative of a more general cog-nitive ability, presumably, crystallized intelligence (Horn & Cattell, 1966; Hunt, 2000; Rolfhus &
Table 3. Associations of criterion measures with accuracy and bias measures in Study 1
Signal detection indexes scored from the OCQ-150 Traditional scoring Common-sense scoring Accuracy Bias Accuracy Bias
Wonderlic IQ .51 (.46) .17 (.04) .52 (.46) .19 (.03) Verbal items .60 (.54) .23 (.08) .60 (.54) .23 (.08) Nonverbal items .32 (.28) .18 (.09) .36 (.27) .16 (.06) Quick Word Test .54 (.49) .19 (.05) .59 (.50) .29 (.11) Narcissistic Personality Inventory .08 (.01) .26 (.24) .13 (.03) .32 (.28)
N = 137. Tabled values are standardized regression coefficients with raw correlations in parentheses. Values greater than .21 are significant at the .01 level in a one-tailed test. Values greater than .28 are significant at the .001 level in a one-tailed test.

me as ur i n g c o g n i ti v e ab i L i ty w i th th e o v er c L ai mi n g tec h n i q u e 303
Ackerman, 1996). On the other hand, bias scores, but not accuracy scores, showed a significant asso-ciation with a trait measure of self-enhancement. Hence, response bias on a general knowledge test has a coherent psychological interpretation. In another report, we supported this latter claim using several other criterion measures of self-enhancement (Paulhus, Harms, Bruce, & Lysy, 2003).
3. Study 2: Alternative measures of cognitive ability
The historical success of IQ tests in predicting credible life indicators of success has encouraged many to view them as the operational definition of intelligence. In response, early (Freeman, 1913), as well as current critics (e.g., Gardner, 1983; Sternberg, 1988), have argued that IQ tests do not fully capture the broad construct of cognitive ability.
To address such broader conceptions, in Study 2, we extended our measurement to include three other indicators of cognitive ability, namely, scholastic performance, peer ratings, and self-ratings. Each criterion has its pros and cons. Scholastic performance is a long-term, objectively scored indictor, but is limited in scope to the academic domain. Ratings from informed peers in-corporate information from a broader range of situations where cognitive ability is displayed; of course, they are limited to the peer rater’s experience with the target. Self-ratings of ability cover the widest range of experience but are distorted by individual differences in self-report bias (Ga-briel, Critelli, & Ee, 1994; Paulhus et al., 1998).
To tap the full range of indicators in Study 2, we collected all four types of data including a standard IQ test. The scholastic performance criterion was operationalized as self-reports of high-school grades. The peer-rating criterion was assembled from ratings by two knowledgeable infor-mants (e.g., family members, close friends, or romantic partners), who were nominated by the tar-get. Self-ratings were indexed by six of the most valid self-report measures of ability.
3.1. Method
A total of 210 undergraduate students participated for extra course credit points. They were first asked to complete a self-report inventory in group sessions: It included all the self-ratings of intel-ligence. The OCQ-150 and the IQ test were administered in a separate, supervised session.
The participants (targets) were also provided with two envelopes, each containing a set of in-structions and a rating inventory to be completed by ‘‘someone who knows you well.’’ The enve-lope was stamped and addressed to the research laboratory. Suggestions for raters were family members or good friends. Several measures were taken to prevent influence from the target indi-vidual. It was emphasized to the participant and specified on the instruction sheet that the peer had to complete the ratings accurately and independently of the target individual’s influence. The targets agreed that they would not ask the raters about their ratings. The rater was to drop the en-velope in a mailbox as soon as possible. Finally, the rater had to write in his/her telephone num-ber so that the lab could call and verify who had completed the ratings.
3.2. Instruments
3.2.1. Objective performance measure The 12-min Wonderlic IQ test was used as the performance measure of cognitive ability. See de-tails under Study 1.
304 D. L. Pau L h u s & P. D. har ms i n Int el l I g en c e 32 (2004)
3.2.2. Self-report measures We included six self-report measures of cognitive ability that were deemed valid in a recent re-view (Paulhus et al., 1998). The first two were selected from the Hogan Personality Inventory (Ho-gan & Hogan, 1992) to represent the intellect factor. All items are in true–false format and were developed from a peer-perception view of intellect. For reasons of convenience and space, we lim-ited our selection to 15 items from the intellectance subscale and 7 items from the school success sub-scale. Examples are ‘‘I’m good at inventing games, stories, and rhymes’’ from the intellectance subscale and ‘‘As a child, I was always reading’’ from the school success subscale.
Three more measures derived from the Sternberg Behavior Check List (BCL), a set of short, specific, behavioral descriptions originally selected by lay judges as prototypical of intelligent people (Sternberg, Conway, Ketron, & Bernstein, 1981). We used the final 41-item version pro-vided by Sternberg (1988, pp. 238–239). Our participants rated from 1 (low) to 9 (high) the extent to which each an item was an ‘accurate self-description.’ The BCL includes three subscales: the 13-item verbal ability subscale (e.g., ‘‘Speaks clearly and articulately’’), the 15-item problem solving sub-scale (e.g., ‘‘Makes good decisions’’), and the 13-item social competence subscale (e.g., ‘‘Responds thoughtfully to others’ ideas’’).
The sixth measure, the 4-item smart scale, is brief but efficient. It measures self-appraised intel-ligence via simple trait descriptive statements of high face validity (Trapnell, 1994). Respondents rated, from 1 (low) to 9 (high), the extent to which each item was an “accurate self-description.” The items are (1) “I’m considered exceptionally or unusually intelligent,” (2) “I’m considered a very ‘brainy,’ scholarly person,” (3) “I’m considered extremely ‘gifted’ or talented at academic things,” and (4) “My school grades have usually been near the top of every class.”
3.2.3. Peer-ratings The two peer raters completed the same Hogan Intellectance measure (15 items) and Smart Scale (4 items) as the target individuals did. The two scores were standardized and averaged across rat-ers for use in the analyses.
3.3. Results
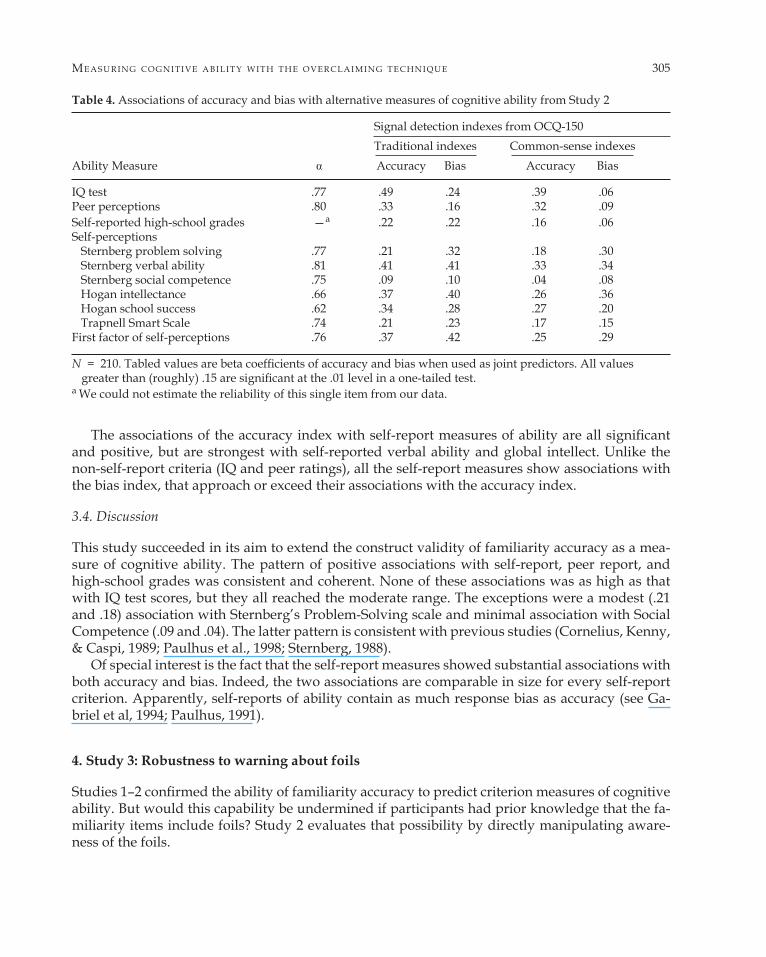
Table 4 contains the alpha reliabilities for all measures in this study. All appear satisfactory, except that the value for high-school grades could not be calculated (recall that it was a single self-report item). As before, we estimated the internal consistency of the Wonderlic IQ test with the stepped-up odd–even reliability approach recommended by McKelvie (1989). Not reported in the table is the alpha value of .83 obtained for the familiarity accuracy index.
Table 4 also contains the associations of familiarity accuracy index with all the criterion mea-sures of cognitive ability. The tabled values are standardized regression coefficients from the equa-tions of the criterion measure regressed on both accuracy and bias. As in Study 1, the accuracy in-dex was calculated both as d prime and the common-sense difference score. Again, the pattern of results with the two formulas is quite similar.
Note, first, the replication of the strong association of familiarity accuracy with IQ scores. In most cases, these associations were higher when bias was added to the regression equation. This improvement indicates the importance of controlling for self-enhancement style. The other non-self-report measure, peer-rated cognitive ability, also reached impressive levels (.33, .32), consid-ering that they are based on only two raters.
me as ur i n g c o g n i ti v e ab i L i ty w i th th e o v er c L ai mi n g tec h n i q u e 305
The associations of the accuracy index with self-report measures of ability are all significant and positive, but are strongest with self-reported verbal ability and global intellect. Unlike the non-self-report criteria (IQ and peer ratings), all the self-report measures show associations with the bias index, that approach or exceed their associations with the accuracy index.
3.4. Discussion
This study succeeded in its aim to extend the construct validity of familiarity accuracy as a mea-sure of cognitive ability. The pattern of positive associations with self-report, peer report, and high-school grades was consistent and coherent. None of these associations was as high as that with IQ test scores, but they all reached the moderate range. The exceptions were a modest (.21 and .18) association with Sternberg’s Problem-Solving scale and minimal association with Social Competence (.09 and .04). The latter pattern is consistent with previous studies (Cornelius, Kenny, & Caspi, 1989; Paulhus et al., 1998; Sternberg, 1988).
Of special interest is the fact that the self-report measures showed substantial associations with both accuracy and bias. Indeed, the two associations are comparable in size for every self-report criterion. Apparently, self-reports of ability contain as much response bias as accuracy (see Ga-briel et al, 1994; Paulhus, 1991).
4. Study 3: Robustness to warning about foils
Studies 1–2 confirmed the ability of familiarity accuracy to predict criterion measures of cognitive ability. But would this capability be undermined if participants had prior knowledge that the fa-miliarity items include foils? Study 2 evaluates that possibility by directly manipulating aware-ness of the foils.
Table 4. Associations of accuracy and bias with alternative measures of cognitive ability from Study 2
Signal detection indexes from OCQ-150 Traditional indexes Common-sense indexes Ability Measure Accuracy Bias Accuracy Bias
IQ test .77 .49 .24 .39 .06 Peer perceptions .80 .33 .16 .32 .09 Self-reported high-school grades —a .22 .22 .16 .06 Self-perceptions Sternberg problem solving .77 .21 .32 .18 .30 Sternberg verbal ability .81 .41 .41 .33 .34 Sternberg social competence .75 .09 .10 .04 .08 Hogan intellectance .66 .37 .40 .26 .36 Hogan school success .62 .34 .28 .27 .20 Trapnell Smart Scale .74 .21 .23 .17 .15 First factor of self-perceptions .76 .37 .42 .25 .29
N = 210. Tabled values are beta coefficients of accuracy and bias when used as joint predictors. All values greater than (roughly) .15 are significant at the .01 level in a one-tailed test.
a We could not estimate the reliability of this single item from our data.
306 D. L. Pau L h u s & P. D. har ms i n Int el l I g en c e 32 (2004)
4.1. Method
4.1.1. Participants A total of 239 students (84 males and 155 females) participated for bonus marks in an undergrad-uate psychology course.
4.1.2. Procedure The OCQ-150 and the Wonderlic IQ test were administered in several large classes. The IQ test was administered in standard 12-minute fashion. A cover-sheet was distributed, with spaces for demographic information and brief instructions about how to rate the familiarity of the knowl-edge items. To keep all participants responding at the same pace, the knowledge items were pre-sented one at a time on an overhead projector and simultaneously read aloud.
The warning manipulation was effected by randomly varying the instruction statement ap-pearing in bold at the bottom of the cover page. Participants in the warned condition were ad-vised: ‘‘Note that some of the items in this inventory do not exist.’’ Participants in the unwarned condition were advised: ‘‘Note that some of the items in this inventory are very difficult.’’
4.2. Results
Familiarity accuracy scores were indexed by traditional d prime formulas. Participants were di-vided into high- and low-IQ groups based on a median split of the Wonderlic IQ scores. The re-sults were analyzed in a 2 × 2 ANOVA, with IQ (low, high) and condition (warned, unwarned) as between-subject factors.
IQ showed a strong main effect [F(1, 237) = 10.75, P < .001], indicating that high-IQ individu-als were significantly more accurate than low-IQ individuals were. The main effect for condition was significant [F(1, 237) = 4.02, P < .05]. Accuracy was lower in the warned than in the unwarned condition. The interaction was not significant [F(1, 237) = 0.74, ns].
4.3. Discussion
Warning respondents that the list included foils does make a difference. The increase in mean ac-curacy score was significant, although small (E.S. = .56). The improvement may result from an in-creased focus or wariness. Nonetheless, that effect is overshadowed by the IQ main effect (E.S. = 1.3). Most important is the failure to find any hint of an interaction. Warned or not, high-IQ par-ticipants are performing better than those with low IQ.
A correlational analysis sustains the ANOVA results. The correlation between IQ and accu-racy did not differ between the warning (r = .45) and no-warning (r = .47, z = .19, n.s.) conditions. In short, the OCQ accuracy index maintains its validity as a measure of IQ despite the warning about foils on the OCQ.
5. Study 4: Take home study
So far, the administration of the general knowledge items has taken place under controlled condi-tions. Participants completed the measure under close supervision, either in small or large groups. In Study 4, to evaluate the robustness of the instrument to administration context, we allowed par-
me as ur i n g c o g n i ti v e ab i L i ty w i th th e o v er c L ai mi n g tec h n i q u e 307
ticipants to complete the measure at home on their own time. A second change was an improved measure of scholastic performance. Instead of self-reported grades, as in Study 2, we used actual course grade as our criterion for scholastic performance. Finally, we added the Goldberg Intellect Scale to the list of self-report criterion measures.
5.1. Method
Participants were 326 undergraduate students (112 males and 214 females) participating for extra course credit. The method was identical to that of Study 2, with one exception. The students were asked to take the OCQ-150 home and complete it on their own time. The only provision was that they were not to look up any of the items or ask anyone. The reason given was that ‘‘We are not in-terested in your specific abilities; we just want an overall survey of how familiar students are with various people, places, and things.’’
The self-report measures were identical to those in Study 2 with one exception, instead of the smart scale of Trapnell (1994), we used the intellect subscale from the Big Five markers of Gold-berg (1992). The latter is a 20-item set of unipolar items to be rated on seven-point scales.
5.2. Results and discussion
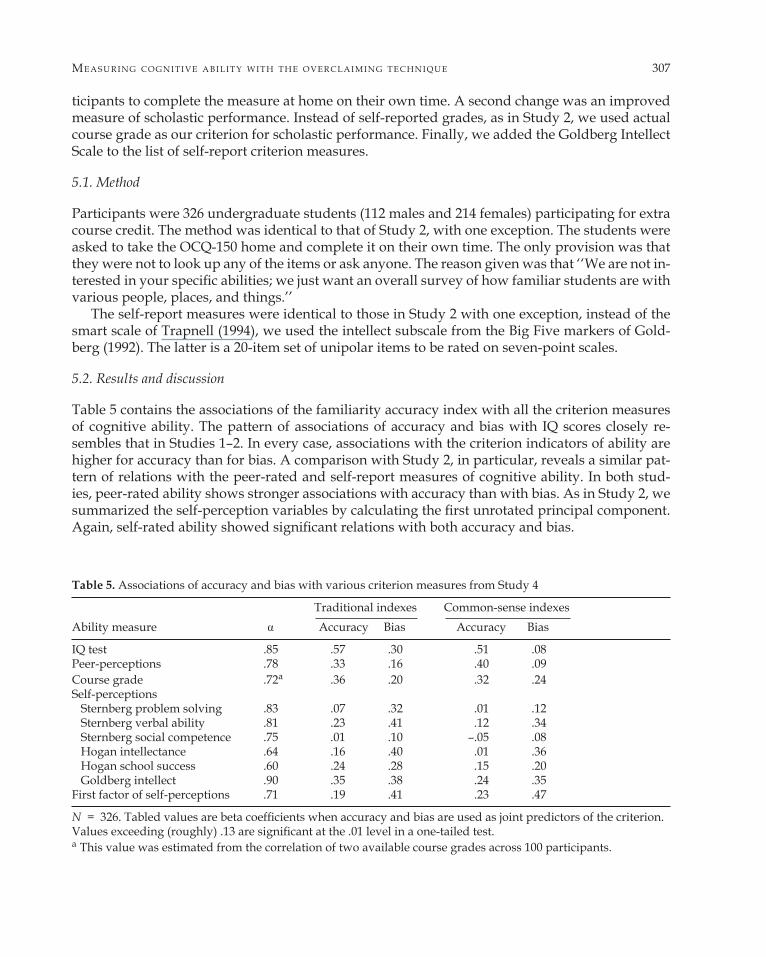
Table 5 contains the associations of the familiarity accuracy index with all the criterion measures of cognitive ability. The pattern of associations of accuracy and bias with IQ scores closely re-sembles that in Studies 1–2. In every case, associations with the criterion indicators of ability are higher for accuracy than for bias. A comparison with Study 2, in particular, reveals a similar pat-tern of relations with the peer-rated and self-report measures of cognitive ability. In both stud-ies, peer-rated ability shows stronger associations with accuracy than with bias. As in Study 2, we summarized the self-perception variables by calculating the first unrotated principal component. Again, self-rated ability showed significant relations with both accuracy and bias.
Table 5. Associations of accuracy and bias with various criterion measures from Study 4
Traditional indexes Common-sense indexes Ability measure Accuracy Bias Accuracy Bias
IQ test .85 .57 .30 .51 .08 Peer-perceptions .78 .33 .16 .40 .09 Course grade .72a .36 .20 .32 .24 Self-perceptions Sternberg problem solving .83 .07 .32 .01 .12 Sternberg verbal ability .81 .23 .41 .12 .34 Sternberg social competence .75 .01 .10 –.05 .08 Hogan intellectance .64 .16 .40 .01 .36 Hogan school success .60 .24 .28 .15 .20 Goldberg intellect .90 .35 .38 .24 .35 First factor of self-perceptions .71 .19 .41 .23 .47
N = 326. Tabled values are beta coefficients when accuracy and bias are used as joint predictors of the criterion. Values exceeding (roughly) .13 are significant at the .01 level in a one-tailed test. a This value was estimated from the correlation of two available course grades across 100 participants.
308 D. L. Pau L h u s & P. D. har ms i n Int el l I g en c e 32 (2004)
The other datum of special interest is the association of familiarity accuracy with course grades. As with self-report grades in Study 2, these associations are significant, but are larger in size (.36 and .32). Projecting to a GPA based on five courses, these validities become .60 and .53.
In short, Study 4 confirmed the validity of the OCQ familiarity accuracy index as a proxy mea-sure of cognitive ability. This performance was achieved despite the fact that participants com-pleted the items at home, without supervision and without time limit. Note that they were not warned about the presence of foils in this study. It is possible that a foil warning on a take-home test might undermine the validity of both the accuracy and bias indexes.
6. General discussion
Our four studies support the proposal of Paulhus and Bruce (1990) to apply signal detection meth-ods to the measurement of cognitive ability. The application of these methods to the diverse set of knowledge items on the OCQ-150 appears to provide an indirect method for tapping intelligence. The key feature was the inclusion of 20% foils, that is, nonexistent items. The degree of overclaim-ing of these foils serves as a baseline, against which the claimed familiarity with real items be-comes a meaningful measure of knowledge.
This combination of items permitted the calculation of each participant’s hit and false-alarm rates to derive our key statistic—the familiarity accuracy index. When the item content covers general knowledge of an academic nature, this ability to discriminate real items from foils appears to tap a more global cognitive ability. This conclusion was supported by the demonstration of as-sociations with a wide variety of appropriate criterion variables. This convergence was evident whether the accuracy index was calculated with traditional or common-sense formulas. The latter is more intuitively evident and easy to calculate.
The accuracy index works hand-in-hand with the response bias index. Because we chose pairs of signal detection indexes whose accuracy and bias scores are independent (see Paulhus & Petru-sic, 2002), our measurement of a respondent’s ability is uncontaminated by his/her tendency to overclaim. Nonetheless, the accuracy and bias indexes can be (and usually are) correlated across respondents. Therefore, bias must be partialed out by including it in a regression equation with the accuracy index.4 The bias index can also be used in its own right, as was demonstrated in Study 1 by a moderate correlation with a trait measure of self-enhancement. That finding is con-sistent with another report (Paulhus et al., 2003), where we detailed three other studies support-ing the construct validity of the bias index.
6.1. Breadth and strength of validation
The index of accurate familiarity on the OCQ-150 items was validated as a measure of cogni-tive ability by demonstrating a convergence with a variety of external measures. Our evidence included five separate validations, with performance IQ tests as the criterion (two distinct mea-
4 In some situations, the two predictors show mutual suppression, which sharpens up both validities (Paulhus, Robins, Trzesniewski, & Tracy, in press; Wiggins, 1973). Hence, the accuracy and biases indexes are best used together.
me as ur i n g c o g n i ti v e ab i L i ty w i th th e o v er c L ai mi n g tec h n i q u e 309
sures in Study 1). Other criterion variables included self- and peer ratings as well as school grades. Note that all our reported validities are underestimates of the theoretical values, given that we did not correct for the unreliability of the predictors or criterion variables (see Schmidt & Hunter, 1999).
The performance of the OCQ-150 accuracy index as a measure of cognitive ability is partic-ularly impressive when compared against other self-administered instruments. The review by Paulhus et al. (1998) found that the validities (uncorrected raw correlations) of the best available self-report measures did not exceed .35. In contrast, the raw correlations of OCQ accuracy with IQ ranged from .39 to .57. Against its most direct competitors, then, the new measure fares well. In fact, these validities fall in the range of ‘‘large’’ effect sizes according to both theoretical (Cohen, 1992) and empirical (Hemphill, 2003) standards.
The nature of our sample also handicaps our validity values relative to those expected in gen-eral population samples. This underestimation is a consequence of the restricted range of ability in our college samples. Compared with the S.D. of 4.6 that we found for the Wonderlic IQ test, S.D.s of 7.1 are more typical of the general populations (Wonderlic, 1992). Adjusted for restriction of range (Gulliksen, 1967), our range of raw validities for the accuracy index would have reached .52–.69. Because of the negative relation between accuracy and bias scores, the partial correlations are even higher (.60–.76). These values are impressive by any standards.
Note that the disattenuated and range-corrected values are appropriate for demonstrating the-oretical convergence with other ability measures. Whether the OCQ-150 accuracy index can sub-stitute for a standard IQ test in college samples is a different matter. The overlap is substantial, but the nonoverlapping component of standard tests may be essential to intelligent performance in the real world. Without further evidence, we hesitate to argue that the OCQ-150 can substitute for standard IQ tests.
6.2. Robustness
Unlike traditional ability measures, the validity of the familiarity accuracy index is robust to a va-riety of administration conditions. Its validity is maintained whether administered in the class-room (Studies 1–3) or at home (Study 4). Moreover, its validity holds up whether participants are warned (Study 3 warned condition), or unwarned (Studies 1, 2, 4, and Study 3 unwarned condition).
The invulnerability with respect to warning warrants further elaboration. First, it alleviates the most likely concern of a test administrator, namely, that word will get out about its secret—the presence of foils. Note, however, that this invulnerability only holds within the conditions. Par-ticipants from different conditions cannot be compared because warned participants, on average, achieve a (slightly) higher score. Together, these arguments suggest that the safest course of action is to warn all participants, to assign them, in effect, to the same administration condition.
6.3. User friendliness
One unfortunate aspect of ability testing is the evaluation apprehension experienced by those being tested. Unlike personality, interest, or vocational-preference tests, the public revelation of one’s intelligence is highly ego involving and stressful (Brown, 1997; Dunning & Cohen, 1992).
310 D. L. Pau L h u s & P. D. har ms i n Int el l I g en c e 32 (2004)
In comparison, the overclaiming approach is user friendly. An administrator’s request to re-port familiarities seems much more like a survey than a test. If foils are not mentioned, the eval-uation function is virtually unobtrusive. Even when the warning about foils is added, the format seems qualitatively different from that of a performance test.5 Because no time limit is necessary, stress is reduced even further. These advantages may explain why the OCQ worked even when participants completed the inventory at home.
With respect to user friendliness, the OCQ-150 is in competition with two recently developed measures. First is the cognitive skills survey (CSS; Dennis, Sternberg, & Beatty, 2000), which com-prises items that are at once valid and nonthreatening. Much pilot work was required to make the administration atmosphere more like that of a casual survey than a formal test. The second such measure, the unobtrusive knowledge test (UKT; Legree, Martin, & Pstoka, 2000) is primarily verbal in content (like the OCQ) but has a similar rationale with the CST. Not only were the items chosen to have a casual flavor (e.g., ‘‘What proportion of circus personnel are clowns?’’), but responses are also collected in a nonthreatening Likert format. Most respondents perceived the items as sur-vey questions rather than tests per se.
We would argue that the overclaiming approach surpasses the user friendliness of both com-petitors. Unlike the OCQ, the formats of both the CSS and UKT imply that there is a correct an-swer to each question. The administration time of the UKT is not reported by Legree et al. (2000), but the CSS requires over 2 hours to complete (Dennis et al., 2000). In contrast, only 15 minutes is required for the OCQ-150. Moreover, the validity of the competing instruments has not been as-sessed in a take-home context.
Admittedly, the OCQ-150 does not have the multifactor capabilities of the CSS. Like the UKT, the OCQ is primarily verbal. In that light, it may be surprising that the OCQ accuracy index pre-dicts nonverbal as well as verbal intelligence. Part of the explanation is the statistical overlap be-tween verbal and nonverbal abilities (r = .45 in our data). An additional reason is suggested by the pattern of subscale correlates (not tabled). The highest correlate of nonverbal ability was the accuracy score in the physical sciences domain. In other words, familiarity with science items is a proxy for skill in science. Thus, the OCQ taps nonverbal ability by testing knowledge about non-verbal topics. Together, this joint assessment of verbal and nonverbal abilities permits a reason-able estimate of the general factor (g) of intelligence (e.g., Jensen & Weng, 1994; Vernon, 1989).
6.4. Applications
In retrospect, it is surprising that signal detection methods have never been applied to the mea-surement of cognitive ability. There are scattered studies that have used a similar approach to measure special knowledge domains. For example, Stanovich and Cunningham (1992) measured people’s exposure to reading materials with a technique similar with ours. Calsyn (1999) used a similar method to measure awareness of community helping agencies.
Also related is an early study by Anderson, Warner, and Spencer (1984), where a comparable method was used to measure occupation—specific knowledge among job applicants. It is unfor-
5 One might argue that the OCQ is a performance test because we score the accuracy index with a key. But respon-dents cannot interpret it as a performance test if they are unaware of the foils. Nonetheless, the index orders in-dividuals the same with or without the warning. This odd pattern raises the question of whether a performance test should be defined by how it is scored or how it is perceived by the test-taker.
me as ur i n g c o g n i ti v e ab i L i ty w i th th e o v er c L ai mi n g tec h n i q u e 311
tunate that this work has not been exploited in the measurement of tacit intelligence (Sternberg, Wagner, & Okagaki, 1993). Also known as work-related knowledge (Schmidt & Hunter, 1993), the label ‘‘tacit intelligence’’ highlights the fact that specialized knowledge within an occupational do-main facilitates intelligent processing of challenging tasks within that domain. Assessment spe-cialists could easily develop real items and foils that separate knowledgeable from unknowledge-able applicants in virtually any field of expertise.
6.5. Implications for research on cognitive ability
Our recommendation to measure ability differences via signal detection techniques may aid in forging links with process studies of ability—a link long called for but seldom heeded (Hunt, 1987). Crystallized intelligence may involve not just the sense that old stimuli are familiar, but also the sense that new stimuli are unfamiliar. It seems likely that these two abilities are linked to sep-arate processes in the flow of information (Roberts & Pallier, 2001). Modern memory researchers now acknowledge the role of such metaknowledge, including the monitoring of recall processes (see Koriat, Goldsmith, & Pansky, 2000). Future ability research should attend as much to the mea-surement of knowledge overclaiming as to knowledge claiming.
The independent assessment of accuracy and bias in overclaiming research permits the isola-tion of their distinctive correlates and, therefore, their developmental origins. On the other hand, it is of some interest that IQ scores are associated with both indexes. A consistent finding across our four studies was a positive association of IQ test scores with the response bias index. But are high-ability individuals overclaiming or are low-ability types underclaiming? A further examina-tion of the bias scores (c values) indicated that both groups are overconfident, but that high-abil-ity types are more so.
Note that we found this ability-overconfidence effect even in regression equations that in-cluded our accuracy index. Hence, this tendency of able individuals to overclaim operates above and beyond their exceptional ability to differentiate real from unreal items. The possibility that a lack of insight can accompany adaptive intelligence is reminiscent of the positive illusion claims by some social psychologists (Taylor & Brown, 1988; cf. Paulhus, 1998).
More purchase on this issue might be attained by connecting the overclaiming method to the work on intelligence and overconfidence6 by Stankov and colleagues (e.g., Stankov, 1998; Stankov & Crawford, 1997). They too have measured confidence independently of ability. This parallel appears despite the differences in methodology: Overconfidence evaluations require ratings of performance confidence immediately after a performance test (or item). That literature suggests a general factor of overconfidence, but no personality correlates of this factor have yet been found. In contrast, the per-sonality correlates of overclaiming (response bias) are clear and replicable (Paulhus et al., 2003).
7. Conclusion and future research
Our four studies have demonstrated that familiarity ratings on the OCQ-150 can be scored to pro-vide a practical measure of global cognitive ability. This feat appears to be accomplished by cap-
6 Although related, overclaiming and overconfidence are operationalized differently. Overconfidence is a ten-dency to overestimate one’s accuracy after the decision, whereas overclaiming (response bias) is the tendency to claim knowledge of items, whether real or foils.
312 D. L. Pau L h u s & P. D. har ms i n Int el l I g en c e 32 (2004)
turing an aspect of knowledge related to crystallized intelligence. In its current form, the assets of the instrument include a solid body of validity data, ease of administration, and verified robust-ness across conditions of administration. Although not a replacement for standard IQ tests, the in-strument may prove useful in a variety of contexts.
The potential of the overclaiming technique is much broader, however, because its content can be tailored to specific knowledge assessment needs. Most assessment instruments depend on a fixed set of items to ensure validity and comparability. Although we have used varying combi-nations of the 10 content domains, the validity of the familiarity accuracy index has proved to be rather stable. Nonetheless, 8 of the 10 content domains were academic in nature. Although suitable for college students, alternative versions may be necessary for less-educated groups. Presumably, the content would focus more on topics such as sports, television, cars, and consumer goods.
This recommendation raises a fundamental issue about the generality of crystallized intelli-gence. It is clear why accurate familiarity with our academically oriented items predicts IQ scores among college students (see Rolfhus & Ackerman, 1996; 1999). But would the same association be found with nonacademic knowledge? Our nonacademic domains showed lower, although still positive, associations with the academic domains. It is conceivable that accurate knowledge of some domains (e.g., wrestling, soap operas) might even be a negative predictor of global crystal-lized intelligence. The answer to this question should provide insight into the relation between knowledge and intelligence.
References
Aiken, L. R. (1996). Assessment of intellectual functioning. (2nd ed.). New York: Plenum. Anderson, C. D., Warner, J. L., & Spencer, C. C. (1984). Inflation bias in self-assessment examinations: Implications
for valid employee selection. Journal of Applied Psychology, 69, 574–580. Bass, B. A. (1974). Validity of Borgatta and Corsini’s quick word test with young adults. Psychological Reports, 34(3,
Pt. 1), 726. Borgatta, E. F., & Corsini, R. J. (1964). Quick word test manual. New York: Harcourt, Brace and World. Brown, J. D. (1997). The self. Boston: McGraw-Hill. Calsyn, R. J. (1999). Understanding and controlling response biases in needs assessment studies. Evaluation Re-
view, 23, 399–417. Cohen, J. (1992). A power primer. Psychological Bulletin, 112, 155–159. Cornelius, S. W., Kenny, S., & Caspi, A. (1989). Academic and everyday intelligence in adulthood: Conceptions
of self and ability tests. In J. D. Sinnott (Ed.), Everyday problem-solving: Theory and applications. New York: Praeger.
Dennis, M., Sternberg, R. J., & Beatty, P. (2000). The construction of user-friendly tests of cognitive functioning: A synthesis of maximal- and typical-performance measurement philosophies. Intelligence, 28, 193–211.
Dodrill, C. B. (1981). An economical method for the evaluation of general intelligence in adults. Journal of Consult-ing and Clinical Psychology, 49, 668–673.
Dunning, D., & Cohen, G. L. (1992). Egocentric definitions of traits and abilities in social judgment. Journal of Per-sonality and Social Psychology, 63, 341–355.
Emmons, R. A. (1984). Factor analysis and construct validity of the Narcissistic Personality Inventory. Journal of Personality Assessment, 48, 291–300.
Emmons, R. A. (1987). Narcissism: Theory and measurement. Journal of Personality and Social Psychology, 52, 11–17.
Freeman, F. N. (1913). Tests. Psychological Bulletin, 10, 271–274.
me as ur i n g c o g n i ti v e ab i L i ty w i th th e o v er c L ai mi n g tec h n i q u e 313
Gabriel, M. T., Critelli, J. W., & Ee, J. S. (1994). Narcissistic illusions in self-evaluations of intelligence and attrac-tiveness. Journal of Personality, 62, 144–155.
Gardner, H. (1983). Frames of mind: The theory of multiple intelligences. New York: Basic Books. Glynn, S. M., Okun, M. A., Muth, K., & Britton, B. K. (1983). Adults’ text recall: An examination of the age-deficit
hypothesis. Journal of Reading Behavior, 15, 31–41. Goldberg, L. R. (1992). The development of markers for the big-five factor structure. Psychological Assessment, 4,
26–42. Gosling, S., John, O. P., Craik, K. H., & Robins, R. W. (1998). Do people know how they behave?: Self-reported
act frequencies compared with on-line coding by observers. Journal of Personality and Social Psychology, 74, 1337–1349.
Gulliksen, H. (1967). Theory of mental tests. New York: Wiley. Hemphill, J. F. (2003). Interpreting the magnitude of correlation coefficients. American Psychologist, 58, 78–79. Hirsch, E. D. (1988). Cultural literacy. New York: Vintage. Hogan, R., & Hogan, J. (1992). Hogan Personality Inventory manual. Tulsa, OK: Hogan Assessment Systems. Horn, J. L., & Cattell, R. B. (1966). Refinement and test of the theory of fluid and crystallized intelligence. Journal
of Educational Psychology, 57, 253–270. Hunt, E. (1987). A cognitive model of individual differences, with an application to attention. In S. H. Irvine, & S.
E. Newstead (Eds.), Intelligence and cognition: Contemporary frames of reference ( pp. 177–215). Dordrecht, Neth-erlands: Martinus Nijhoff.
Hunt, E. (2000). Let’s hear it for crystallized intelligence. Learning and Individual Differences, 12, 123–129. Jensen, A., & Weng, L. (1994). What is a good g? Intelligence, 18, 231–258. John, O. P., & Robins, R. W. (1994). Accuracy and bias in self-perception: Individual differences in self-enhance-
ment and the role of narcissism. Journal of Personality and Social Psychology, 66, 206–219. Koriat, A., Goldsmith, M., & Pansky, A. (2000). Toward a psychology of memory accuracy. Annual Review of Psy-
chology, 51, 481–537. Legree, P. J., Martin, D. E., & Psotka, J. (2000). Measuring cognitive aptitude using unobtrusive knowledge tests: A
new survey technology. Intelligence, 28, 291–308. Macmillan, N. A., & Creelman, C. D. (1990). Response bias: Characteristics of detection theory, threshold theory,
and nonparametric indexes. Psychological Bulletin, 107, 401–413. Macmillan, N. A., & Creelman, C. D. (1991). Detection theory: A user’s guide. New York: Cambridge. McKelvie, S. J. (1989). The Wonderlic Personnel Test: Reliability and validity in an academic setting. Psychological
Reports, 65, 161–162. McNicol, D. (1972). A primer of signal detection theory. London: George Allen & Unwin. Paulhus, D. L. (1991). Measurement and control of response bias. In J. P. Robinson, P. R. Shaver, & L. S. Wrightsman
(Eds.), Measures of personality and social psychological attitudes ( pp. 17–59). San Diego, CA: Academic Press. Paulhus, D. L. (1998). Interpersonal and intrapsychic adaptiveness of trait self-enhancement: A mixed blessing?
Journal of Personality and Social Psychology, 74, 1197–1208. Paulhus, D. L., & Bruce, M. N. (1990, June). Validation of the Over-Claiming Questionnaire: A preliminary study. Pre-
sented at the meeting of Canadian Psychological Association, Ottawa. Paulhus, D. L., Harms, P. D., Bruce, M. N., & Lysy, D. C. (2003). The over-claiming technique: Measuring self-en-
hancement independent of ability. Journal of Personality and Social Psychology, 84, 681–693. Paulhus, D. L., Lysy, D., & Yik, M. S. M. (1998). Self-report measures of intelligence: Are they useful as proxy mea-
sures of IQ. Journal of Personality, 66, 525–554. Paulhus, D. L., & Petrusic, W. M., (2002). Measuring individual differences with signal detection theory: Some recommen-
dations for researchers. Manuscript under review. Paulhus, D. L, Robins, R. W., Trzesniewski, K., & Tracy, J. L, (in press). Two replicable suppressor situations in per-
sonality research. Multivariate Behavioral Research.
314 D. L. Pau L h u s & P. D. har ms i n Int el l I g en c e 32 (2004)
Raskin, R., & Hall, C. S. (1979). A Narcissistic Personality Inventory. Psychological Reports, 45, 590. Rhodewalt, F., & Morf, C. C. (1995). Self and interpersonal correlates of the Narcissistic Personality Inventory: A
review and new findings. Journal of Research in Personality, 29, 1–23. Roberts, R. D., & Pallier, G. (2001). Individual differences in performance on elementary cognitive tasks (ECTs):
Lawful vs. problematic parameters. Journal of General Psychology, 128, 279–314. Robins, R. W., & Beer, J. (2001). Positive illusions about the self: Their correlates and consequences. Journal of Per-
sonality and Social Psychology, 80, 340–352. Rolfhus, E. L., & Ackerman, P. L. (1996). Self-report knowledge: At the crossroads of ability, interest, and person-
ality. Journal of Educational Psychology, 88, 174–188. Rolfhus, E. L., & Ackerman, P. L. (1999). Assessing individual differences in knowledge, intelligence, and related
traits. Journal of Educational Psychology, 91, 511–526. Schoenfeldt, L. F. (1985). Review of Wonderlic Personnel Test. Ninth mental measurements yearbook ( pp. 1757–1758).
Lincoln, NE: Buros Institute of Mental Measurement. Schmidt, F. L. (1985). Review of the Wonderlic Personnel Test. In J. V. Mitchell (Ed.), The ninth mental measurements
yearbook ( pp. 1755–1757). Lincoln, NE: Buros Institute. Schmidt, F. L., & Hunter, J. E. (1993). Tacit knowledge, practical intelligence, general mental ability, and job knowl-
edge. Current Directions in Psychological Science, 2, 8–9. Schmidt, F. L., & Hunter, J. E. (1999). Theory testing and measurement error. Intelligence, 27, 183–198. Stankov, L. (1998). Calibration curves, scatterplots, and the distinction between general knowledge and perceptual
tasks. Learning and Individual Differences, 10, 29–50. Stankov, L., & Crawford, J. D. (1997). Self-confidence and performance on tests of cognitive abilities. Intelligence,
25, 93–109. Stanovich, K. E., & Cunningham, A. E. (1992). Studying the consequences of literacy within a literate society: The
cognitive correlates of print exposure. Memory & Cognition, 20, 51–68. Sternberg, R. J. (1988). The triarchic mind: A new theory of human intelligence. New York: Penguin. Sternberg, R. J., Conway, B. E., Ketron, J. L., & Bernstein, M. (1981). People’s conceptions of intelligence. Journal of
Personality and Social Psychology, 41, 37–55. Sternberg, R. J., Wagner, R. K., & Okagaki, L. (1993). Practical intelligence: The nature and role of tacit knowledge
in work and at school. In J. M. Puckett, & H. W. Reese (Eds.), Mechanisms of everyday cognition (pp. 205–227). Hillsdale, NJ: Erlbaum.
Swets, J. A. (1964). Signal detection and recognition by human observers. New York: Wiley. Swets, J. A. (1986). Indices of discrimination or diagnostic accuracy: Their ROCs and implied models. Psychologi-
cal Bulletin, 99, 100–117. Taylor, S. E., & Brown, J. D. (1988). Illusion and well-being: A social psychological perspective on mental health.
Psychological Bulletin, 103, 193–210. Trapnell, P. D. (1994). Openness versus intellect: A lexical left turn. European Journal of Personality, 8, 273–290. Vernon, P. A. (1989). The generality of g. Personality and Individual Differences, 10, 803–804. Wiggins, J. S. (1973). Personality and prediction. Reading, MA: Addison-Wesley. Wonderlic, E. F. (1977). Wonderlic Personnel Test manual. Northfield, IL: Wonderlic and Associates. Wonderlic, E. F. (1992). Wonderlic Personnel Test and scholastic level exam user’s manual. Libertyville, IL: Wonderlic
Personnel Test.
Top Related
Copyright © 2022 FDOKUMEN

