


Bahasa
Halaman
Hukum

Measurement of the integral refractive index and dynamic cell morphometry of living cells
with digital holographic microscopy Benjamin Rappaz 1,*, Pierre Marquet 2,*, Etienne Cuche 3, Yves Emery 3, Christian
Depeursinge 4 and Pierre J. Magistretti 1,2 1Brain Mind Institute, École Polytechnique Fédérale de Lausanne, 1015 Lausanne, Switzerland
2Centre de Neurosciences Psychiatriques, Département de psychiatrie DP-CHUV, Site de Cery, 1008 Prilly-Lausanne, Switzerland
3Lyncée Tec SA, PSE-A, 1015 Lausanne, Switzerland 4Ecole Polytechnique Fédérale de Lausanne, Laboratoire d’Optique Appliquée, 1015 Lausanne, Switzerland
* These authors contributed equally to this work. [email protected]
Abstract: We have developed a digital holographic microscope (DHM), in a transmission mode, adapted to the quantitative study of cellular dynamics. Living cells in culture are optically probed by measuring the phase shift they produce on the transmitted wave front. The high temporal stability of the phase signal, equivalent to λ/1800, and the low acquisition time (~20μs) enable to monitor cellular dynamics processes. An experimental procedure allowing to calculate both the integral refractive index and the cellular thickness (morphometry) from the measured phase shift is presented. Specifically, the method has been applied to study the dynamics of neurons in culture during a hypotonic stress. Such stress produces a paradoxical decrease of the phase which can be entirely resolved by applying the methodological approach described in this article; indeed the method allows to determine independently the thickness and the integral refractive index of cells.
©2005 Optical Society of America
OCIS codes: (090.1760) Computer holography; (120.3940) Metrology; (120.5050) Phase measurement; (170.1530) Cell analysis
References and Links
1. P. Marquet, B. Rappaz, P. J. Magistretti, E. Cuche, Y. Emery, T. Colomb, and C. Depeursinge, "Digital holographic microscopy: a noninvasive contrast imaging technique allowing quantitative visualization of living cells with subwavelength axial accuracy," Opt. Lett. 30, 468-470 (2005).
2. D. Carl, B. Kemper, G. Wernicke, and G. von Bally, "Parameter-optimized digital holographic microscope for high-resolution living-cell analysis," Appl. Opt. 43, 6536-6544 (2004).
3. T. Ikeda, G. Popescu, R. R. Dasari, and M. S. Feld, "Hilbert phase microscopy for investigating fast dynamics in transparent systems," Opt. Lett. 30, 1165-1167 (2005).
4. E. Cuche, P. Marquet, and C. Depeursinge, "Simultaneous amplitude-contrast and quantitative phase-contrast microscopy by numerical reconstruction of Fresnel off-axis holograms," Appl. Opt. 38, 6994-7001 (1999).
5. G. J. Brewer, J. R. Torricelli, E. K. Evege, and P. J. Price, "Optimized survival of hippocampal neurons in B27-supplemented Neurobasal, a new serum-free medium combination," J. Neurosci. Res. 35, 567-576 (1993).
6. A. Dunn, and R. Richards-Kortum, "Three-dimensional computaton of light scattering from cells," IEEE J. Sel. Top. Quantum Electron. 2, 898-905 (1996).
7. J. Farinas, and A. S. Verkman, "Cell volume and plasma membrane osmotic water permeability in epithelial cell layers measured by interferometry," Biophys. J. 71, 3511-3522 (1996).
8. M. Born, and E. Wolf, eds., "Principles of Optics," (Cambridge University Press, 1999), pp. 467-472.
(C) 2005 OSA 14 November 2005 / Vol. 13, No. 23 / OPTICS EXPRESS 9361#8853 - $15.00 USD Received 20 September 2005; revised 31 October 2005; accepted 2 November 2005
9. J. Beuthan, O. Minet, J. Helfmann, M. Herrig, and G. Muller, "The spatial variation of the refractive index in biological cells," Phys. Med. Biol. 41, 369-382 (1996).
10. J. Lai, Z. Li, C. Wang, and A. He, "Experimental measurement of the refractive index of biological tissues by total internal reflection," Appl. Opt. 44, 1845-1849 (2005).
11. F. Lanni, A. S. Waggoner, and D. L. Taylor, "Structural organization of interphase 3T3 fibroblasts studied by total internal reflection fluorescence microscopy," J. Cell. Biol. 100, 1091-1102 (1985).
12. J. Bereiter-Hahn, C. H. Fox, and B. Thorell, "Quantitative reflection contrast microscopy of living cells," J. Cell. Biol. 82, 767-779 (1979).
13. F. Bolin, L. Preuss, R. Taylor, and R. Ference, "Refractive index of some mammalian tissues using a fiber optic cladding method," Appl. Opt. 28, 2297-2303 (1989).
14. C. L. Curl, C. J. Bellair, T. Harris, B. E. Allman, P. J. Harris, A. G. Stewart, A. Roberts, K. A. Nugent, and L. M. Delbridge, "Refractive index measurement in viable cells using quantitative phase-amplitude microscopy and confocal microscopy," Cytometry A 65, 88-92 (2005).
15. K. J. Sweadner, and S. M. Goldin, "Active transport of sodium and potassium ions: mechanism, function, and regulation," N. Engl. J. Med. 302, 777-783 (1980).
16. F. Wehner, H. Olsen, H. Tinel, E. Kinne-Saffran, and R. K. Kinne, "Cell volume regulation: osmolytes, osmolyte transport, and signal transduction," Rev. Physiol. Biochem. Pharmacol. 148, 1-80 (2003).
17. H. G. Davies, and M. H. F. Wilkins, "Interference microscopy and mass determination," Nature 169, 541 (1952).
1. Introduction
Non-invasive high-resolution imaging of living cells in their natural environment is a prerequisite to visualize biological processes. Recently, new digital microscopy techniques have demonstrated phase measurements with interferometric resolutions, i.e. lateral micrometer range and sub-wavelength axial resolutions, of transparent biological specimens, in particular living cells in culture, without the use of any contrast agent [1,2,3]. Compared to classical phase contrast and Normaski’s differential interference contrast widely used in biology for the visualization of unstained transparent specimens, interferometric techniques present the significant advantage of yielding quantitative measurements of the phase shift produced by the specimen. The measured phase shift depends on both the refractive index and the thickness of the specimen, two quantities linked to the nature of the intracellular content and to the morphometry of the specimen, respectively.
In this paper, we report the real time visualization of cellular dynamics with a digital holographic microscope (DHM) specifically adapted for the observation of living cell in culture. This DHM technique is based on an original numerical method [4], which enables the reconstruction of both the amplitude and the quantitative phase contrast images with an interferometric resolution from a single recorded hologram [1]. The numerical reconstruction allows for the correction of the optical aberration introduced by the microscope objective (MO) and other imperfections of the optical arrangement; it also enables to compensate for temporal fluctuations induced by environmental and experimental perturbations. Consequently, DHM is an interferometric technique particularly well adapted for real time visualization of cellular dynamics.
An experimental protocol called “decoupling procedure” is presented here with the aim of measuring separately the integral refractive index and the cellular thickness from the quantitative phase images of living cells. Specifically, this protocol was applied during a hypotonic shock performed on living neurons in culture. It permits to separately measure, from the non-intuitive phase signal decline, both the expected neuronal swelling and the integral refractive index changes.
2. Theoretical and experimental principle
The experimental set-up is a modified Mach-Zender configuration (Fig. 1). Light transmitted by the specimen is collected by a microscope objective (MO) that forms the object wave O, which interferes with a reference wave R to produce the hologram intensity IH recorded by the digital camera [Fig. 1(b)]. Holograms are recorded in an off-axis geometry i.e. the reference
(C) 2005 OSA 14 November 2005 / Vol. 13, No. 23 / OPTICS EXPRESS 9362#8853 - $15.00 USD Received 20 September 2005; revised 31 October 2005; accepted 2 November 2005
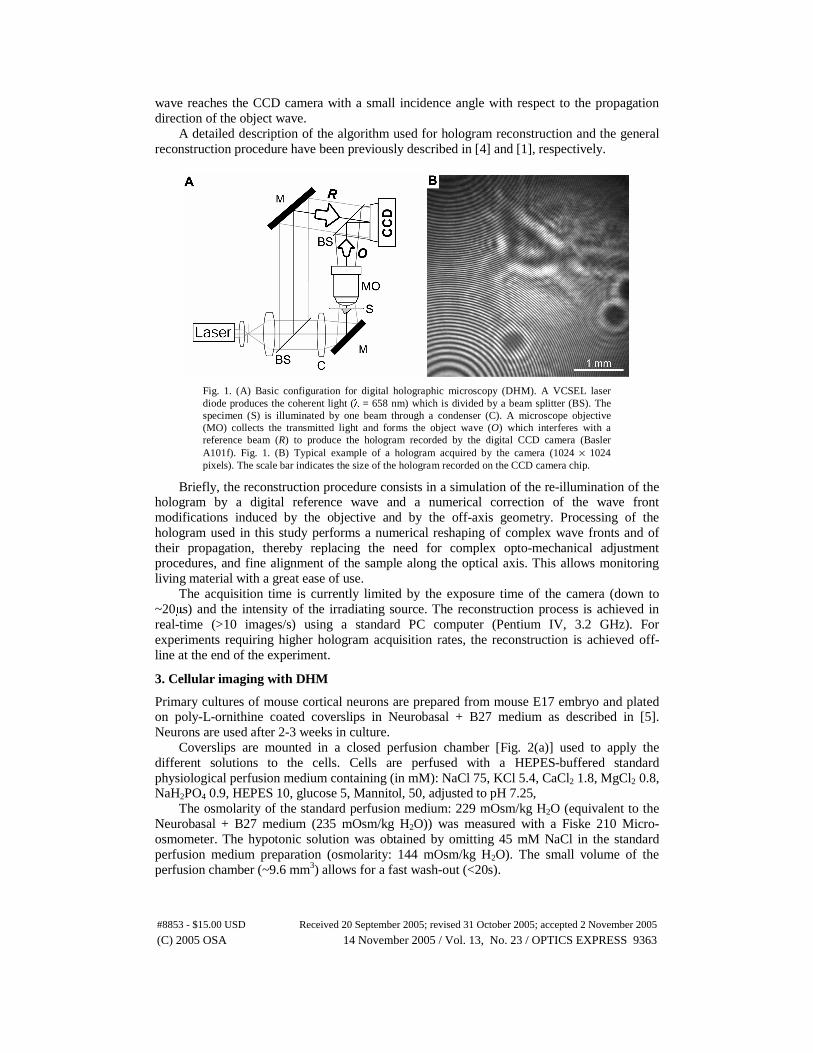
wave reaches the CCD camera with a small incidence angle with respect to the propagation direction of the object wave.
A detailed description of the algorithm used for hologram reconstruction and the general reconstruction procedure have been previously described in [4] and [1], respectively.
Fig. 1. (A) Basic configuration for digital holographic microscopy (DHM). A VCSEL laser diode produces the coherent light (λ = 658 nm) which is divided by a beam splitter (BS). The specimen (S) is illuminated by one beam through a condenser (C). A microscope objective (MO) collects the transmitted light and forms the object wave (O) which interferes with a reference beam (R) to produce the hologram recorded by the digital CCD camera (Basler A101f). Fig. 1. (B) Typical example of a hologram acquired by the camera (1024 × 1024 pixels). The scale bar indicates the size of the hologram recorded on the CCD camera chip.
Briefly, the reconstruction procedure consists in a simulation of the re-illumination of the hologram by a digital reference wave and a numerical correction of the wave front modifications induced by the objective and by the off-axis geometry. Processing of the hologram used in this study performs a numerical reshaping of complex wave fronts and of their propagation, thereby replacing the need for complex opto-mechanical adjustment procedures, and fine alignment of the sample along the optical axis. This allows monitoring living material with a great ease of use.
The acquisition time is currently limited by the exposure time of the camera (down to ~20μs) and the intensity of the irradiating source. The reconstruction process is achieved in real-time (>10 images/s) using a standard PC computer (Pentium IV, 3.2 GHz). For experiments requiring higher hologram acquisition rates, the reconstruction is achieved off-line at the end of the experiment.
3. Cellular imaging with DHM
Primary cultures of mouse cortical neurons are prepared from mouse E17 embryo and plated on poly-L-ornithine coated coverslips in Neurobasal + B27 medium as described in [5]. Neurons are used after 2-3 weeks in culture.
Coverslips are mounted in a closed perfusion chamber [Fig. 2(a)] used to apply the different solutions to the cells. Cells are perfused with a HEPES-buffered standard physiological perfusion medium containing (in mM): NaCl 75, KCl 5.4, CaCl2 1.8, MgCl2 0.8, NaH2PO4 0.9, HEPES 10, glucose 5, Mannitol, 50, adjusted to pH 7.25,
The osmolarity of the standard perfusion medium: 229 mOsm/kg H2O (equivalent to the Neurobasal + B27 medium (235 mOsm/kg H2O)) was measured with a Fiske 210 Micro-osmometer. The hypotonic solution was obtained by omitting 45 mM NaCl in the standard perfusion medium preparation (osmolarity: 144 mOsm/kg H2O). The small volume of the perfusion chamber (~9.6 mm3) allows for a fast wash-out (<20s).
(C) 2005 OSA 14 November 2005 / Vol. 13, No. 23 / OPTICS EXPRESS 9363#8853 - $15.00 USD Received 20 September 2005; revised 31 October 2005; accepted 2 November 2005
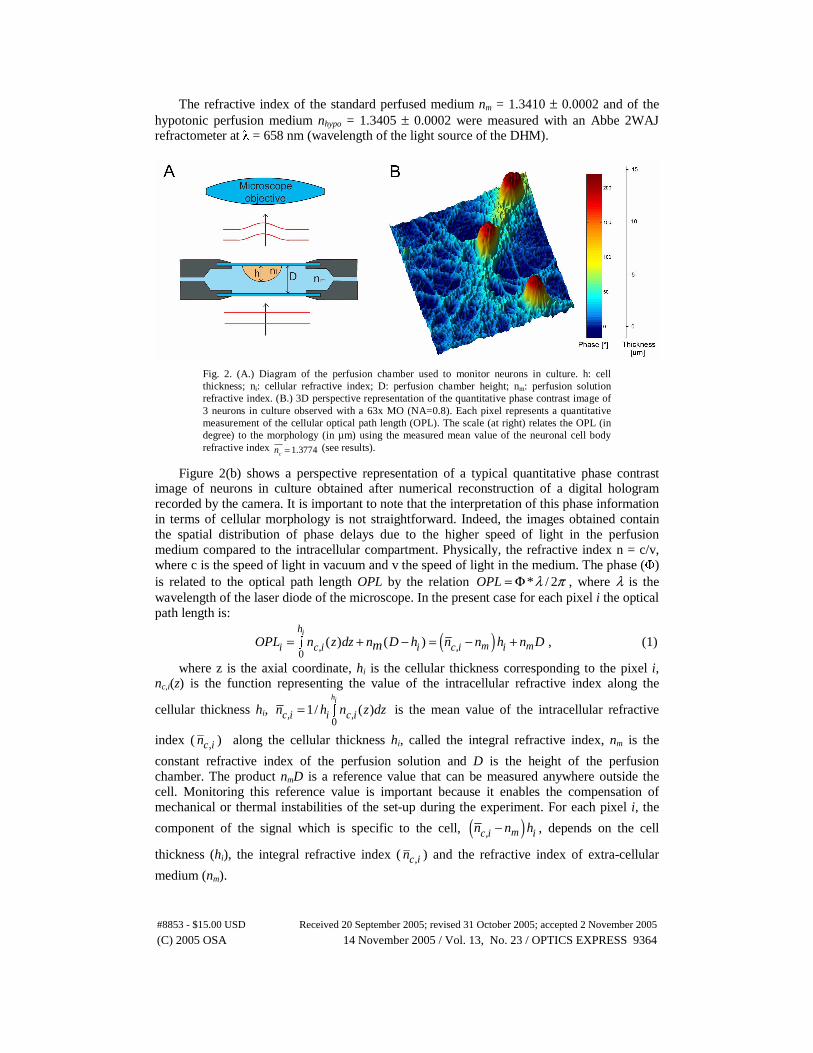
The refractive index of the standard perfused medium nm = 1.3410 ± 0.0002 and of the hypotonic perfusion medium nhypo = 1.3405 ± 0.0002 were measured with an Abbe 2WAJ refractometer at λ = 658 nm (wavelength of the light source of the DHM).
Fig. 2. (A.) Diagram of the perfusion chamber used to monitor neurons in culture. h: cell thickness; ni: cellular refractive index; D: perfusion chamber height; nm: perfusion solution refractive index. (B.) 3D perspective representation of the quantitative phase contrast image of 3 neurons in culture observed with a 63x MO (NA=0.8). Each pixel represents a quantitative measurement of the cellular optical path length (OPL). The scale (at right) relates the OPL (in degree) to the morphology (in µm) using the measured mean value of the neuronal cell body refractive index 1.3774cn = (see results).
Figure 2(b) shows a perspective representation of a typical quantitative phase contrast image of neurons in culture obtained after numerical reconstruction of a digital hologram recorded by the camera. It is important to note that the interpretation of this phase information in terms of cellular morphology is not straightforward. Indeed, the images obtained contain the spatial distribution of phase delays due to the higher speed of light in the perfusion medium compared to the intracellular compartment. Physically, the refractive index n = c/v, where c is the speed of light in vacuum and v the speed of light in the medium. The phase (Φ) is related to the optical path length OPL by the relation * / 2OPL λ π= Φ , where λ is the wavelength of the laser diode of the microscope. In the present case for each pixel i the optical path length is:
( ), ,0
( ) ( )ih
m mi c i i c i iOPL n z dz n D h n n h n Dm= + − = − +∫ , (1)
where z is the axial coordinate, hi is the cellular thickness corresponding to the pixel i, nc,i(z) is the function representing the value of the intracellular refractive index along the
cellular thickness hi, , ,0
1/ ( )hi
c i i c in h n z dz= ∫ is the mean value of the intracellular refractive
index ( ,c in ) along the cellular thickness hi, called the integral refractive index, nm is the
constant refractive index of the perfusion solution and D is the height of the perfusion chamber. The product nmD is a reference value that can be measured anywhere outside the cell. Monitoring this reference value is important because it enables the compensation of mechanical or thermal instabilities of the set-up during the experiment. For each pixel i, the
component of the signal which is specific to the cell, ( ), mc i in n h− , depends on the cell
thickness (hi), the integral refractive index ( ,c in ) and the refractive index of extra-cellular
medium (nm).
(C) 2005 OSA 14 November 2005 / Vol. 13, No. 23 / OPTICS EXPRESS 9364#8853 - $15.00 USD Received 20 September 2005; revised 31 October 2005; accepted 2 November 2005

Present performances of our set-up enable a temporal phase stability of 0.7 degree over several hours, for each pixel of a blank phase image i.e. an experimental configuration corresponding to a perfusion chamber without the presence of any cell in it. 16 phase image average results in a temporal phase stability of 0.2 degree corresponding to λ/1800. On the other hand, to minimize the fixed phase pattern noise induced by the coherent noise, a phase blank image is subtracted from each phase image. Consequently, within each reconstructed phase image, it remains a residual granular fixed phase pattern noise characterized by a spatial mean value close to zero and a spatial variation of ~ 1.5 degree.
As far as cells in culture with an mean refractive index of around 1.375 [6,7, this study] are considered, this stability corresponds to a vertical sensitivity of ≈ 11 nanometers. The transverse resolution is, as in classical optical microscopy, diffraction-limited and defined by the numerical aperture (NA) of the microscope objective [4]. For the present experiments achieved with a NA=0.8 and at a wavelength of λ = 658 nm, we obtain a transverse resolution of ≈ 0.6 μm in good agreement with the Rayleigh’s criterion for coherent illumination [8]. We stress out that quantitative phase images of neurons in culture have been obtained without any contrasting agents and at very low light level illumination intensity. Thus, the measured irradiance on the specimen plane is ~ 200 μW/cm2, a value several orders of magnitude lower than the power used in classical confocal laser scanning microscopy.
4. Separate measurement of cellular morphometry and integral refractive index
The phase signal depends on both the thickness and the refractive index of the specimen. To decouple these two contributions, a procedure that we named "decoupling procedure" is applied. It consists in perfusing, consecutively to the standard perfusion solution, a second solution with the same osmolarity (to avoid cell volume variation) but with a different refractive index 'm mn n nδ= + and to record the two corresponding holograms.
Specifically, the refractive index of the second solution is increased by replacing mannitol (a hydrophilic sugar present in the standard perfusion solution) with equal molarity of the hydrophilic molecule Nycodenz (Fig. 3). Typically addition of 4% w/v of Nycodenz increases the refractive index of the solution by δn = 0.006.
Fig. 3. Nycodenz (Histodenz™, C19H26I3N3O9, MW 821.14), the hydrophilic molecule used to shift the refractive index.
The sequence of this procedure is illustrated in Fig. 4. For each pixel i, we obtain two phase recordings ( 1,iϕ , 2,iϕ ). The first one is obtained during the perfusion of the standard
solution containing mannitol (point 1 in Fig. 4).
,1,
2( ) ii mc in n h
πϕλ
= − , (2)
and the second one when the decoupling solution has completely replaced the standard solution in the perfusion chamber. This complete wash out is achieved when the phase signal has stabilized, ~30 seconds after the perfusion switch (point 2 in Fig. 4).
,2,
2( ( ))c ii m in n n h
πϕ δλ
= − + (3)
(C) 2005 OSA 14 November 2005 / Vol. 13, No. 23 / OPTICS EXPRESS 9365#8853 - $15.00 USD Received 20 September 2005; revised 31 October 2005; accepted 2 November 2005
By solving this equation system we obtain, for each pixel i, the integral refractive index:
1
,,
,
1, 2( )i
mi i
c inn
nδ ϕ
ϕ ϕ= +
−, (4)
and the cellular thickness:
( )1, 2, 1,
,
( )
2 2ii i i
c i mn n nh
ϕ ϕ ϕλ λπ δ π
−= =
− (5)
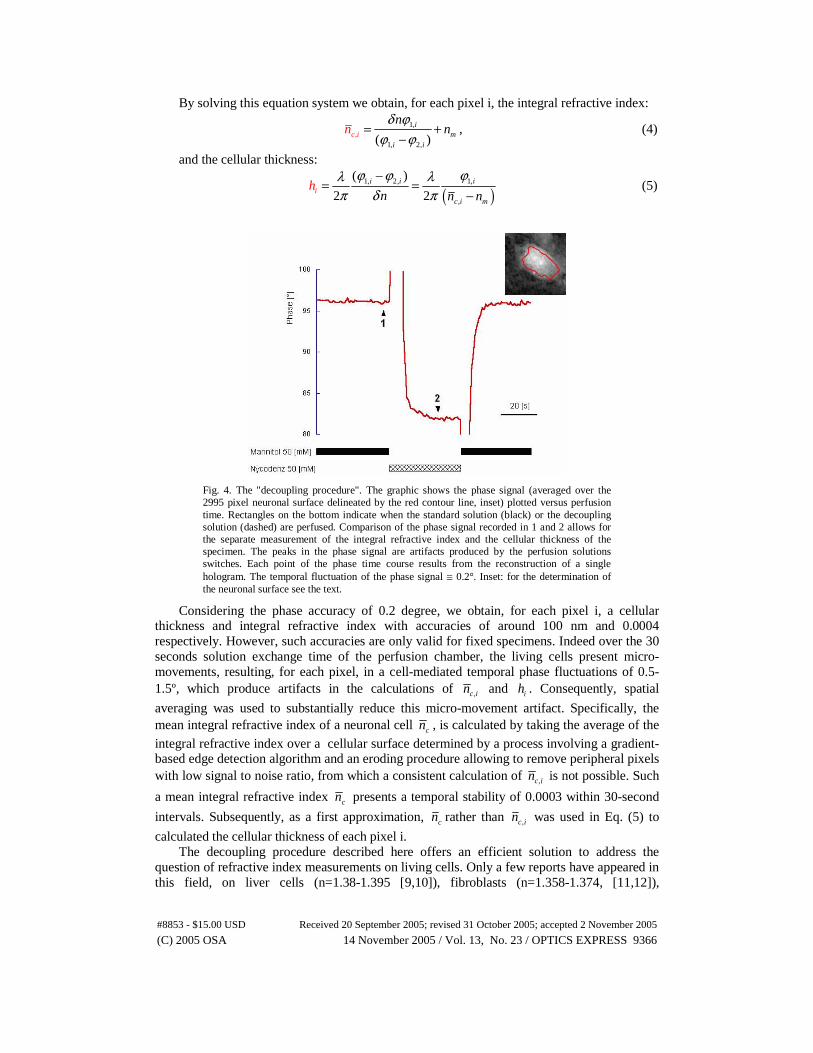
Fig. 4. The "decoupling procedure". The graphic shows the phase signal (averaged over the 2995 pixel neuronal surface delineated by the red contour line, inset) plotted versus perfusion time. Rectangles on the bottom indicate when the standard solution (black) or the decoupling solution (dashed) are perfused. Comparison of the phase signal recorded in 1 and 2 allows for the separate measurement of the integral refractive index and the cellular thickness of the specimen. The peaks in the phase signal are artifacts produced by the perfusion solutions switches. Each point of the phase time course results from the reconstruction of a single hologram. The temporal fluctuation of the phase signal ≅ 0.2°. Inset: for the determination of the neuronal surface see the text.
Considering the phase accuracy of 0.2 degree, we obtain, for each pixel i, a cellular thickness and integral refractive index with accuracies of around 100 nm and 0.0004 respectively. However, such accuracies are only valid for fixed specimens. Indeed over the 30 seconds solution exchange time of the perfusion chamber, the living cells present micro-movements, resulting, for each pixel, in a cell-mediated temporal phase fluctuations of 0.5-1.5º, which produce artifacts in the calculations of ,c in and ih . Consequently, spatial
averaging was used to substantially reduce this micro-movement artifact. Specifically, the mean integral refractive index of a neuronal cell cn , is calculated by taking the average of the integral refractive index over a cellular surface determined by a process involving a gradient-based edge detection algorithm and an eroding procedure allowing to remove peripheral pixels with low signal to noise ratio, from which a consistent calculation of ,c in is not possible. Such
a mean integral refractive index cn presents a temporal stability of 0.0003 within 30-second
intervals. Subsequently, as a first approximation, cn rather than ,c in was used in Eq. (5) to
calculated the cellular thickness of each pixel i. The decoupling procedure described here offers an efficient solution to address the
question of refractive index measurements on living cells. Only a few reports have appeared in this field, on liver cells (n=1.38-1.395 [9,10]), fibroblasts (n=1.358-1.374, [11,12]),
(C) 2005 OSA 14 November 2005 / Vol. 13, No. 23 / OPTICS EXPRESS 9366#8853 - $15.00 USD Received 20 September 2005; revised 31 October 2005; accepted 2 November 2005
mammalian tissues (n=1.38-1.41, [13]), and airway smooth muscle (n=1.360, [14]), but to our knowledge this is the first time that a value for the refractive index of neurons is given with such a high precision.
5. Results and discussion
In animal cells intracellular ions associated with proteins and other biomolecules in the cytoplasm create a difference in water concentration between the inside and outside of the cell. This difference results in an osmotic pressure. In normal conditions, cells control their intracellular osmolarity by actively pumping out inorganic ions [15]. If cells are placed in a hypotonic solution (i.e. a solution having a lower solute concentration and therefore a higher water concentration) a net water influx occurs causing a cellular swelling.
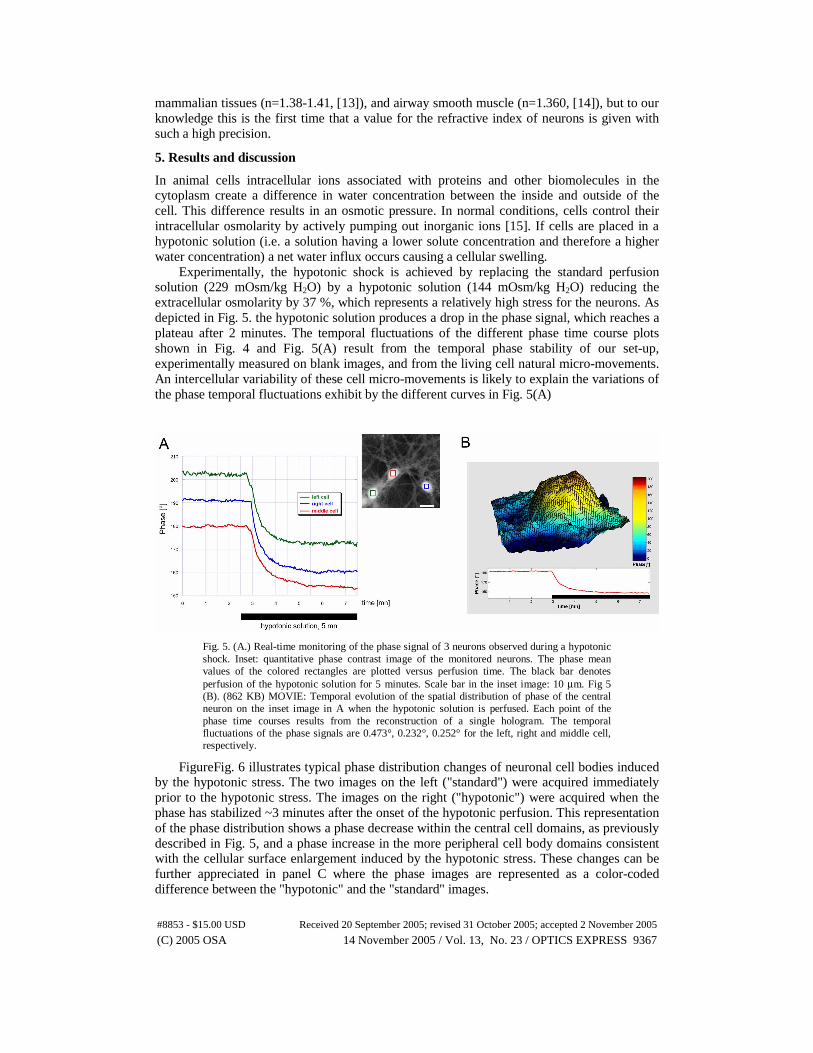
Experimentally, the hypotonic shock is achieved by replacing the standard perfusion solution (229 mOsm/kg H2O) by a hypotonic solution (144 mOsm/kg H2O) reducing the extracellular osmolarity by 37 %, which represents a relatively high stress for the neurons. As depicted in Fig. 5. the hypotonic solution produces a drop in the phase signal, which reaches a plateau after 2 minutes. The temporal fluctuations of the different phase time course plots shown in Fig. 4 and Fig. 5(A) result from the temporal phase stability of our set-up, experimentally measured on blank images, and from the living cell natural micro-movements. An intercellular variability of these cell micro-movements is likely to explain the variations of the phase temporal fluctuations exhibit by the different curves in Fig. 5(A)
Fig. 5. (A.) Real-time monitoring of the phase signal of 3 neurons observed during a hypotonic shock. Inset: quantitative phase contrast image of the monitored neurons. The phase mean values of the colored rectangles are plotted versus perfusion time. The black bar denotes perfusion of the hypotonic solution for 5 minutes. Scale bar in the inset image: 10 μm. Fig 5 (B). (862 KB) MOVIE: Temporal evolution of the spatial distribution of phase of the central neuron on the inset image in A when the hypotonic solution is perfused. Each point of the phase time courses results from the reconstruction of a single hologram. The temporal fluctuations of the phase signals are 0.473°, 0.232°, 0.252° for the left, right and middle cell, respectively.
FigureFig. 6 illustrates typical phase distribution changes of neuronal cell bodies induced by the hypotonic stress. The two images on the left ("standard") were acquired immediately prior to the hypotonic stress. The images on the right ("hypotonic") were acquired when the phase has stabilized ~3 minutes after the onset of the hypotonic perfusion. This representation of the phase distribution shows a phase decrease within the central cell domains, as previously described in Fig. 5, and a phase increase in the more peripheral cell body domains consistent with the cellular surface enlargement induced by the hypotonic stress. These changes can be further appreciated in panel C where the phase images are represented as a color-coded difference between the "hypotonic" and the "standard" images.
(C) 2005 OSA 14 November 2005 / Vol. 13, No. 23 / OPTICS EXPRESS 9367#8853 - $15.00 USD Received 20 September 2005; revised 31 October 2005; accepted 2 November 2005

Fig. 6. Quantitative phase images of two neuronal cell bodies before (panel A, "standard") and 3 minutes after the onset of the hypotonic shock (panel B, "hypotonic"). C. Color-coded distribution of phase difference resulting from the subtraction of the "standard" image from the "hypotonic" image. Neuronal cell body boundaries have been identified by a gradient-based edge detection algorithm.
The dynamic evolution of the phase difference described in Fig. 6(b) is illustrated in a
movie (Fig. 7).
Fig. 7. (756 KB) MOVIE: Temporal evolution of the phase difference of the central neuron on the inset image Fig. 5 (A) when a hypotonic solution is applied to a neuron. The black bar denotes perfusion of the hypotonic solution. The phase image acquired at time t=0 was subtracted from all the other images of the movie.
Such phase distribution changes, particularly the phase decrease in the central cell region, remain difficult to be interpreted as a cellular swelling. To investigate this a priori paradoxical phase behavior we applied the decoupling procedure described earlier to separately measure the mean integral refractive index and the thickness of the neuronal cell bodies. The procedure has been performed at two time points: immediately prior the hypotonic shock and during the shock when the phase signal has stabilized.
The decoupling procedure (Fig. 8) shows the cell body morphometry of the two neurons presented in Fig. 6. Specifically, each image pixel i represents the cellular thickness hi, thus allowing to visualize the neuronal shape. These morphometry images indicate clearly the expected hypotonic neuronal swelling. The hypotonic-mediated shape variations can be clearly seen on Fig. 8(b). One should note an inhomogeneous neuronal swelling, weaker in
(C) 2005 OSA 14 November 2005 / Vol. 13, No. 23 / OPTICS EXPRESS 9368#8853 - $15.00 USD Received 20 September 2005; revised 31 October 2005; accepted 2 November 2005

some central domains of the cell body (green-yellow region in Fig. 8(b), proportionally to the cellular thickness before the hypotonic shock.
The use of cn rather than the set of { },c in in the decoupling procedure does not take into
account the spatial variation of the cellular refractive index and can introduce some local
artifacts on the resulting morphometry. However, from the set of { },c in , it follows a refractive
index spatial variation of ~ 0.005 (0.0055 for cell 1, 0.0046 for cell 2 of the Table 1). Besides, we point out that the residual fixed phase pattern noise, previously described, induced an error on the integral refractive index ,c in measurement of a few ten thousandths stressing the
cellular origin of the measured integral refractive index spatial variation. Consequently, resulting from the refractive index spatial variation and from the cell-mediated temporal phase fluctuations, the cell thickness measurements ih , for each pixel i, performed
with cn , exhibit an accuracy ~ 1 µm. Spatial averaging can improve the cellular thickness measurement accuracy. For instance, a 36-pixels average allows a local cellular thickness measurement with accuracy 0.7 µm. Such accuracy of the cellular thickness measurement stresses out that the anisotropic cellular swelling induces by the osmotic shock (Fig. 8(c) ) is not an artifact due to the use of the mean integral refractive index.
Fig. 8. Morphometry of 2 cell bodies before (panel A) and 3 minutes after the onset (panel B) of a hypotonic shock. Here the z-axis (cellular thickness) is expressed in micrometers. These values where obtained using the results of the decoupling procedure. C. Color-coded distribution of thickness variations resulting from the subtraction of the "standard" image to the "hypotonic" image.
Table 1 below presents the hypotonic-medium induced changes in the mean integral refractive index cn , the neuronal cell surface Scell and volume Vcell and the swelling factor β
defined as the ratio of the neuronal volumes after and before the shock ( 0/hypoV Vβ = ).
Cellular volumes have been estimated from morphometry images by the following expression:
2
Pixelcell Cell Cell
SV N h
M≅ , (6)
where CellN represents the numbers of pixels within neuronal cell surface Scell, Spixel is the pixel surface of the reconstructed image, M the DHM magnification and
1
Cell
Cell ii SCell
h hN ∈
= ∑ . The summation is achieved on all the pixels within the neuronal body
(Scell).
(C) 2005 OSA 14 November 2005 / Vol. 13, No. 23 / OPTICS EXPRESS 9369#8853 - $15.00 USD Received 20 September 2005; revised 31 October 2005; accepted 2 November 2005
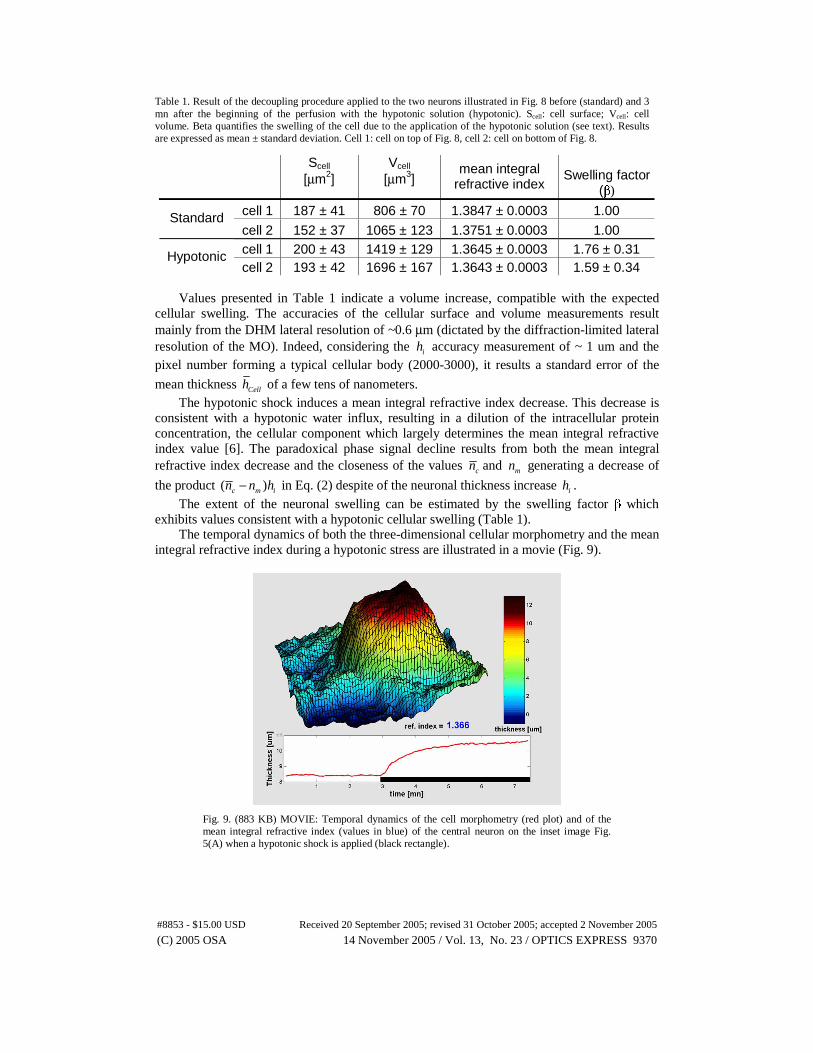
Table 1. Result of the decoupling procedure applied to the two neurons illustrated in Fig. 8 before (standard) and 3 mn after the beginning of the perfusion with the hypotonic solution (hypotonic). Scell: cell surface; Vcell: cell volume. Beta quantifies the swelling of the cell due to the application of the hypotonic solution (see text). Results are expressed as mean ± standard deviation. Cell 1: cell on top of Fig. 8, cell 2: cell on bottom of Fig. 8.
Scell [μm2]
Vcell [μm3]
mean integral refractive index
Swelling factor (β)
cell 1 187 ± 41 806 ± 70 1.3847 ± 0.0003 1.00 Standard cell 2 152 ± 37 1065 ± 123 1.3751 ± 0.0003 1.00 cell 1 200 ± 43 1419 ± 129 1.3645 ± 0.0003 1.76 ± 0.31 Hypotonic cell 2 193 ± 42 1696 ± 167 1.3643 ± 0.0003 1.59 ± 0.34
Values presented in Table 1 indicate a volume increase, compatible with the expected
cellular swelling. The accuracies of the cellular surface and volume measurements result mainly from the DHM lateral resolution of ~0.6 μm (dictated by the diffraction-limited lateral resolution of the MO). Indeed, considering the ih accuracy measurement of ~ 1 um and the pixel number forming a typical cellular body (2000-3000), it results a standard error of the
mean thickness Cellh of a few tens of nanometers. The hypotonic shock induces a mean integral refractive index decrease. This decrease is
consistent with a hypotonic water influx, resulting in a dilution of the intracellular protein concentration, the cellular component which largely determines the mean integral refractive index value [6]. The paradoxical phase signal decline results from both the mean integral refractive index decrease and the closeness of the values cn and mn generating a decrease of
the product ( )c m in n h− in Eq. (2) despite of the neuronal thickness increase ih . The extent of the neuronal swelling can be estimated by the swelling factor β which
exhibits values consistent with a hypotonic cellular swelling (Table 1). The temporal dynamics of both the three-dimensional cellular morphometry and the mean
integral refractive index during a hypotonic stress are illustrated in a movie (Fig. 9).
Fig. 9. (883 KB) MOVIE: Temporal dynamics of the cell morphometry (red plot) and of the mean integral refractive index (values in blue) of the central neuron on the inset image Fig. 5(A) when a hypotonic shock is applied (black rectangle).
(C) 2005 OSA 14 November 2005 / Vol. 13, No. 23 / OPTICS EXPRESS 9370#8853 - $15.00 USD Received 20 September 2005; revised 31 October 2005; accepted 2 November 2005
The time course of the mean integral refractive index during the hypotonic shock is evaluated by using ( )cn β representing the mean integral refractive index as a function of
β according to the appendix.
Specifically, the β values required to calculate the time course of ( )cn β are obtained by solving for each quantitative phase image, recorded at different time during the hypotonic shock, the following equation for β :
( )0
( )2
Totc mn n
V
ϕλβ βπ
− = , (7)
with Totϕ is for each image the measured phase quantity defined by :
2
( ( ) )Cell
Tot i c mi S
n n Vπϕ ϕ βλ∈
= ≅ −∑ , (8)
where the summation is performed on all the pixels i within the neuronal body (Scell).
6. Conclusion
Digital holography microscopy (DHM) is a technique that allows to obtain, from a single recorded hologram, quantitative phase images of living cell dynamics with interferometric resolution. These dynamic quantitative phase images, containing information about both the cell morphometry and the integral refractive index, can be unambiguously interpreted thanks to the decoupling procedure presented here. Specifically, the study of the cell shape dynamics can be addressed, as well as the measurement of the integral refractive index. Quantitatively, the local cellular thickness measurement can be performed with accuracy of 1 µm. However, spatial averaging allows to measure the mean thickness of cellular regions corresponding to the size of typical neuronal bodies, i.e. 170 µm2, with an accuracy of a few tens of nanometers. On the other hand, the spatial variations of the integral refractive index have been estimated at 0.005 and the mean integral refractive index can be measured with an accuracy of 0.0003. The cellular refractive index is a poorly documented parameter which is related to the intracellular content and which is relevant for the interpretation of the functional light imaging signal resulting from a multiple scattering process in biological tissues.
Acknowledgments
This work was supported by grants 31-51882.97, 21-67068.01, and 205320-103885/1 from the Swiss National Science Foundation and CTI project 6606.2. The authors wish to thank Nicolas Aspert for his reading of the manuscript.
(C) 2005 OSA 14 November 2005 / Vol. 13, No. 23 / OPTICS EXPRESS 9371#8853 - $15.00 USD Received 20 September 2005; revised 31 October 2005; accepted 2 November 2005

Appendix
The purpose of this appendix is to express, from a limited set of cellular parameters, the mean mean refractive index cn as a function of the cellular swelling factor β , and to fully determine it by the measured values of the mean integral refractive indices. Within this framework, the function ( )cn β can be written by the following expression
( ) (1 ) ( )c cyt solid
r rn n nβ β
β β= − + , (9)
where cytn represents the refractive index of the cellular aqueous phase equivalent to the
osmotic active phase or cytosolic phase [16]; solidn is the refractive index of the solid cellular
phase or the inactive osmotic space solidV occupied in particular by the membranes and that
amounts to 20-40% of the total cell volume [16]; β is the swelling factor defined by 0
V
Vβ = ,
where 0V , V are the total cell volume before and after the hypotonic shock and r is defined
by the ratio solidV
V.
Within the framework of the lowest order mean field theory approximation, using the Lorentz-Lorenz formula [8], the refractive index of a mixture like the cytosol, can be expressed as a function which depends on the polarisability and osmolarity of the different intracellular constituents by the following expression
2 2
2
2 2
( , ) 11
13
H O H O x xx
cyt x H O
H O H O x xx
N Nn N N
N N
α α
α α
+= +
⎛ ⎞− +⎜ ⎟⎝ ⎠
∑
∑
, (10)
where xα , xN represent respectively the molar polarisabilities and the intracellular molar concentrations of the different substances x forming the osmotic active phase (ions, proteins, etc.) and
2H Oα , 2H ON are respectively the molar polarisability and intracellular molar
concentration of water. By assuming a neuronal swelling resulting from a pure water influx, Eq. (10) can be
rewritten as a function depending on 0 1
solidcyt
solid
rV VV V r
ββ −−= =− − , the swelling factor of the
osmotic active phase :
2
2 2
2
2 2
2 2
(1 ) 1
( ) 1(1 )1 1
13
1
111
13
H O
H O H O x xx
H O
H O H O x xx
H O H O
cyt
cyt cyt
cyt cytcyt
cyt cyt
cyt
cyt cyt
cyt
cyt
pC N
np
C N
CC
βα α
β ββ
βα α
β β
βα
β β
ββ
⎧ ⎫− −⎪ ⎪ +⎨ ⎬⎪ ⎪⎩ ⎭= + =⎛ ⎞⎧ ⎫− −⎪ ⎪⎜ ⎟− +⎨ ⎬⎜ ⎟⎪ ⎪⎩ ⎭⎝ ⎠
⎧ ⎫−⎪ ⎪ +⎨ ⎬⎪ ⎪⎩ ⎭+
⎧ ⎫−⎪ ⎪− ⎨ ⎬⎪ ⎪⎩ ⎭
∑
∑
2 2H O H O
cyt
CC α
β
⎛ ⎞⎜ ⎟+⎜ ⎟⎝ ⎠
, (11)
(C) 2005 OSA 14 November 2005 / Vol. 13, No. 23 / OPTICS EXPRESS 9372#8853 - $15.00 USD Received 20 September 2005; revised 31 October 2005; accepted 2 November 2005

where 2 2 2
1x x H O H O H O
x
C
cyt
N p Cα αβ
=⎛ ⎞+⎜ ⎟⎝ ⎠∑ and 2
2
0
H O
H O
Vp
V= is the ratio, before the
osmotic shock, of the water intracellular volume 2H OV to the total cellular volume and
2H OC is
the number of water moles per unit of water volume, whose value is 55.5 [moles/l]. So far we have a set of three unknown parameters { }, ,solidr n C , which are determined in
the following way. Accordingly to the literature, r is arbitrarily chosen within the typical range of [0.2,0.4] [16] and the corresponding { }( ), ( )solidn r C r are determined by solving the
system of simultaneous equations 1 ,1( 1)c cn nβ β= = = and 2 ,2( )c cn nβ β= = , where { }1 2,β β
are the swelling factors and { },1 ,2,c cn n the mean integral refractive indices experimentally
measured before and after the osmotic shock. The function ( , , , )c Solidn r n Cβ obtained so far exhibits the property to be independent of
the parameter sets { }, ( ), ( )solidr n r C r calculated, as previously described, for any values of
[0,1]r ∈ . Consequently, r is a non-relevant parameter for the determination of the mean
integral refractive index as a function of β . Moreover, the choice of the parameter r within
the range of [0.2,0.4] does not significantly modify the parameter ( )cytn β . On the other hand,
the value of solidn is modified by the choice of r We have to mention that this system of the two simultaneous equation has as many as
three real solutions, but there is only one that makes physical sense, requiring in particular that ( ) 1.333cytn β > and solid cn n> . The range of possible values for 2β allowing to obtain such
physically significant solutions represents an interval width of only a few thousandths and generally does not include the measured value of 2β . However, the possible values for 2β lie
in the uncertainty range of 2β measurements. Practically, r-value has been set to 0.3 and the
2β value chosen as the median of the possible values. For instance, concerning the two
neurons of Fig. 8, we have 2 1.643β = , ( 1) 1.364cytn β = ≅ , 1.42solidn ≅ for cell 1 and
2 1.346β = , ( 1) 1.355cytn β = ≅ , 1.398solidn ≅ for cell 2. For β values in the range [1, 1.2]
( )cytn β exhibits a quasi linear behavior, indicating that in physiological conditions, cellular
material increases the refractive index in direct proportion to the amount of no-aqueous material present, whether in the dissolve state or not. This linear relationship is in agreement with the seminal work of Davies H G, in 1952 [17].
(C) 2005 OSA 14 November 2005 / Vol. 13, No. 23 / OPTICS EXPRESS 9373#8853 - $15.00 USD Received 20 September 2005; revised 31 October 2005; accepted 2 November 2005
Top Related
Copyright © 2022 FDOKUMEN

