


Bahasa
Halaman
Hukum

MCAM: Multiple Clustering Analysis Methodology forDeriving Hypotheses and Insights from High-ThroughputProteomic DatasetsKristen M. Naegle1,2, Roy E. Welsch3, Michael B. Yaffe1,2,4, Forest M. White1,2, Douglas A. Lauffenburger1*
1 Department of Biological Engineering, Massachusetts Institute of Technology, Cambridge, Massachusetts, United States of America, 2 Koch Institute for Integrative
Cancer Research, Massachusetts Institute of Technology, Cambridge, Massachusetts, United States of America, 3 Sloan School of Management, Massachusetts Institute of
Technology, Cambridge, Massachusetts, United States of America, 4 Department of Biology, Massachusetts Institute of Technology, Cambridge, Massachusetts, United
States of America
Abstract
Advances in proteomic technologies continue to substantially accelerate capability for generating experimental data onprotein levels, states, and activities in biological samples. For example, studies on receptor tyrosine kinase signalingnetworks can now capture the phosphorylation state of hundreds to thousands of proteins across multiple conditions.However, little is known about the function of many of these protein modifications, or the enzymes responsible formodifying them. To address this challenge, we have developed an approach that enhances the power of clusteringtechniques to infer functional and regulatory meaning of protein states in cell signaling networks. We have created a newcomputational framework for applying clustering to biological data in order to overcome the typical dependence onspecific a priori assumptions and expert knowledge concerning the technical aspects of clustering. Multiple clusteringanalysis methodology (‘MCAM’) employs an array of diverse data transformations, distance metrics, set sizes, and clusteringalgorithms, in a combinatorial fashion, to create a suite of clustering sets. These sets are then evaluated based on theirability to produce biological insights through statistical enrichment of metadata relating to knowledge concerning proteinfunctions, kinase substrates, and sequence motifs. We applied MCAM to a set of dynamic phosphorylation measurements ofthe ERRB network to explore the relationships between algorithmic parameters and the biological meaning that could beinferred and report on interesting biological predictions. Further, we applied MCAM to multiple phosphoproteomic datasetsfor the ERBB network, which allowed us to compare independent and incomplete overlapping measurements ofphosphorylation sites in the network. We report specific and global differences of the ERBB network stimulated withdifferent ligands and with changes in HER2 expression. Overall, we offer MCAM as a broadly-applicable approach for analysisof proteomic data which may help increase the current understanding of molecular networks in a variety of biologicalproblems.
Citation: Naegle KM, Welsch RE, Yaffe MB, White FM, Lauffenburger DA (2011) MCAM: Multiple Clustering Analysis Methodology for Deriving Hypotheses andInsights from High-Throughput Proteomic Datasets. PLoS Comput Biol 7(7): e1002119. doi:10.1371/journal.pcbi.1002119
Editor: Jason A. Papin, University of Virginia, United States of America
Received February 15, 2011; Accepted May 25, 2011; Published July 21, 2011
Copyright: � 2011 Naegle et al. This is an open-access article distributed under the terms of the Creative Commons Attribution License, which permitsunrestricted use, distribution, and reproduction in any medium, provided the original author and source are credited.
Funding: This work was supported by NIH-U54-CA112967 and NIH-R01-CA096504. The funders had no role in the study design, data collection and analysis,decision to publish, or preparation of the manuscript.
Competing Interests: The authors have declared that no competing interests exist.
* E-mail: [email protected]
Introduction
Large and complex high-throughput proteomic experimental
studies are becoming more accessible through the use of
powerful, swiftly developing platforms such as mass spectrometry
(MS), flow cytometry (FC), and various kinds of protein
microarrays (PMA) [1–3]. As one particular example of
increasing attention, there has been an explosion in large-scale
datasets for receptor tyrosine kinase (RTK) network signaling by
the combination of protein post-translational modification
enrichment followed by quantitative MS methods [4]. In
receptor tyrosine kinase (RTK) networks, such as those activated
by the ERBB family of receptors, phosphorylation plays a central
role in the translation of extracellular cues into phenotypic
changes, such as differentiation, proliferation, and migration [5].
Phosphorylation on proteins in the RTK network induce a
variety of signaling events including protein-protein interactions,
enzymatic activation and inactivation, and cellular localization
changes, such as translocation to the nucleus or recruitment to
the plasma membrane [6–8]. Understanding RTK networks,
and the phosphorylation that occurs within them, will be
essential for understanding RTK signaling in normal and
dysregulated conditions. Mass spectrometry measurement of
phosphorylation events in cellular signaling networks is greatly
increasing our understanding of the specific modifications
occurring in the cell as well as their relative changes in response
to network perturbations, such as ligand stimulation or kinase
inhibition. However, the pace of identification of phosphoryla-
tion sites in cellular networks has outstripped our ability to
understand the function and regulation of the measured
phosphorylation sites as evidenced by the sharp increase in
phosphorylation database repository sizes, such as Phospho.ELM
[9]. Unsupervised computational learning methods, applied to
quantitative phosphoproteomic data, provides one method by
PLoS Computational Biology | www.ploscompbiol.org 1 July 2011 | Volume 7 | Issue 7 | e1002119

which to infer function and regulation of phosphorylation within
cell signaling networks. Previous studies have shown success in
application of unsupervised learning to phosphoproteomic data
[10–12], however each has presented the results of a single
clustering solution, and to date, no extensive study of the
relationship between unsupervised learning and phosphoproteo-
mic data has been produced. Phosphoproteomic data represents
a new challenge in unsupervised learning and currently, no gold
standard exists as a method for judging the success of a clustering
solution of phosphoproteomic data.
Unsupervised learning approaches, such as various types of
clustering algorithms, have been heavily utilized to productive
effect in the biological community in application to other kinds of
high-throughput biomolecular measurements including gene
sequence [13], gene expression [14], and metabolomics [15].
Unsupervised learning algorithms, often referred to as clustering,
seek to group components of a multidimensional dataset into
clusters where intra-cluster differences are minimized and inter-
cluster differences are maximized. Successful application of
clustering has demonstrated its usefulness in reducing dataset
dimensionality and providing biological hypotheses through the
use of inference. Application of unsupervised learning to
biological datasets is extensive and includes a seemingly endless
option of algorithms, such as Kmeans [14], hierarchical
clustering [16], self organizing maps [17], and affinity propaga-
tion [18]. Since most clustering algorithms base clustering
solutions on the similarity, or dissimilarity, between two vectors
of measurements based on a distance metric, the metric used will
have an impact on the final solution as will any alteration applied
to the vectors by data transformations. Several studies have
examined the effect different distance metrics [19–21] and data
transformations [21,22] have on clustering solutions of experi-
mentally-derived data. In addition to choosing an appropriate
algorithm, distance metric, and data transformation, scientists are
also faced with having to determine a suitable number of clusters
(K) in which to partition their dataset, since few algorithms
incorporate concurrent optimization of K. A variety of methods
for determining the natural cluster structure of a dataset have
been proposed, see [23] for an example of their comparative
performances using a set of microarray experiments. Taken as a
whole, the historical application of unsupervised learning to
microarray data, as well as other large biological datasets,
indicates a vast landscape of decisions required to apply
unsupervised learning effectively. We view this vastness as
offering an opportunity for enhanced capability to gain
biochemical and biological insights, via an approach that takes
advantage of the diversity by seeking consistencies and contrasts.
In this work we create a framework, Multiple Clustering
Analysis Methodology (MCAM), in which one can apply a vast
array of algorithms, distance metrics, data transformations, and
cluster set sizes, in a combinatorial fashion, i.e. by the exhaustive
combination of all chosen parameters, to a biological dataset and
then subsequently compile and evaluate the outcome of all
solutions. In this framework, enrichment for biological terms
within clustering partitions, relative to the dataset, gives us a
metric for evaluating the success of any particular clustering
implementation. The use of this framework allows scientists to
apply unsupervised learning in a way that requires no a priori
knowledge or assumptions regarding the most useful clustering
algorithm, distance metric, data transformation, or set size. We
apply MCAM to diverse phosphoproteomic time-course datasets
arising from studies of the ERBB network, where interesting
biological enrichment includes Gene Ontology terms, protein
domains, kinase and phosphopeptide binding domain predictions,
and amino acid sequence motifs. We explore results from these
analyses for relationships between biological metrics and the
parameters of clustering and develop methods for combining
results of clustering to produce robust biological hypotheses and
inference. Using this information we explore the difference
between two independent measurements of ERBB signaling and
find interesting modules of signaling that may be responsible for
the migratory potential of HER2 amplification in cancer. The
implementation of MCAM was done through a mix of Matlab and
Perl scripts. The Perl programs for analyzing enrichment have
been incorporated directly into the PTMScout interface (http://
ptmscout.mit.edu) [24] and the Matlab tools to generate MCAM
cluster sets and analyze resulting enrichment are available for
download from PTMScout as well. PTMScout is an open-access
web and data resource that contains experimental information
concerning protein phosphorylation and lysine acetylation, tools
for analyzing proteomic datasets, and the ability for users to
directly load new experiments for analysis and data-sharing
purposes.
Results
Overview of methodologyThe MCAM framework is depicted in Figure 1. Our specific
interest was to cluster dynamic phosphorylation measurements of
the ERBB network in order to find phosphorylation events with
similar temporal dynamics leading to possible hypotheses
regarding shared regulation or shared functionality. In the MCAM
framework, a biological dataset, here dynamic phosphorylation
measurements, is first subjected to a set of data transformations,
such as log transformation or mean-centering; this transformed
data is then clustered via the exhaustive combination of different
algorithms, distance metrics, and solution set sizes (K). In our
implementations, this produces on the order of 1,500 to 2,500
clustering sets, which we refer to as an MCA. Each set in an MCA
represents the complete clustering solution of a single combination
Author Summary
Proteomic measurements, especially modification mea-surements, are greatly expanding the current knowledgeof the state of proteins under various conditions.Harnessing these measurements to understand how thesemodifications are enzymatically regulated and theirsubsequent function in cellular signaling and physiologyis a challenging new problem. Clustering has been veryuseful in reducing the dimensionality of many types ofhigh-throughput biological data, as well inferring functionof poorly understood molecular species. However, itsimplementation requires a great deal of technical expertisesince there are a large number of parameters one mustdecide on in clustering, including data transforms, distancemetrics, and algorithms. Previous knowledge of usefulparameters does not exist for measurements of a newtype. In this work we address two issues. First, we developa framework that incorporates any number of possibleparameters of clustering to produce a suite of clusteringsolutions. These solutions are then judged on their abilityto infer biological information through statistical enrich-ment of existing biological annotations. Second, we applythis framework to dynamic phosphorylation measure-ments of the ERBB network, constructing the firstextensive analysis of clustering of phosphoproteomic dataand generating insight into novel components and novelfunctions of known components of the ERBB network.
A Framework for Clustering of Biological Datasets
PLoS Computational Biology | www.ploscompbiol.org 2 July 2011 | Volume 7 | Issue 7 | e1002119

of clustering parameters. Next, we calculate enrichment in all
biological metric terms, as well as markers for time dynamics,
Table 1, within each cluster, compared to the full dataset, using
the hypergeometric function and the False Discovery Rate, FDR
[25], procedure to correct for multiple hypothesis testing for every
metric across a set, Figure 1B. Enrichment in biological metrics
will give us a method by which we can judge the fitness of a
clustering solution for known biological information, where those
categories include information about structure and function of a
protein as well as information about the regulation and function of
the particular phosphorylation sites, Table 1. Finally, we test, for
every parameter of clustering, the impact on the biological
information if all sets with that parameter are removed.
Parameters are removed from the final set when the removal of
that parameter results in a significant improvement of overall
biological enrichment and does not significantly decrease the
enrichment of any single category of biological information. This
pruning, or parameter refinement, allows us to remove clustering
solutions which, according to the current biological metrics, are
ineffective at producing solutions of biological import. We call this
post-pruned set of solutions MCAfinal , for the final Multiple
Clustering Analysis. It is important to consider that each clustering
solution in an MCA is derived by the quantitative measurements
alone, in an unsupervised manner. However, biological enrich-
ment is used to shape the final MCA representing a feature
selection step in the MCAM method. MCAfinal is typically on the
order of 500 clustering sets. With this final MCA we can begin to
compile the biological information that is contained, explore how
clustering parameters compare to each other using mutual
information, how clustering parameters relate to particular
biological metrics, and consider biological hypotheses generated
throughout all of these steps.
In this work we will focus on studies of ERBB network
dynamics. In a first example, we evaluate a four time point
measurement of the 184A1 human mammary epithelial cell
(HMEC) line stimulated with a saturating concentration of EGF,
where measurements were taken before stimulation (0 min) and
then subsequently at 5, 10 and 30 minutes following EGF addition
[26]. Enrichment and fractionation steps focused on capturing
tyrosine phosphorylation signaling events in the ERBB network.
This dataset represents extensive measurement of the phosphotyr-
osine ERBB signaling network, with 77 unique phosphopeptide
measurements on 68 proteins. Throughout this work we will refer
to this dataset as EGF4 for brevity. This dataset, a 7764 matrix,
represents the relative quantitative measurements of 77 phospho-
peptides in time following EGF stimulation, where the vectors used
in clustering are the dynamic measurements of a single
phosphopeptide. The full dataset is plotted in principal component
space in Supplementary Figure S1. The clustering parameters
originally applied, and those removed during pruning, are
described in Table 2. The original MCA included 1,320 sets
and after pruning, MCAfinal included 331 total sets. Pruning
indicates that for this dataset and set of parameters, the use of
Hierarchical clustering, set sizes of two and four, the differential
transformation, and the use of correlation and cosine as a distance
metrics are uninformative in producing enrichment in the
categories tested. The 331 sets remaining after parameter
refinement produces a wide diversity of biological enrichment
across all categories of information.
Validation of biological enrichmentIn order to ensure that the basis of our analysis for clustering
fitness is a product of actual biological power, versus the
production of a large degree of false positives due to Type I
Figure 1. Multiple Clustering Analysis Method. A) MCAM begins with clustering a biological dataset through the combinatorial application of aset of clustering parameters, followed by biological enrichment testing in various categories of information. Following this, the enrichment is used toprune those parameters that contribute little biological information. B) The depiction of an MCA, which contains M sets, with each set having somenumber of k clusters and produced by a particular combination of clustering parameters. Biological enrichment is corrected for multiple hypothesistesting by using the False Discovery Rate procedure across a set and within a category of biological information. Mutual Information can be used tocompare the resulting clustering solution between any two sets.doi:10.1371/journal.pcbi.1002119.g001
A Framework for Clustering of Biological Datasets
PLoS Computational Biology | www.ploscompbiol.org 3 July 2011 | Volume 7 | Issue 7 | e1002119
error, we performed ten random controls, Figure 2 and
Supplementary Figure S2, using two different randomization
methods. In the first method, the data matrix is randomly
reshuffled and subjected to clustering using the same parameters as
in MCAfinal , followed by enrichment analysis. This method should
control for the mechanics of clustering random data. The second
method randomized the biological labels assigned to the vector
dynamics by randomly reshuffling the assignment of phosphopep-
tides to the measured phosphorylation dynamics. This random-
ization process should control for the potential limitations in the
annotations used for enrichment. Both methods gave similar
results, and if not explicitly stated otherwise, the results described
in this paper refer to randomization using the first method
described.
Figures 2A and B depict the extent of biological enrichment
found in one representative metric, PFAM domains, for both real
data and a representative random control. Figures 2A and B
represent the total number of enriched PFAM labels found per
cluster set, in order of descending degree of enrichment per set.
The ‘top’ and ‘bottom’ quartiles, according to total enrichment per
set, are indicated since they will be used extensively throughout
this work. As expected, we do see some enrichment in the random
control, which represents a small number of false positives,
however the contrast between the results of clustering real
biological data and random data is stark. These observations
indicate that clustering of temporal phosphorylation measure-
ments is capable of producing meaningful biological enrichment
and may therefore be useful for inferring function and regulation
of poorly understood phosphorylation events in the ERBB
network.
To ensure that Type I error, or the false positive rate, is
controlled, at least empirically, at the target rate of 0.05 or better,
we plotted the rate of null hypothesis rejection across all metrics
for real data and for the 10 random controls, Figure 2C. Figure 2C
shows that for most categories the rate of null hypothesis rejection
is higher than the random controls, and for all controls Type I
error is empirically controlled at 0.05 or better, with only one
outlier in the case of GO Molecular Function terms. We also
wanted to explore the total number of statistically significant labels
produced in real versus random MCA sets, shown in Figure 2D
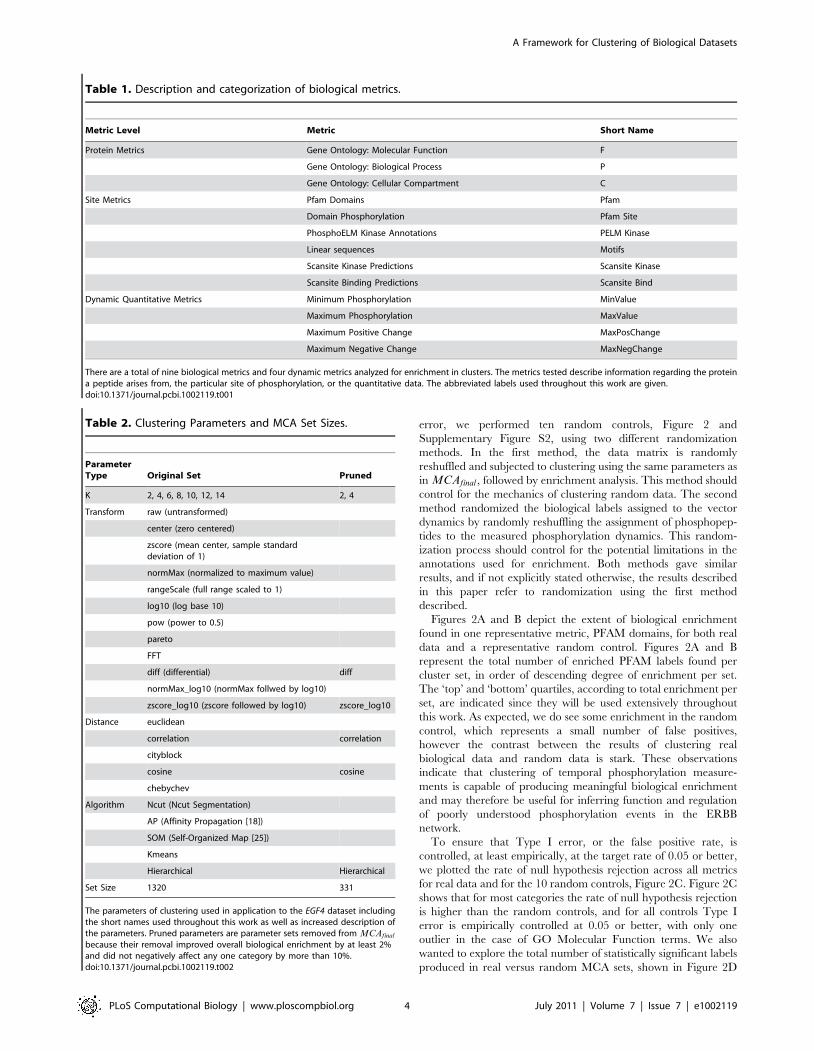
Table 1. Description and categorization of biological metrics.
Metric Level Metric Short Name
Protein Metrics Gene Ontology: Molecular Function F
Gene Ontology: Biological Process P
Gene Ontology: Cellular Compartment C
Site Metrics Pfam Domains Pfam
Domain Phosphorylation Pfam Site
PhosphoELM Kinase Annotations PELM Kinase
Linear sequences Motifs
Scansite Kinase Predictions Scansite Kinase
Scansite Binding Predictions Scansite Bind
Dynamic Quantitative Metrics Minimum Phosphorylation MinValue
Maximum Phosphorylation MaxValue
Maximum Positive Change MaxPosChange
Maximum Negative Change MaxNegChange
There are a total of nine biological metrics and four dynamic metrics analyzed for enrichment in clusters. The metrics tested describe information regarding the proteina peptide arises from, the particular site of phosphorylation, or the quantitative data. The abbreviated labels used throughout this work are given.doi:10.1371/journal.pcbi.1002119.t001
Table 2. Clustering Parameters and MCA Set Sizes.
ParameterType Original Set Pruned
K 2, 4, 6, 8, 10, 12, 14 2, 4
Transform raw (untransformed)
center (zero centered)
zscore (mean center, sample standarddeviation of 1)
normMax (normalized to maximum value)
rangeScale (full range scaled to 1)
log10 (log base 10)
pow (power to 0.5)
pareto
FFT
diff (differential) diff
normMax_log10 (normMax follwed by log10)
zscore_log10 (zscore followed by log10) zscore_log10
Distance euclidean
correlation correlation
cityblock
cosine cosine
chebychev
Algorithm Ncut (Ncut Segmentation)
AP (Affinity Propagation [18])
SOM (Self-Organized Map [25])
Kmeans
Hierarchical Hierarchical
Set Size 1320 331
The parameters of clustering used in application to the EGF4 dataset includingthe short names used throughout this work as well as increased description ofthe parameters. Pruned parameters are parameter sets removed from MCAfinal
because their removal improved overall biological enrichment by at least 2%and did not negatively affect any one category by more than 10%.doi:10.1371/journal.pcbi.1002119.t002
A Framework for Clustering of Biological Datasets
PLoS Computational Biology | www.ploscompbiol.org 4 July 2011 | Volume 7 | Issue 7 | e1002119

and Supplementary Figure S2 for randomization using the second
method described above. Bonferroni correction was also used and
the results were similar regarding empirical control of the false
positive rate, but demonstrated a large loss in statistical power,
Supplementary Figure S3. Given these results, FDR correction is
used in all further results presented.
Figure 2 shows some categories, like motifs, which have roughly
the same rate of null hypothesis rejection as random controls, have
a much larger number of total hypothesis tests, resulting in a large
degree of enrichment in the case of real biological data. However,
some categories perform no better than random controls based on
both rate of null hypothesis rejection and total enrichment. These
categories include Scansite Kinase predictions, PhosphoELM
kinase annotations, and phosphorylation within known PFAM
domains (pfam_site). We noticed that despite the fact that overall
enrichment for Scansite Kinase terms was poor in MCAfinal ,
clusters derived using the Fast Fourier Transform, FFT, were
correlated with production of Scansite Kinase enrichment in a
significant manner. We looked at random controls and real
enrichment for Scansite Kinase terms in just FFT derived clusters
and found there was an appreciable improvement in enrichment
for this relative to random controls Supplementary Figure S4,
indicating that for specific enrichment, subsets of MCAfinal could
be considered. This presents a method in which to target clustering
results for producing meaningful information in a particular
biological category. For example, here it appears that the FFT
subset, which performs better than random controls for producing
Scansite Kinase predictions, may provide clusters of phosphory-
lation sites with the power of inferring shared kinase regulation.
Taken together, these results demonstrate that the use of any single
algorithm, distance metric, and transformation would highlight
only a small fraction of the possibly interesting relationships
between the data.
Analysis of clustering parametersWe originally hypothesized that the choice of optimal
unsupervised learning parameters would be dependent on the
biological information desired in the resulting clustering solution.
Figure 2. Biological enrichment in MCA compared to random controls. A) An example histogram of PFAM enrichment in the MCA plotted indescending order of the number of total terms enriched per set. Green lines mark the top 25% and red the bottom 25% of sets based on totalnumber of labels enriched. B) Example resulting enrichment from a random control for PFAM enrichment. C) The rate of null hypothesis rejection, perbiological category, for MCAfinal and ten random controls. Random control distribution plotted in whisker plot and blue circles represent MCAresults. Null hypothesis rejection in a random control is equivalent to a false positive, which as controlled for using the False Discovery Rateprocedure with a cutoff of 0.05. D) Resulting average enrichment found, per category, per cluster in MCAfinal (blue dots) and ten random controls(box plots).doi:10.1371/journal.pcbi.1002119.g002
A Framework for Clustering of Biological Datasets
PLoS Computational Biology | www.ploscompbiol.org 5 July 2011 | Volume 7 | Issue 7 | e1002119

Therefore, we explored the relationship between clustering
parameters and the enriched biological information. We rank
ordered the sets in an MCA in nine ways, according to the degree
of total enrichment the sets contained within each of the nine
biological metrics, depicted in Figure 2A for PFAM domain
ranking. We found that there was no single set that performed in
the top 25% of all nine metric rankings. When we took the union
of the top 25% in the nine orders, we found that 273 sets of the
331 sets in the MCA, or 83% of all sets, were required to capture
the top quartile of all biological information. These results indicate
that, indeed, the choice of ‘optimal’ parameters will be based on
the desired type of categorical relationships, since almost all sets
are required to capture the full array of possible information.
To understand how parameters directly relate to specific types
of biological information, we tested for the overrepresentation of
clustering parameters in the top and bottom quartiles of all nine
biological metrics, and four dynamic metrics, Table 3. We found
that the parameter performance is based on the particular metric
tested. For example, the cityblock distance metric consistently
performs poorly for producing clustering sets with clusters that
have enrichment in GO Molecular Function terms, but the same
distance metric consistently performs well in producing sets with
clusters containing PFAM enrichment. Interestingly, Kmeans
clustering is in the bottom quartile of all biological metrics.
However, since Kmeans was not cut in the reduction stage of
creating MCAfinal , it indicates that is still useful at producing
biological enrichment, unlike those parameters shown in Table 2
that were pruned based on their inability to produce significant
biological meaning. The lack of enrichment for a parameter in a
particular category indicates that the top and bottom quartiles
have diversity of parameters in this category. For example, there
are transforms, log10 and normMax, that consistently produce
clusters with motif labels, but there is no particular distance metric
or algorithm that outperforms others in this capacity. This
observations indicate that there is indeed an important relation-
ship between the parameters chosen in clustering and the resulting
biological information produced.
We discerned additional results in Table 3 to be worth exploring
further. For example, it seems that the FFT transformation
performs well in producing multiple protein-level metric types. To
elucidate this, we compared the set rankings in all 13 metrics
(biological and dynamic) in a pair-wise fashion. Using a boot-
strapping method, we compared the overlap in the top and bottom
quartile rankings with that expected by random and highlighted
when there was either a significant increase or a significant decrease
between any two metric rankings compared to the expected overlap,
Figure 3A. The most striking results from this analysis are that there
tends to be relatively good agreement in the top and bottom
quartiles of sets between protein-level information and site-level
information, with the exception of motifs. However, there is very
little overlap between different site-level categories in the top
quartile, except for Scansite Binding predictions and motifs. There
are roughly twice as many positively enriched overlaps in the
bottom quartile than there are the top quartile indicating there
tends to be more agreement in the worst performing sets across
different categories than in the best performing sets. Enrichment for
dynamic terms is meant to act as a marker for those features in the
dynamics that may have led to a particular clustering outcome.
There is a good degree of agreement between dynamic enrichment,
but very little agreement with protein-level information and
opposing agreement with site-level information.
In order to compare how the phosphopeptide cluster mappings
between different clustering solutions compare, we calculated the
mutual information between sets in a pairwise fashion. The
pairwise MI calculations have been hierarchically clustered in
Figure 3B, high values of MI indicate a closer agreement in two
clustering solutions than low values of MI. The clustered heat map
of MI terms indicates there are pockets of sets with high
agreement. We bisected the MI cluster tree at various levels and
searched for indications that a set of parameters drives similarity
between set architectures. At the coarsest level, and depicted in
Figure 3C, similarity appears to be driven by the data
transformation. At the next level, it appears the algorithm defines
similarity and finally the distance metric. There was no clear
evidence that cluster set size, K, was important in determining
similarity, but this is a poor method for determining the exact
effect of K, since the maximum possible MI between any two sets,
or self-MI, will be dependent on their cluster set sizes K. We took
subsets of MCAfinal , based on having a single shared parameter,
such as all those sets derived with a log10 transform, and found the
Table 3. Relationships between parameters of clustering andbiological enrichment.
Metric Top Quartile Bottom Quartile
F K 6
transform FFT, center
distance chebychev cityblock
algorithm Kmeans
C K
transform FFT,center
distance euclidean cityblock
algorithm SOM Kmeans
P K 6, 8
transform FFT, center log10, nMaxLog10,rangeScale
distance
algorithm AP Kmeans
PFAM K 12, 14
transform pow zscore, rangeScale
distance cityblock
algorithm Kmeans, SOM
Motifs K 6 10
transform log10, normMax zscore
distance
algorithm Ncut
Scansite Bind K 6 14
transform nMaxLog10
distance
algorithm Kmeans, Ncut
Scansite Kinase K 12 6
transform FFT
distance
algorithm
Parameters are given for each biological metric if they are enriched in either thetop or bottom quartile of the list when ranked by the number of labels enrichedin that category. PELM kinase annotations and Pfam_site did not perform betterthan random controls, and are not included. Although Scansite Kinaseparameter enrichment also did not perform better than random controls, it islisted here since subsets based on the FFT did perform better than their randomcontrol counterparts. See Table 2 for a full description of parameters.doi:10.1371/journal.pcbi.1002119.t003
A Framework for Clustering of Biological Datasets
PLoS Computational Biology | www.ploscompbiol.org 6 July 2011 | Volume 7 | Issue 7 | e1002119

average MI in that subset. The distributions, Supplementary
Table S1, indicate that there is far more similarity in the clustering
set solutions when single transform subsets are explored, than
when single algorithm or distance metric subsets are explored,
which is in agreement with the observations from Figure 3C.
Using this same subset MI averaging method, we can look at direct
comparison of the similarity of any two parameters of clustering by
creating a subset made up of both parameters, Supplementary
Table S1. Rank-ordered lists for data transformations also agree
with observations from Figure 3B, for example, that log10
transform clustering solutions are most related to the power
transform solutions and least related to rangeScale transform
solutions. Additionally, we find that Kmeans and AP clustering
algorithms perform the most similarly to each other. However,
both Ncut and SOM algorithm subsets show a higher similarity
with other algorithms than they do with themselves. These
observations could be very useful in determining a subset of
clustering parameters that could be chosen to generate the
maximum difference in clustering solutions.
Biological inference capabilitiesIn the previous section, we developed methods for comparisons
of parameter and metric information in order to understand the
impact parameters have on biological enrichment, the similarities
between biological metric categories, and the impact parameters
have on clustering solution architectures. In addition to this, we
Figure 3. Comparison of parameters and metrics. A) Pairwise comparison of the overlap in the best and worst 25% of sets based on eachmetric in MCAfinal . We performed 1000 random selections of two sets of the same size to generate a normal distribution whose mean represents theexpected overlap value between any two sets pulled from that background size. We then evaluated whether pairwise overlap was significantly higher(‘Pos. Sig’) or lower (‘Neg. Sig.’) than expected by random. Significance cutoff was set at a FDR corrected alpha value of 0.05. The top right representsthe pairwise comparison of the best performing 25% and the bottom left is the comparison of the worst performing 25% of sets in each category.B) Hierarchical clustering of pairwise mutual information between every set in the MCA. Self-MI is highest along the diagonal. Highlighted groupsindicate dendrogram cutoffs for which the full group is composed of the denoted parameter. The labels log10/pow denote normMax_log10, log10and the pow transformations, pareto/zscore contain zscore and pareto transformations. The topmost zscore/pareto group contains one outlier (outof the group of 41) created using the transform pow.doi:10.1371/journal.pcbi.1002119.g003
A Framework for Clustering of Biological Datasets
PLoS Computational Biology | www.ploscompbiol.org 7 July 2011 | Volume 7 | Issue 7 | e1002119

wanted to develop a way to use the resulting MCAM information
in a more traditional manner, regarding biological inference and
hypothesis generation. There are a variety of ways in which one
could select a manageable number of clustering solutions from
MCAfinal for manual evaluation based on selecting the sets with
the largest differences in architecture or resulting biological
information. However, here we decided to look at robust
relationships that result despite the high degree of variability that
occurs through the implementation of a combinatorial set of
clustering parameters. We did this in two ways, first by combining
the enrichment results of MCAfinal and second by looking at the
frequency of which any two phosphopeptides co-cluster in
MCAfinal .
Supplementary Table S2 lists all biological and dynamic
enrichment that occurs in MCAfinal and the number of times
that label occurs. Across the biological categories of interest, there
are 539 unique labels enriched at least once in MCAfinal , and
many of these labels appear in more than one clusterset. A
histogram of the number of unique biological labels enriched in
MCAfinal versus the number of clustersets they occur in is given in
Supplementary Figure S5. Biological labels enriched several times
are considered to be ‘robust’ labels, for example GO Biological
Process terms ‘‘DNA binding’’ and ‘‘transcription factor binding’’
both appear in 23% of the cluster sets. Since these robust labels
may contain specific information worth exploring, we seeded the
generation of a ‘‘robust cluster’’ based on the number of times
phosphopeptides participate in a cluster with a particular
enrichment term. Figure 4A and B show the results of two such
terms, GO Biological Process term ‘‘MAPKKK cascade’’ and
Cellular Compartment term ‘‘lamellipodium’’ and all phospho-
peptides that were in a cluster giving rise to these terms at least
50% of the time. In addition to being enriched for the seed term,
Figure 4A, this ‘robust’ cluster is also enriched for GO:BP term
‘‘positive regulation of DNA’’ proliferation. This group is
composed of multiple phosphopeptides from SHC1 (Swissprot
P29353), an adaptor protein recruited to the EGFR in response to
EGF and upstream of the MAPK cascade. Additionally, it includes
the activation sites of MAPK1 (ERK2, Swissprot Q1HBJ4) and
MAPK3 (ERK1, Swissprot Q7Z3H5) and a phosphorylation on a
relatively poorly characterized protein, FAM59A (Swissprot
Q9H706). A recent study showed FAM59A acts in the MAPK
pathway in response to EGF stimulation by binding to Grb2 in a
manner that is dependent on the phosphorylation of Y453 [27].
The group associated with the cellular compartment ‘‘lamellipo-
dium’’ is composed of only three phosphopeptides from the
proteins cortactin (CTTN, Swissprot Q14247), paxillin (PXN,
Swissprot P49023), and ENO1 (Swissprot Q96GV1), an enolase.
Paxillin and cortactin are both labeled as being localized in
lamellipodium, however, ENO1, at least in full length is currently
thought to be only cytoplasmic. This robust ‘‘lamellipodium’’
cluster also has enrichment for two sequence motifs, E.E.VyS,
which is shared in both PXN and CTTN and G....Oy (O indicates
a degenerate search for hydrophobic amino acids and ‘.’ for any
amino acid), common to ENO1 and CTTN. These motifs may be
indications of shared enzyme or binding domain recognition.
These findings indicate that productive biological inference
regarding function, localization and regulation is possible using
the MCAM framework.
An alternate method for understanding relationships between
data measurements is to consider the frequency that any two
phosphopeptides appear in the same cluster. We calculate this
frequency, or co-occurrence, for every pairwise combination. The
hierarchically clustered co-occurrence matrix is shown in
Figure 4C. It appears in Figure 4C that there are essentially two
groups of peptides that co-cluster a great deal with themselves and
very little with the other group, listed explicitly in Supplementary
Table S3. We highlighted these two groups, and one we consider a
‘transition’ group and plot the average dynamics of those groups
+/2 two standard deviations in Figure 4D. The transition group
clearly has the largest variability in their dynamics, which may
explain why they co-cluster to some extent with both outlying
groups. The ‘‘blue group’’, which is also the largest, appears to
have the least variance in the early time points following EGF
stimulation. There is also a marked difference between the
downregulation of the two outlying groups. Analysis of the co-
occurrence matrix indicated there are roughly only two main
dynamics in tyrosine phosphorylation dynamics within this
dataset. However, given that enrichment analysis was very fruitful
for finer gradations, it is clear that several levels of dataset
separation are useful.
With 77 phosphopeptides, there are 2,926 pairs of phosphopep-
tides to consider in the EGF4 dataset, listed in Supplementary
Table S3. In MCAfinal , only 63, or 2.15%, of the possible
relationships never occur. Fifty-percent of the possible relation-
ships occur less than 34 times. There are 272 pairwise clusterings
that occur more than half the time in MCAfinal , which accounts
for 9.3% of possible relationships. We found no particular
relationship between the parameters of clustering and the
production of infrequently, or highly frequently, occurring
phosphopeptide clustering. The most robust relationship seen is
STAT3 Y705 (isoform 1, Swissprot P40763) phosphorylation with
STAT3 Y704 (isoform 2, Refseq NP_003141) phosphorylation,
co-clustering all but two times. This variability highlights the
importance of considering more than a single clustering solution
when deriving hypotheses for further testing.
We have illustrated only a few examples of a large number of
possibilities to demonstrate the power of MCAM in deriving
biologically meaningful hypotheses. We encourage others to make
full use of the Supplementary Information and Matlab scripts to
continue to explore the results in this dataset. In particular, the
methods that are the most promising, which are described in this
section, are to explore robust relationships found either: 1)
Through the exploration of a particular enriched label of interest,
or 2) Through the exploration of a particular phosphopeptide of
interest and those phosphopeptides that co-cluster the most
robustly with it.
Comparison of multiple ERBB datasetsWe wished to explore the utility of MCAM in comparing
independent measurements of the same network, and so we turned
to a different study of ERBB network dynamics by Wolf-Yadlin
et. al. [12]. In this study, which will be referred to here as the
HER2 dataset, the authors were interested in the signaling
response downstream of EGF and HRG and in response to
HER2 amplification, which is common to several breast cancers.
They used two cell lines, the wild type, or parental HMEC cell
line, which is the same cell line used in the EGF4 study described
previously in this paper, which has 20,000 HER2 receptors per
cell, and 24H, a HER2 overexpressing cell line, which has 600,000
HER2 receptors per cell. Both cell lines express roughly the same
number of EGFR and HER3 receptors. EGF ligand binds EGFR,
which will drive EGFR homodimers and EGFR:HER2 heterodi-
mers, whereas heregulin, HRG, which only binds the HER3 and
HER4 family members will instead drive HER3 and HER4
containing heterodimers. When HER2 is overexpressed, the
majority of the dimers in HRG treatment will be composed of
HER2:HER3 and a larger proportion of EGFR:HER2 dimers will
occur in response to EGF treatment. The authors found HER2
A Framework for Clustering of Biological Datasets
PLoS Computational Biology | www.ploscompbiol.org 8 July 2011 | Volume 7 | Issue 7 | e1002119

overexpressing cells were more migratory in response to
stimulation by either ligand when compared to wild type HMECs.
One quarter of this dataset represents the same measurement
conditions as the EGF4 dataset (0, 5, 10, and 30 minutes following
a saturating dose of EGF) of wild type HMECs (termed P for
parental). The remainder of the dataset is the measurement, at the
same time points, of parental with HRG treatment and with
HER2 overexpressing (24H) cells treated with EGF and HRG. We
were interested in applying MCAM to the HER2 dataset in order
to see if two independent measurements of a network would agree
and if signaling differences between EGF and HRG stimulation,
and wild-type versus HER2 amplification, could be distinguished
using MCAM and could therefore highlight potential signaling
mechanisms related to the increased migratory behavior of HER2
overexpressing cells. We applied MCAM to the HER2 dataset and
to five subsets of the dataset in order to tease apart: 1) differences
in signaling between the various HER2 states and ligand
treatments, and 2) how measurements of a conditional nature
(for example measurements at only one time point across the four
conditions) would differ from the dynamic measurements and how
these differ from the full dataset. The datasets analyzed by MCAM
include: the full 16-point measurement set (Full), a ‘‘conditional’’
dataset made up of the 5-minute measurements in all conditions
(5 minTimePoints), and four subsets representing the four
Figure 4. Biological inference based on robust clustering results. A) The group of phosphopeptides that participate at least 50% of the timein a cluster with enrichment for GO Biological Process term ‘‘MAPKKK Cascade’’, those proteins with the term are starred. This new group is enrichedfor GO BP term ‘‘positive regulation of DNA replication’’. B) These three phosphopeptides always appear when GO Cellular Compartment term‘‘lamellipodium’’ is enriched, CTTN and PXN are the proteins annotated as being localized in lamellipodium. This new group is enriched for twosequence motifs as well. C) The co-occurrence matrix clustered hieararchically. Co-occurrence between any two phosphopeptides is the number oftimes those two peptides are clustered together in MCAfinal . For the heat map, the log base 10 was taken of the normalized values, zero valuesbecame 0.5/331 prior to log transformation. D) The average values, +/2 two standard deviations, are shaded for the three groups highlighted inpanel C.doi:10.1371/journal.pcbi.1002119.g004
A Framework for Clustering of Biological Datasets
PLoS Computational Biology | www.ploscompbiol.org 9 July 2011 | Volume 7 | Issue 7 | e1002119

dynamic measurements (0, 5, 10, and 30 minutes) of each
condition named P_EGF for EGF stimulation of Parental cells,
P_HRG for HRG stimulation of parental cells, 24H_EGF for
EGF stimulation of HER2 overexpressing cells, and 24H_HRG
for HRG stimulation of HER2 overexpressing cells.
To understand more globally how the MCAM results compare
across these different datasets, we found the correlation between
the co-occurrence matrixes. The MCAM co-occurrence matrix of
the EGF4 dataset has the highest correlation with that of the
Parental EGF subset of the HER2 dataset, followed closely by the
EGF treatment of the 24H cell line, there are 36 phosphopeptides
common to both the EGF4 and HER2 datasets, Table 4. There is
poorer correlation with the HRG treated subsets and the worst
correlation with 5 minuteTimePoint subset. In general, we see that
EGF and HRG treatments correlate much better with themselves
than they do with each other. For example, all EGF treatment
comparisons appear in the top of the rankings of correlations, with
an average correlation of 0.46. However, all cross-treatment
comparisons have correlation of 0.35 or worse, with an average
correlation of only 0.25. Using the co-occurrence matrix that
results from MCAM application to different measurements of the
same system is a useful way to derive a single, global metric for the
agreement between different datasets.
In order to explore the differences in clustering results of any
two datasets, we are faced with analyzing an overwhelming
number of comparisons. To simplify the search range, and
highlight those differences that are the most extreme, and
potentially the most biologically interesting, we looked for co-
occurrences that move from one extreme of co-clustering to
another. Specifically, we define an extreme difference as the case
when two phosphopeptides change from co-clustering at least 75%
of the time in one dataset to co-clustering less than 25% of the time
in another. Full results for all dataset comparisons are provided in
Supplementary Table S4. There are several notable changes in
cross-comparing the EGF4 dataset and all sets formed from the
HER2 dataset, but the ones we found the most interesting occur in
the difference between EGF treatment of parental cells versus 24H
cells. In this comparison, we noticed two sites on SHC1 experience
very different phenomena. In the case of parental EGF treatment,
both sites co-cluster robustly with each other and with phosphor-
ylation on EGFR pY1172 and pY1197 (Swissprot P00533), both
known to bind SHC1. However, EGF treatment of HER2
overexpressing cells indicates that although pY427 continues to
robustly co-cluster with those sites on EGFR, SHC1 pY349 does
not, and instead most robustly co-clusters with catenin delta-1,
CTTND1 (Swissprot O60716), phosphorylation of Y228. Dynam-
ics of these sites, and their most robustly co-clustered partners,
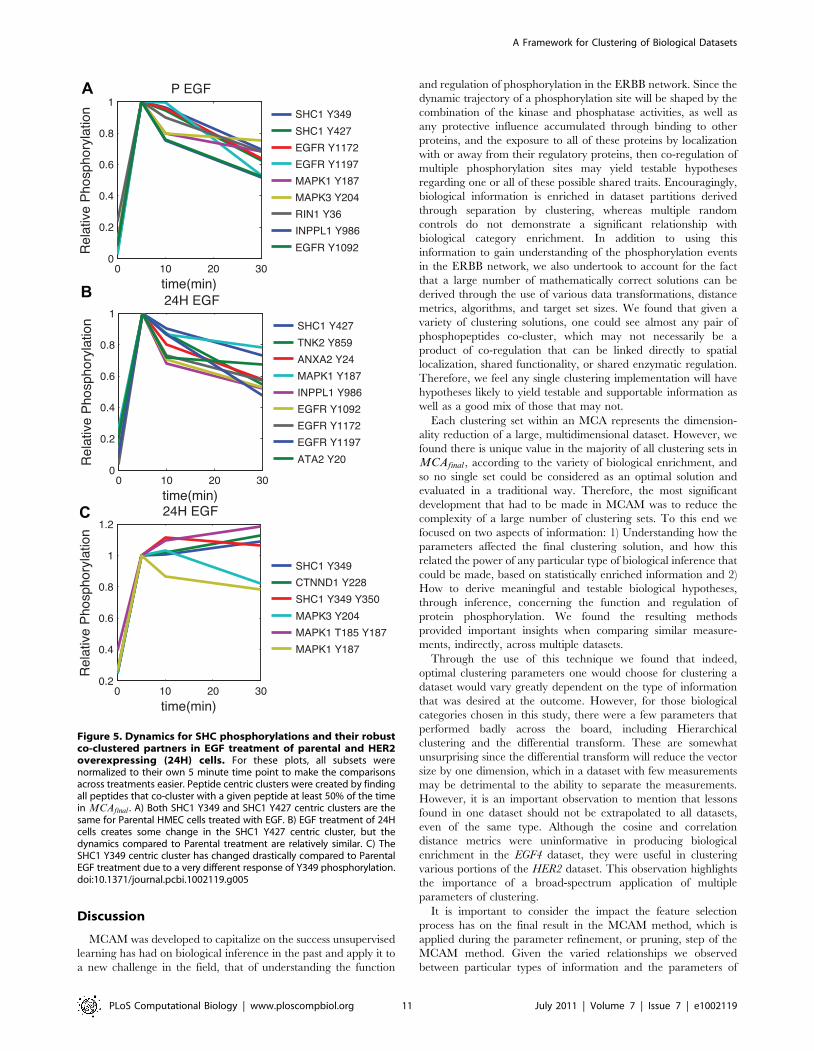
under both conditions are shown in Figure 5. We also observe
large differences in the co-clustering of multiple sites on p130Cas,
also known as BCAR1 (Swissprot P56945), between the two cell
lines in response to EGF treatment and an extreme change in the
association of ENO1 pY44 with annexin A2 (ANXA2, Swissprot
P07355) phosphorylation on Y238, where ENO1 Y44 phosphor-
ylation associates with ANXA2 phosphorylation in parental but
not HER2 overexpressing cells. The largest number of differences
is observed when comparing the EGF treatment of parental cells
to the 24H cell lines treated with HRG, which also has the lowest
correlation of any dynamic subset comparison. Both pieces of
evidence point to maximum differences in signaling dynamics
when both HER2 expression levels and the stimulating ligands are
altered. Further hypothesis generation can be accomplished by
exploring the remaining pairwise dataset comparisons for other
meaningful signaling changes that occur, which are highlighted by
extreme differences in phosphopeptide co-clustering, provided in
Supplementary Table S4.
Although the best agreement the EGF4 MCAM results have is
with the parental EGF treatment of the HER2 MCAM results,
there is less than ideal correlation. We looked to see if there were
any serious disagreements by using the same ‘co-cluster swap’
method as mentioned above and found there were only two such
instances, which highlight very different measurements made on
GIT1 (Swissprot Q9Y2X7) pY545 and EFNB2 (Swissprot P52799)
pY304 in HMEC cells in response to EGF treatment, Supple-
mentary Table S4. Interestingly, though these measurements are
quite different, the extreme differences of co-occurrences with
other phosphopeptides are only highlighted in two cases, both with
regards to Ephrin family phosphorylation sites that are relatively
similar in the two datasets, GIT1 pY545 with EPHB1 (Swissprot
P54762) pY600 and EFNB2 pY304 with EPHA2 pY772
(Swissprot Q96HF4). This indicates that the MCAM co-
occurrence matrix is a precise way to identify similarities and
discrepancies between independent measurements of a system.
Since this methodology relies on comparing the relationships
between measurements within a dataset and then comparing this
abstracted metric across datasets, one could imagine that the
measurement scheme would not need to be the same between the
two datasets of interest.
Table 4. MCAM co-occurrence correlations of ERBB networkdatasets.
Dataset 1 Dataset 2 Correlation Ligands
Full 5 minTimePoints 0.63
Full 24H EGF 0.59
EGF4 P EGF 0.53 EGF:EGF
EGF4 24H EGF 0.51 EGF:EGF
Full 24H HRG 0.45
Full P HRG 0.39
EGF4 Full 0.37
P EGF 24H EGF 0.36 EGF:EGF
P HRG 24H HRG 0.35 HRG:HRG
EGF4 P HRG 0.35 EGF:HRG
5 minTimePoints 24H HRG 0.34
Full P EGF 0.32
5 minTimePoints 24H EGF 0.31
EGF4 24H HRG 0.25 EGF:HRG
24H EGF 24H HRG 0.24 EGF:HRG
5 minTimePoints P HRG 0.23
P EGF P HRG 0.23 EGF:HRG
P HRG 24H EGF 0.23 EGF:HRG
P EGF 24H HRG 0.17 EGF:HRG
EGF4 5 minTimePoints 0.16
5 minTimePoints P EGF 0.10
The co-occurrence matrix correlations for the MCAM results of EGF4 and sixdatasets obtained from the full HER2 dataset were found for thosephosphopeptides contained in both Dataset 1 and Dataset 2. The lists are rank-ordered according to decreasing correlation and ligands are highlighted when adataset is composed only of that treatment condition. The line separatesEGF:EGF and HRG:HRG comparisons from the EGF:HRG comparisons. Thecorrelation of EGF4 with subsets of the HER2 dataset involves 36 commonpeptides and all HER2 comparisons involve 68 phosphopeptides.doi:10.1371/journal.pcbi.1002119.t004
A Framework for Clustering of Biological Datasets
PLoS Computational Biology | www.ploscompbiol.org 10 July 2011 | Volume 7 | Issue 7 | e1002119
Discussion
MCAM was developed to capitalize on the success unsupervised
learning has had on biological inference in the past and apply it to
a new challenge in the field, that of understanding the function
and regulation of phosphorylation in the ERBB network. Since the
dynamic trajectory of a phosphorylation site will be shaped by the
combination of the kinase and phosphatase activities, as well as
any protective influence accumulated through binding to other
proteins, and the exposure to all of these proteins by localization
with or away from their regulatory proteins, then co-regulation of
multiple phosphorylation sites may yield testable hypotheses
regarding one or all of these possible shared traits. Encouragingly,
biological information is enriched in dataset partitions derived
through separation by clustering, whereas multiple random
controls do not demonstrate a significant relationship with
biological category enrichment. In addition to using this
information to gain understanding of the phosphorylation events
in the ERBB network, we also undertook to account for the fact
that a large number of mathematically correct solutions can be
derived through the use of various data transformations, distance
metrics, algorithms, and target set sizes. We found that given a
variety of clustering solutions, one could see almost any pair of
phosphopeptides co-cluster, which may not necessarily be a
product of co-regulation that can be linked directly to spatial
localization, shared functionality, or shared enzymatic regulation.
Therefore, we feel any single clustering implementation will have
hypotheses likely to yield testable and supportable information as
well as a good mix of those that may not.
Each clustering set within an MCA represents the dimension-
ality reduction of a large, multidimensional dataset. However, we
found there is unique value in the majority of all clustering sets in
MCAfinal , according to the variety of biological enrichment, and
so no single set could be considered as an optimal solution and
evaluated in a traditional way. Therefore, the most significant
development that had to be made in MCAM was to reduce the
complexity of a large number of clustering sets. To this end we
focused on two aspects of information: 1) Understanding how the
parameters affected the final clustering solution, and how this
related the power of any particular type of biological inference that
could be made, based on statistically enriched information and 2)
How to derive meaningful and testable biological hypotheses,
through inference, concerning the function and regulation of
protein phosphorylation. We found the resulting methods
provided important insights when comparing similar measure-
ments, indirectly, across multiple datasets.
Through the use of this technique we found that indeed,
optimal clustering parameters one would choose for clustering a
dataset would vary greatly dependent on the type of information
that was desired at the outcome. However, for those biological
categories chosen in this study, there were a few parameters that
performed badly across the board, including Hierarchical
clustering and the differential transform. These are somewhat
unsurprising since the differential transform will reduce the vector
size by one dimension, which in a dataset with few measurements
may be detrimental to the ability to separate the measurements.
However, it is an important observation to mention that lessons
found in one dataset should not be extrapolated to all datasets,
even of the same type. Although the cosine and correlation
distance metrics were uninformative in producing biological
enrichment in the EGF4 dataset, they were useful in clustering
various portions of the HER2 dataset. This observation highlights
the importance of a broad-spectrum application of multiple
parameters of clustering.
It is important to consider the impact the feature selection
process has on the final result in the MCAM method, which is
applied during the parameter refinement, or pruning, step of the
MCAM method. Given the varied relationships we observed
between particular types of information and the parameters of
Figure 5. Dynamics for SHC phosphorylations and their robustco-clustered partners in EGF treatment of parental and HER2overexpressing (24H) cells. For these plots, all subsets werenormalized to their own 5 minute time point to make the comparisonsacross treatments easier. Peptide centric clusters were created by findingall peptides that co-cluster with a given peptide at least 50% of the timein MCAfinal . A) Both SHC1 Y349 and SHC1 Y427 centric clusters are thesame for Parental HMEC cells treated with EGF. B) EGF treatment of 24Hcells creates some change in the SHC1 Y427 centric cluster, but thedynamics compared to Parental treatment are relatively similar. C) TheSHC1 Y349 centric cluster has changed drastically compared to ParentalEGF treatment due to a very different response of Y349 phosphorylation.doi:10.1371/journal.pcbi.1002119.g005
A Framework for Clustering of Biological Datasets
PLoS Computational Biology | www.ploscompbiol.org 11 July 2011 | Volume 7 | Issue 7 | e1002119

clustering that best gave rise to them, it is likely that the final result
will change with the addition of new biological features, or the
alteration to existing features, such as the improvement of GO
annotations. One can imagine the parameters pruned during the
feature selection process would decrease with the addition of new
features, which would redefine the value of a successful clustering
solution. Although this suggests the results may need to be
reconsidered as annotations improve, we feel this parameter
refinement process helps to avoid the consideration of a large
portion of currently uninformative sets. The open source nature of
the MCAM software project allows for flexibility in altering the
specific categories and the thresholds used during parameter
refinement.
We found that there is no single ‘optimum’ clustering solution,
or one that performed in the top quartile of all biological metrics of
interest. Depending on the application, a small number of
solutions could be chosen and analyzed in a way that is more
traditionally performed in the field. However, we decided to focus
on allowing the agreement of many solutions to highlight a
potential area of robust biological inference through the
agreement of biological enrichment and alternately the agreement
of co-clustering of phosphorylation dynamics. These methods
produced a large list of possibly interesting biological inferences, of
which we highlighted just a few possibilities to demonstrate
MCAM’s power. In Figure 4 we highlight two ‘robust’ clusters
based on repeated enrichment of categorical terms, which creates
a hybrid cluster from a combination of multiple clustering sets
within MCAfinal , based on a particular enrichment label of
interest. The hybrid cluster, like any single cluster produced from a
single clustering method, represents a cluster of phosphopeptides
that are strongly co-regulated. The first cluster, Figure 4A, was
produced based on enrichment for co-regulation of phosphoryla-
tion sites on proteins involved in the MAPK cascade. For those
proteins not currently annotated in the MAPK cascade, there is
individual evidence that they are involved in regulating MAPK
activity. FAM59A was recently named GAREM, which stands for
Grb2-associated and regulator of Erk/MAPK activity [27].
Specifically, phosphorylation of Y453 on GAREM was required
for association with Grb2 and subsequent activation of Erk by
EGF stimulation. PTPN18, a protein tyrosine phosphatase also
known as BDP1, has been implicated in regulation of HER2
directed MAPK signaling activation [28]. The study specifically
found that PTPN18 was capable of inhibiting activation of
mitogenic signaling. The robust co-regulation of PTPN18 Y389
phosphorylation with other components of the MAPK cascade,
shown here, further implicates PTPN18 in MAPK signaling
downstream of EGF stimulation, and highlights a particular
mechanism for PTPN18 activity, that of Y389 phosphorylation.
This modification may possibly act as a negative regulator of
BDP1 activity, thereby relieving its function as a negative regulator
of MAPK activity. Alternatively, if Y389 phosphorylation on
PTPN18 potentiates its ability to shut down MAPK signaling, then
these dynamics suggest it occurs subsequently with MAPK
activation. ARHGEF5, also known as TIM, is a RhoGEF, which
has been shown to activate Rac, which is upstream of another
MAPK family member, JNK. This suggests that the JNK cascade
may be concurrently activated or that this particular RhoGEF has
a role in the ERK1/ERK2 cascade directly. These results indicate
that MCAM has been useful not only in highlighting a known co-
regulation event, that of EGFR phosphorylation on sites that
recruit SHC1 to the receptor with that of SHC1 phosphorylation
sites that are phosphorylated following recruitment to the receptor,
but also in highlighting proteins not yet generally recognized as
playing a role in the EGFR/MAPK signaling pathway. This result
also supports a role for these proteins in the MAPK pathway in
human mammary epithelial cells as previous cell lines explored in
previous studies. Additionally, the example of highlighting
GAREM (FAM59A) phosphorylation on Y453 as playing an
important biochemical role in the indicated pathway strengthens
the hypothesis that PTPN18 Y389 phosphorylation is also an
important biochemical mechanism in the MAPK pathway
downstream of EGFR activation. Since we can find no specific
study on the effect of PTPN18 Y389 phosphorylation, this
hypothesis could not have come from literature mining. Addition-
ally, we observe that traditional application of a single clustering
implementation would likely not have highlighted this group of
proteins in a way that would have linked PTPN18 Y389 and
GAREM Y453 phosphorylation with that of EGFR Y1172 and
MAPK Y187, since this event occurs in less than 15% of clustering
set solutions in MCAfinal .
In Figure 4B we highlight another ‘robust’ cluster, which
indicates the dynamics of phosphorylation of Y44 on ENO1 are
very similar to that of cortactin and paxillin phosphorylation, two
proteins and phosphorylation sites that play a role in cell motility
[29,30] and are annotated as being localized to ‘lamellipodium’.
However, since there is relatively little evidence that paxillin is
localized to lamellipodia, but instead has a strong association with
mature focal adhesions [29], it may be that ‘lamellipodium’ has
been used as a blanket term for leading edge formations in the
Gene Ontology since GO is lacking finer gradations of leading
edge compartments. What is common to both paxillin and
cortactin is localization in invadopodia [31,32], a term not
currently included in GO. Such similarity of dynamics indicates
potential co-regulation, which is dependent on a variety of factors.
There is evidence that all three sites may be targets of Src
[30,33,34]. In addition to shared enzymatic control, similarity of
dynamics might also be dependent on shared localization,
especially when enzyme activation is localized to an area such as
focal adhesions, invadopodia, or lamellipodium. To better
conjecture where this co-regulation is occurring we looked at
additional robust associations with ENO1 phosphorylation and
found in addition to paxillin and cortactin this site is most closely
associated with phosphorylation on a protein called AFAP1L2,
which stands for actin filament associated protein like-2. Despite
several other phosphorylation sites on focal adhesion proteins,
including integrin b4 (ITGB4), p130Cas/BCAR1, and focal
adhesion kinase (FAK), none of these sites is similarly regulated.
Additional evidence supporting this is that the parental EGF
subset of the HER2 dataset also indicates that ENO1 and paxillin
phosphorylation are tightly coupled with a third protein, Annexin
A2, which has been implicated in cell spreading and migration
[35] as well as formation of invadopodia [36]. Finally, a recent
proteomic study found enolase is enriched in invadopodia [37]
further supporting the hypothesis that co-regulation of enolase,
paxillin, and cortactin phosphorylation is through shared cellular
localization.
The temporal association of ENO1 phosphorylation with that of
cortactin and paxillin is intriguing. ENO1, in full and dimeric
form, is a metabolic enzyme. However, a short isoform of the same
gene product has been shown to block Myc transcription factor
activity by binding the Myc promoter [38]. This begs the question
of whether ENO1 is playing a role in lamellipodium, invadopodia,
or focal adhesions, related to its metabolic activity or some other
gene product of yet to be discovered functionality. ENO1
phosphorylation on Y44 has long been known and when originally
studied did not show a noticeable affect directly on its catalytic
activity [34]. However, in these studies it was observed that only a
small percentage, roughly 5%, of total enolase was phosphorylated
A Framework for Clustering of Biological Datasets
PLoS Computational Biology | www.ploscompbiol.org 12 July 2011 | Volume 7 | Issue 7 | e1002119
and so catalytic differences due to phosphorylation may have been
imperceptible. Perhaps compartmentalization of a fraction of
altered enzymatic activity could play an important functional role;
this activity may be confined to lamellipodia, invadapodia, or focal
adhesions. Despite the excess of ATP in the cell, the induction of
an ATP gradient within invadopodia could conceivably act as a
method of invadopodia formation, since many components, such
as F-actin, would be sensitive to a shift in the ATP to ADP ratio.
There are other indications that phosphorylation of metabolic
enzymes may indeed be playing a functional role and driving
tumor progression [39] and our results may indicate a role for
enolase phosphorylation specifically in the metastatic potential of
tumor progression.
Finally, we found that using the concepts developed in MCAM,
we could compare independent measures of the ERBB network
and dissect signaling alterations occurring between different
perturbations of the network, including ligand and receptor level
differences. Using the co-occurrence matrix we were able to look
‘‘globally’’ at the differences between the networks. This study
indicated that despite HER2 amplification, EGF stimulation drove
signaling that was more similar between the two cell lines than it
was for the same cell line under two different ligand stimulations.
The greatest difference in signaling occurred when EGF
stimulation of wild type cells was compared with HRG stimulation
of HER2 overexpressing cells. We can dissect the signaling
differences further by looking for those associations that have the
most extreme differences between conditions. When we did this,
we were fascinated to find that in the presence of HER2
overexpression, EGF drives very different dynamics on two
phosphorylation sites of the adaptor protein SHC1 and sites on
focal adhesion protein p130Cas/BCAR1. SHC1 is known to be
recruited to EGFR by two different phosphopeptide binding
events and it subsequently recruits, and activates, members of the
MAPK cascade. Specifically, both Y349 and Y427 phosphoryla-
tion on SHC1 has been shown to recruit Grb2 [40]. Through its
SH2 domain, SHC1 is recruited to EGFR Y1197 phosphorylation
and through its PTB domain, it is recruited to EGFR Y1172
phosphorylation [41]. Therefore, it is no surprise that subsequent
phosphorylation of SHC1 on Y427 and Y349 would be tightly co-
regulated with that of EGFR Y1172 and Y1197 phosphorylation
when the network is stimulated with EGF. However, what is
surprising is this co-regulation is broken for only Y349 in the
presence of HER2 overexpression. Instead of being most closely
co-regulated with the receptor phosphorylations it is instead most
closely co-regulated with Y228 phosphorylation on catenin delta-
1, CTTND1, a protein known to be interact with E-cadherin at
cell-cell junctions [42]. The authors of the original study found
that HER2 amplification drives a higher migratory potential and
posited that breakup of E-cadherin junctions would be essential to
this process. Our finding may therefore indicate that SHC1 plays
an important role in this process and that the differential
regulation of Y349 and Y427 is perhaps driven by two populations
of SHC1, one of which is localized at cell-cell junctions and which
is differentially regulated, indicated by the sustained phosphory-
lation of SHC1 Y349 relative to Y427 phosphorylation, and a
second population that is recruited to the receptor, which is
probably the dominant population in EGF stimulation of wild type
HMECs. The sequence surrounding catenin delta-1 Y228
matches known preferences for SHC1 SH2 recognition. In
addition, multiple sites on the focal adhesion protein p130Cas/
BCAR1 experience differential regulation in the presence of
HER2 overexpession. Increased migration would come as a result
of the disruption of both cell-cell contacts and cell-substrate
contacts, so these sites might indicate a particular role in how cell-
substrate contacts are disrupted in HER2 overexpressing cells. All
of these data may help us in understanding the aggressiveness of
tumor cells with HER2 amplification.
The methodology developed here has wide applicability to data
mining of all varieties. Permutations of clustering parameters and
their judgement of success by pertinent categorical data has the
capability of producing a wide array of solutions that together span
a meaningful range of data separation. MCAM, as developed, can
be applied directly to any dataset currently in the PTMScout
database, and any proteomic dataset that measures phosphoryla-
tion or lysine acetylation can be added by the public to PTMScout
for analysis by MCAM. Extension to any type of multidimensional
biological measurements simply requires the alteration of the
target categorical data. For example, in addition to using gene and
protein annotation information, one could look for known
transcription factors when mining gene expression data. Another
benefit of MCAM is that it provides a method for comparing the
relationship between independent measurements of a system, even
if the overlap of measurements is incomplete. This methodology
provides a new method for understanding the relationship of
quantitative measurements with each other, and importantly
provides a means in which to judge the outcome of a parameter of
clustering with regards to resulting power of inference. This is a
much-needed tool when one lacks a satisfactory ‘gold standard’ by
which to evaluate the impact of various parameters of unsuper-
vised learning.
Materials and Methods
Dataset preparation and clusteringThe EGF4 and HER2 datasets were loaded into PTMScout [24]
and then subsequently reassigned to default assignments through
the PTMScout ‘ambiguity’ interface to ensure all isoform
selections represent the best overlap with current annotations.
The default dataset was then reloaded into PTMScout. This
modified dataset was then exported from PTMScout’s ‘subset
evaluation’ page as a tab-separated file, which was then loaded
into Matlab for clustering.
The flat text file of the dataset was imported into Matlab based
on DataRail object structures [43]. Transforms, distance metrics,
and algorithms are from the Matlab environment and its
toolboxes, downloaded from other resources, or developed for
our purposes. Ncut code for Matlab was obtained from http://
www.cis.upenn.edu/*jshi/software/ based on the algorithm
description in [44], affinity propagation (AP) clustering code was
downloaded from http://www.psi.toronto.edu/affinitypropagation/
software/apcluster.m based on the algorithm described in [18]. A self
organizing map (SOM) Matlab toolbox was downloaded from
http://www.cis.hut.fi/somtoolbox/ and is based on the algorithm
described in [45]. Affinity propagation clustering was modified to
accept an arbitrary distance metric, but does not accept an
argument for K. SOMs only utilize the Euclidean distance metric.
Average linkage distance is used in hierarchical clustering. Kmeans
uses the squared value of the Euclidean distance and does not accept
the Chebychev distance metric. The largest value of K is bounded
by a number that would produce roughly 5 phosphopeptides per
cluster, assuming a solution were to equally distribute all
phosphopeptides, which in this case is Kmax = 14. For non-
deterministic algorithms, such as SOMs and Kmeans, we store the
random seed so that results can be exactly reproduced, but allow the
random seed to vary between individual implementations so as to
ensure we do not force all implementations of the algorithm into a
poorly performing local minima.
A Framework for Clustering of Biological Datasets
PLoS Computational Biology | www.ploscompbiol.org 13 July 2011 | Volume 7 | Issue 7 | e1002119

Enrichment analysis and multiple hypothesis correctionClustering assignments are written from Matlab into a tab-
separated file, which is then loaded into PTMScout’s ‘subset
evaluation’ tool and enrichment is calculated on the PTMscout
server using the ‘MCAM’ feature. Enrichment is calculated as in
PTMScout’s subset selection enrichment analysis, using a
hypergeometric distribution calculation [24] to test for the
overrepresentation of a label in a cluster compared to the full
dataset. The MCAM feature has variable arguments, which
were set as following: the motif algorithm branch cutoff is set at
1e-2 [46]; Scansite prediction levels of three and better are
considered based on an empirical analysis of the tradeoff
between the false positive rate and total hypothesis rejection
(data not shown); Domain predictions of 1e-5 and more
stringent are allowed; the Benjamini and Hochberg FDR
procedure was used with an alpha value of 5e-2 [25]. False
discovery rate correction (FDR) was performed at the metric
and set levels as following: p-value calculations were accumu-
lated for all tests within a category across a cluster set and the
p-value satisfying an FDR alpha value of 0.05 was used to
determine final enrichment for that metric. Three main data
structures are translated from the PTMScout MCAM calcula-
tions into Matlab structures can then be used in Matlab for
parameter refinement and analysis into results. Random
controls were performed using two methods described in the
results section. The first method randomized the data matrix
and the second method randomized the metadata labels by
reshuffling the vector to phosphopeptide mappings.
Parameter refinementOnce enrichment structures are completed on the PTMScout
server, they are loaded locally into Matlab. In order to determine
parameters that produce clustersets with a relatively small degree
of biological enrichment, we test the impact on the total
enrichment when all clustersets generated with a particular
parameter are removed from the full MCA. We perform this test
systematically for every parameter used. Parameters whose
removal improves the total enrichment across all categories by
at least 2% without decreasing the power of enrichment in
any single category by more than 10% are pruned to create
MCAfinal . Where designated, in the HER2 dataset a total
improvement of 3% was required to ensure the final sizes were
roughly the same.
Calculation of mutual informationIn order to compare the clustering mappings of two clustering
set solutions, we calculated the pairwise mutual information,
I(X;Y), between clustering sets X and Y according to the
equation given below, where X is composed of clusters 1::Kx and
Y is composed of clusters 1::Ky, p(x,y) indicates the joint
probability distribution function of X and Y, and px(x) and py(y)indicate the marginal probability distributions of X and Y,
respectively.
I(X ; Y )~XKy
y~1
XKx
x~1
p(x,y) log(p(x,y)
px(x),py(y))
Supporting Information
Figure S1 The EGF4 dataset projected onto the top threeprincipal components. The 77 phosphopeptide vectors were
normalized to their maximum and then plotted on the first three
principal components for illustration of the full multidimensional
dataset.
(PDF)
Figure S2 Enrichment and random controls for MCAfinal
using an alternate randomization process. Procedures as
described for Figure 2 were used to compare the real results of
enrichment to random results, where randomization controls for
the metadata labeling of phosphopeptide objects.
(PDF)
Figure S3 Comparison of Bonferroni and FDR correc-tion methods on the enrichment and random controlsfor MCAfinal. Procedures as described for Figure 2 were used to
compare the real results of enrichment to random results, for both
FDR and Bonferroni correction methods with a target alpha of 0.05.
(PDF)
Figure S4 Enrichment and random controls for subsetsof MCAfinal. A) The false positive rate and rates of enrichment
and null hypothesis rejection when only cluster sets derived using
the FFT transform are considered. An improvement in Scansite
Kinase predictions is seen compared to the full MCAfinal . B) The
zscore transform was chosen to create a comparable subset of
solutions, and in contrast, here no improvement in Scansite
Kinase terms is produced.
(PDF)
Figure S5 Histogram of biological label enrichmentbased on number of times they appear in MCAfinal. The
number of unique biological labels found enriched in MCAfinal are
given based on the number of times they occur across MCAfinal .
For example, there are 539 unique labels that occur at least once,
no labels that occur in 100% of of the clustersets, and 39 labels
that occur at least 25% of the time.
(PDF)
Table S1 Exploration of parameter relationshipsthrough mutual information. Average MI is calculated for
subsets of MCAfinal based on a single parameter type. Similarity
between two parameters is also considered by finding the average MI
of a subset containing only two parameter types. This supplementary
information contains graphs and tables of the average MI by subset.
(XLSX)
Table S2 List of all enrichment produced in MCAfinalandthe number of times it appeared as enriched in the 331sets.(XLSX)
Table S3 Supplemental co-occurrence information. List
of all possible pairwise relationships between phosphopeptides in
the EGF4 and HER2 analyses and the number of times they co-
occur in their respective MCAfinal . This also contains the listings
for the three groups highlighted in Figure 4 C and D.
(XLSX)
Table S4 Supplemental ERBB dataset comparisons.List of the sites that are in common between the EGF4 and HER2
datasets, correlations of the co-occurrence matrixes and lists of the
extreme differences between sets highlighted by relationships moving
from 75% or more co-occurrence to less than 25%.
(XLS)
Acknowledgments
The authors would like to thank members of the White and Lauffenburger
labs for useful discussions. KMN would like to thank Brian Joughin for
A Framework for Clustering of Biological Datasets
PLoS Computational Biology | www.ploscompbiol.org 14 July 2011 | Volume 7 | Issue 7 | e1002119
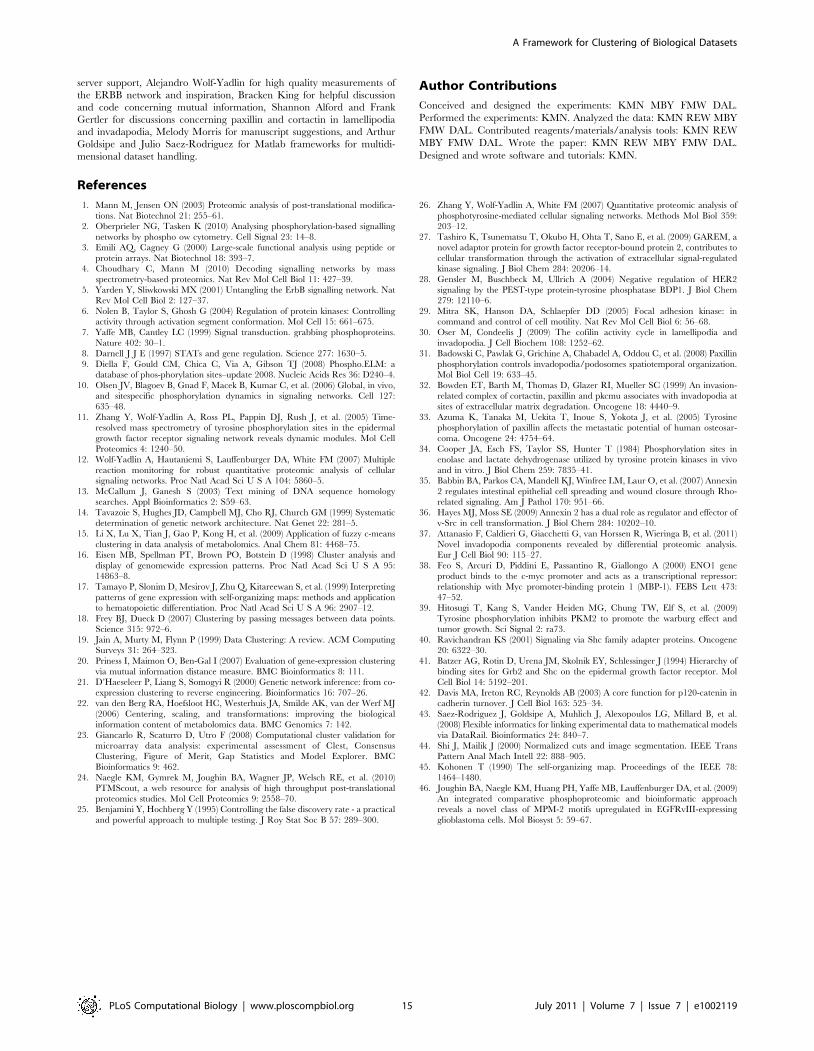
server support, Alejandro Wolf-Yadlin for high quality measurements of
the ERBB network and inspiration, Bracken King for helpful discussion
and code concerning mutual information, Shannon Alford and Frank
Gertler for discussions concerning paxillin and cortactin in lamellipodia
and invadapodia, Melody Morris for manuscript suggestions, and Arthur
Goldsipe and Julio Saez-Rodriguez for Matlab frameworks for multidi-
mensional dataset handling.
Author Contributions
Conceived and designed the experiments: KMN MBY FMW DAL.
Performed the experiments: KMN. Analyzed the data: KMN REW MBY
FMW DAL. Contributed reagents/materials/analysis tools: KMN REW
MBY FMW DAL. Wrote the paper: KMN REW MBY FMW DAL.
Designed and wrote software and tutorials: KMN.
References
1. Mann M, Jensen ON (2003) Proteomic analysis of post-translational modifica-
tions. Nat Biotechnol 21: 255–61.2. Oberprieler NG, Tasken K (2010) Analysing phosphorylation-based signalling
networks by phospho ow cytometry. Cell Signal 23: 14–8.3. Emili AQ, Cagney G (2000) Large-scale functional analysis using peptide or
protein arrays. Nat Biotechnol 18: 393–7.4. Choudhary C, Mann M (2010) Decoding signalling networks by mass
spectrometry-based proteomics. Nat Rev Mol Cell Biol 11: 427–39.
5. Yarden Y, Sliwkowski MX (2001) Untangling the ErbB signalling network. NatRev Mol Cell Biol 2: 127–37.
6. Nolen B, Taylor S, Ghosh G (2004) Regulation of protein kinases: Controllingactivity through activation segment conformation. Mol Cell 15: 661–675.
7. Yaffe MB, Cantley LC (1999) Signal transduction. grabbing phosphoproteins.
Nature 402: 30–1.8. Darnell J J E (1997) STATs and gene regulation. Science 277: 1630–5.
9. Diella F, Gould CM, Chica C, Via A, Gibson TJ (2008) Phospho.ELM: adatabase of phos-phorylation sites–update 2008. Nucleic Acids Res 36: D240–4.
10. Olsen JV, Blagoev B, Gnad F, Macek B, Kumar C, et al. (2006) Global, in vivo,and sitespecific phosphorylation dynamics in signaling networks. Cell 127:
635–48.
11. Zhang Y, Wolf-Yadlin A, Ross PL, Pappin DJ, Rush J, et al. (2005) Time-resolved mass spectrometry of tyrosine phosphorylation sites in the epidermal
growth factor receptor signaling network reveals dynamic modules. Mol CellProteomics 4: 1240–50.
12. Wolf-Yadlin A, Hautaniemi S, Lauffenburger DA, White FM (2007) Multiple
reaction monitoring for robust quantitative proteomic analysis of cellularsignaling networks. Proc Natl Acad Sci U S A 104: 5860–5.
13. McCallum J, Ganesh S (2003) Text mining of DNA sequence homologysearches. Appl Bioinformatics 2: S59–63.
14. Tavazoie S, Hughes JD, Campbell MJ, Cho RJ, Church GM (1999) Systematicdetermination of genetic network architecture. Nat Genet 22: 281–5.
15. Li X, Lu X, Tian J, Gao P, Kong H, et al. (2009) Application of fuzzy c-means
clustering in data analysis of metabolomics. Anal Chem 81: 4468–75.16. Eisen MB, Spellman PT, Brown PO, Botstein D (1998) Cluster analysis and
display of genomewide expression patterns. Proc Natl Acad Sci U S A 95:14863–8.
17. Tamayo P, Slonim D, Mesirov J, Zhu Q, Kitareewan S, et al. (1999) Interpreting
patterns of gene expression with self-organizing maps: methods and applicationto hematopoietic differentiation. Proc Natl Acad Sci U S A 96: 2907–12.
18. Frey BJ, Dueck D (2007) Clustering by passing messages between data points.Science 315: 972–6.
19. Jain A, Murty M, Flynn P (1999) Data Clustering: A review. ACM ComputingSurveys 31: 264–323.
20. Priness I, Maimon O, Ben-Gal I (2007) Evaluation of gene-expression clustering
via mutual information distance measure. BMC Bioinformatics 8: 111.21. D’Haeseleer P, Liang S, Somogyi R (2000) Genetic network inference: from co-
expression clustering to reverse engineering. Bioinformatics 16: 707–26.22. van den Berg RA, Hoefsloot HC, Westerhuis JA, Smilde AK, van der Werf MJ
(2006) Centering, scaling, and transformations: improving the biological
information content of metabolomics data. BMC Genomics 7: 142.23. Giancarlo R, Scaturro D, Utro F (2008) Computational cluster validation for
microarray data analysis: experimental assessment of Clest, ConsensusClustering, Figure of Merit, Gap Statistics and Model Explorer. BMC
Bioinformatics 9: 462.
24. Naegle KM, Gymrek M, Joughin BA, Wagner JP, Welsch RE, et al. (2010)PTMScout, a web resource for analysis of high throughput post-translational
proteomics studies. Mol Cell Proteomics 9: 2558–70.25. Benjamini Y, Hochberg Y (1995) Controlling the false discovery rate - a practical
and powerful approach to multiple testing. J Roy Stat Soc B 57: 289–300.
26. Zhang Y, Wolf-Yadlin A, White FM (2007) Quantitative proteomic analysis of
phosphotyrosine-mediated cellular signaling networks. Methods Mol Biol 359:203–12.
27. Tashiro K, Tsunematsu T, Okubo H, Ohta T, Sano E, et al. (2009) GAREM, anovel adaptor protein for growth factor receptor-bound protein 2, contributes to
cellular transformation through the activation of extracellular signal-regulatedkinase signaling. J Biol Chem 284: 20206–14.
28. Gensler M, Buschbeck M, Ullrich A (2004) Negative regulation of HER2
signaling by the PEST-type protein-tyrosine phosphatase BDP1. J Biol Chem279: 12110–6.
29. Mitra SK, Hanson DA, Schlaepfer DD (2005) Focal adhesion kinase: incommand and control of cell motility. Nat Rev Mol Cell Biol 6: 56–68.
30. Oser M, Condeelis J (2009) The cofilin activity cycle in lamellipodia and
invadopodia. J Cell Biochem 108: 1252–62.31. Badowski C, Pawlak G, Grichine A, Chabadel A, Oddou C, et al. (2008) Paxillin
phosphorylation controls invadopodia/podosomes spatiotemporal organization.Mol Biol Cell 19: 633–45.
32. Bowden ET, Barth M, Thomas D, Glazer RI, Mueller SC (1999) An invasion-related complex of cortactin, paxillin and pkcmu associates with invadopodia at
sites of extracellular matrix degradation. Oncogene 18: 4440–9.
33. Azuma K, Tanaka M, Uekita T, Inoue S, Yokota J, et al. (2005) Tyrosinephosphorylation of paxillin affects the metastatic potential of human osteosar-
coma. Oncogene 24: 4754–64.34. Cooper JA, Esch FS, Taylor SS, Hunter T (1984) Phosphorylation sites in
enolase and lactate dehydrogenase utilized by tyrosine protein kinases in vivo
and in vitro. J Biol Chem 259: 7835–41.35. Babbin BA, Parkos CA, Mandell KJ, Winfree LM, Laur O, et al. (2007) Annexin
2 regulates intestinal epithelial cell spreading and wound closure through Rho-related signaling. Am J Pathol 170: 951–66.
36. Hayes MJ, Moss SE (2009) Annexin 2 has a dual role as regulator and effector ofv-Src in cell transformation. J Biol Chem 284: 10202–10.
37. Attanasio F, Caldieri G, Giacchetti G, van Horssen R, Wieringa B, et al. (2011)
Novel invadopodia components revealed by differential proteomic analysis.Eur J Cell Biol 90: 115–27.
38. Feo S, Arcuri D, Piddini E, Passantino R, Giallongo A (2000) ENO1 geneproduct binds to the c-myc promoter and acts as a transcriptional repressor:
relationship with Myc promoter-binding protein 1 (MBP-1). FEBS Lett 473:
47–52.39. Hitosugi T, Kang S, Vander Heiden MG, Chung TW, Elf S, et al. (2009)
Tyrosine phosphorylation inhibits PKM2 to promote the warburg effect andtumor growth. Sci Signal 2: ra73.
40. Ravichandran KS (2001) Signaling via Shc family adapter proteins. Oncogene20: 6322–30.
41. Batzer AG, Rotin D, Urena JM, Skolnik EY, Schlessinger J (1994) Hierarchy of
binding sites for Grb2 and Shc on the epidermal growth factor receptor. MolCell Biol 14: 5192–201.
42. Davis MA, Ireton RC, Reynolds AB (2003) A core function for p120-catenin incadherin turnover. J Cell Biol 163: 525–34.
43. Saez-Rodriguez J, Goldsipe A, Muhlich J, Alexopoulos LG, Millard B, et al.
(2008) Flexible informatics for linking experimental data to mathematical modelsvia DataRail. Bioinformatics 24: 840–7.
44. Shi J, Mailik J (2000) Normalized cuts and image segmentation. IEEE TransPattern Anal Mach Intell 22: 888–905.
45. Kohonen T (1990) The self-organizing map. Proceedings of the IEEE 78:
1464–1480.46. Joughin BA, Naegle KM, Huang PH, Yaffe MB, Lauffenburger DA, et al. (2009)
An integrated comparative phosphoproteomic and bioinformatic approachreveals a novel class of MPM-2 motifs upregulated in EGFRvIII-expressing
glioblastoma cells. Mol Biosyst 5: 59–67.
A Framework for Clustering of Biological Datasets
PLoS Computational Biology | www.ploscompbiol.org 15 July 2011 | Volume 7 | Issue 7 | e1002119
Top Related
Copyright © 2022 FDOKUMEN

