


Bahasa
Halaman
Hukum


Learning to multitask: Effects of video game practice
on electrophysiological indices of attention and
resource allocation
EDWARD L. MACLIN,a KYLE E. MATHEWSON,a,b KATHY A. LOW,a WALTER R. BOOT,c
ARTHUR F. KRAMER,a,b MONICA FABIANI,a,b and GABRIELE GRATTONa,b
aBeckman Institute for Advanced Science and Technology, University of Illinois, Urbana, Illinois, USAbDepartment of Psychology, University of Illinois at Urbana–Champaign, Urbana, Illinois, USAcDepartment of Psychology, Florida State University, Tallahassee, Florida, USA
Abstract
Changes in attention allocation with complex task learning reflect processing automatization and more efficient
control. We studied these changes using ERP and EEG spectral analyses in subjects playing Space Fortress, a complex
video game comprising standard cognitive task components. We hypothesized that training would free up attentional
resources for a secondary auditory oddball task. Both P3 and delta EEG showed a processing trade-off between game
and oddball tasks, but only some game events showed reduced attention requirements with practice. Training mag-
nified a transient increase in alpha power following both primary and secondary task events. This contrastedwith alpha
suppression observed when the oddball task was performed alone, suggesting that alpha may be related to attention
switching. Hence, P3 and EEG spectral data are differentially sensitive to changes in attentional processing occurring
with complex task training.
Descriptors: Event-related brain potential (ERP), Event-related spectral perturbation (ERSP), Electroencephalogram
(EEG), Video games, Alpha rhythm, Attention control, Training, Practice
Video games have recently received increased interest from cog-
nitive researchers, both as a model for the learning of complex
tasks and as a means to examine training and transfer of skills
(Achtman, Green, & Bavelier, 2008; Basak, Boot, Voss, &
Kramer, 2008; Erickson et al., 2010; Green& Bavelier, 2008). As
video games can approach real-life tasks in terms of complexity,
they generate an ideal test bed for examining attention control
functions when several tasks have to be performed concurrently.
Here we exploit the features of a well-characterized video game
(Space Fortress, SF; Donchin, Fabiani, & Sanders, 1989) and
use electrophysiological measures to examine how attention to
different tasks and task components is deployed before and after
extensive training. This allows us to capture the dynamics of the
attention control system as it changes with practice.
The SF game was developed as a tool for studying learning
and training strategies (Donchin et al., 1989; Shebilske et al.,
2005; see Figure 1). Players are required to focus attention on
multiple demanding and overlapping component tasks that sim-
ulate the complexity of many important real-world tasks such as
piloting, air traffic control, and radar or sonar monitoring. The
game incorporates difficult motor, memory, dual-task, and vi-
sual/attentional components, many of which are based on the
cognitive psychology literature. In short, it requires participants
to control a flying ship and destroy an aggressive fortress while
identifying mines that appear periodically as ‘‘friends’’ or ‘‘foes’’
and reacting to them accordingly.
In this article we focused on both discrete (event-related) and
continuous aspects of the SF game. The discrete components
include two nonflying aspects of the game: brain responses to
successful ‘‘hits’’ on the fortress and to the appearance of mines.
We selected these events for two main reasons: Their discrete
nature allows for the computation of event-related activity, and
they represent distinct types of events, in that mine appearance is
independent of the participants’ behavior, whereas fortress hits
are a direct result of the participants’ performance. To the extent
that these two types of events engage different aspects of atten-
tion (reorienting of attention in the case of mine appearance and
feedback processing in the case of fortress hits) we expect to
observe different patterns of electrophysiological activity (Min &
Hermann, 2007; Sauseng et al., 2005) and perhaps different pat-
terns of change with game learning (Li, Gratton, Yao, & Knight,
2010; Zhuang et al., 1997).
This project was supported in part by Office of Naval Research
MURI grant (N00014-07-1-1913) to A. F. K. We also acknowledge a
Natural Science and Engineering Research Council of Canada Fellow-
ship to K. E. M. Finally, we thank Tanya Stanley and Kunal Patel for
help with data collection.Address correspondence to: Gabriele Gratton, University of Illinois,
Beckman Institute, 405 N. Mathews Ave., Urbana, IL 61801, USA.E-mail: [email protected]
Psychophysiology, ]]] (2011), 1–11. Wiley Periodicals, Inc. Printed in the USA.Copyright r 2011 Society for Psychophysiological ResearchDOI: 10.1111/j.1469-8986.2011.01189.x
1

In addition, we focused on a continuous component of the
task, likely dominated by ship control, which needs to be carried
on uninterruptedly. Note that this is the most critical aspect of
game playing and has a large influence on game performance and
learning (Fabiani et al., 1989). For this we analyze the back-
ground electroencephalographic (EEG) activity irrespective of
discrete game events.
The data presented here were collected in the context of a
larger study on the effects of training strategy on learning transfer
(Boot et al., 2010) during which participants received 20 h of
game training. The EEG recording sessions took place before
and after training. During these sessions, a secondary probe task
(auditory oddball) was introduced both during the game and in a
separate condition where only the oddball task was performed.
For this task, participants counted rare target tones in an on-
going sequence of frequent but irrelevant tones. The secondary
oddball task was introduced as a means of tracking the change in
allocation of resources that may accompany performance
improvements in the primary task (SF game). With learning,
resources originally dedicated to particular game events may be
freed up and reallocated to processing the secondary task. Spe-
cifically, we were interested in comparing fortress hits and odd-
ball tones because these two events share some common features.
Namely, successful performance requires the participant to keep
track of the number of occurrences of each: Fortress hits must be
counted in order to knowwhen the fortress has sustained enough
damage to be destroyed with a fatal double shot, and a running
count of the tones has to be kept to perform the oddball task.
To analyze the brain activity associated with these discrete
task events we used two approaches: an analysis of event-related
brain potentials (ERPs) and an analysis of event-related spectral
perturbations (ERSPs). Note that the main difference between
these two analytic approaches is that the ERPs assume coherence
of the timing of brain activity to the eliciting events whereas the
ERSPs do not (Makeig, Debener, Onton, & Delorme, 2004;
Pfurtscheller &Lopes da Silva, 1999; Sauseng et al., 2007). Given
the complexity of the game, we felt that it was important to
examine both, in part because there could be increased variability
of responses compared to standard laboratory tasks. In addition,
ERPs and ERSPs may be differentially sensitive to neurophys-
iological transactions associated with cognitive processing.
For the ERP analyses we focused on the P300 or P3 com-
ponent, which has been extensively used as an index of the al-
location of attention across tasks (Allison & Polich, 2008; Isreal,
Chesney, Wickens, & Donchin, 1980; Kramer, Wickens, &
Donchin, 1983; Low, Leaver, Kramer, Fabiani, & Gratton,
2009; Sirevaag, Kramer, Coles, & Donchin, 1989). In a typical
experiment, the difficulty of a primary task (or the priority given
to that task) is manipulated while participants are asked to si-
multaneously perform a secondary task, such as an oddball
task.1 The amplitude of the P3 component to the secondary
oddball task decreases when the primary task becomes harder or
is prioritized, provided that the increased effort involves percep-
tual or central processing, or both, as opposed to strictly motor
processing. We reasoned that with increased skill level on the
game, attentional resources would be more effectively allocated
and fewer resources would be required to play the game effi-
ciently, and therefore more resources could be dedicated to
the secondary task. By comparing the P3 elicited by the in-game
task of hitting the fortress with that of the secondary task of odd-
ball counting, we sought to quantify this trade-off in attentional
resources.
Several studies have shown that some aspects of oddball
ERSPs are associated with the P3 (Basar-Eroglu, Basar, Demir-
alp, & Schurmann, 1992; Bernat, Malone, Williams, Patrick, &
Iacono, 2007), including power increases in the delta and theta
bands and decreases in alpha power. Increases in delta and theta
power and decreases in alpha-band power (alpha suppression, or
event-related alpha desynchronization) have also been associated
with the degree of attentional engagement (Klimesch, Doppel-
mayr, Russegger, Pachinger, & Schwaiger, 1998; Klimesch, Sau-
seng, & Hanslmayr, 2007). A series of recent studies has shown
that attentional engagement can be tracked with some temporal
precision by alpha oscillations (Babiloni et al., 2004). Other
studies have demonstrated that these oscillations are directly re-
lated to the excitability of the cortex (Romei et al., 2008) and
predict the conscious detection of visual stimuli (Mathewson,
Gratton, Fabiani, Beck, & Ro, 2009). Here we espouse the view
that the alpha rhythm occurs in many, perhaps all, cortical re-
gions, and that its overarching role presumably reflects a pulsat-
ing inhibition process (Mathewson et al., 2009), although
specifically adapted to each region’s function(s) (Jensen&Maza-
heri, 2010). In other words, we hypothesize that the role of alpha
across regions is gating or controlling the flow and timing of
information transfer, just as we have recently demonstrated in
the visual system (Mathewson et al., 2009). Therefore we also
measured induced changes in multiple frequency bands time-
locked to the occurrence of significant events in the SF game and
2 E.L. Maclin et al.
Figure 1. Schematic representation of the Space Fortress game. Subtask
scores are continuously updated and displayed in the bottom panel.
1Here we assume that working memory and attentional limitationsoccur at a supramodal level, where a single resource pool is used toprocess visual and auditory stimuli (see Wickens, 2008). To use a dualtask paradigm to study the allocation of this type of central processingresource (in contrast with modality-specific resources), the two tasks aretypically presented in different sensory modalities and require differentresponse modalities (counting and motor responses, respectively).

to the secondary task oddball tones, to further identify electro-
physiological correlates of attentional engagement and how they
change with training. Specifically, we predicted that the P3
and delta/theta power changes in response to fortress hits would
decrease after training, whereas those elicited by rare tones
would increase.
Past research has also shown a general increase in centrally
located alpha and frontal theta activity with the learning of the
SF task (Smith, McEvoy, & Gevins, 1999; see also Gevins,
Smith, McEvoy, & Yu, 1997). Smith and colleagues also found
that alpha recorded over somatosensory regions increased with
acquisition of motor skill. We sought to replicate this finding by
measuring alpha power in the period prior to discrete game
events and extend it by examining the ERSPs elicited by such
events.
Finally, activity in the beta range is also known to be impor-
tant for attention and motor processing. Occipital beta activity
has been shown to increase with attentional processing (Gross et
al., 2004) and to have an inverse relationship with occipital alpha
activity, such that lower posterior alpha activity is associated
with higher beta activity. We thus predicted a generally comple-
mentary pattern of beta compared to alpha power.
Methods
Participants
Thirty-nine participants were recruited from the Urbana–Cham-
paign community through flyers posted in campus buildings and
businesses or through advertisements posted to online bulletin
boards. Responding individuals completed a survey of their
video game habits and returned it via e-mail. Participants were
admitted into the study if they reported playing less than 3 h of
video games a week in the past 2 years. All participants reported
being right-handed and having normal or corrected-to-normal
vision. Participants were paid $15 an hour for a total of $350.
This compensation reflected the extensive time commitment re-
quired of them and provided a necessary incentive for them to
complete all phases of this lengthy study. Two participants were
excluded from data analysis, one because of problems with EEG
recording artifacts and the other because of performance data
well outside the group’s distribution. Of the remaining 37 par-
ticipants, 11 were male, and their ages ranged from 19 to 29
years. This study was approved by the University of Illinois In-
stitutional Review Board.
Procedures
In an initial orientation session, participants watched a 20-min
movie that explained all the details of the SF game, and then
another 5-min movie that summarized the most important rules.
After viewing these movies, participants played twenty-four
3-min-long games to familiarize themselves with SF and were
then scheduled for their pretraining EEG session. After this,
participants practiced the game for 20 h and then returned for
their posttraining EEG recording session.2 During the EEG ac-
quisition sessions participants first performed three 70-tone
blocks of the auditory oddball task without the game (oddball
without game). They then played ten 3-min-long games andwere
told to try to maximize their total score in each game. While
playing the 10 games, participants also performed a secondary
auditory oddball task, also with 70 tones (oddball with game).
For both oddball tasks, tone bursts were 340 ms long and were
presented over speakers at �70 dB SPL every 2330 ms (stimulus
onset asynchrony). Frequent tones (�80%) were 350 Hz and
rare tones (�20%) were 500 Hz. Participants were instructed to
silently count the rare (high) tones and report the total at the end
of each game. Silent counting is a common measure of attention
in oddball taskswhen, as in the present study, it is not possible (or
desirable) to collect overt responses on each trial because they
may interfere with the responses required by the primary task.
The oddball task was implemented in E-Prime running on a
separate computer.
The Space Fortress Game
Complete details of the SF game can be found in previous reports
(Donchin et al., 1989), so here we summarize only the most
important aspects of the game. Players navigate a ship in a fric-
tionless environment with precise control using a joystick (see
Figure 1). Players can rotate the ship by moving the joystick left
or right and can apply thrust by pushing forward on the joystick.
For players to slow or stop the ship they must rotate it so that it
faces opposite the desired course correction and apply thrust.
Control of the ship is a challenging and demanding task.
The player’s main goal is to destroy the Space Fortress (at the
center of the screen) as many times as possible while avoiding
damage to his or her ship. To destroy the fortress, players must
hit it with missiles by aiming their ship toward it and pressing the
fire button on the top of the joystick. To destroy the fortress
players must first hit it with 10 missiles, with the timing between
each hit being at least 250 ms and then hit it again with a rapid
(o250 ms) double shot. If the player hits the fortress with a
double shot before it is vulnerable, the vulnerability of the for-
tress is reset to zero and the player must start over again accu-
mulating hits. The fortress rotates and shoots back at the player’s
ship, so the player’s ship must be in constant motion to avoid
damaging hits. When the player’s ship is hit four times it is de-
stroyed and points are lost.
Mines appear on the screen at regular intervals, actively pur-
sue the ship, andwill damage the ship if they come in contactwith
it. Importantly, the fortress cannot be damaged or destroyed as
long as a mine is on the screen; thus mines must be dealt with
immediately. Responding to the appearance of a mine involves a
Sternberg memory search task (Sternberg, 1966). At the begin-
ning of each game participants are asked to remember three let-
ters that identify foemines; all othermines are friends. Eachmine
Electrophysiological indices of video game learning 3
2Participants were randomly assigned to receive either Full EmphasisTraining (FET, n5 19) or Variable Priority Training (VPT, n5 18). Par-ticipants in both training groups were treated identically until the firsttraining session, which followed the first EEG recording session. During
training, FETparticipants were instructed to attempt to obtain the high-est overall score. VPTparticipants were instructed to focus their attentionon a subset of skills during game play on different blocks of trials. Theeffects of these training strategies on performance have already beenreported (Boot et al., 2010). During the EEG recording sessions (pre- vs.posttraining), the group differences in performance were less pronounced(Group � Pre/post interaction: F(1,36)5 3.28, p5 .08), possibly be-cause all games were played in a dual-task context. Furthermore, traininggroup did not interact with any of our electrophysiological measures.Therefore, all results reported here have been collapsed across traininggroups.

has a letter associated with it that is displayed in the instrument
panel at the bottom of the screen, which identifies it as friend or
foe (Figure 1, ‘‘IFF’’). If the mine that appears is a friend, the
player can shoot it, and the mine will transfer this shot to the
fortress. However, if it is a foe, it must be flagged as such using
the mouse and then destroyed with a shot. A friend mine mis-
identified as a foe becomes a foe mine that cannot be destroyed.
Responding to a foe mine as if it were a friend results in wasted
time as the identification process must be repeated. To succeed in
the game, participants must be careful to remember which letters
represent foe mines and to respond to mines appropriately.
Participants were comfortably seated in front of a 19-in. color
LCDmonitor and made game inputs using their left hand on the
computer mouse and their right hand on a Logitech Attack 3
Joysticks for flying and shooting. No game-related sounds were
presented to the subjects.
EEG Recording and Analysis
EEG data were collected in a sound- and electrically attenuated
recording chamber from 64 electrodes3 embedded in a flexible
electrode cap (ElectroCap International, Inc.). Impedances were
below 10 kO. Data were analog filtered online using a 0.01 to 30-
Hz bandpass and sampled at 100 Hz. Note that game event
timing accuracy was limited by the SF game refresh cycle (49ms).
This was not the case for the oddball tones, whose timing ac-
curacy was limited only by the EEG sampling rate. The jitter
introduced by this relatively coarse game event timing accuracy
will strongly affect faster (410 Hz) ERP components, whereas
ERSP activity at these frequencies could still be observed. Elect-
rooculogram (EOG) data were collected on bipolar channels
from electrodes above and below the left eye (VEOG) and on the
left and right outer canthi (HEOG). Scalp channels were refer-
enced to the left mastoid during data collection and then re-
referenced off-line to the average of the two mastoids. It should
be noted that no attemptwasmade to formally localize any of the
electrophysiological activity reported here. All references to an-
atomical locations reflect scalp topography.
EEG data were analyzed with custom scripts written using
Matlab and EEGlab (Delorme & Makeig, 2004). The data were
epoched around three events of interest: mine onsets, fortress
hits, and rare oddball tones. Eye movements were corrected us-
ing the algorithm described by Gratton, Coles, and Donchin
(1983). After eye movement correction, epochs with voltage
changes exceeding 500 mVwere discarded. If an electrode showed
excessive noise (more than 30% of the trials with voltage changes
greater than 500 mV), the data for that electrode were discarded
and replaced by spatially interpolated data using EEGLab’s
spherical interpolation function. Data were then either averaged,
for the ERP analyses, or submitted to a wavelet-based time–
frequency (TF) analysis to derive the baseline EEG and ERSP
measures.4
For the ERP analyses, we focused on the P3, because this
component is an index of attention allocation and can be re-
corded to all three of our events of interest. Mean amplitude was
measured at Fz and Pz over an interval between 300 and 500 ms
following the fortress hits and rare tones and between 350 to 700
ms following the appearance of mines. All time windows were
chosen based on data from electrode Pz, where the P3 is typically
maximal. Different measurement intervals were used because the
P3 was delayed in the mine subtask. We conducted a repeated-
measures analysis of variance (ANOVA) on this activity with
Training (pre/post) and Electrode (Fz/Pz) as factors.
Wavelet analysis of the epoched data was performed with the
newtimef() function of the EEGLab toolbox (Tallon-Baudry,
Bertrand,Delpuech, & Pernier, 1996). To optimize the balance of
time and frequency resolution, a complex group of Morelet ta-
pered wavelets was computed, with one cycle at the lowest fre-
quency (1.6 Hz, 625 ms) and increasing up to 19 cycles at the
highest frequency (30 Hz, 633 ms). To increase frequency res-
olution, data windows were zero padded with a ratio of 2. This
allowed for visualization of frequency information from 1.6 Hz
up to 30 Hz, and from � 645 ms to 1640 ms around the event of
interest. As some of the strongest effects we observed occurred at
the boundary of the alpha and beta bands, we selected regions of
interest in time–frequency space visually rather than using pre-
defined bands (Shackman,McMenamin, Maxwell, Greischar, &
Davidson, 2010).5 The time frequency ranges used were as fol-
lows: alpha, 10–15Hz, 300–700ms; beta, 15–30Hz, 400–500ms;
delta, 0–5 Hz, 250–600 ms; and theta, 5–8 Hz, 400–500 ms.
We carried out a split-half cross-validation procedure to sup-
port our selection of these customized time frequency ranges.
This procedure was based on splitting the subjects into two
groups (odd and even) and performing a time–frequency analysis
on each group. The results of the two analyses were very similar
(indeed, virtually identical). This indicates that, if we had selected
the time–frequency intervals on the basis of only half of the sub-
jects (training set) and used them to analyze the other half (cross-
validation set), we would have selected the same ranges inde-
pendently of which group (odd or even) wewould have chosen as
training or cross-validation sets. This provides a cross-validation
for our range selection. The results of this cross-validation pro-
cedure are too extensive to be presented in the current article, but
will be made available upon request.
4 E.L. Maclin et al.
3The electrodes used were Fp1, Fp2, Fpz, Fz, FCz, Cz, CPz, Pz, POz,Oz, AF3, AF4, F1, F2, F3, F4, F5, F6, F7, F8, FC1, FC2, FC3, FC4,FC5, FC6, C1, C2, C3, C4, C5, C6, T7, T8, CP1, CP2, CP3, CP4, CP5,CP6, TP7, TP8, P1, P2, P3, P4, P5, P6, P7, P8, PO1, PO2, PO3, PO4,PO7, PO8, O1, O2, and M2.
4These criteria resulted in rejection of less than 5%of the trials, exceptfor a few (�6) noisy electrodes that were interpolated as described in thetext. A few entire blocks were excluded because of technical problems.Therewere approximately 140 rare tones presented during the game; afterartifact rejection, subjects averaged 139 trials pretraining and 138 trials
posttraining. In the no-game condition, fewer than 1% of trials wereexcluded, leaving a mean of 41 trials out of 42. Out of the 120 mineappearances, an average of 3 were excluded pretraining and 8 posttrain-ing. The number of fortress hits varied across subjects from 66 to 1,002(mean 442) pretraining and from 64 to 2,807 (mean 1,369) posttraining.
5It should be noted that (a) no bands perfectly captured the observedeffects across all conditions and regions, and (b) many effects straddledthe borders of traditionally defined bands. Part of the problem is thattime–frequency analysis inherently trades off between temporal and fre-quency resolution. As the time windows for analyses were set at less thana second to visualize the dynamics of brain processes associated withgame play, the frequency resolution was several hertz. This led to resultswhose frequency band borders were uncertain and, perhaps, even slightlydistorted (an effect at 10 Hz may be confused with an effect at 12 Hz andso on). For this reason sticking to traditionally defined borders did notcapture the results accurately, and we were forced to adapt our banddefinition to the data. In choosing the band borders, our goal was to findbands that encompassed the most prominent effects across conditions asa way of simplifying comparisons between conditions. Clearly, thisapproach ignores subtle differences between conditions and regions, butthis is part of the rich complexity of this data set that we intend tocontinue exploring in an ongoing follow-up study.

The time–frequency data were analyzed in two ways. First,
the raw power data were compared between the pre- and post-
training sessions for each of the three events of interest. Differ-
ences with training were measured at each point in time–
frequency space using uncorrected paired sample t tests. By av-
eraging this measure over the period before the onset of the
stimulus of interest (� 600 to 0 ms), we visualized changes with
training in the brain activity related to the continuous aspects of
the task, which may provide a measure of the activity changes
due to flying. Changes in selected frequency bands were inves-
tigated using a three-way repeated-measures ANOVA including
Event, Training (pre/post) and Electrode (Fz/Pz) as factors.
To measure the time course of changes in brain activity as-
sociated with discrete events and for a more appropriate com-
parison with the baseline-corrected ERP data, we obtained time–
frequency plots for which the average prestimulus power spec-
trum was subtracted from the spectrum estimated at each time
point, for each frequency. The resulting ERSP data reflect
changes in brain activity elicited by the events of interest. Activity
before and after training was compared using a paired t test at
each point in time–frequency space at electrodes Fz and Pz.
Differences due to training were identified at various frequencies
and lags following the three events of interest. We conducted a
repeated-measures ANOVA on these ranges with Training (pre/
post) and Electrode (Fz/Pz) as factors. To visualize the spatial
distribution of these effects we generated spline-interpolated to-
pographic maps, based on the average activity for each channel
in the related time-frequency windows.
Results
Behavioral Data
Performance on the SF game improved substantially with training.
The average game score during the pretraining EEG session was
� 92.2 (SE5259.5) but after training it increased to 4227.4
(SE5285.1), F(1,36)5338.0, po.001. Error rate in the oddball
task was estimated as the absolute difference between reported and
true counts scaled by the true counts. To derive accuracy, this value
was subtracted from 1. For the oddball-with-game task, tone
counting accuracy increased following training on the SF game
(pre582%; post591%); F(1,36)528.8, po.001. Performance
on the oddball task without the game was very high both pre- and
posttraining (97%) and did not change as a function of training on
the game (or time), Fo1, likely because of ceiling effects.
Electrophysiological Data
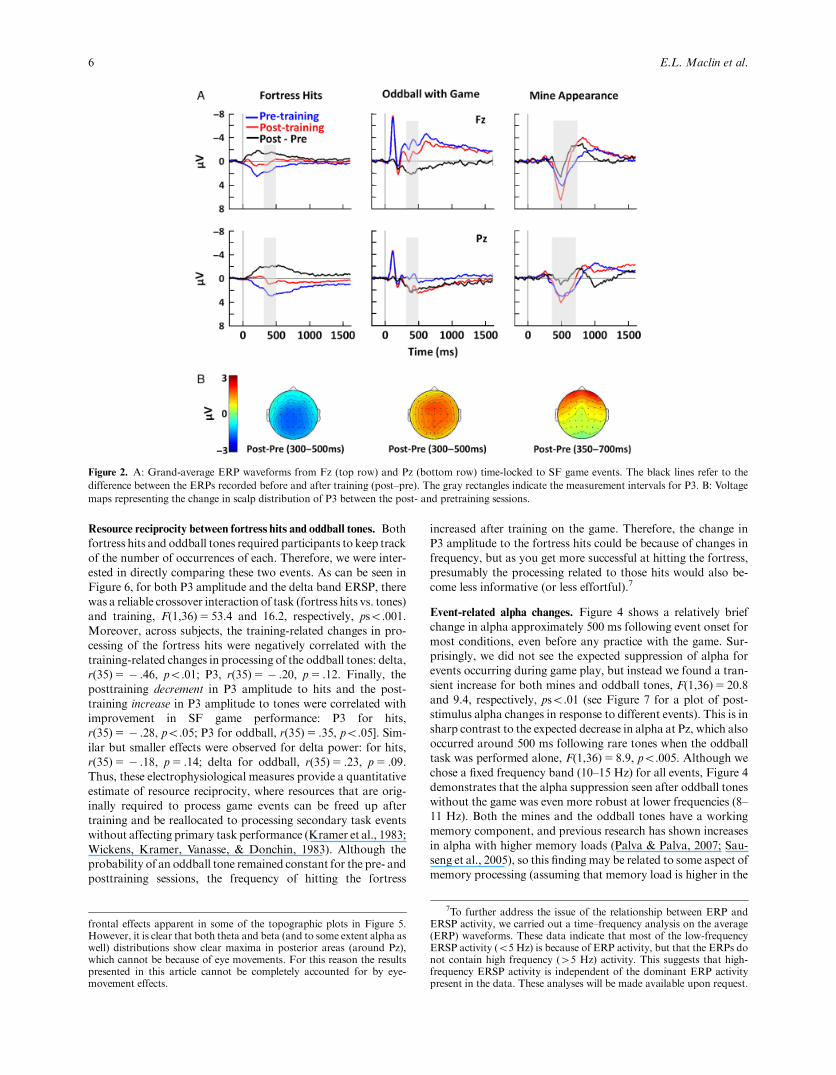
ERP changes with training. The grand average ERP waveforms
for fortress hits, oddball tones, and mines and corresponding to-
pographic maps of the P3 are shown in Figure 2. For fortress hits
and oddball tones, a parietally focused P3 (or P3 complex) can be
seen peaking around 400ms.However, the effect of training on this
component was quite different for these two events. For fortress
hits, the P3 decreased with training, F(1,36)5 43.2, po.001, and
was larger at Pz compared to Fz: Pre/post � Electrode interaction,
F(1,36)5 5.1, po.05; F5 39.6 and 27.9, Pz and Fz respectively,
pso.001. In contrast, for oddball tones during the game, the P3
increased with training, F(1,36)530.2, po.001, and the training
effect did not interact with electrode, Fo1.
For comparison purposes, Figure 3 shows that P3 amplitude
was greatly reduced when rare tones were presented during the
game as opposed to outside the game, although this difference was
less pronounced after training. Rare tones presented during the
game were also processed differently from the frequent tones, even
prior to training on the game (i.e., the ERPs elicited by rare tones
were more positive than those elicited by frequent tones).
The P3 to themines peaked at around 500 ms and was larger at
Fz compared to Pz, F(1,36)5 3.3, p5 .08. There was a trend for
the amplitude to increase after training, F(1,36)5 2.7, p5 .11, and
this effect appeared to be larger at Fz than Pz. The interaction of
training and electrode was not reliable, F(1,36)51.9, p5 .17. This
suggests that mine appearances continue to require focused atten-
tion, even after extensive training.
ERSP changes with training. Plots of the ERSP responses from
Fz and Pz for each of the event of interest before and after
training are presented in Figure 4. Because we are primarily in-
terested in changes following game training (i.e., post vs. pre),
thresholded difference plots (post–pre) of the ERSPs time-locked
to fortress hits, oddball tones, and mines can be seen in Figure 5.
The ERSP difference plots (post–pre) show several large effects
around 500 ms following each of these events. We conducted a
repeated-measures ANOVA on this activity with training (Pre/
post) and Electrode (Fz/Pz) as factors. The delta frequency band
(1.6–5.0 Hz) showed a decrease in power after training for for-
tress hits, F(1,36)5 21.2, po.001, which was more pronounced
at Pz compared to Fz: Training � Electrode interaction,
F(1,36)5 5.0, po.05; Fz pre versus post, F(1,36)5 6.9, po.01;
Pz pre versus post, F(1,36)5 36.2, po.001. This may reflect the
large P3 elicited by these stimuli. For the oddball tones within the
game, there was an increase in delta power after training,
F(1,36)5 3.7, p5 .06, with no interaction with electrode, Fo1.
This pattern corresponds to the changes in P3 with training for
these two events. Moreover, the change in delta power was cor-
related with the change in P3 across subjects for both fortress hits
and oddball tones, r(35)5 .35 and .44, respectively, pso.05,
consistent with the notion that these measures represent the same
(or highly overlapping) functional processes (Bernat et al., 2007).
The alpha frequency band (10–15 Hz) showed an increase
following training for both fortress hits, F(1,36)5 24.5, po.001,
and rare tones, although for tones the difference tended to have a
more frontal distribution: Training � Electrode interaction,
F(1,36)5 3.1, p5 .09; Fz pre versus post, F(1,36)5 2.9,
p5 .09; Pz pre versus post, Fo1. Thus, alpha and delta showed
differential sensitivity to training for these two events.
Formines, practice on the gameproduced an increase across a
broad band of frequencies at Pz, with some frequency bands also
showing an increase at Fz. We divided the activity into four
bands, delta (1.6–5 Hz), theta (5–8 Hz), alpha (10–15 Hz), and
beta (15–30 Hz), and for each of these bands we performed a
repeated-measures ANOVA with two factors: Electrode (Fz/Pz) �Training (pre/post). The delta and alpha bands showed an
increase in power following training, F(1,36)5 26.9 and 7.0, re-
spectively, pso.01, but neither band interacted with electrode. In
contrast, the theta and beta bands showed both an increase in
power with training, F(1,36)5 11.7 and 8.2, respectively,
pso.01, and an interaction with electrode, F(1,36)5 5.4 and
11.8, respectively, pso.05. For both of these bands, the power
increase was greater at Pz than at Fz.6
Electrophysiological indices of video game learning 5
6It may be possible that eye movements were not perfectly correctedand that there might have been systematic differences in eye movementsfrom pre- to posttraining. This might account for the significant far
Resource reciprocity between fortress hits and oddball tones. Both
fortress hits and oddball tones required participants to keep track
of the number of occurrences of each. Therefore, we were inter-
ested in directly comparing these two events. As can be seen in
Figure 6, for both P3 amplitude and the delta band ERSP, there
was a reliable crossover interaction of task (fortress hits vs. tones)
and training, F(1,36)5 53.4 and 16.2, respectively, pso.001.
Moreover, across subjects, the training-related changes in pro-
cessing of the fortress hits were negatively correlated with the
training-related changes in processing of the oddball tones: delta,
r(35)5 � .46, po.01; P3, r(35)5 � .20, p5 .12. Finally, the
posttraining decrement in P3 amplitude to hits and the post-
training increase in P3 amplitude to tones were correlated with
improvement in SF game performance: P3 for hits,
r(35)5 � .28, po.05; P3 for oddball, r(35)5 .35, po.05]. Sim-
ilar but smaller effects were observed for delta power: for hits,
r(35)5 � .18, p5 .14; delta for oddball, r(35)5 .23, p5 .09.
Thus, these electrophysiological measures provide a quantitative
estimate of resource reciprocity, where resources that are orig-
inally required to process game events can be freed up after
training and be reallocated to processing secondary task events
without affecting primary task performance (Kramer et al., 1983;
Wickens, Kramer, Vanasse, & Donchin, 1983). Although the
probability of an oddball tone remained constant for the pre- and
posttraining sessions, the frequency of hitting the fortress
increased after training on the game. Therefore, the change in
P3 amplitude to the fortress hits could be because of changes in
frequency, but as you get more successful at hitting the fortress,
presumably the processing related to those hits would also be-
come less informative (or less effortful).7
Event-related alpha changes. Figure 4 shows a relatively brief
change in alpha approximately 500 ms following event onset for
most conditions, even before any practice with the game. Sur-
prisingly, we did not see the expected suppression of alpha for
events occurring during game play, but instead we found a tran-
sient increase for both mines and oddball tones, F(1,36)5 20.8
and 9.4, respectively, pso.01 (see Figure 7 for a plot of post-
stimulus alpha changes in response to different events). This is in
sharp contrast to the expected decrease in alpha at Pz, which also
occurred around 500 ms following rare tones when the oddball
task was performed alone, F(1,36)5 8.9, po.005. Although we
chose a fixed frequency band (10–15 Hz) for all events, Figure 4
demonstrates that the alpha suppression seen after oddball tones
without the game was even more robust at lower frequencies (8–
11 Hz). Both the mines and the oddball tones have a working
memory component, and previous research has shown increases
in alpha with higher memory loads (Palva & Palva, 2007; Sau-
seng et al., 2005), so this finding may be related to some aspect of
memory processing (assuming that memory load is higher in the
6 E.L. Maclin et al.
Figure 2. A: Grand-average ERP waveforms from Fz (top row) and Pz (bottom row) time-locked to SF game events. The black lines refer to the
difference between the ERPs recorded before and after training (post–pre). The gray rectangles indicate the measurement intervals for P3. B: Voltage
maps representing the change in scalp distribution of P3 between the post- and pretraining sessions.
frontal effects apparent in some of the topographic plots in Figure 5.However, it is clear that both theta and beta (and to some extent alpha aswell) distributions show clear maxima in posterior areas (around Pz),which cannot be because of eye movements. For this reason the resultspresented in this article cannot be completely accounted for by eye-movement effects.
7To further address the issue of the relationship between ERP andERSP activity, we carried out a time–frequency analysis on the average(ERP) waveforms. These data indicate that most of the low-frequencyERSP activity (o5 Hz) is because of ERP activity, but that the ERPs donot contain high frequency (45 Hz) activity. This suggests that high-frequency ERSP activity is independent of the dominant ERP activitypresent in the data. These analyses will be made available upon request.

oddball with the game compared to the oddball without the
game). Another possibility is that this transient increase in alpha
may be related to the attentional switching inherent to this com-
plex game environment. The lack of alpha increase to fortress hits
is consistent with this latter interpretation because presumably
gamers are tracking the shot after it is fired, so there would be no
need to switch attention to a fortress hit.
Non-event-related EEG changes with training. Power spectrum
changes due to training (post–pre) prior to fortress hits, oddball
tones, and mine appearances can be seen in Figure 8. For this
analysis, we focused on the 600 ms preceding the event onset,
which correspond to periods dominated by maintenance of ship
flight. The frequency distribution of post–pre changes was differ-
ent in the baseline period compared to the event-related changes,
so slightly different bands were used (alpha: 8–12 Hz, beta 25–30
Hz). In all three preevent periods there was an increase in alpha
band power after training, F(1,36)5 8.7 and 9.7, pso.01, prior
to hits and tones and F(1,36)5 2.7, p5 .10 prior to mines, and a
decrease in beta band power after training, F(1,36)5 4.8, 3.8,
and 4.8, prior to hits, tones, and mines, respectively, pso.05, as
predicted. A three-way repeated-measures ANOVA of Event �Training (pre/post) � Electrode (Fz/Pz) indicated that these
baseline measures did not vary across the three conditions. For
both the alpha and beta bands, there were no main effects of
event type, Fo1. For the alpha band, there was amarginal Event �
Training interaction, F(1,36)5 2.9, p5 .06, such that the training-
related increase was less pronounced prior to mines compared to
the fortress hits and oddball tones. The baseline beta training
changeswere equivalent across the three events: Event � Training
interaction, F(1,36)o1. However, the decrease in beta power
with training was more pronounced at Pz than at Fz: Training �Electrode interaction, F(1,36)5 3.47, po.07; Fz pre vs. post,
F(1,36)5 1.9, p5 .17; Pz pre vs. post, F(1,36)5 7.5, po.01.
Discussion
Significant improvements in performance were found with train-
ing for both the SF game and the secondary oddball task. Results
demonstrated that electrophysiological measures (ERPs and
ERSPs) can be used to analyze the participants’ workload during
a complex task (Craven, Tremoulet, Barton, Tourville, &Dahan-
Marks, 2009; Rabbi et al., 2009), as well as the degree to which
attentional resources are freed from the primary task and become
available for secondary task performance.
Participants appeared to be able to allocate additional atten-
tional resources to the secondary task as their skill in the primary
task improved. This presumably reflects the automatization of
game subtasks (Kramer, Fisk, Schneider, & Donchin, 1986;
Kramer & Strayer, 1988). The present results illustrate physio-
logical concomitants (P3 amplitude and delta power) of the
allocation of shared resources (Allison & Polich, 2008; Isreal
et al., 1980; Low et al., 2009; Sirevaag et al., 1989;Wickens et al.,
1983) with practice in a complex game environment and also
provide some level of specificity about which subtasks are less
likely to become automatized, as demonstrated by the persistence
and/or increase after training of brain activity following mine
onset. In otherwords, the data are clearly consistent with the idea
that some elements of the game (such as fortress hits) do change
in salience with training (and thus elicit smaller brain responses)
whereas others (such as mine appearance) do not. The inability
of the subjects to develop automaticity for themine identification
task is congruent with previous work by Schneider and Shiffrin
(1977), which shows that automaticity can only develop under
consistent-mapping conditions (i.e., when the same memory set
is used across the entire training). In the SF task, instead, the
memory set is varied across blocks, generating a variable-
mapping condition, which, according to Schneider and Shiffrin,
does not allow for the development of automaticity. Another
possibility is that complex game training may also increase over-
all resource capacity, benefiting secondary task performance
without compromising even highly demanding primary tasks.
The topography of brain activity followingmine onsets showed a
greater frontal contribution compared to that of fortress hits.
The additional frontal activity may be related to the higher level
of control processes demanded by themine handling subtask. An
alternative interpretation is that this frontal activity may be the
result of systematic changes in eye-movement strategies to mine
appearance occurring with training. However, it is important to
note that eye movements are an important component of attent-
ional shifts, and therefore even this interpretation can be con-
sidered consistent with the idea that attention control changes
with training. Future studies of these physiological effects may
shed light on just how resources are managed in a dynamic
workload environment.
A morphological difference that can be noted in the ERPs
elicited bymines, oddball tones, and fortress hits is that the P3s to
Electrophysiological indices of video game learning 7
Figure 3. Grand-average ERP waveforms at Fz and Pz for rare and
frequent tones during and outside the game, before and after training.

mines appear sharper, suggesting a decreased latency jitter. This
may correspond to a greater degree of ‘‘cognitive’’ jitter of the
subjects’ reactions to the tones and fortress hits than to themines,
reflecting the fact that the mines require an immediate response,
whereas the other two events do not. An alternative, and not
mutually exclusive, explanation is that mine appearance also
elicits a long-latency negative component that may diminish the
late part of P3 amplitude because of overlap.
Several authors have proposed that the P3 reflects phase-
locked delta, theta, and alpha range oscillations (Basar-Eroglu et
al., 1992; Bernat et al., 2007; Yordanova, Kolev, & Polich, 2001).
It is difficult to make definitive generalizations about the relative
sensitivity of ERPs and ERSPs to specific aspects of cognition.
However, our observation of an inversion of the alpha suppres-
sion normally found in single-task oddball experiments coupled
with the differential effects of training (P3 decreases and alpha
increases) clearly shows that these measures reflect different as-
pects of the underlying cognitive processing. One possibility is
that the alpha enhancement we observe is related to attention-set
switching, which would be greater during the game than in the
oddball-alone condition. This is because the task is complex and
requires paying attention to different elements at different times.
The process of switching attention set may require both activa-
tion (of the processors related to the newly relevant elements) and
inhibition (of the processors related to old, not currently rele-
vant, elements). Thus, this account is not necessarily inconsistent
with the general idea that alpha may be related to inhibitory
processing. However, in this view, frontal alpha may be an ex-
pression of top-down cognitive control operations.
Specific high-temporal-resolution event-related effects were
observed in multiple bands in the ERSP. These effects varied
across event types, although in all cases the most prominent ones
8 E.L. Maclin et al.
Figure 4. Event related spectral perturbation (ERSP) plots for fortress hits, rare tones (inside and outside the game), andmine appearances, before (pre)
and after (post) training for electrodes Fz and Pz.

occurred approximately 500 ms after the event. For fortress hits,
the low-frequency band (1.6–5.0 Hz) showed a decrease in power
after training, whereas the alpha band (10–15 Hz) showed an
increase following training. For mine hits, training produced ro-
bust broadband (delta, theta, alpha, and beta) increases in ac-
tivity. Training led to modest increases in the response to rare
tones presented during the game in both the delta (1.6–5.0 Hz)
and alpha (10–15 Hz) frequency bands.
It should be noted that in this study we made no attempt to
control for effects of the relative overlapping of temporal se-
quences of events in different subtasks. This is an inherent char-
acteristic of real-world multitasking and presents particular
problems of experimental design when the sequences depend on
the subjects’ responses. In the future, both improved experimen-
tal designs and analysis methods are likely to provide further
insights into how the brain adapts to simultaneous task demands.
Our results confirm previous work of Smith and colleagues
(1999; see also Gevins et al., 1997) in showing a general (non-
event-related) increase in alpha power with training during the
SF session as a whole. Also consistent with this previous work,
Electrophysiological indices of video game learning 9
Figure 5. Top rows: ERSP time–frequency plots (first row, Fz; second row, Pz) of the differences in brain activity with training (post–pre). The plots
only show differences that passed an uncorrected paired t test at each point in time–frequency space (po.05). Boxes represent the time–frequency
windows used for analyses. The baseline in the figures starts at the midpoint of the longest wavelet used for estimating the baseline correction spectra.
Bottom row: Topographic plots of the power differences between after and before training.
Figure 6. A:Mean amplitude of P3 at Pz before and after training for fortress hits and rare tones. B: Mean delta band ERSP power change at Pz before
and after training for fortress hits and rare tones. Error bars in both plots indicate the standard error of the mean.

our results indicate a relationship between alpha effects and those
occurring at lower frequencies (delta and theta bands). This low-
frequency ERSP activity largely overlaps with the ERP P3 effects
and may reflect similar brain phenomena. Our findings extend
the results presented by Smith and colleagues by demonstrating a
decrease in beta power with training. We attribute this change to
the learning of ship control skills.
The differences we observed in peak frequency, particularly in
the alpha band, across conditions and electrodes suggest that
there aremultiple generators of activity in each band.We suggest,
however, that the role of the activity in specific bands is similar in
different regions of the brain and, in particular, that alpha ac-
tivity reflects the control and gating of attention that is part of the
process by which networks of regions are brought to bear on
particular tasks (Jensen & Mazaheri, 2010; Mathewson et al.,
2009).
In conclusion, the current study demonstrates that electro-
physiological measures provide a window on the richness and
complexity of brain activity associated with specific subtasks in a
video game environment. Electrophysiological data are partic-
ularly useful because they can be used to monitor both contin-
uous anddiscrete (event-related) components of the task. The use
of a dual-task methodology further enhances our understanding
of training effects. Future research may address issues of the
interaction with training regimes and individual differences in
learning abilities, strategies, and skill transfer.
References
Achtman, R. L., Green, C. S., & Bavelier, D. (2008). Video games as atool to train visual skills. Restorative Neurology and Neuroscience, 26,435–446.
Allison, B. Z., & Polich, J. (2008). Workload assessment of computergaming using a single-stimulus event-related potential paradigm. Bio-logical Psychology, 77, 277–283.
Babiloni, C., Miniussi, C., Babiloni, F., Carducci, F., Cincotti, F., DelPercio, C., et al. (2004). Sub-second ‘‘temporal attention’’ modulatesalpha rhythms. A high-resolution EEG study. Cognitive Brain Re-search, 19, 259–268.
Basak, C., Boot, W. R., Voss, M. W., & Kramer, A. F. (2008). Cantraining in a real-time strategy video game attenuate cognitive declinein older adults? Psychology and Aging, 23, 765–777.
Basar-Eroglu, C., Basar, E., Demiralp, T., & Schurmann, M. (1992).P300-response: Possible psychophysiological correlates in delta andtheta frequency channels. A review. International Journal of Psycho-physiology, 13, 161–179.
Bernat, E. M., Malone, S. M., Williams, W. J., Patrick, C. J., & Iacono,W. G. (2007). Decomposing delta, theta, and alpha time-frequencyERP activity from a visual oddball task using PCA. InternationalJournal of Psychophysiology, 64, 62–74.
Boot, W. R., Basak, C., Erickson, K., Neider, M., Simons, D. J., Fabiani,M., et al. (2010). Transfer of skill engendered by complex task trainingunder conditions of variable priority. Acta Psychologica, 135, 349–357.
Craven, P. L., Tremoulet, P. D., Barton, J. H., Tourville, S. J., &Dahan-Marks, Y. (2009). Evaluating training with cognitive statesensing technology. Lecture Notes in Computer Science, 5638,585–594.
Delorme, A., & Makeig, S. (2004). EEGLAB: An open source toolboxfor analysis of single-trial EEG dynamics including independentcomponent analysis. Journal of Neuroscience Methods, 134, 9–21.
Donchin, E., Fabiani, M., & Sanders, A. (1989). The learning strategiesproject: An examination of the strategies in skill acquisition. ActaPsychologica, 71, 1–311.
Erickson, K. I., Boot, W. R., Basak, C., Neider, M. B., Prakash, R. S.,Voss,M.W., et al. (2010). Striatal volume predicts level of video gameskill acquisition. Cerebral Cortex. Advance online publication. doi:10.1093/cercor/bhp293
Fabiani, M., Buckley, J., Gratton, G., Coles, M. G. H., Donchin, E., &Logie, R. (1989). The training of complex task performance. ActaPsychologica, 71, 259–299.
Gevins, A., Smith,M. E., McEvoy, L., & Yu, D. (1997). High-resolutionEEG mapping of cortical activation related to working memory:Effects of task difficulty, type of processing, and practice. CerebralCortex, 7, 374–385.
Gratton, G., Coles, M. G. H., & Donchin, E. (1983). A new method foroff-line removal of ocular artifact. Electroencephalography and Clin-ical Neurophysiology, 55, 468–484.
10 E.L. Maclin et al.
Figure 7. The mean ERSP power changes in the alpha band for each
game event before and after training, between 300 and 700 ms after event
onset. Error bars indicate the standard error of the mean.Figure 8. Power spectra differences during the periods preceding each
discrete event (top, Fz; bottom, Pz).

Green, C. S., & Bavelier, D. (2008). Exercising your brain: A review ofhuman brain plasticity and training-induced learning.Psychology andAging, 23, 692–701.
Gross, J., Schmitz, F., Schnitzler, I., Kessler, K., Shapiro, K., Hommel,B., & Schnitzler, A. (2004). Modulation of long-range neural syn-chrony reflects temporal limitations of visual attention in humans.Proceedings of the National Academy of Sciences, USA, 101, 13050–13055.
Isreal, J. B., Chesney, G. L.,Wickens, C. D., &Donchin, E. (1980). P300and tracking difficulty: Evidence For multiple resources in dual-taskperformance. Psychophysiology, 17, 259–273.
Jensen, O., & Mazaheri, A. (2010). Shaping functional architecture byoscillatory alpha activity: Gating by inhibition. Frontiers in HumanNeuroscience, 4, 1–8.
Klimesch, W., Doppelmayr,M., Russegger, H., Pachinger, T., & Schwa-iger, J. (1998). Induced alpha band power changes in the human EEGand attention. Neuroscience Letters, 244, 73–76.
Klimesch, W., Sauseng, P., & Hanslmayr, S. (2007). EEG alpha oscil-lations: The inhibition-timing hypothesis.BrainResearchReviews, 53,63–88.
Kramer, A. F., Fisk, A., Schneider, W., & Donchin, E. (1986). Theeffects of practice and task structure on components of the event-related brain potential. Psychophysiology, 23, 33–47.
Kramer, A. F., & Strayer, D. L. (1988). Assessing the development ofautomatic processing: Dual-task and event related brain potentialmethodologies. Biological Psychology, 26, 231–267.
Kramer, A. F., Wickens, C. D., &Donchin, E. (1983). An analysis of theprocessing demands of a complex perceptual-motor task. HumanFactors, 25, 597–622.
Li, L., Gratton, C., Yao, D., & Knight, R. T. (2010). Role of frontal andparietal cortices in the control of bottom-up and top-down attentionin humans. Brain Research, 1344, 173–184.
Low, K. A., Leaver, E. E., Kramer, A. F., Fabiani, M., & Gratton, G.(2009). Share or compete? Load-dependent recruitment of prefrontalcortex during dual-task performance. Psychophysiology, 46, 1069–1079.
Makeig, S., Debener, S., Onton, J., & Delorme, A. (2004). Mining event-related brain dynamics. Trends in Cognitive Sciences, 8, 204–210.
Mathewson, K. E., Gratton, G., Fabiani, M., Beck, D. M., & Ro, T.(2009). To see or not to see: Prestimulus alpha phase predicts visualawareness. Journal of Neuroscience, 29, 2725–2732.
Min, B. K., & Hermann, C. S. (2007). Prestimulus EEG alpha activityreflects prestimulus top-down processing. Neuroscience Letters, 422,131–135.
Palva, S., & Palva, J. M. (2007). New vistas for alpha-frequency bandoscillations. Trends in Neurosciences, 30, 150–158.
Pfurtscheller, G., & Lopes da Silva, F. H. (1999). Event-related EEG/MEG synchronization and desynchronization: Basic principles. Clin-ical Neurophysiology, 110, 1842–1857.
Rabbi, A. F., Ivanca, K., Putnam, A. V., Musa, A., Thaden, C. B., &Fazel-Rezai, R. (2009). Human performance evaluation based on
EEG signal analysis: A prospective review. Conference Proceeding ofIEEE Engineering Medical and Biology Society, 2009, 1879–1882.
Romei, V., Brodbeck, V., Michel, C., Amedi, A., Pascual-Leone, A., &Thut, G. (2008). Spontaneous fluctuations in posterior alpha-bandEEG activity reflect variability in excitability of human visual areas.Cerebral Cortex, 18, 2010–2018.
Sauseng, P., Klimesch, W., Doppelmayr, M., Pecherstorfer, T., Freun-berger, R., & Hanslmayr, S. (2005). EEG alpha synchronization andfunctional coupling during top-down processing in a working mem-ory task. Human Brain Mapping, 26, 148–155.
Sauseng, P., Klimesch, W., Gruber, W. R., Hanslmayr, S., Freunberger,R., & Doppelmayr, M. (2007). Are event-related potential compo-nents generated by phase resetting of brain oscillations? A criticaldiscussion. Neuroscience, 146, 1435–1444.
Schneider, W., & Shiffrin, R. M. (1977). Controlled and automatic hu-man information processing: I. Detection, search, and attention.Psychological Review, 84, 1–66.
Shackman, A. J., McMenamin, B. W., Maxwell, J. S., Greischar, L. L.,& Davidson, R. J. (2010). Identifying robust and sensitive frequencybands for interrogating neural oscillations. NeuroImage, 51, 1319–1333.
Shebilske, W. L., Volz, R. A., Gildea, K. M., Workman, J. W., Nan-janath, M., Cao, S., et al. (2005). Revised Space Fortress: A valida-tion study. Behavior Research Methods, 37, 591–601.
Sirevaag, E. J., Kramer, A. F., Coles, M. G. H., & Donchin, E. (1989).Resource reciprocity: An event-related brain potentials analysis.ActaPsychologica, 70, 77–97.
Smith, M. E., McEvoy, L. K., & Gevins, A. (1999). Neurophysiologicalindices of strategy development and skill acquisition. Cognitive BrainResearch, 7, 389–404.
Sternberg, S. (1966). High-speed scanning in human memory. Science,153, 652–654.
Tallon-Baudry, C., Bertrand, O., Delpuech, C., & Pernier, J. (1996).Stimulus specificity of phase-locked and non-phase-locked 40 Hzvisual responses in human. Journal of Neuroscience, 16, 4240–4249.
Wickens, C. D. (2008). Multiple resources and mental workload.HumanFactors, 50, 449–455.
Wickens, C. D., Kramer, A., Vanasse, L., & Donchin, E. (1983). Per-formance of concurrent tasks: A psychophysiological analysis of thereciprocity of information-processing resources. Science, 221, 1080–1082.
Yordanova, J., Kolev, V., & Polich, J. (2001). P300 and alpha event-related desynchronization (ERD). Psychophysiology, 38, 143–152.
Zhuang, P., Toro, C., Grafman, J., Manganotti, P., Leocani, L., & Hal-lett, M. (1997). Event-related desynchronization (ERD) in the alphafrequency during development of implicit and explicit learning.Electroencephalography and Clinical Neurophysiology, 102, 374–381.
(Received September 21, 2010; Accepted December 21, 2010)
Electrophysiological indices of video game learning 11
Top Related
Copyright © 2022 FDOKUMEN

