


Bahasa
Halaman
Hukum

Laser-pumped paraffin-coated cell rubidium frequency standard
Thejesh Bandi,a) Christoph Affolderbach, and Gaetano MiletiLaboratoire Temps-Frequence (LTF), Institut de Physique, Universite de Neuchatel,Avenue de Bellevaux 51, 2000 - Neuchatel, Switzerland
(Received 23 January 2012; accepted 18 May 2012; published online 21 June 2012)
We have realized and studied a rubidium atomic frequency standard based on a paraffin-coated
cell, exhibiting a short-term frequency stability <3� 10�12 s�1/2 between s¼ 1 and 100 s.
Characterization of the wall-coating is performed by measuring the T1 and T2 relaxation times.
Perturbations of the medium- to long-term clock stability, due to variations in the laser-intensity,
laser frequency, the microwave power shift, and the shifts due to temperature variations are
measured and analyzed. A method for reducing the intensity light-shift by detuning the laser
frequency and the resulting improvement in clock stability is demonstrated. This work is of
relevance for further improvements on Rb cell standards using anti-relaxation wall-coating
technology. VC 2012 American Institute of Physics. [http://dx.doi.org/10.1063/1.4729570]
I. INTRODUCTION
Compact atomic frequency standards exploit a ground-
state microwave transition (e.g., in Rb) to provide the stable
atomic frequency reference to which the frequency of a
quartz oscillator is stabilized. At the heart of a conventional
rubidium atomic frequency standard, for example, the ones
used in global positioning system (GPS),1 atomic rubidium
contained in glass-cells also filled with buffer gases is used.
Buffer gases help to prevent the polarized Rb atoms from
colliding on to the cell walls and to obtain narrow resonance
lines by reducing the mean free path of a Rb atom to less
than the microwave photon’s wavelength of few cm (Dicke
narrowing2,3). Such narrow linewidths and a high resonance
amplitude are essential for a good short-term stability of the
clock. Alternative to the above approach, an evacuated glass
cell whose inner walls are coated with an anti-relaxation ma-
terial and filled with Rb vapor could be adopted as a new
heart4–6 for the clocks. The first studies on collisions
between alkali atoms and coatings, such as paraffins
(CnH2nþ2) or silanes (e.g., dimethyldichlorosilane) were
done by Bouchiat and Brossel during 1960s7 by adopting
Franzen’s method of relaxation in the dark.8 They used a
paraffin coated cell and found that the alkali atoms undergo
about 104 collisions before they lose their state of polariza-
tion. Franzen’s technique of relaxation in the dark was used
by Liberman et al. for studying the relaxation of caesium
atoms in paraffin wall-coated cells,9 whereas a variant of this
technique was adopted by Graf et al.10 in their studies.
Although the idea to use wall-coated cells in an atomic fre-
quency standard was suggested by Robinson et al.4 in the
late 1950s, it was not realized due to the limitations in oper-
ating temperatures of such cells (incompatible with the use
of lamps for optical pumping) and other technological diffi-
culties, such as control of the coating quality. Part of these
drawbacks has been overcome with laser optical pumping;
however, a reliable commercial product is yet to be realized.
Recently, the interest in wall-coated cells for high-precision
spectroscopy and metrology is growing again, because
coated cells represent good candidates to realize high-
performance or micro-fabricated devices, such as miniatur-
ized atomic clocks and/or atomic magnetometers.11,12
The double-resonance (DR) spectroscopy requires two
electro-magnetic fields: an optical field to polarize the atoms
by optical pumping, and a microwave field to drive the
ground-state hyperfine clock transition that serves as an atomic
frequency reference.1 A polarized atom in an uncoated, evac-
uated glass-cell without buffer-gas can depolarize by only one
collision on the wall and hence the achievable DR-linewidth is
several tens of kHz for a cm-scale cell, which corresponds to a
clock short-term stability of approximately 1� 10�9 at 1 s.
This assumes that the DR signal is not further degraded due to
time-of-flight (TOF) effect (broadening due to the limited
interaction time of an atom in the laser beam path). In contrast,
a cell whose inner walls are coated with a high-quality anti-
relaxation material preserves the polarized state of an alkali
atom for more than a few hundred to few thousand collisions,
depending on the size of the cell. The long-lived atomic polar-
ization in turn increases the Q-factor of the atomic resonance
line and thereby contributes to improve the short-term stability
of the clock. Typical spin-relaxation times in wall-coated cells
can be as large as �1 s, and narrow line-widths of the clock
transition around 200 Hz or even as low as 10 Hz were
observed.5 In contrast to the above mentioned work on alkanes
(conventional paraffins), the recent work of Balabas et al.13
shows that it is possible for the atomic polarization life-times
to exceed 1 min, with atoms undergoing up to 106 collisions
with an alkene-based coating. Basic studies on the application
of wall-coated cells for Rb frequency standards are reported in
Refs. 14–18.
Here, we present our studies on a laser-pumped, micro-
wave-optical double-resonance rubidium standard using
atomic 87Rb in a paraffin-coated cell. The cell used here has
smaller dimensions than the previously studied ones,5,15 in
view of a compact, high-performance Rb standard. In Sec. II,
the wall-coated cell is characterized by measuring the Rb
ground-state relaxation times. The clock experimental setup is
explained in Sec. III, along with the DR signal properties. Ina)[email protected].
0021-8979/2012/111(12)/124906/8/$30.00 VC 2012 American Institute of Physics111, 124906-1
JOURNAL OF APPLIED PHYSICS 111, 124906 (2012)
Sec. IV, we report the systematic shifts, D�, of the 87Rb
52S1=2jFg ¼ 1; mF ¼ 0i ! jFg ¼ 2; mF ¼ 0i clock transi-tion, from the unperturbed hyperfine ground-state frequency
of �Rb ¼ 6834682610:90429ð9Þ Hz,19 such as intensity and
frequency light shifts,20,21 microwave power shift22,23 and
temperature shifts.24 The influence of these parameters on the
clock frequency instability is also evaluated. In Sec. V, the
clock stability (Allan deviation) is measured and compared to
the short-term stability analysis. Finally, the limitations on the
clock stability on medium to long-term time-scales are identi-
fied and discussed in view of required future improvements.
II. CHARACTERIZATION OF THE WALL-COATING
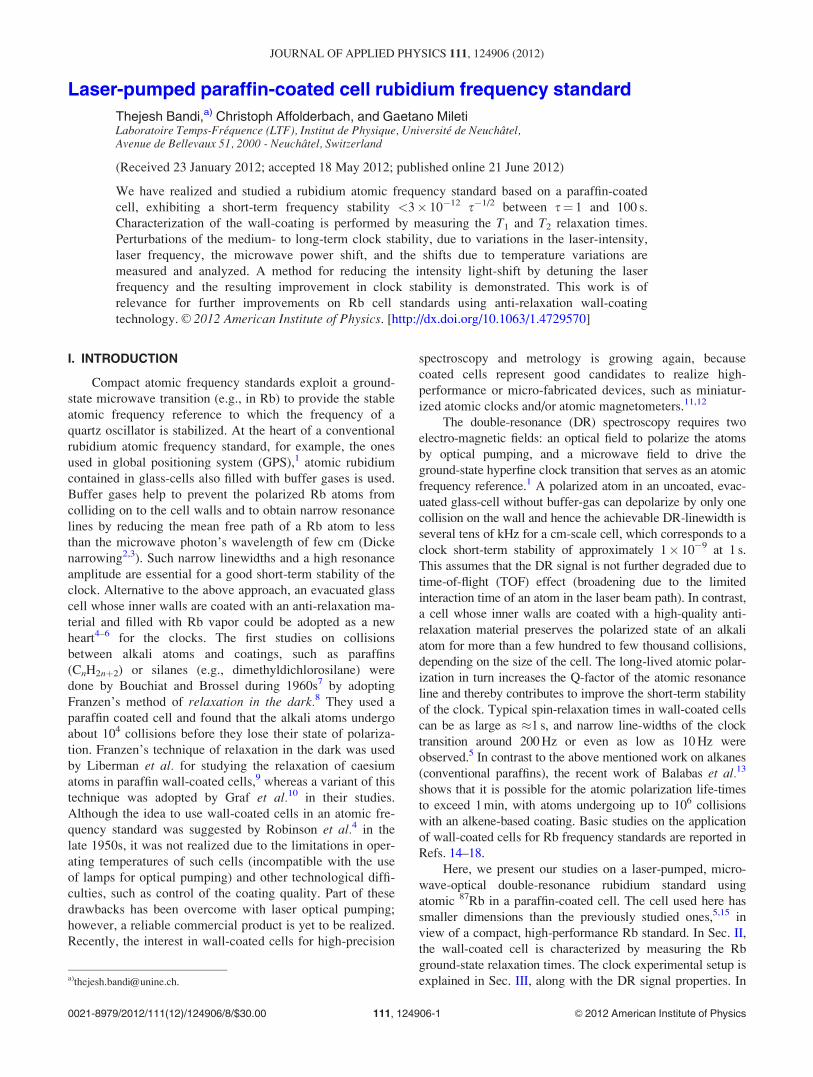
A paraffin-coated (C40H82) cell shown in Fig. 1(a) with
an inner volume of �1.4 cm3 was used in our measurements.
The cell has two distinctive regions; a cell-volume, which
holds the vapor of interrogated Rb atoms, and the cell-stem
that acts as a reservoir for metallic Rb.
A laser source emitting at the Rb D2-line (780 nm) opti-
cally pumps the atoms from the 87Rb, Fg¼ 2 hyperfine state
as shown in Fig. 1(b) (using a linear light polarization). The
excited state (Fe) manifold is not resolved due to Doppler
broadening; however, the strongest contribution to the pump-
ing process mainly comes via the Fe¼ 2 state. The laser
beam passes through an acousto optical modulator (AOM),
which was used as an optical switch as shown in Fig. 1(c).
The optical pumping time and also the dark time were varied
using the on and off time durations of the AOM rf-drive.
During the dark time, sd, the atoms undergo relaxation
mainly because of random electronic depolarization by colli-
sions with the walls,25 and also due to reservoir effect.26
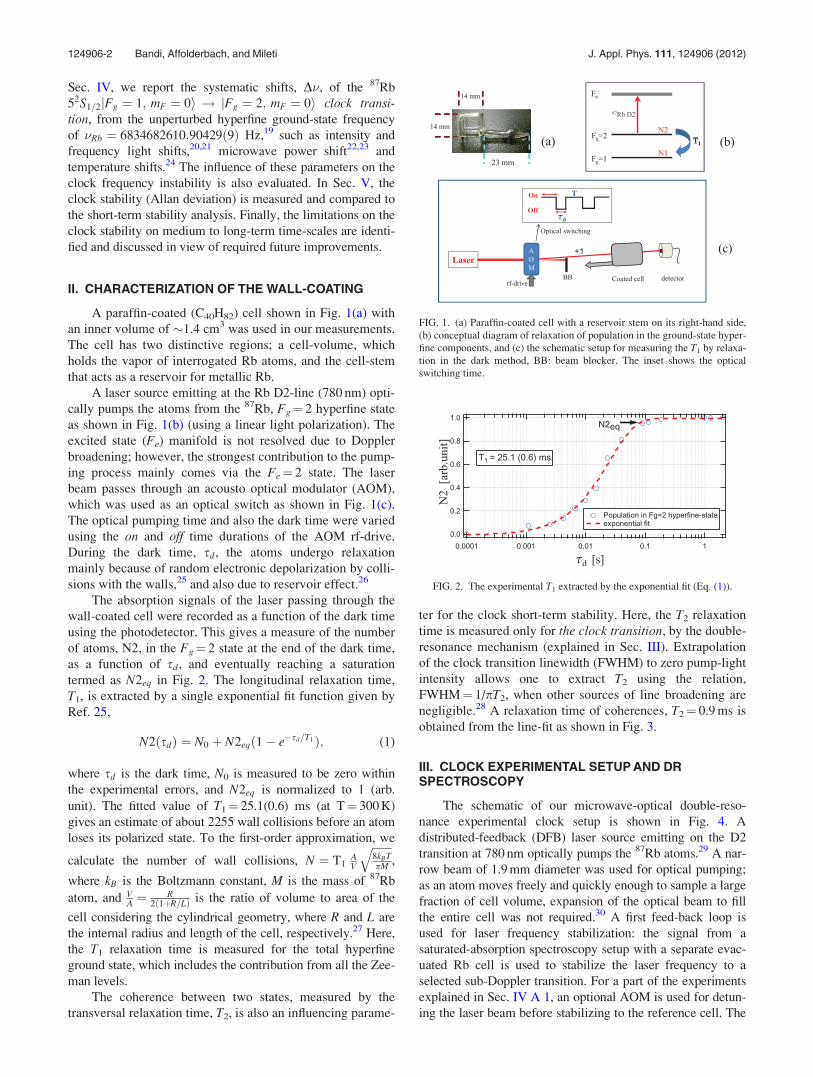
The absorption signals of the laser passing through the
wall-coated cell were recorded as a function of the dark time
using the photodetector. This gives a measure of the number
of atoms, N2, in the Fg¼ 2 state at the end of the dark time,
as a function of sd , and eventually reaching a saturation
termed as N2eq in Fig. 2. The longitudinal relaxation time,
T1, is extracted by a single exponential fit function given by
Ref. 25,
N2ðsdÞ ¼ N0 þ N2eqð1� e�sd=T1Þ; (1)
where sd is the dark time, N0 is measured to be zero within
the experimental errors, and N2eq is normalized to 1 (arb.
unit). The fitted value of T1¼ 25.1(0.6) ms (at T¼ 300 K)
gives an estimate of about 2255 wall collisions before an atom
loses its polarized state. To the first-order approximation, we
calculate the number of wall collisions, N ¼ T1AV
ffiffiffiffiffiffiffi8kBTpM
q,
where kB is the Boltzmann constant, M is the mass of 87Rb
atom, and VA ¼ R
2ð1þR=LÞ is the ratio of volume to area of the
cell considering the cylindrical geometry, where R and L are
the internal radius and length of the cell, respectively.27 Here,
the T1 relaxation time is measured for the total hyperfine
ground state, which includes the contribution from all the Zee-
man levels.
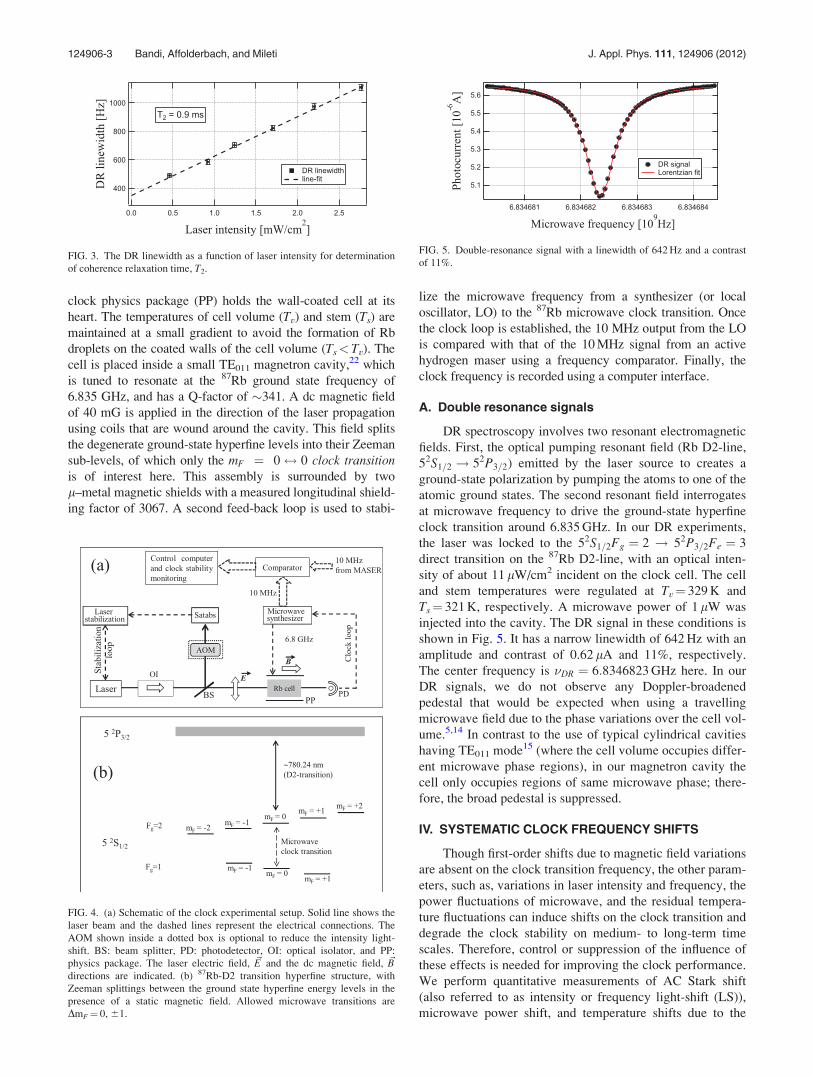
The coherence between two states, measured by the
transversal relaxation time, T2, is also an influencing parame-
ter for the clock short-term stability. Here, the T2 relaxation
time is measured only for the clock transition, by the double-
resonance mechanism (explained in Sec. III). Extrapolation
of the clock transition linewidth (FWHM) to zero pump-light
intensity allows one to extract T2 using the relation,
FWHM¼ 1/pT2, when other sources of line broadening are
negligible.28 A relaxation time of coherences, T2¼ 0.9 ms is
obtained from the line-fit as shown in Fig. 3.
III. CLOCK EXPERIMENTAL SETUP AND DRSPECTROSCOPY
The schematic of our microwave-optical double-reso-
nance experimental clock setup is shown in Fig. 4. A
distributed-feedback (DFB) laser source emitting on the D2
transition at 780 nm optically pumps the 87Rb atoms.29 A nar-
row beam of 1.9 mm diameter was used for optical pumping;
as an atom moves freely and quickly enough to sample a large
fraction of cell volume, expansion of the optical beam to fill
the entire cell was not required.30 A first feed-back loop is
used for laser frequency stabilization: the signal from a
saturated-absorption spectroscopy setup with a separate evac-
uated Rb cell is used to stabilize the laser frequency to a
selected sub-Doppler transition. For a part of the experiments
explained in Sec. IV A 1, an optional AOM is used for detun-
ing the laser beam before stabilizing to the reference cell. The
FIG. 1. (a) Paraffin-coated cell with a reservoir stem on its right-hand side,
(b) conceptual diagram of relaxation of population in the ground-state hyper-
fine components, and (c) the schematic setup for measuring the T1 by relaxa-
tion in the dark method, BB: beam blocker. The inset shows the optical
switching time.
FIG. 2. The experimental T1 extracted by the exponential fit (Eq. (1)).
124906-2 Bandi, Affolderbach, and Mileti J. Appl. Phys. 111, 124906 (2012)
clock physics package (PP) holds the wall-coated cell at its
heart. The temperatures of cell volume (Tv) and stem (Ts) are
maintained at a small gradient to avoid the formation of Rb
droplets on the coated walls of the cell volume (Ts< Tv). The
cell is placed inside a small TE011 magnetron cavity,22 which
is tuned to resonate at the 87Rb ground state frequency of
6.835 GHz, and has a Q-factor of �341. A dc magnetic field
of 40 mG is applied in the direction of the laser propagation
using coils that are wound around the cavity. This field splits
the degenerate ground-state hyperfine levels into their Zeeman
sub-levels, of which only the mF ¼ 0$ 0 clock transitionis of interest here. This assembly is surrounded by two
l–metal magnetic shields with a measured longitudinal shield-
ing factor of 3067. A second feed-back loop is used to stabi-
lize the microwave frequency from a synthesizer (or local
oscillator, LO) to the 87Rb microwave clock transition. Once
the clock loop is established, the 10 MHz output from the LO
is compared with that of the 10 MHz signal from an active
hydrogen maser using a frequency comparator. Finally, the
clock frequency is recorded using a computer interface.
A. Double resonance signals
DR spectroscopy involves two resonant electromagnetic
fields. First, the optical pumping resonant field (Rb D2-line,
52S1=2 ! 52P3=2) emitted by the laser source to creates a
ground-state polarization by pumping the atoms to one of the
atomic ground states. The second resonant field interrogates
at microwave frequency to drive the ground-state hyperfine
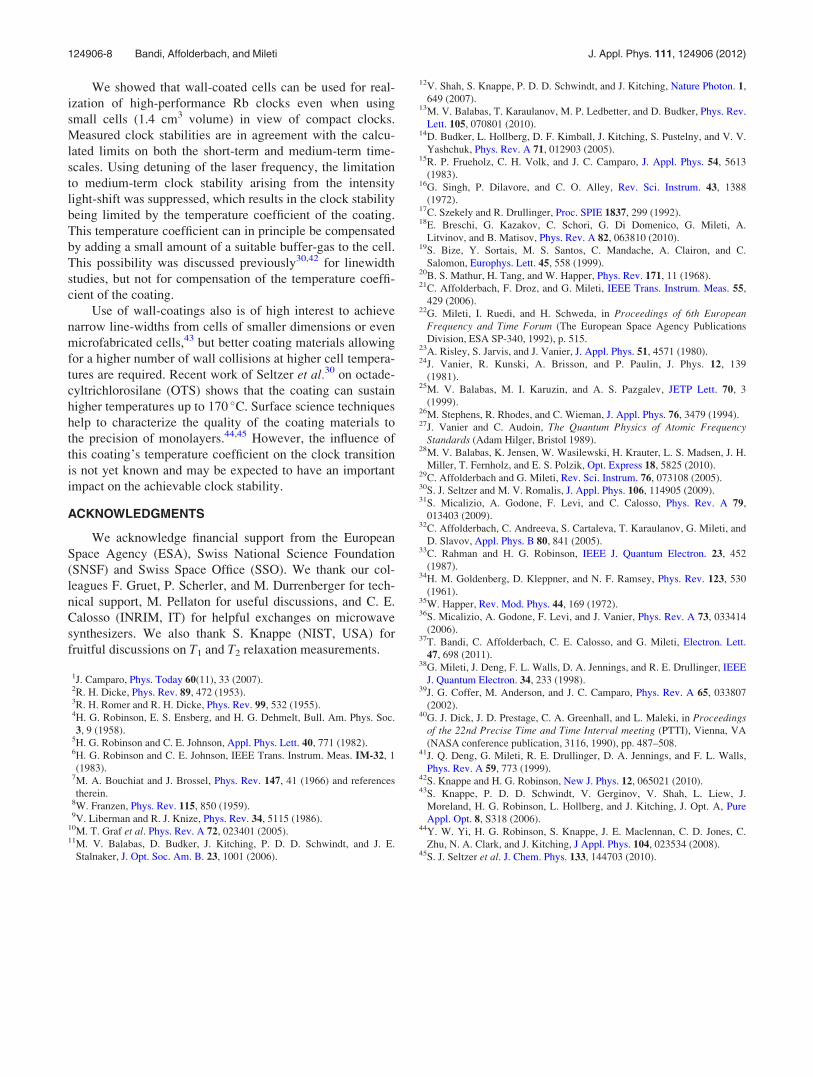
clock transition around 6.835 GHz. In our DR experiments,
the laser was locked to the 52S1=2Fg ¼ 2 ! 52P3=2Fe ¼ 3
direct transition on the 87Rb D2-line, with an optical inten-
sity of about 11 lW/cm2 incident on the clock cell. The cell
and stem temperatures were regulated at Tv¼ 329 K and
Ts¼ 321 K, respectively. A microwave power of 1 lW was
injected into the cavity. The DR signal in these conditions is
shown in Fig. 5. It has a narrow linewidth of 642 Hz with an
amplitude and contrast of 0.62 lA and 11%, respectively.
The center frequency is �DR ¼ 6:8346823 GHz here. In our
DR signals, we do not observe any Doppler-broadened
pedestal that would be expected when using a travelling
microwave field due to the phase variations over the cell vol-
ume.5,14 In contrast to the use of typical cylindrical cavities
having TE011 mode15 (where the cell volume occupies differ-
ent microwave phase regions), in our magnetron cavity the
cell only occupies regions of same microwave phase; there-
fore, the broad pedestal is suppressed.
IV. SYSTEMATIC CLOCK FREQUENCY SHIFTS
Though first-order shifts due to magnetic field variations
are absent on the clock transition frequency, the other param-
eters, such as, variations in laser intensity and frequency, the
power fluctuations of microwave, and the residual tempera-
ture fluctuations can induce shifts on the clock transition and
degrade the clock stability on medium- to long-term time
scales. Therefore, control or suppression of the influence of
these effects is needed for improving the clock performance.
We perform quantitative measurements of AC Stark shift
(also referred to as intensity or frequency light-shift (LS)),
microwave power shift, and temperature shifts due to the
FIG. 3. The DR linewidth as a function of laser intensity for determination
of coherence relaxation time, T2.
FIG. 4. (a) Schematic of the clock experimental setup. Solid line shows the
laser beam and the dashed lines represent the electrical connections. The
AOM shown inside a dotted box is optional to reduce the intensity light-
shift. BS: beam splitter, PD: photodetector, OI: optical isolator, and PP:
physics package. The laser electric field, ~E and the dc magnetic field, ~Bdirections are indicated. (b) 87Rb-D2 transition hyperfine structure, with
Zeeman splittings between the ground state hyperfine energy levels in the
presence of a static magnetic field. Allowed microwave transitions are
DmF¼ 0, 61.
FIG. 5. Double-resonance signal with a linewidth of 642 Hz and a contrast
of 11%.
124906-3 Bandi, Affolderbach, and Mileti J. Appl. Phys. 111, 124906 (2012)

cell’s volume and stem. The influence of these perturbations
on the clock instability is evaluated.
A. Light-shift (AC Stark shift)
The LS20 of an electromagnetic field on the clock transi-
tion is usually encountered in Rb clocks when in continuous
wave (CW) operation. This occurs by the light field initiating
virtual transitions in the atoms, and in this sense is funda-
mentally related to the Lamb shift, which arises due to
atom’s interaction with the vacuum field.1 The LS, D�LS, can
be written as,21
D�LS /ILð�L � �optÞð�L � �optÞ2 þ C2
; (2)
where �L is the laser frequency, C is the width of the approx-
imately Lorentzian optical absorption centered at the optical
atomic transition frequency �opt, and IL is the intensity of the
light.
1. Intensity light shift (a) and its reduction by laserdetuning method
From Eq. (2), the intensity LS coefficient, a, can be
derived as a ¼ d�LS
dILat a fixed laser frequency. Experimentally,
we determine a by measuring the clock frequency as a function
of laser intensity, for the laser frequency stabilized to three dif-
ferent sub-Doppler transitions on the 87Rb D2-line pumped
from Fg¼ 2 to excited states in 5P3/2 (Ref. 19) as shown in
Fig. 6(a). The fitted slopes give the intensity LS coefficients afor the particular laser frequency. The lowest value, obtained
for Fg¼ 2 ! Fe¼ 3 direct transition, is a¼þ23(3) mHz
cm2/lW. Extrapolation to zero laser intensity gives the value
of the clock frequency shift, D� ¼ �DR � �Rb, corrected for LS
effects, and which is mainly determined by the wall-coating
(see Sec. IV C), in this case, it is D� ¼ �370ð4Þ Hz. This wall
shift depends on the cell temperature, and can vary for different
coating material. Also, this shift can change over time depend-
ing on the modifications in the coating material.
The dependence of the intensity LS coefficient, a, on the
laser frequency is shown in Fig. 6(b). One can reduce the
effect of intensity LS by detuning the laser frequency, �L
closer to �opt, where a is small.21 In our experiment, we
adopt an AOM for detuning the laser frequency by �131
MHz before stabilizing the frequency-shifted beam to the
Fg¼ 2! Fe¼ 1,3 cross-over resonance. Using the unshifted
laser frequency for the clock (i.e., detuned by þ131 MHz
with respect to Fg¼ 2 ! Fe¼ 1,3 cross-over), a reduced
coefficient aredu¼�0.57(4) mHz cm2/lW was measured,
which is a reduction in a by a factor of 40.
a. Influence on clock instability. Though the intensity
LS influences the clock instability at all integration times,
main limitations result on the medium- to long-term time
scales. Hence, we estimate the LS contribution to clock insta-
bility at l04 s. When the laser frequency is stabilized to the
Fg¼ 2! Fe¼ 3 direct transition, the intensity LS is measured
to be jaj ¼ 23ð3Þ mHz cm2=lW (cf. Fig. 6(a)). The intensity
LS contribution on the clock frequency can be estimated by,
ra ¼jaj:rIL
:IL
�Rb; (3)
where the relative stability of the laser intensity in terms
of Allan standard deviation at 104 s is measured to be
rIL¼ 5� 10�3. At the operating laser intensity, IL¼ 1059
lW/cm2 (chosen for optimized short-term clock stability, see
Sec. V), the contribution to the clock instability, ra is estimated
as 1.8� 10�11 at 104 s. Using the AOM for reduction of the in-
tensity LS results in a stability limit of 4.5� 10�13.
2. Frequency light-shift (b) and dependence on laserintensity
From Eq. (2), when the intensity of the light is kept con-
stant, the frequency LS coefficient is written as b ¼ d�LS
d�L. Fre-
quency LS can be nullified, e.g., in pulsed mode.31 In the
continuous-wave operation discussed here, this is not possi-
ble, but we can reduce b by operating at low light inten-
sities.32 At different fixed light intensities, the value of b is
evaluated as the slope of the line-fits shown in Fig. 7(a). The
zoom-inset at the zero laser detuning frequency shows the
measure of the clock frequency shift, D���372 6 4 Hz,
when unperturbed by LS. Dependence of the frequency LS
coefficient b as a function of pump-light intensity is shown
in Fig. 7(b) and is linear in IL, as expected from Eq. (2).
a. Influence on clock instability. We estimate the influ-
ence of the frequency LS on the clock’s instability at 104 s.
FIG. 6. (a) 87Rb frequency shift as a function of the interrogating laser
intensity. Slopes give the intensity LS coefficient, a, (b) dependence of a on
laser frequency detuning is shown with reference to the locked transitions
using an evacuated Rb cell. The labeling of the 87Rb transitions correspond
as follows; 2-3: Fg¼ 2 ! Fe¼ 3, CO22-23: Fg¼ 2 ! Fe¼ 2,3 cross-over,
and CO22-13: Fg¼ 2! Fe¼ 1,3 cross-over.
124906-4 Bandi, Affolderbach, and Mileti J. Appl. Phys. 111, 124906 (2012)

At a light intensity of 1059 lW/cm2, the value of
b¼ 413.8(4) mHz/MHz. The stability of the laser frequency,
rLF, at 104 s measured by beat note method29 is <5� 10�12
and �L ¼ 384:23 THz. Similar to Eq. (3), we find a contribu-
tion of frequency LS to the clock instability as rb ¼1:2 � 10�13 at 104 s (also see Table I).
B. Microwave power shift and influence on clockinstability
The microwave power shift of the clock frequency was
measured as a function of microwave power (see Fig. 8),
with the laser stabilized to Fg¼ 2 ! Fe¼ 3 direct transi-
tion. A linear-fit gives a shift rate or power-shift coefficient,
dl ¼ 3:4ð2ÞHz=dBm (’ 7:8ð4Þ Hz=lW at Pl ¼ 1 lW).
This shift is not negligible, thus requiring a good power sta-
bility of the microwave synthesizer. The power stability of
our synthesizer is measured to be rp ¼ 1� 10�4 at 104 s.
With an input power of Pl¼ 1 lW, the instability contribu-
tion on the clock at 104 s is estimated to be rl¼ 1.1� 10�13
(see also Table I). We note that the work of Risely et al.23
shows that the use of wall-coated cells reduces the micro-
wave power shift to �0.2 Hz/dBm, which is not observed
here.
C. Temperature coefficients
The temperature coefficient (TC) of a wall-coated cell is
an intrinsic property of the coating material,24 where the var-
iations in temperature determine the interaction of atoms with
the wall-coating and its impact on their polarization state. The
TC experiments were performed below the paraffin melting
point (�353 K).33 Dependence of the clock frequency shift
on Tv is shown in Fig. 9(a), its linear-fit slope gives the
cell-volume temperature coefficient, TCv¼þ1.39(5)
Hz/K� 2� 10�10/K. This behavior is related to the adsorp-
tion process of the alkali atoms on the coated walls. Assuming
a uniform (or average) adsorption energy, Ea, in the overall
cell volume, the adsorption time, sa, of an atom on the walls
can be calculated by a simple formula,14,26,33,34
sa ¼ s0:eEa
kBT; (4)
where s0 is the period of vibration of the adsorbed atom in
the wall potential, kB is the Boltzmann constant, and T is the
absolute temperature. If the temperature increases, Rb atoms
spend less time on the wall, which results in a smaller fre-
quency shift and broadening, and vice versa. The wall-shift,
D�, of the clock frequency due to the coating, associated
with the temperature and geometry of the cell can be written
according to Rahman and Robinson33 as,
D� ¼ ðD�aÞsa
sc; (5)
TABLE I. Summary of instability contributions of physical perturbations on the clock transition in medium to long-term time scales.
Physical effect Coefficient Parameter variation at 104 s Clock instability at 104 s
Intensity light-shift, jaj 23(3) mHz cm2/lW 5.3 lW/cm2 1.8� 10�11
Reduced intensity LS, jareduj 0.57(4) mHz cm2/lW 5.3 lW/cm2 4.5� 10�13
Frequency light-shift, jbj 413.8(4) mHz/MHz <1.93 kHz 1.2� 10�13
Cell volume TC 1.39(5) Hz/K 10 mK 2� 10�12
Stem TC 0.22(3) Hz/K 10 mK 3.2� 10�13
Microwave PS 7.8(4) Hz/lW 1� 10�4 lW 1.1� 10�13
FIG. 7. (a) Clock frequency shifts as a function of the laser frequency detun-
ing; the slopes give the frequency LS, b, and (b) the dependence of b on
laser intensity, IL.
FIG. 8. Frequency shift as a function of microwave power.
124906-5 Bandi, Affolderbach, and Mileti J. Appl. Phys. 111, 124906 (2012)

where D�a is the difference between the resonant hyperfine
frequency while the Rb is absorbed on the surface and that in
free space, and sc is the correlation time for atom-wall colli-
sions. Considering a spherical geometry, sc depends on the
cell radius, R, and the mean velocity, hvi, of the Rb atoms
inside the cell and can be written as sc ¼ 4R=3 hvi. Hence,
from Eqs. (4) and (5), the fractional change in frequency
shift due to a fractional change in adsorption time by the
influence of the temperature can be written as,14
dD�D�¼ � Ea
kB:T
dT
T: (6)
The temperature coefficient of the cell volume, TCv
¼ dD�/dT (slope in Fig. 9(a)), thus allows to extract the aver-
age adsorption energy of Rb on the coating as,
Ea¼ 0.036 eV. This value is in close agreement with previ-
ously reported studies.14,33 Part of TCv might be due to the
spin-exchange effect, but as there are no Rb droplets acting
as reservoir in the cell volume, one can neglect the influence
of this effect. On the other hand, the effect of spin-exchange
due to the stem is 10-times smaller in comparison with TCv
(see below).
A similar shift of the clock frequency due to the stem
temperature is measured to be TCs¼ 0.22(3) Hz/K �3:2� 10�11=K as shown in Fig. 9(b). Because the cell stem
contains the reservoir of liquid Rb, we mainly attribute this
shift to the influence of the atomic density and the related
spin-exchange effect, see Refs. 14, 35, 36, and references
therein. The shift on the clock frequency due to spin-exchange
can be calculated according to Micalizio et al.36 by,
D�se ¼ �1
4n�vkseD; (7)
where n is the atomic density, �v ¼ffiffiffiffiffiffiffiffiffiffiffiffiffiffiffiffiffiffi8kBT=pl
pis the average
relative velocity of the colliding atoms at temperature T,
with kB the Boltzmann constant and l the reduced mass of
the colliding particles. kse is the frequency-shift related colli-
sional cross-section, and D is the population difference
between the two hyperfine clock levels. The value and sign
of D�se thus depends on the optical pumping condition in
which the atomic sample is prepared for clock operation.
1. Influence on clock instability
From measured variations in the cell’s temperature
(rT¼ 10 mK at 104 s), the clock instability due to the tempera-
ture coefficient of the cell-volume is estimated as
rvolumeTC ¼ 2� 10�12, and the contribution on the clock fre-
quency instability due to stem temperature coefficient is
rstemTC ¼ 3:2� 10�13. The limit due to the TC of the cell-
volume is thus the dominating one for the clock instability,
with the stem’s TC being one order of magnitude smaller. The
influences of physical parameters on the clock instability in
medium to long-term time scales are summarized in Table I.
V. CLOCK STABILITY
A. Short-term noise budget
The short-term stability (1 to 100 s) of a passive rubid-
ium frequency standard can be predicted37 by,
ry ¼Npsdffiffiffi
2p
:D:�Rb
:s�1=2; (8)
where Npsd is the detection noise power-spectral-density
when microwave and pump laser are switched on (in closed
clock loop). D is the discriminator slope in the error signal
close to the line centre, and can be approximated as the ratio
of the signal amplitude to the linewidth of DR signal.
The typical measured parameters, estimated signal-to-
noise (S/N) limit and shot-noise limit are presented in Table
II. Measured noise density, Npsd includes the contribution of
PM-to-AM (phase modulation to amplitude modulation)
noise conversion in the clock cell.38,39 Using Eq. (8), the S/N
limited short-term stability is calculated as 1.3� 10�12 s�1/2.
FIG. 9. (a) Clock frequency shift from �Rb as a function of cell volume tem-
perature, Tv, when Ts is kept constant at 313 K. The closed triangles depict
the measured data and the dashed line shows the fit to the data with a cell
volume temperature coefficient of TCv¼þ1.39(5) Hz/K, and (b) clock fre-
quency shift from unperturbed level as a function of stem temperature, Ts,
when Tv is kept constant at 329 K. Closed diamonds show the experimental
data and the dashed line is a linear fit, with a stem temperature coefficient of
TCs¼þ0.22(3) Hz/K. The laser intensity and microwave power were kept
constant during both the measurements of the temperature coefficients.
TABLE II. Noise budget and estimation of signal-to-noise and shot-noise
limits.
Parameter Value
FWHM 642 Hz
Contrast 11.3%
Discriminator, D 0.41 nA/Hz
Npsd 5:1 pA=ffiffiffiffiffiffiHzp
S/N limit 1:3� 10�12s�1=2
Shot-noise limit 3:3� 10�13s�1=2
124906-6 Bandi, Affolderbach, and Mileti J. Appl. Phys. 111, 124906 (2012)

The shot-noise limit of the clock occurring due to the statisti-
cal nature of the photons is calculated using the noise spec-
tral density, Nshot ¼ffiffiffiffiffiffiffiffiffiffiffiffiffi2:e:Idc
p, where e is the charge of an
electron and Idc is the photocurrent of the DR signal at
FWHM.
An additional limit occurs from the LO phase-noise due
to the intermodulation effects.40 A phase-noise measurement
of the LO was performed by comparing it with another
microwave synthesizer at 6.835 GHz carrier frequency. A
flicker level of �77 dBrad2/Hz (at 10 Hz Fourier frequency)
and a noise floor of �102 dBrad2/Hz were measured. The
phase-noise limited short-term stability, ryðsÞPMnoise in a
quasi-static model for the square wave modulation with fre-
quency fm can be written in terms of spectral density,41
S/ðfmÞ as
ryðsÞPMnoise ¼ffiffiffiffiffiffiffiffiffiffiffiffiffiffiffiffiffiffiffiffiffiffiffiffiffiffiffiffiffiffiffiffiffiffiX1n¼1
C22n:S/ð2nfmÞ
s:s�1=2; (9)
where
C2n ¼2n
ð2n� 1Þð2nþ 1Þfm
�Rb: (10)
By using the clock loop modulation frequency, fm¼ 193 Hz,
and considering its even harmonics up to 100 kHz, we esti-
mate the LO phase-noise contribution on clock’s short-term
stability, ryðsÞPMnoise¼ 6� 10�13 s�1/2.
The intensity and frequency light-shifts also influence
the short-term stability of the clock, via the laser’s relative
intensity noise (RIN) and laser frequency instability, which
perturb the clock transition on short-time scales. Table III
summarizes these effects and resulting limits on the short-
term clock stability.
Eventually, the overall short-term clock stability can be
estimated from the sum of the squares of the individual lim-
its by the following equation as 1.5� 10�12s�1/2:
ryðsÞ ¼ffiffiffiffiffiffiffiffiffiffiffiffiffiffiffiffiffiffiffiffiffiffiffiffiffiffiffiffiffiffiffiffiffiffiffiffiffiffiffiffiffiffir2
S=N þ r2PMnoise þ r2
LS
q: (11)
The experimentally measured short-term stability of the DR
clock using the paraffin-coated cell is shown in Fig. 10. The
measured short-term stability of 2.75� 10�12s�1/2 is in
reasonable agreement with the estimated stability of
’1.5� 10�12s�1/2. The clock run without laser detuning
(closed circles) shows its medium-to long-term stability lim-
ited at 1.8� 10�11 due to intensity light-shift as predicted
(see Table I). In the second run (open circles), the reduction
of the intensity light-shift by a factor of 40 was implemented
using the AOM. Here, the clock stability is limited to around
2� 10�12 at 104 s by the temperature coefficient of the coat-
ing material. This limitation is an intrinsic property of the
coating material and hence gives the ultimate limit for this
particular clock, unless improvements on the temperature
control of the cell are implemented. A linear drift of
8.5� 10�12/day was measured, including also the ageing of
the coating material. Presently, we have not studied further
this drift.
VI. CONCLUSIONS AND PROSPECTS
Investigations on the paraffin coating material character-
istics were performed by measuring the T1 and T2 relaxation
times for a wall-coated Rb cell, and show that a polarized Rb
atom undergoes about 2255 wall collisions (at 300 K) before
losing its polarized state. The optical-microwave double-reso-
nance spectroscopic studies with a paraffin coated cell inside a
TE011 magnetron cavity showed a narrow linewidth of
<650 Hz with a large signal contrast >11%. Systematic stud-
ies of the parameters that influence the medium to long-term
stability—notably by the perturbations due to intensity and
frequency light-shifts, microwave power shift and shifts on
clock transition due to temperature variations that occurs due
to the atom-wall interactions—were quantified and their insta-
bility contributions on the clock were estimated.
TABLE III. Intensity and frequency light-shift contribution to the clock’s short-term instability.
Physical effect Coefficient Parameter variation at 104 s Formula Instability (s�1/2)
Intensity
Light shift, jaj 23(3) mHz cm2/lW
Laser RIN:
2� 10�14 Hz�1 at 300 Hz
ffiffiffiffiffiffiffiffiffiRINp
:IL:a�Rb
1.2� 10�15
Frequency
Light shift, jbj 413.8(4) mHz/MHz
Laser frequency instability:
rLF¼ 4� 10�12 (1� 100 s)b:rLF:�L
�Rb9.3� 10�14
Total LS contribution rLS 9.4� 10�14
FIG. 10. Measured clock stability using the wall-coated Rb cell. Closed
circles show clock stability data without intensity LS compensation; open
circles denote the clock stability with intensity LS compensation by the
detuning method. The dotted line represents the measured clock short-term
stability of 2.75� 10�12s�1/2, the solid line indicates the estimated total
limit (Eq. (11)), and dashed-dotted line shows the shot-noise limit of
3.3� 10�13s�1/2.
124906-7 Bandi, Affolderbach, and Mileti J. Appl. Phys. 111, 124906 (2012)
We showed that wall-coated cells can be used for real-
ization of high-performance Rb clocks even when using
small cells (1.4 cm3 volume) in view of compact clocks.
Measured clock stabilities are in agreement with the calcu-
lated limits on both the short-term and medium-term time-
scales. Using detuning of the laser frequency, the limitation
to medium-term clock stability arising from the intensity
light-shift was suppressed, which results in the clock stability
being limited by the temperature coefficient of the coating.
This temperature coefficient can in principle be compensated
by adding a small amount of a suitable buffer-gas to the cell.
This possibility was discussed previously30,42 for linewidth
studies, but not for compensation of the temperature coeffi-
cient of the coating.
Use of wall-coatings also is of high interest to achieve
narrow line-widths from cells of smaller dimensions or even
microfabricated cells,43 but better coating materials allowing
for a higher number of wall collisions at higher cell tempera-
tures are required. Recent work of Seltzer et al.30 on octade-
cyltrichlorosilane (OTS) shows that the coating can sustain
higher temperatures up to 170 �C. Surface science techniques
help to characterize the quality of the coating materials to
the precision of monolayers.44,45 However, the influence of
this coating’s temperature coefficient on the clock transition
is not yet known and may be expected to have an important
impact on the achievable clock stability.
ACKNOWLEDGMENTS
We acknowledge financial support from the European
Space Agency (ESA), Swiss National Science Foundation
(SNSF) and Swiss Space Office (SSO). We thank our col-
leagues F. Gruet, P. Scherler, and M. Durrenberger for tech-
nical support, M. Pellaton for useful discussions, and C. E.
Calosso (INRIM, IT) for helpful exchanges on microwave
synthesizers. We also thank S. Knappe (NIST, USA) for
fruitful discussions on T1 and T2 relaxation measurements.
1J. Camparo, Phys. Today 60(11), 33 (2007).2R. H. Dicke, Phys. Rev. 89, 472 (1953).3R. H. Romer and R. H. Dicke, Phys. Rev. 99, 532 (1955).4H. G. Robinson, E. S. Ensberg, and H. G. Dehmelt, Bull. Am. Phys. Soc.
3, 9 (1958).5H. G. Robinson and C. E. Johnson, Appl. Phys. Lett. 40, 771 (1982).6H. G. Robinson and C. E. Johnson, IEEE Trans. Instrum. Meas. IM-32, 1
(1983).7M. A. Bouchiat and J. Brossel, Phys. Rev. 147, 41 (1966) and references
therein.8W. Franzen, Phys. Rev. 115, 850 (1959).9V. Liberman and R. J. Knize, Phys. Rev. 34, 5115 (1986).
10M. T. Graf et al. Phys. Rev. A 72, 023401 (2005).11M. V. Balabas, D. Budker, J. Kitching, P. D. D. Schwindt, and J. E.
Stalnaker, J. Opt. Soc. Am. B. 23, 1001 (2006).
12V. Shah, S. Knappe, P. D. D. Schwindt, and J. Kitching, Nature Photon. 1,
649 (2007).13M. V. Balabas, T. Karaulanov, M. P. Ledbetter, and D. Budker, Phys. Rev.
Lett. 105, 070801 (2010).14D. Budker, L. Hollberg, D. F. Kimball, J. Kitching, S. Pustelny, and V. V.
Yashchuk, Phys. Rev. A 71, 012903 (2005).15R. P. Frueholz, C. H. Volk, and J. C. Camparo, J. Appl. Phys. 54, 5613
(1983).16G. Singh, P. Dilavore, and C. O. Alley, Rev. Sci. Instrum. 43, 1388
(1972).17C. Szekely and R. Drullinger, Proc. SPIE 1837, 299 (1992).18E. Breschi, G. Kazakov, C. Schori, G. Di Domenico, G. Mileti, A.
Litvinov, and B. Matisov, Phys. Rev. A 82, 063810 (2010).19S. Bize, Y. Sortais, M. S. Santos, C. Mandache, A. Clairon, and C.
Salomon, Europhys. Lett. 45, 558 (1999).20B. S. Mathur, H. Tang, and W. Happer, Phys. Rev. 171, 11 (1968).21C. Affolderbach, F. Droz, and G. Mileti, IEEE Trans. Instrum. Meas. 55,
429 (2006).22G. Mileti, I. Ruedi, and H. Schweda, in Proceedings of 6th European
Frequency and Time Forum (The European Space Agency Publications
Division, ESA SP-340, 1992), p. 515.23A. Risley, S. Jarvis, and J. Vanier, J. Appl. Phys. 51, 4571 (1980).24J. Vanier, R. Kunski, A. Brisson, and P. Paulin, J. Phys. 12, 139
(1981).25M. V. Balabas, M. I. Karuzin, and A. S. Pazgalev, JETP Lett. 70, 3
(1999).26M. Stephens, R. Rhodes, and C. Wieman, J. Appl. Phys. 76, 3479 (1994).27J. Vanier and C. Audoin, The Quantum Physics of Atomic Frequency
Standards (Adam Hilger, Bristol 1989).28M. V. Balabas, K. Jensen, W. Wasilewski, H. Krauter, L. S. Madsen, J. H.
Miller, T. Fernholz, and E. S. Polzik, Opt. Express 18, 5825 (2010).29C. Affolderbach and G. Mileti, Rev. Sci. Instrum. 76, 073108 (2005).30S. J. Seltzer and M. V. Romalis, J. Appl. Phys. 106, 114905 (2009).31S. Micalizio, A. Godone, F. Levi, and C. Calosso, Phys. Rev. A 79,
013403 (2009).32C. Affolderbach, C. Andreeva, S. Cartaleva, T. Karaulanov, G. Mileti, and
D. Slavov, Appl. Phys. B 80, 841 (2005).33C. Rahman and H. G. Robinson, IEEE J. Quantum Electron. 23, 452
(1987).34H. M. Goldenberg, D. Kleppner, and N. F. Ramsey, Phys. Rev. 123, 530
(1961).35W. Happer, Rev. Mod. Phys. 44, 169 (1972).36S. Micalizio, A. Godone, F. Levi, and J. Vanier, Phys. Rev. A 73, 033414
(2006).37T. Bandi, C. Affolderbach, C. E. Calosso, and G. Mileti, Electron. Lett.
47, 698 (2011).38G. Mileti, J. Deng, F. L. Walls, D. A. Jennings, and R. E. Drullinger, IEEE
J. Quantum Electron. 34, 233 (1998).39J. G. Coffer, M. Anderson, and J. C. Camparo, Phys. Rev. A 65, 033807
(2002).40G. J. Dick, J. D. Prestage, C. A. Greenhall, and L. Maleki, in Proceedings
of the 22nd Precise Time and Time Interval meeting (PTTI), Vienna, VA
(NASA conference publication, 3116, 1990), pp. 487–508.41J. Q. Deng, G. Mileti, R. E. Drullinger, D. A. Jennings, and F. L. Walls,
Phys. Rev. A 59, 773 (1999).42S. Knappe and H. G. Robinson, New J. Phys. 12, 065021 (2010).43S. Knappe, P. D. D. Schwindt, V. Gerginov, V. Shah, L. Liew, J.
Moreland, H. G. Robinson, L. Hollberg, and J. Kitching, J. Opt. A, Pure
Appl. Opt. 8, S318 (2006).44Y. W. Yi, H. G. Robinson, S. Knappe, J. E. Maclennan, C. D. Jones, C.
Zhu, N. A. Clark, and J. Kitching, J Appl. Phys. 104, 023534 (2008).45S. J. Seltzer et al. J. Chem. Phys. 133, 144703 (2010).
124906-8 Bandi, Affolderbach, and Mileti J. Appl. Phys. 111, 124906 (2012)
Top Related
Copyright © 2022 FDOKUMEN

