


Bahasa
Halaman
Hukum

Kinetic modeling of n-butane dehydrogenation over CrOxVOx/MCM-41
catalyst in a fixed bed reactor.
1 ⃰ Babajide Patrick Ajayi, 2Basim Abussaud, 2 Rabindran Jermy,
2Sulaiman Al Khattaf
1Chemical Engineering Department, University of Louisville, Louisville KY 40292, USA
2Center for Refining & Petrochemicals, King Fahd University of Petroleum & Minerals,
Dhahran 31261, Saudi Arabia.
Abstract
The kinetics of n-butane dehydrogenation over CrOxVOx/MCM-41
catalyst was studied. The models were developed based on the
catalyst tests carried out in a packed bed reactor at reaction
temperature varied from 525 - 575 °C under atmospheric pressure.
The dehydrogenation of n-butane mainly gives butene isomers (over
90 %), 1, 3 butadiene and cracked products consisting of methane,
ethane, ethene and propene. Based on the experimental
observations, power law type models were formulated and
parameters were estimated by fitting the experimental data
implemented in MATLAB. The activation energy for the formation of
butenes (96.2 kJ/mol) was found to be considerably less than the
activation energy for the formation of the undesirable cracked
products (130.4 kJ/mol).
Keywords: n-butane Dehydrogenation, Kinetic Modeling, Cracking, MCM-41,
Chromium, Vanadium, Power Law, Activation Energy.
4⃰ Email: [email protected]
1 Introduction
The importance of catalytic dehydrogenation of paraffin
hydrocarbons to olefins has been growing steadily in recent
years. Light olefins, such as butenes, are important raw
materials for the synthesis of polymers, gasoline additives and
various other petrochemical products. The cracking processes
especially fluid catalytic cracking and steam cracker cannot
match the rising demand for the product, hence the need for
catalytic dehydrogenation processes. In the past several
decades, the role of different metal oxides on different supports
like ZrO2, SiO2, and zeolites has been explored for
dehydrogenation [1, 2]. Among the oxide catalysts, vanadium and
chromium oxide supported catalysts have been most promising for
dehydrogenation due to their high catalytic activity. Hakuli et
al. [3] reported that silica and alumina supported chromium
oxides were effective for the production of lower alkenes such as
propene and isobutene. Botavina et al. [4] stated that for
oxidative dehydrogenation of propane and isobutane, the highest
activity, selectivity and stability were achieved over 5.0 wt%
CrOx/silica catalysts prepared by wet impregnation method. Volpe
et al. [5] investigated n-butane dehydrogenation using VOx
supported on USY, NaY, Al2O3 and Al2O3. The high catalytic
activity of VOx/USY and butane selectivity was related to the VOx
monolayer and mild acidity. Highly dispersed VOx/SBA 15
mesoporous silica has been found to exhibit a highly efficient
oxidative dehydrogenation of propane to light olefins (propene +
ethylene). The olefin selectivity was observed up to 80 % at a
high propane conversion of 41.7 %. The enhanced propene
selectivities at higher propane conversions have been attributed
to the unique large pore diameters and the low surface acidity of
the SBA-15 materials [6]. Chromium oxide catalysts supported on
high surface area, pore expanded MCM-41 silica was investigated
for ethane dehydrogenation. SBA-15 and MCM-41 are silica based
molecular sieves with a wide application in selective oxidation
reactions. The study showed that the ethane conversion strongly
depends on the chromia loading and the catalyst preparation
method [7]. Similarly, VOx species supported on hexagonal
mesoporous silica (HMS) were found to be active in ODH (oxidative
dehydrogenation) of n-butane, where the isolated monomeric VOx
species were determined to play most active catalytic role [8].
For a new catalytic system such as CrOxVOx/MCM-41,
kinetic model elucidating the rate mechanistic steps is very
essential to the design of a reactor and to predict reactor
performance confidently. Literature is replete with kinetic
studies on monometal oxide (CrOx or VOx) systems, in the present
study, we aim to develop a model that will predict the rate
mechanistic steps by incorporating CrOxVOx bimetallic system using
the power law model. The mechanistic models considered were
established based on a set of extensive experimental data
generated using a fixed bed reactor under atmospheric pressure
condition. The kinetic parameters were estimated by least square
fittings of the model ordinary differential equations (ODE) using
experimental data implemented in MATLAB.
2 Experimental
2.1. Catalyst Preparation
A method for the preparation of highly ordered MCM-41
(abbreviated as M-41) material and chromium/vanadium impregnated
M-41 catalysts has been detailed in our earlier work [9].
2.2 Catalysts test
The catalytic runs were carried out in a fully
integrated, fixed bed continuous flow reactor system (BELCAT).
The system consists of one tubular quartz reactor attached with
stainless steel one zone furnace assembly through reactor furnace
wall thermo well. The catalysts sample (0.12 g) was packed in the
reactor and activated with flowing N2 at 823 K for 2 h. After
which the contact time was varied from 1.5 to 24 gcat.min/gbutane.
The reaction temperatures were 525, 550 and 575 °C respectively.
The gas product samples were analyzed by online gas chromatograph
(Agilent, 7890N) equipped with J&W Scientfic HP 5 capillary
column (length: 30 m, ID: 0.32 mm, and film thickness 0.25 μm)
and FID detector. The gas products, including H2, CO and CO2,
were analyzed with a TCD and a GS GASPRO capillary column. The
products were identified by comparison with authentic samples.
The term gas hourly space velocity (GHSV) is the inverse
of contact time (τ) and is defined as the mass flow rate of n-
butane in g/min over the weight of the catalyst. The contact
times were varied by changing the partial pressure of n-butane in
the mixed gas containing n-butane and nitrogen while keeping the
catalyst weight fixed.
τ=1
GHSV (gcatmingbutane )GC analyzed data were further processed to evaluate conversion
and selectivity using the following equations:
Coversionofn−butane=molesofn−butaneconvertedmolesofn−butanefed
×100%
Selectivityofproducti= molesofproductin−butaneconversion
×100%
3. Results and Discussion
3.1 Physico-chemical properties of catalyst
The X-ray diffraction patterns for CrOxVOx/M-41 sample have
been extensively discussed elsewhere [9]. The catalyst showed a
well resolved four diffraction peaks corresponding to hexagonal
symmetry indicating well ordered mesoporous support with no
detectable crystalline peaks at higher 2 range. The textural
characteristics of bimetal impregnated M-41 samples which has
also been well detailed in our previous report [9] are summarized
in Table 1. The surface area (1079 m2/g), and pore volume (0.66
cc/g) calculated from nitrogen adsorption isotherm was very high,
typical of mesoporous materials.
3.2 Model development
It is instructive to develop a model with a reasonably
low number of reaction steps and kinetic parameters that will be
just adequate to enable us to describe the essential features of
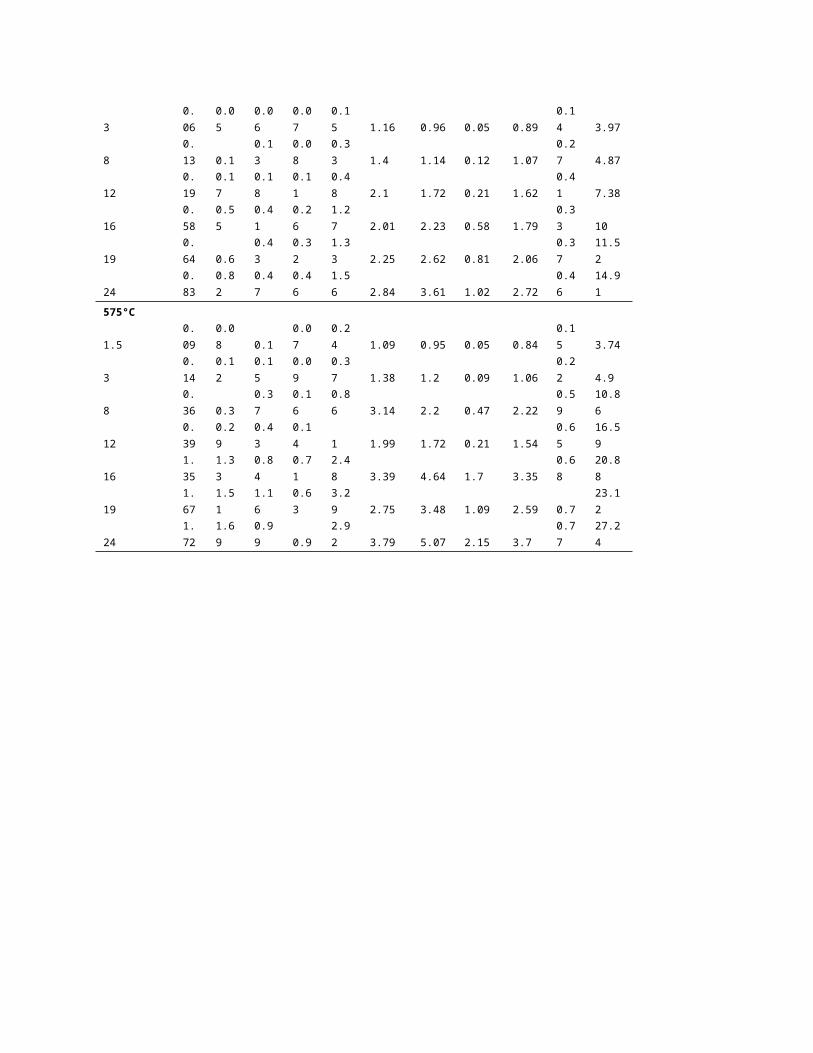
n-butane dehydrogenation and cracking reactions. Rather than
develop a detailed model incorporating all GC detected chemical
species and possible reaction steps, we simplified the model by
lumping all cracked products consisting of methane, ethane,
ethene, propane, propene as one entity, and the butene isomers;
namely 1 butene, cis 2 butene, trans 2 butene were regarded as a
single specie called C4 olefin. Also, some reaction steps with no
significant contribution to the overall rate were ignored.
Examples of such cases are Eq. 2 and Eq. 3 which is the single
and double step biolefin route respectively. The selectivity to
butadiene in the entire sample size was less than 5 %, so the
reaction steps leading to butadiene in the system were neglected.
See Table 2 for product distribution.
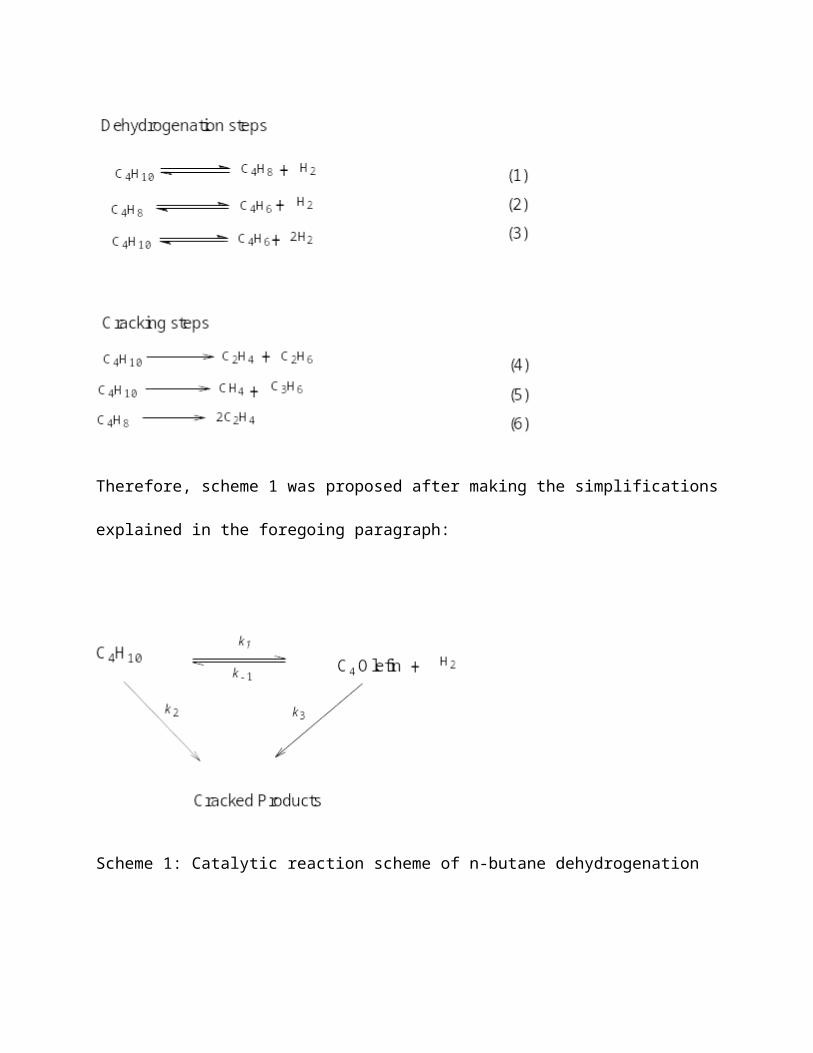
Therefore, scheme 1 was proposed after making the simplifications
explained in the foregoing paragraph:
Scheme 1: Catalytic reaction scheme of n-butane dehydrogenation
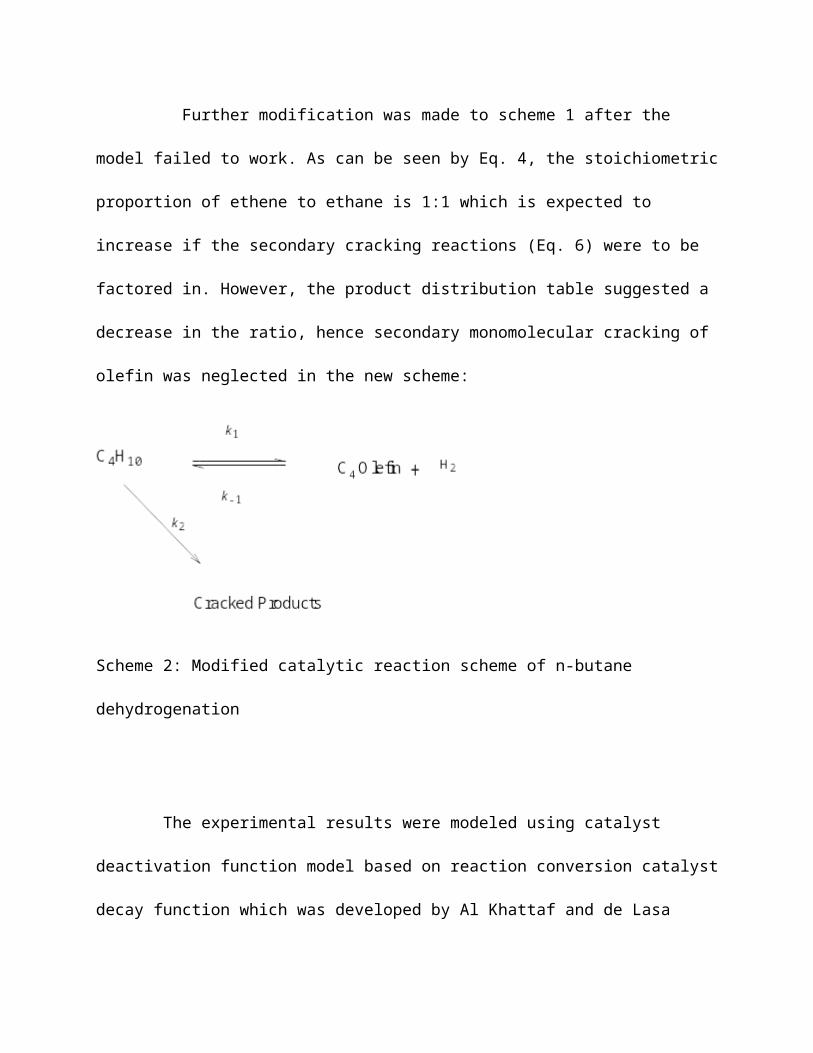
Further modification was made to scheme 1 after the
model failed to work. As can be seen by Eq. 4, the stoichiometric
proportion of ethene to ethane is 1:1 which is expected to
increase if the secondary cracking reactions (Eq. 6) were to be
factored in. However, the product distribution table suggested a
decrease in the ratio, hence secondary monomolecular cracking of
olefin was neglected in the new scheme:
Scheme 2: Modified catalytic reaction scheme of n-butane
dehydrogenation
The experimental results were modeled using catalyst
deactivation function model based on reaction conversion catalyst
decay function which was developed by Al Khattaf and de Lasa
[10]. In this model, deactivation is dependent on the conversion
of n-butane which in turn is linked to the coke formed on the
surface of the active sites of the catalysts. This approach
appears to be more accurate than the time on stream approach
widely used in literature to account for catalyst deactivation.
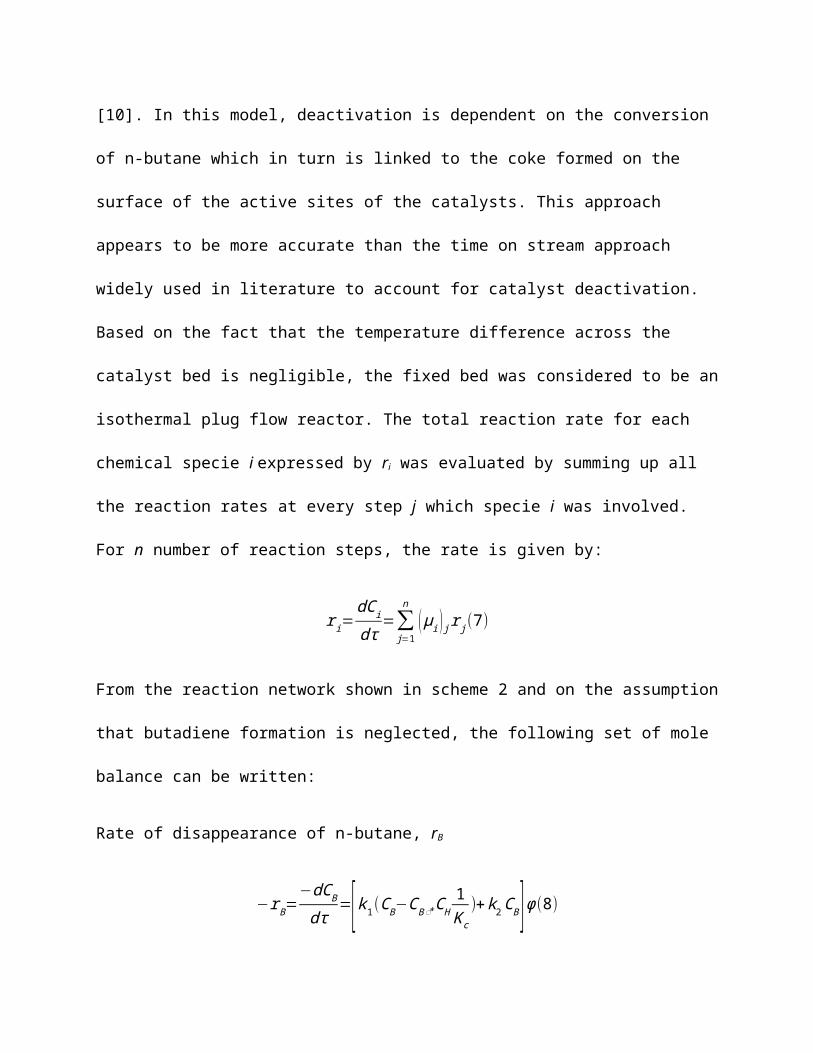
Based on the fact that the temperature difference across the
catalyst bed is negligible, the fixed bed was considered to be an
isothermal plug flow reactor. The total reaction rate for each
chemical specie i expressed by ri was evaluated by summing up all
the reaction rates at every step j which specie i was involved.
For n number of reaction steps, the rate is given by:
ri=dCidτ
=∑j=1
n
(μi )jrj(7)
From the reaction network shown in scheme 2 and on the assumption
that butadiene formation is neglected, the following set of mole
balance can be written:
Rate of disappearance of n-butane, rB
−rB=−dCBdτ
=[k1(CB−CB⃰⃰ CH1Kc
)+k2CB]φ(8)

Rate of appearance of C4 olefin, rB4
rB⃰⃰=dCB ⃰⃰dτ =[k1(CB−CB ⃰⃰ CH
1Kc )]φ(9)
Rate of appearance of cracked products, rCP
rCP=dCCP
dτ=k
2CBφ(10)
Rate of appearance of hydrogen, rH
rH=dCH
dτ=[k1(CB−CB⃰⃰ CH
1Kc
)]φ(11)
where Ci is the molar concentration of each of the chemical
species, i being B (n-butane), B ⃰ (C4 Olefin), CP (Cracked Products)
and H (Hydrogen), and the contact time, τ is given by:
τ=WF
(12)
From which W is the catalyst weight (0.12 g), F is total flow
rate of the mixed gas into the reactor comprising of n-butane and
nitrogen. W was fixed at 0.12 g while F was varied keeping the
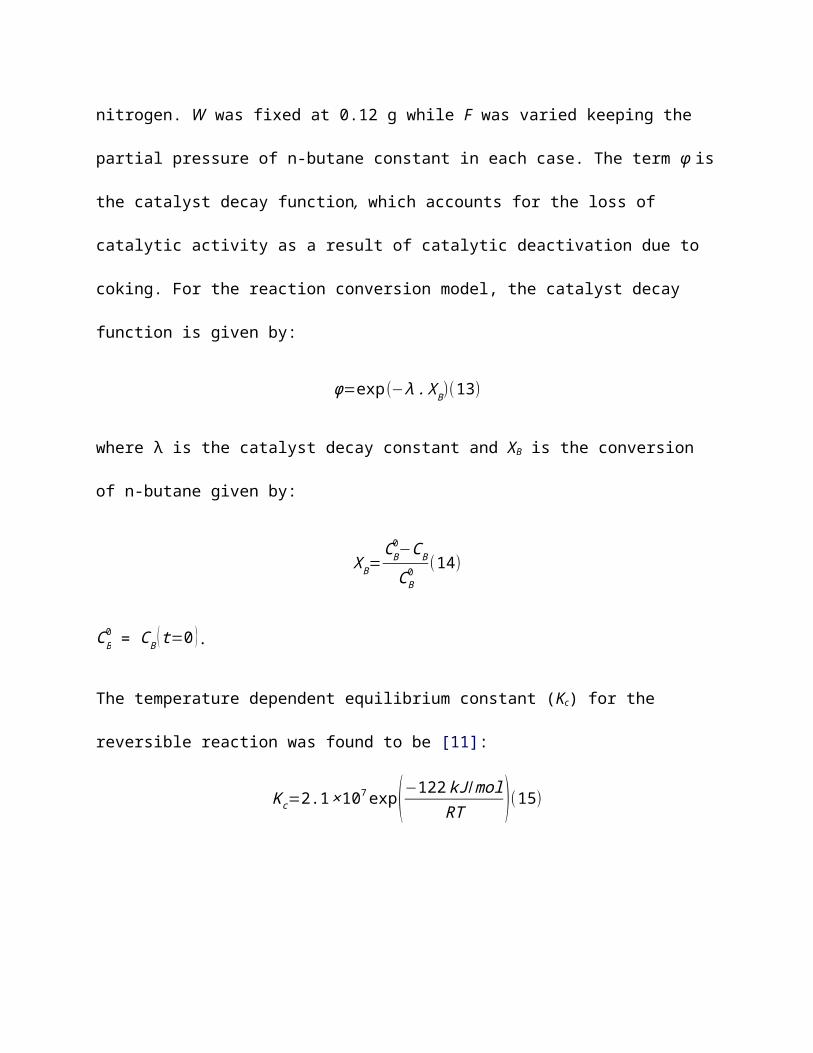
partial pressure of n-butane constant in each case. The term φ is
the catalyst decay function, which accounts for the loss of
catalytic activity as a result of catalytic deactivation due to
coking. For the reaction conversion model, the catalyst decay
function is given by:
φ=exp(−λ.XB)(13)
where λ is the catalyst decay constant and XB is the conversion
of n-butane given by:
XB=CB0−CB
CB0 (14)
CB0 = CB (t=0 ).
The temperature dependent equilibrium constant (Kc) for the
reversible reaction was found to be [11]:
Kc=2.1×10⁷exp(−122kJ/molRT )(15)
The activation energy of reaction step j, Ej, is related to the
temperature dependent rate constant kj by the Arrhenius equation:
kj=k0jexp(−EjRT )(16)
koj is the pre exponential factor. Elswhere[12], it has been
suggested that reparameterization of the Arrhenius equation will
help reduce parameter interaction during modeling. As a result
Eq. 16 was reparameterized by centering the values around koj
which is the value of rate constant at reaction step j at the
average temperature T0 :
kj=k0jexp{−EjR (1T−1T0 )}(17)
The experimental runs were carried out at 525, 550, 575°C,
therefore 550 °C was selected as the average temperature, T0.
3.3 Model Assumptions:
Below are the premise on which the model was developed.
1. Mass transfer limitation is negligible
2. Catalyst deactivation is a function of n-butane conversion.
3. A single deactivation constant is adopted for all reaction
steps
4. Effectiness factor is unity
5. Reactor operates isothermally
6. Butadiene yield is negligible
7. Secondary cracking of olefin is neglected
8. Model assumes only catalytic conversion.
3.4 Determination of model parameters and model discrimination
The kinetic parameters in Eqs. 8 - 11 were estimated using
a non linear regression analysis. To estimate the parameters and
evaluate the models, individual specific rate equations were
combined with mole balance equations. The obtained ordinary
differential equations were then solved numerically together with
a least square fitting of the experimental n-butane
dehydrogenation data. MATLAB ODE 45 subroutine (Runge Kutta Gill
method) was applied in solving the ODE while LSQCURVEFIT
subroutine (Modified Marquad method) was used for parameter
estimation. To obtain more reliable model and model parameters,
the experiments were conducted at three different reaction
temperatures (525–575 °C) and seven different contact times (1.5–
24 gcat.min.gbutane ). Because there is sufficient data for
iteration, the degrees of freedom is more than is needed, hence
we have a very accurate model results.
The model evaluation criteria are that all the rate
parameters should be consistent with physical principles which
are the specific reaction and adsorption rates, the activation
energies for reactions and the heat of adsorption positive. The
optimization criteria used was based on a minimum sum of squares
criteria defined by:
SS=√∑i=1
n
(Ci,exp−Ci,mod)2(13)
Model discrimination was based on:
1. Correlation coefficient closer to one
2. Lower sum of square residuals
3. Lower confidence interval for model parameters
The values of the model parameters with their
corresponding 95 % confidence intervals are shown by Table 3
while the cross correlation matrix is as depicted by Table 4. As
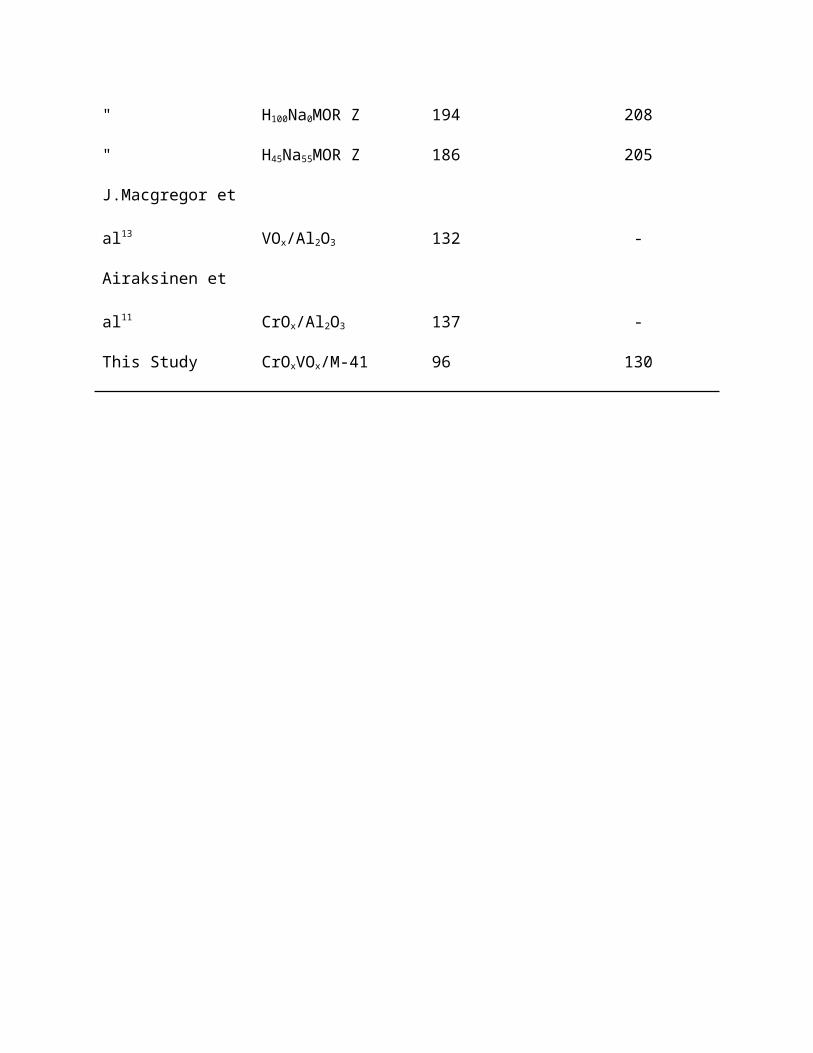
can be seen from Table 3, the estimated apparent activation
energies of dehydrogenation and cracking are 90.2 and 130.4
kJ/mol respectively. The apparent activation energy of n-butane
dehydrogenation was found to be lower than those found in
literature [11, 13, 14, 15]. Similar trend exists for the
apparent activation energy of cracking (refer to Table 5). It was
also observed that the apparent activation energy for the
production of C4 olefin is found to be much smaller (96.2 kJ/mol)
than the cracking reactions producing methane, ethane, ethene and
propene (130.4 kJ/ mol). These results were expected since the
CrOxVOx/M-41 catalyst is more favorable for the dehydrogenation
to give C4 olefin than cracking reaction which requires high
activation energy to produce the undesired products [9]. In Table
4, the correlation between E1 - k1 and E1 - λ for all estimated
parameters for dehydrogenation reaction and the correlation
between E2 - k2 and
E2 - λ for all estimated parameters for cracking reaction have low
to medium parameter interaction, however; there are exceptions.
The parameter interactions between k1 - λ and k2 - λ for
dehydrogenation and cracking reactions have been found to be
significant.
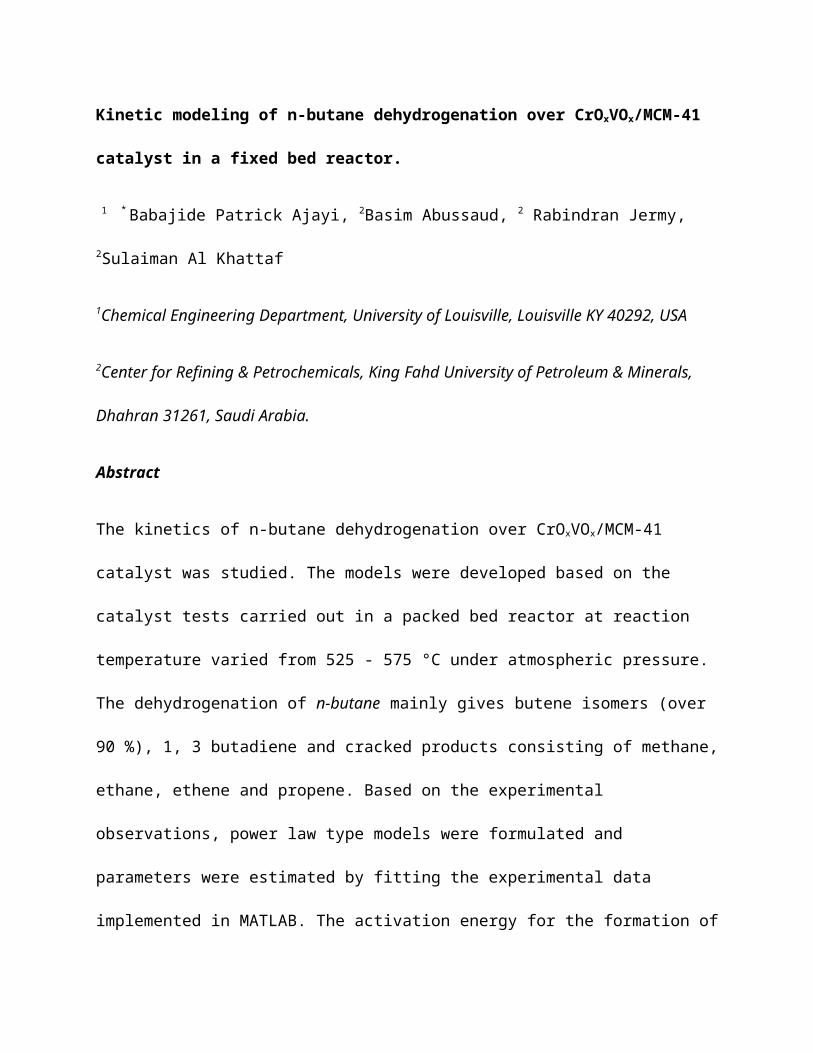
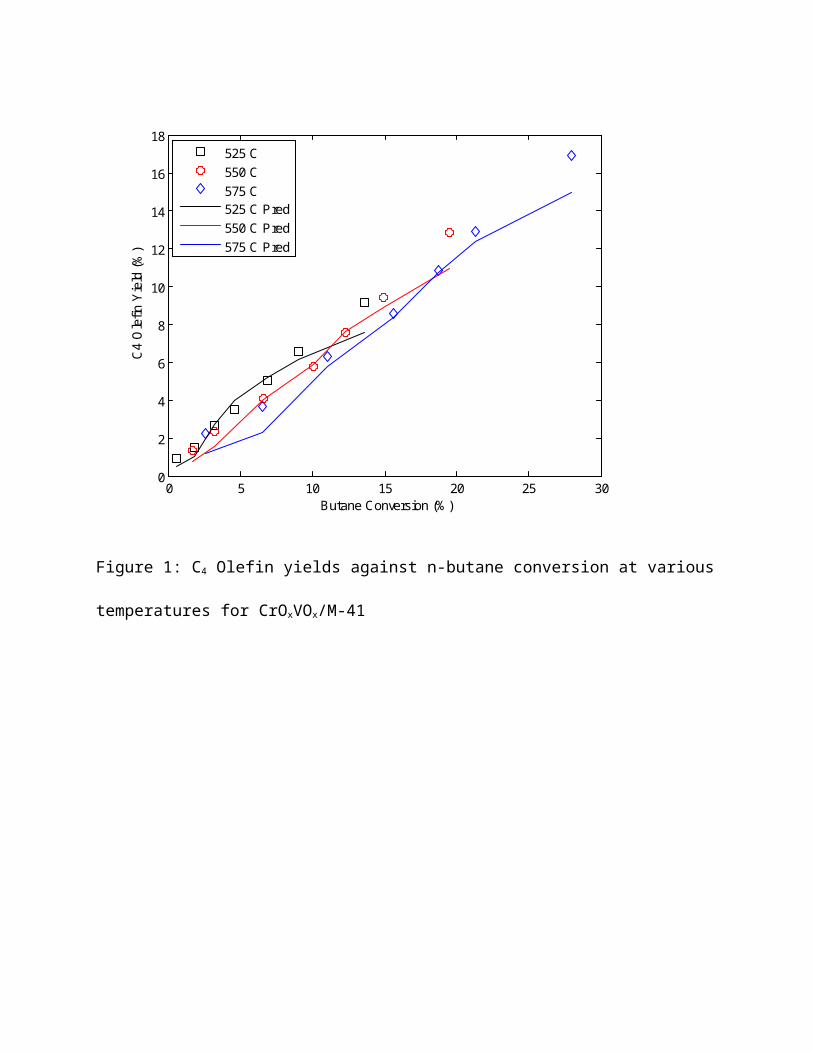
The yield of butene as seen from Figure 1 was found to
increase with both contact time and temperature, which is also
true for n-butane conversion. Maximum yield of 17, 13 and 9 %
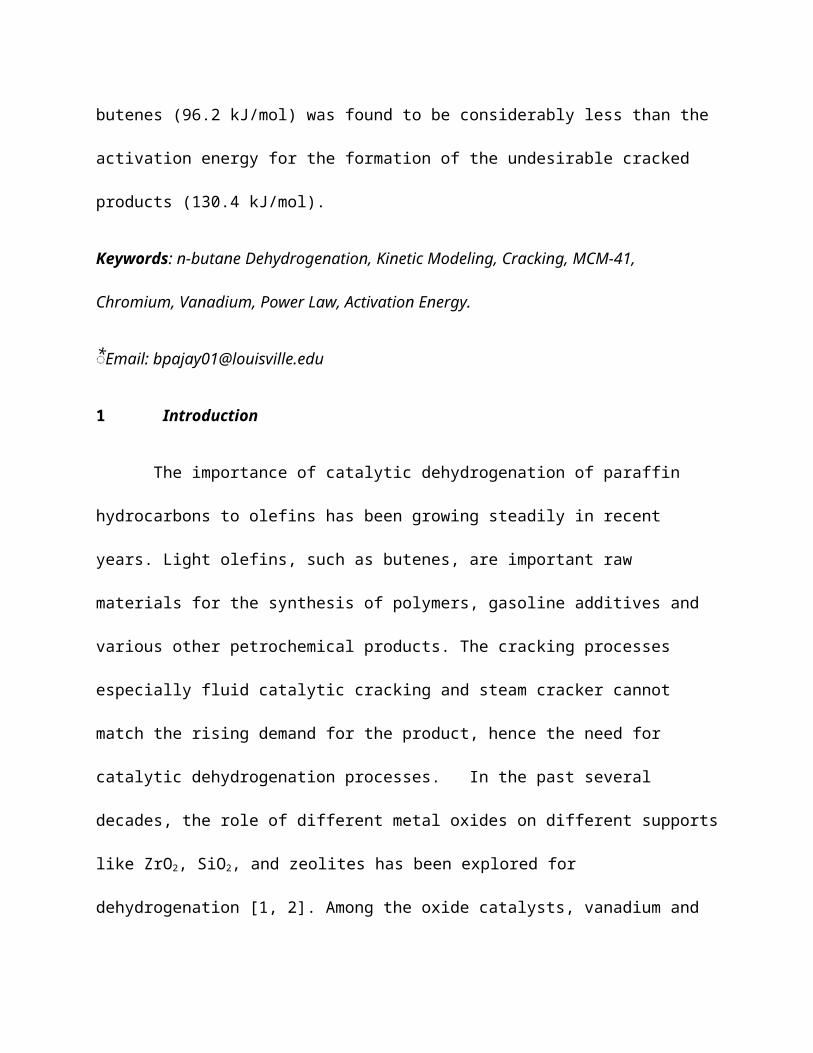
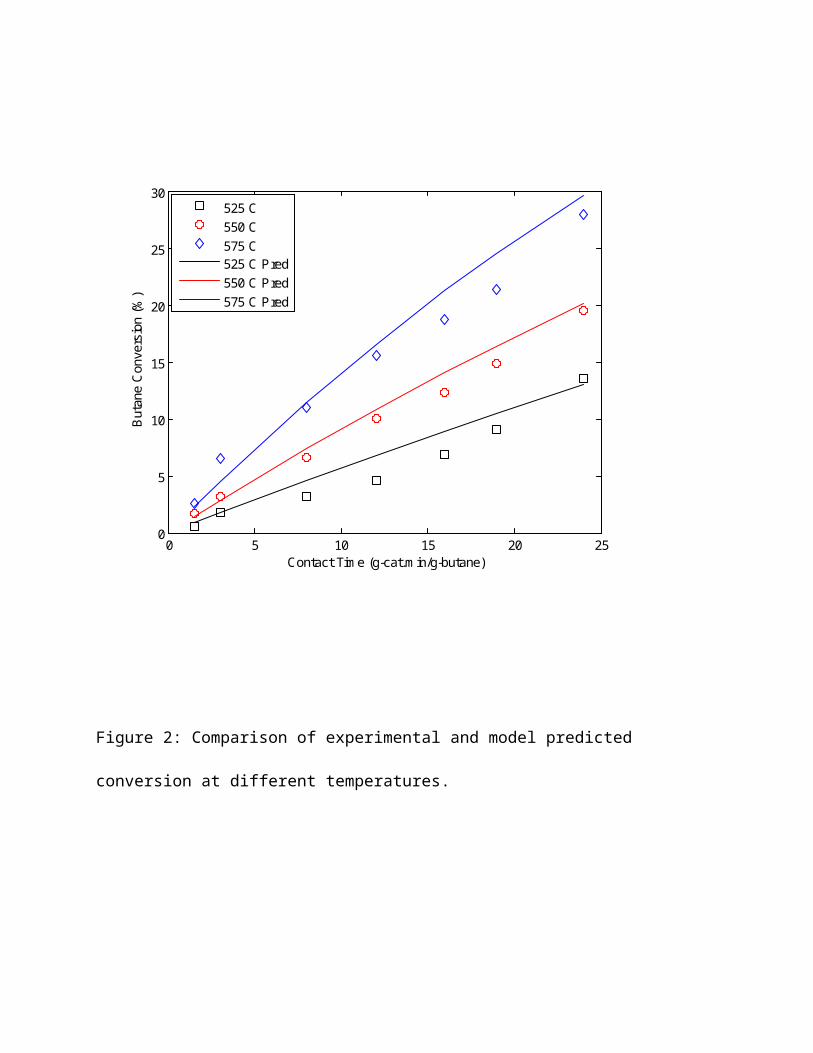
were recorded at 575, 550 and 525 °C respectively. The numerical
results were compared with experimental data as depicted by
Figure 2. As illustrated by the figure, the model prediction
compares favorably with the experimental data. This is a proof
that the proposed kinetic model is a good fit for the obtained
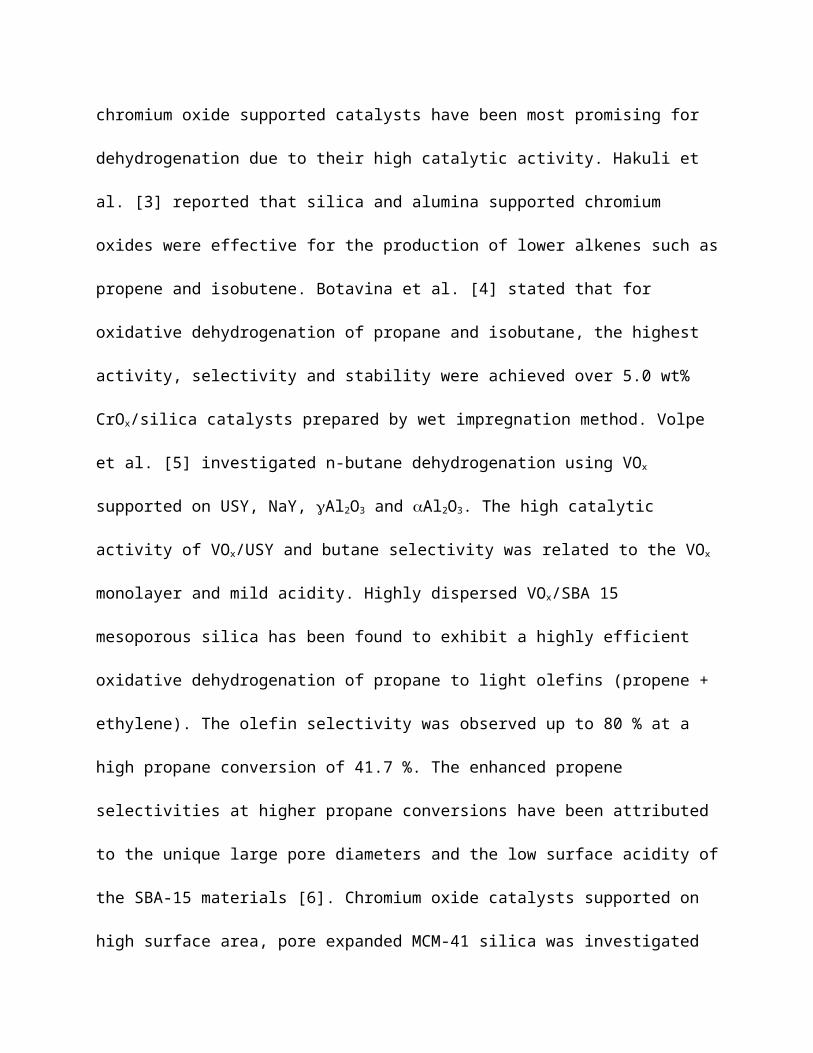
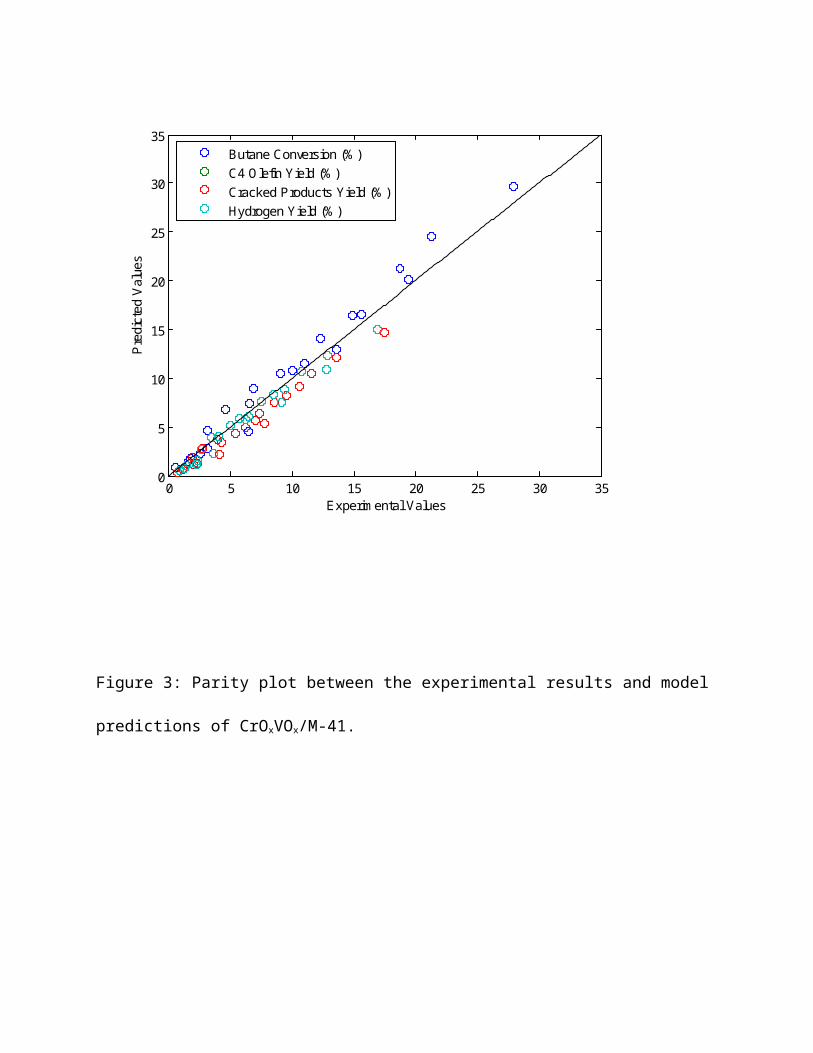
experimental results. To further give credence to the determined
model, a parity plot (Figure 3) showing the overall agreement of
the experimental data and the model predictions was done. Also,
the value of the regression coefficient (R2 = 0.9994) suggests a
strong correlation between the experimental results and the
model.

4 Conclusions
Extensive experimental kinetic data were obtained for n-
butane dehydrogenation over CrOxVOx /M-41 catalyst in a fixed bed
reactor. Power law model was adopted for evaluating the kinetic
parameters based on the reaction conversion catalyst decay
function. The experimental data showed reasonable fit for the
model at 95 % confidence interval with a correlation coefficient
of R2 = 0.9994. The apparent activation energies of
dehydrogenation and cracking are 96.2 and 130.4 kJ/mol
respectively. From these results, the catalyst can be said to be
a reliable catalyst for dehydrogenation when compared with some
catalysts from literature because of its lower apparent
activation energy. Also, the catalyst was observed to be
selective towards dehydrogenation rather than cracking based on
its lower apparent activation energy for dehydrogenation over
cracking.
References
[1] Boot, L.A., van Dillen, A.J., Geus, J.W. and van Buren,
F.R.(1996) J. Catal., 163, 186 - 194.
[2] Jiménez-López, A., Rodriguez-Castellón, E., Maireles-Torres,
P., Diaz, L. and Mérida-Robles, J.(2001) Appl. Catal. A, 218,
295–306.
[3] Hakuli, A., Harlin, M.E., Backman, L.B. and Krause, A.O.I.
(1999) J. Catal., 184, 349 - 35.
[4] Botavina, M.A., Martra, G., Yu, A., Agafonov, N.A., Gaidai,
N.V., Nekrasov, N., Trushin, D.V., Coluccia, S. and Lapidus A.L.
(2008) Appl. Catal. A, 347, 126–132.
[5] Volpe, M., Tonetto, G. and H. de Lasa, H. (2004) Appl. Catal.
A, 272, 69–78.
[6] Liu, Y.M., Cao,Y., Zhu, K.K., Yan, S.R., Dai, W.L., He, H.Y.
and Fan, K.N. (2002) Chem. Commun. 2832–2833.
[7] Malleswara-Rao, T.V., Mamoune Zahidi El, and Sayari, A.,
(2009) J. Mol. Catal. A, 301, 159–165.
[8] Setnicka, M., Bulanek, R., Capek, L. and Cicmanec, P. (2011)
J. Mol. Catal. A, 344, 1– 10.
[9] Ajayi, B.P., Rabindran Jermy, B., Ogunronbi, K.E., Abussaud,
B.A. and Al Khattaf S. (2013) Catal. Today, 204, 189 – 196.
[10] Al Khattaf, S. and de Lasa, H. (2001) Ind. Eng. Chem. Res
40, 5398 - 5404
[11] Airaksinen, S.M.K., Harlin, M.E. and. Krause, A.O.I.,(2002)
Ind. Eng. Chem. Res 40, 5619 – 5626.
[12] Agarwal, A.K. and Brisk, M.L.(1985) Ind. Eng. Chem. Proc.
Des. Dev., 24, 203 - 207
[13] McGregor, J., Huanga, Z., Parrotta, E.P.J., Zeitlera,
B.J.A., Nguyena, K.L., Rawsonc, J.M., Carleye, A., Hansenf, T.W.,
Tessonnierf, J.P., Suf, D.S., Teschnerf, D., Vassf, E.M., Knop
Gerickef, A. Schlöglf , R. and Gladdena, L.F. (2010) J.
Catal.,269, 329 – 339.
[14] Lercher, J.A., van Santen, R.A. and Vinek, H. (1994) Catal.
Lett. 269, 91 – 96.
[15] Gounder, R. and Iglesia, E. (2010) Angew. Chem. Int. Ed.
49(2010)808 – 811.
Figure captions
Figure 1: C4 Olefin yields against n-butane conversion at various
temperatures for CrOxVOx/M-41
Figure 2: Comparison of experimental and model predicted
conversion at different temperatures.
Figure 3: Parity plot between the experimental results and model
predictions of CrOxVOx/M-41.
List of Tables
Table 1: Physico-chemical properties of Cr and V supported MCM-41
catalyst
Table 2: Product distribution of n-butane dehydrogenation over
CrOxVOx/MCM41.
Table 3: Estimated values of the kinetic parameters at 95 %
confidence intervals.
Table 4: Correlation matrix for n-butane dehydrogenation over
CrOxVOx/MCM41 catalyst.
Table 5: Apparent activation energy of n-butane dehydrogenation
and cracking reactions reported in selected works.
0 5 10 15 20 25 300
2
4
6
8
10
12
14
16
18
Butane Conversion (% )
C4 Olefin Yield
(%)
525 C550 C575 C525 C Pred550 C Pred575 C Pred
Figure 1: C4 Olefin yields against n-butane conversion at various
temperatures for CrOxVOx/M-41
0 5 10 15 20 250
5
10
15
20
25
30
Contact Tim e (g-cat.m in/g-butane)
Butane Co
nversio
n (%
)
525 C550 C575 C525 C Pred550 C Pred575 C Pred
Figure 2: Comparison of experimental and model predicted
conversion at different temperatures.
0 5 10 15 20 25 30 350
5
10
15
20
25
30
35
Experim ental Values
Predic
ted Va
lues
Butane Conversion (% )C4 Olefin Yield (% )Cracked Products Yield (% )Hydrogen Yield (% )
Figure 3: Parity plot between the experimental results and model
predictions of CrOxVOx/M-41.
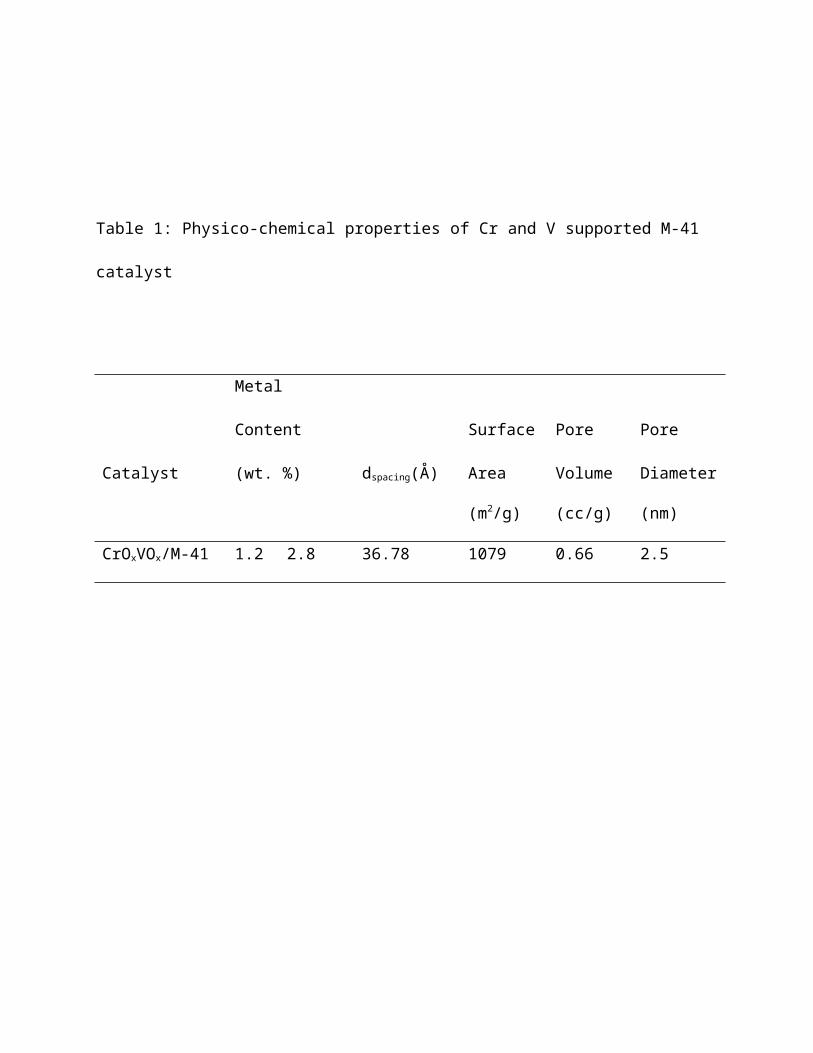
Table 1: Physico-chemical properties of Cr and V supported M-41
catalyst
Catalyst
Metal
Content
(wt. %) dspacing(Å)
Surface
Area
Pore
Volume
Pore
Diameter
(m2/g) (cc/g) (nm)
CrOxVOx/M-41 1.2 2.8 36.78 1079 0.66 2.5
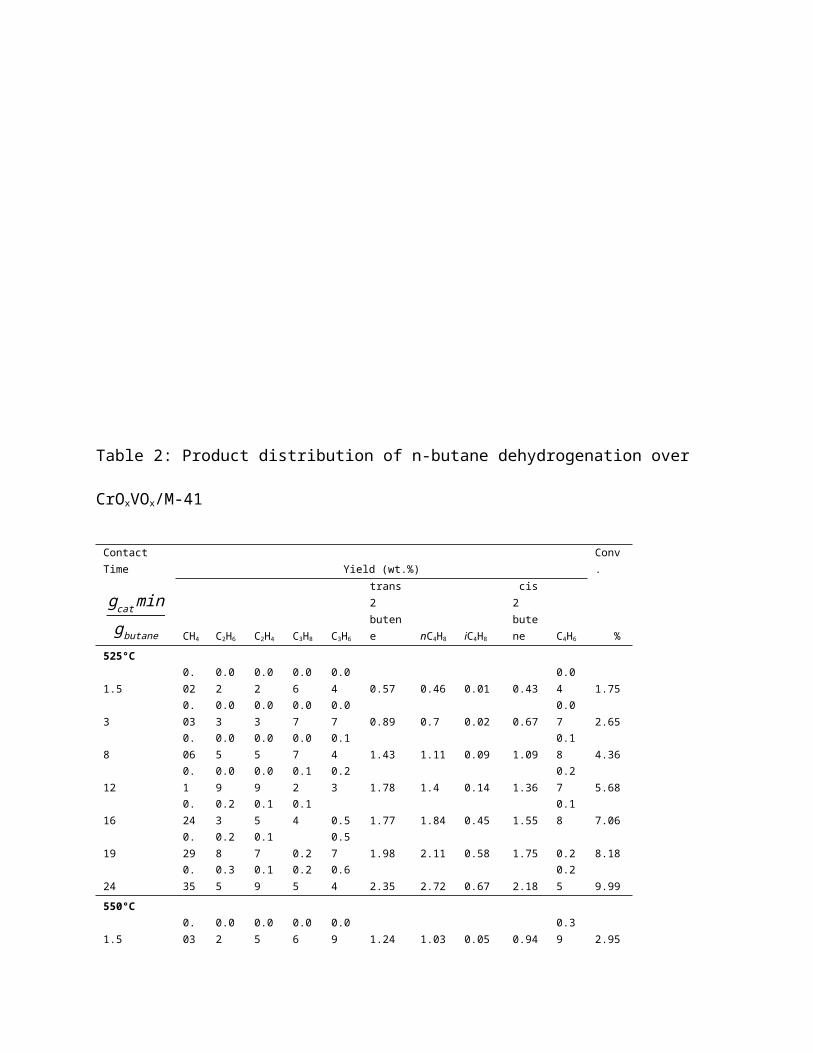
Table 2: Product distribution of n-butane dehydrogenation over
CrOxVOx/M-41
Contact Time Yield (wt.%)
Conv.
gcatmingbutane CH4 C2H6 C2H4 C3H8 C3H6
trans2 butene nC4H8 iC4H8
cis2 butene C4H6 %
525°C
1.50.02
0.02
0.02
0.06
0.04 0.57 0.46 0.01 0.43
0.04 1.75
30.03
0.03
0.03
0.07
0.07 0.89 0.7 0.02 0.67
0.07 2.65
80.06
0.05
0.05
0.07
0.14 1.43 1.11 0.09 1.09
0.18 4.36
120.1
0.09
0.09
0.12
0.23 1.78 1.4 0.14 1.36
0.27 5.68
160.24
0.23
0.15
0.14 0.5 1.77 1.84 0.45 1.55
0.18 7.06
190.29
0.28
0.17 0.2
0.57 1.98 2.11 0.58 1.75 0.2 8.18
240.35
0.35
0.19
0.25
0.64 2.35 2.72 0.67 2.18
0.25 9.99
550°C
1.50.03
0.02
0.05
0.06
0.09 1.24 1.03 0.05 0.94
0.39 2.95
30.06
0.05
0.06
0.07
0.15 1.16 0.96 0.05 0.89
0.14 3.97
80.13 0.1
0.13
0.08
0.33 1.4 1.14 0.12 1.07
0.27 4.87
120.19
0.17
0.18
0.11
0.48 2.1 1.72 0.21 1.62
0.41 7.38
160.58
0.55
0.41
0.26
1.27 2.01 2.23 0.58 1.79
0.33 10
190.64 0.6
0.43
0.32
1.33 2.25 2.62 0.81 2.06
0.37
11.52
240.83
0.82
0.47
0.46
1.56 2.84 3.61 1.02 2.72
0.46
14.91
575°C
1.50.09
0.08 0.1
0.07
0.24 1.09 0.95 0.05 0.84
0.15 3.74
30.14
0.12
0.15
0.09
0.37 1.38 1.2 0.09 1.06
0.22 4.9
80.36 0.3
0.37
0.16
0.86 3.14 2.2 0.47 2.22
0.59
10.86
120.39
0.29
0.43
0.14 1 1.99 1.72 0.21 1.54
0.65
16.59
161.35
1.33
0.84
0.71
2.48 3.39 4.64 1.7 3.35
0.68
20.88
191.67
1.51
1.16
0.63
3.29 2.75 3.48 1.09 2.59 0.7
23.12
241.72
1.69
0.99 0.9
2.92 3.79 5.07 2.15 3.7
0.77
27.24
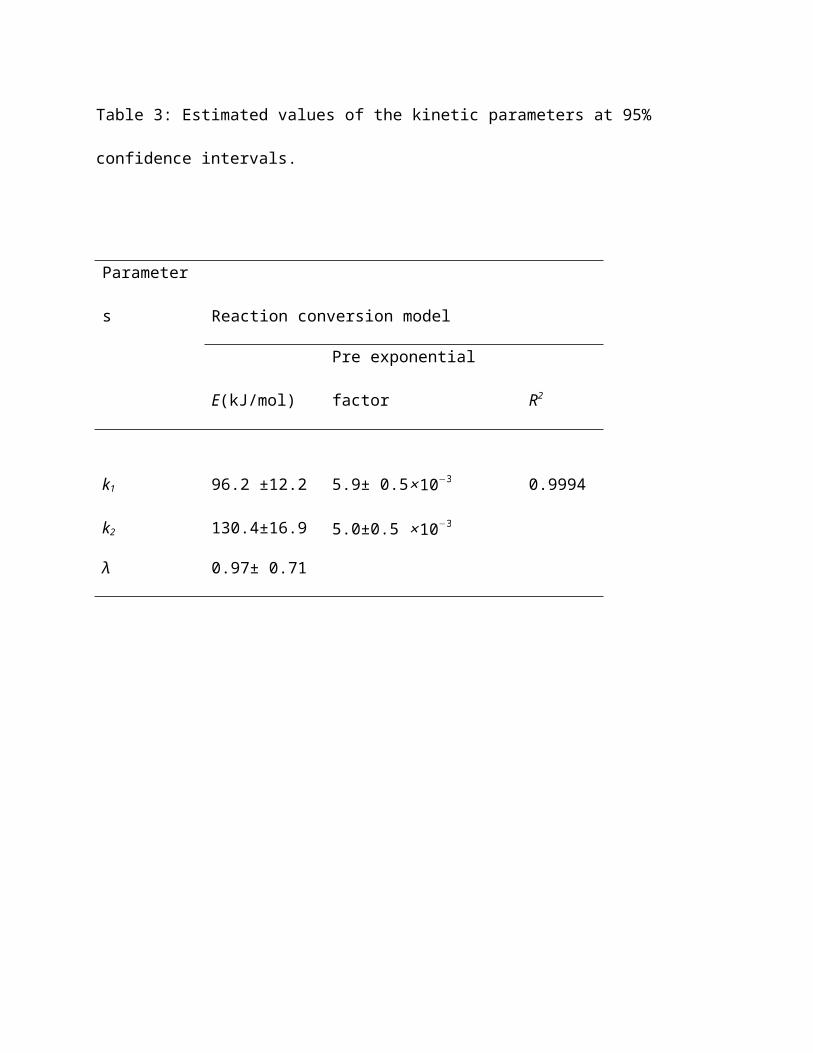
Table 3: Estimated values of the kinetic parameters at 95%
confidence intervals.
Parameter
s Reaction conversion model
E(kJ/mol)
Pre exponential
factor
R2
k1
k2
96.2 ±12.2
130.4±16.9
5.9± 0.5×10⁻³
5.0±0.5 ×10⁻³
0.9994
λ 0.97± 0.71
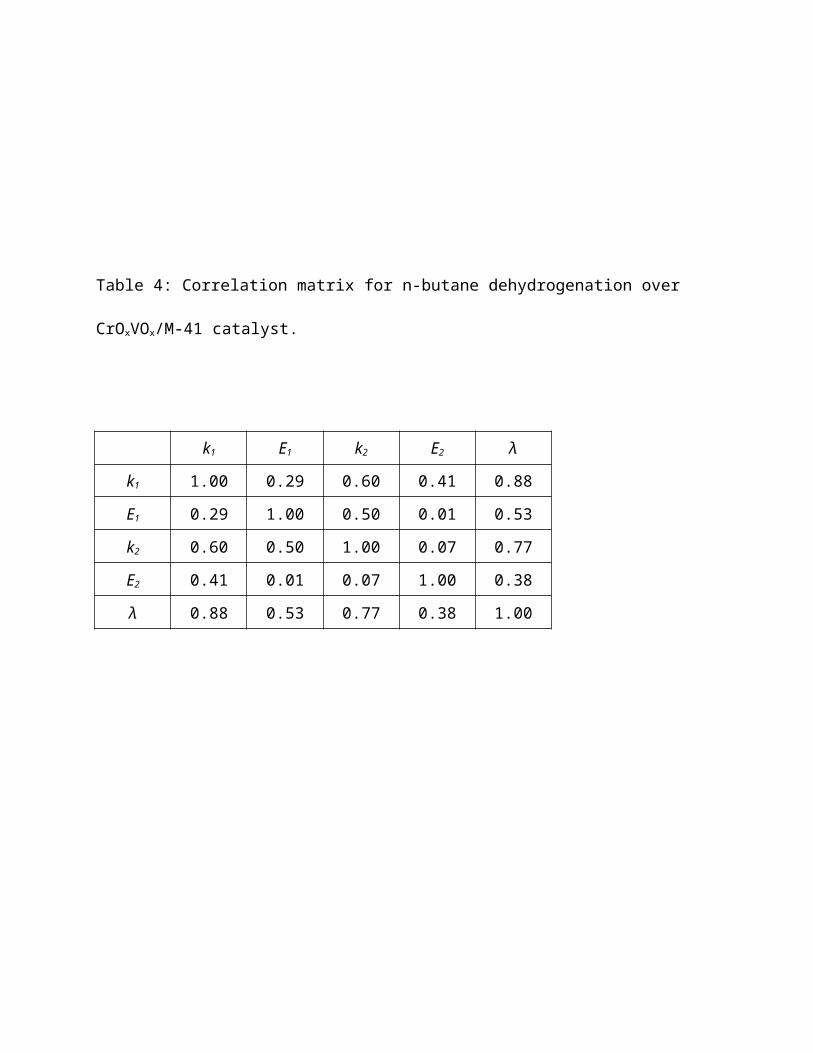
Table 4: Correlation matrix for n-butane dehydrogenation over
CrOxVOx/M-41 catalyst.
k1 E1 k2 E2 λ
k1 1.00 0.29 0.60 0.41 0.88
E1 0.29 1.00 0.50 0.01 0.53
k2 0.60 0.50 1.00 0.07 0.77
E2 0.41 0.01 0.07 1.00 0.38
λ 0.88 0.53 0.77 0.38 1.00
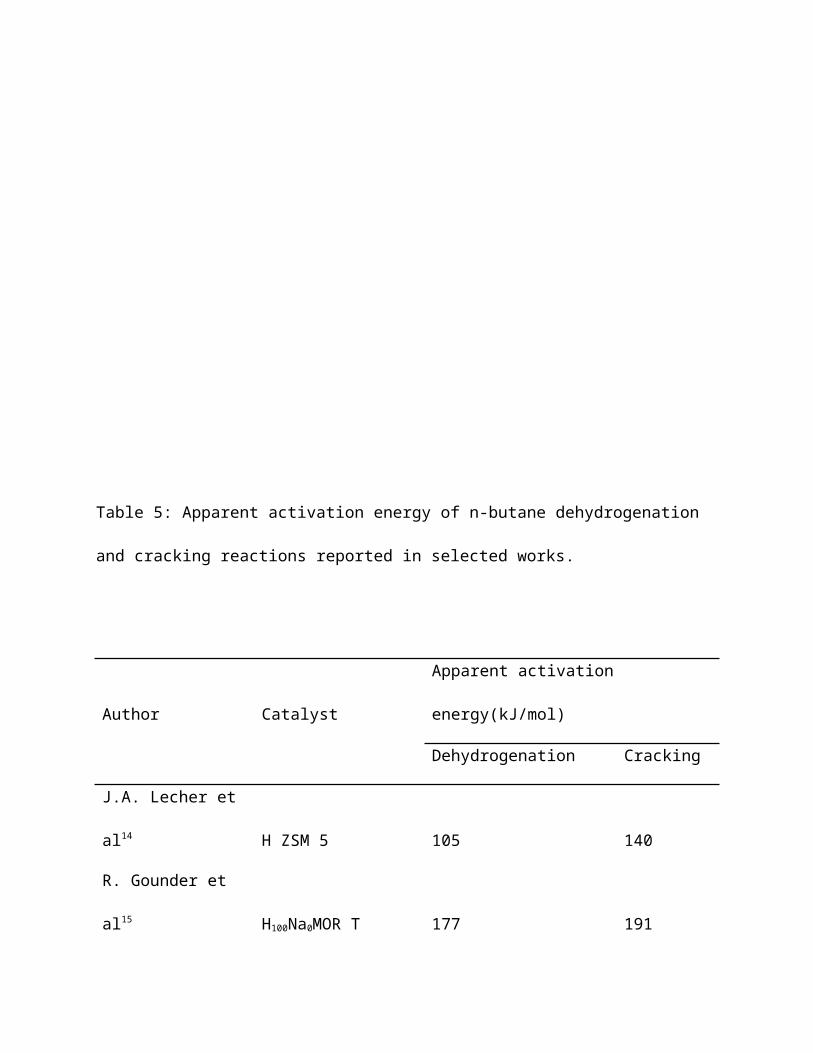
Table 5: Apparent activation energy of n-butane dehydrogenation
and cracking reactions reported in selected works.
Author Catalyst
Apparent activation
energy(kJ/mol)
Dehydrogenation Cracking
J.A. Lecher et
al14 H ZSM 5 105 140
R. Gounder et
al15 H100Na0MOR T 177 191
" H100Na0MOR Z 194 208
" H45Na55MOR Z 186 205
J.Macgregor et
al13 VOx/Al2O3 132 -
Airaksinen et
al11 CrOx/Al2O3 137 -
This Study CrOxVOx/M-41 96 130
Top Related
Copyright © 2022 FDOKUMEN

