


Bahasa
Halaman
Hukum


Kernel Functions for Attributed Molecular Graphs – A New Similarity
Based Approach To ADME Prediction in Classification and Regression Holger Fröhlich*, Jörg. K. Wegner, Florian Sieker and Andreas Zell
Centre for Bioinformatics Tübingen (ZBIT)
Sand 1, 72076 Tübingen, Germany
To receive all correspondence; E-mail: {holger.froehlich}@informatik.uni-tuebingen.de
Keywords: molecular graph mining, graph representation, reduced graph representation,
molecular similarity, Kernel Methods, Support Vector Machines
Abbreviations: Support Vector Machine – SVM, Human Intestinal Absorption – HIA, Blood
Brain Barrier – BBB, Search and Optimization of Lead Structures – SOL
Received on:
Full Paper
Kernel methods, like the well-known Support Vector Machine (SVM), have gained a growing
interest during the last years for designing QSAR/QSPR models having a high predictive
strength. One of the key concepts of SVMs is the usage of a so-called kernel function, which
can be thought of as a special similarity measure. In this paper we consider kernels for
molecular structures, which are based on a graph representation of chemical compounds. The
similarity score is calculated by computing an optimal assignment of the atoms from one
molecule to those of another one, including information on specific chemical properties,
membership to a substructure (e.g. aromatic ring, carbonyl group, etc.) and neighborhood for
each atom. We show that by using this kernel we can achieve a generalization performance
comparable to a classical model with a few descriptors, which are a-priori known to be
relevant for the problem, and significantly better results than with and without performing an

automatic descriptor selection. For this purpose we investigate ADME classification and
regression datasets for predicting bioavailability (Yoshida), human intestinal absorption
(HIA), blood-brain-barrier (BBB) penetration and a dataset consisting of 4 different inhibitor
classes (SOL). We further explore the effect of combining our kernel with a problem
dependent descriptor set. We also demonstrate the usefulness of an extension of our method to
a reduced graph representation of molecules, in which certain structural features, like e.g.
rings, donors or acceptors, are represented as a single node in the molecular graph.
1 Introduction
Kernel methods, like the well-known Support Vector Machine (SVM) [2, 5, 6], have gained a
growing interest during the last years for designing QSAR/QSPR models having a high
predictive strength (e.g. [11]). One of the key concepts of SVMs is the usage of a so-called
kernel function, which allows nonlinear classification and regression. A kernel function can
be thought of as a special similarity measure with the mathematical properties of symmetry
and positive definiteness [4]. Apart from the usual vectorial data, kernel functions can be
defined between arbitrarily structured objects, like strings, trees or graphs (e.g. [13, 14, 35]).
Classically, QSAR/QSPR models are designed by representing molecules by a large set of
descriptors, i.e. by a high dimensional vector, and then applying some kind of Machine
Learning method like Neural Networks, Decision Trees or, more recently, Support Vector
Machines. A big problem is the question, which set of descriptors is suited best for the
QSAR/QSPR problem at hand [1]. Sometimes it is known by expert knowledge that certain
descriptors are relevant for the specific task (e.g. the polar surface area is important for human
intestinal absorption [15]), but in general we cannot assume that we know all factors, which
affect the physicochemical property we want to predict. One has to take into account that
there is no universal best set of descriptors, which works well for all QSAR/QSPR problems,

because this would lead to a contradiction to the No Free Lunch theorem [9, 10]. Hence, the
selection of appropriate descriptors is a crucial point for the design of QSAR/QSPR models
[1, 8, 16]. From a practical side this means one often has to compute a very high number of
descriptors for each molecule first and then find out those, which are really relevant for the
problem at hand. This involves the problem of descriptor selection, which in general is a NP-
complete task [3]. Thus only approximate solutions for higher dimensional data, like in
QSAR/QSPR studies, are possible. All in all the computational burden for the calculation of
thousands of descriptors, maybe followed by an expensive descriptor selection, is quite high.
Hence, an appealing idea is to directly work on a graph representation of chemical compounds
without explicitly calculating any descriptor information. An advantage of this method is that
the problem of selecting an appropriate set of descriptors becomes irrelevant, because all
computations are carried out directly on the molecular structures represented as labeled
graphs. Atoms in a chemical molecule are represented as nodes in the graph and bonds as
edges between nodes. Each atom and each bond has certain chemical properties. These
properties can be represented as labels of the nodes and edges respectively. It is also possible
to encode structural aspects into the labels, like the membership of an atom to a ring, to a
donor, an acceptor, etc. The graph representation can give us a detailed description of the
topology of a molecule without making any a-priori assumptions on the relevance of certain
chemical descriptors for the whole molecule. It is clear that thereby a crucial point is to
capture the characteristics of each single atom and bond by its chemical properties (e.g.
electro-topological state [17], partial charge [18]), which are encoded in the labels (see
experimental section for more detail).
Based on the graph representation of molecules, it is possible to define a kernel function,
which measures the degree of similarity between two chemical structures. In principle, each
structure could be represented by means of its similarity to all other structures in the chemical
space. Examples of such a coordinate-free coding [19] are e.g. atom-pair descriptors [20],

feature trees [23] and maximum common substructure approaches [21]. However, kernel
functions are a little bit different from these approaches as, in contrast to the previous
methods, they implicitly define dot products in some space [4]. I.e. by defining a kernel
function between two molecules we implicitly define a vector representation of them without
the need to explicitly know it.
The main advantage of a kernel function is that it can be put into a SVM to build a
QSAR/QSPR model. This would not be possible with a similarity measure not representing a
kernel function [4]. The intuition of our kernel function is that similarity between two
molecules mainly depends on the matching of certain substructures, like e.g. aromatic rings,
carbonyl groups, etc., and their neighborhoods (fig. 1). I.e. two molecules are more similar the
better structural elements from both molecules fit together and the more these structural
elements are connected in a similar way in both molecules. Thereby the chemical properties
of each single atom and bond in both structures have to be considered.
On an atomic level this leads to the idea to look for those atoms in both molecules, which
have the best match with regard to structural and chemical properties. With structural
properties of an atom we mean, whether the atom belongs e.g. to an aromatic system, but also
the neighbor atoms and bonds leading to them. Thereby it is possible not to consider direct
neighbors only, but also neighbors, which are farther away up to some maximal topological
distance (fig. 2). We now want to assign each atom from one molecule to exactly one atom
from another molecule such that the overall similarity is maximized. This problem of finding
the optimal assignment of all atoms from one molecule to those of another one is an instance
of a classical problem from graph theory, also known as the maximum weighted bipartite
matching problem (fig. 3). There exist efficient algorithms to solve this problem (e.g. [49]) in
O(n3) time, where n is the maximum of the number of atoms of both molecules. As a result
from this algorithm we know for each atom in one molecule to which atom in the other
molecule it is assigned to. This guarantees us an easy way of interpreting and understanding

our kernel function. Besides the circumvention of the descriptor selection problem, we see
here an additional advantage of our approach compared to classical descriptor based models,
where certain descriptors, like e.g. Burden’s eigenvalues [17] represent aspects of the graph
structure of a molecule, but lack a simple interpretation. At a first glance there are some
parallels of our approach to the feature trees method by Rarey and Dixon [23]. However, in
contrast to feature trees, firstly no conversion of the molecular graph into a tree representation
is needed, secondly the computation of the similarity between molecules is directly carried
out on the graph structure, and thirdly our method computes a positive definite and symmetric
kernel function, which allows the usage in combination with Support Vector Machines and
other kernel based learning algorithms [4, 36].
Figure 1. Matching regions of two molecular structures.
Figure 2. Direct and indirect neighbors of atom 3 in the left and atom 5 in the right molecule.

A natural extension of our method is to represent each molecule not on an atomic level but in
form of a reduced graph. Thereby certain structural motifs, like e.g. rings, donors, acceptors,
are collapsed into one node of the molecular graph, whereas remaining atoms are removed.
This allows us to concentrate on important structural features, where the definition of what an
important structural feature actually is, is induced by the problem at hand and may be given
by expert knowledge. This procedure is known as pharmacophore mapping [28].
Another extension is the incorporation of descriptor information known to be relevant for the
problem at hand. We will demonstrate an easy way of dealing with this task by means of the
sum of two kernel functions.
Figure 3. Possible assignments of atoms from molecule 2 to those of molecule 1. The kernel function k measures
the similarity of a pair of atoms including information on structural and chemical properties. The goal is
to find the matching, which assigns each atom from molecule 2 to exactly one atom from molecule 1, such that
the overall similarity score, i.e. the sum of edge weights in the bipartite graph, is maximized.
( , ')i ja a
This paper is organized as follows: In the next section we first give a brief review of kernel
functions, which is necessary to understand the rest of the paper. Afterwards we describe our
method in detail. In section 3 we explain our extensions to the basic approach. In section 4 we
experimentally evaluate our approach and compare it to classical descriptor based
QSAR/QSPR models. Our experiments include prediction of human intestinal absorption
(HIA) [7, 39, 40, 37, 38, 41, 42], blood-brain-barrier (BBB) penetration [24, 43],
bioavailability [29], and grouping inhibitors in 4 different classes [25]. We show that by using
our approach we achieve a generalization performance comparable to a descriptor based
model, which includes only descriptors that are a-priori known to be relevant for the problem.
At the same time our results are significantly better than a classical descriptor based model
with and without automatic descriptor selection. Furthermore, we show that by combining our
method with descriptors known to be relevant to the QSAR/QSPR problem at hand a further
reduction of the prediction error is possible. We also demonstrate the good performance of the
reduced graph representation. Section 5 contains a general conclusion of our work and points
out directions of future research.
2 Our Method
2.1 Kernels Functions – a Brief Review
A kernel function is a special similarity measure k: X × X → ℜ between patterns lying in
some arbitrary domain X, which represents a dot product in some Hilbert space H. [4]. I.e. for
two arbitrary patterns x, x’ ∈ X it holds that k(x, x’) = ⟨φ(x), φ(x’)⟩, where φ: X → H is an
arbitrary mapping of patterns from domain X into feature space H. In principle the patterns in
domain X do not necessarily have to be vectors. They could be strings, graphs, trees, text
documents or other objects. The vector representation of these objects is then given by the
map φ. However, an important special case is when X is a vector space and φ a nonlinear map.
A simple example thereof is the case X = ℜ2 and H = ℜ3, i.e. φ: ℜ2 → ℜ3. The map φ could
for instances be calculated by taking all possible products between features x(1), x(2) of pattern

x ∈ ℜ2, e.g. (1) (2) (1) (2) (1) (1) (1) (2) (2) (2)( , ) ( , ) : ( , 2 , )T Tx x x x x x x x x xφ =a
(
T
j
. The dot product k(x,
x’) = ⟨φ(x), φ(x’)⟩ can then be computed efficiently in closed form as ⟨φ(x), φ(x’)⟩ = ⟨x, x’⟩2.
That means, if we are only interested in the kernel value, the mapping φ: X → H does not
have to be known at all. In fact, it is implicitly given by the kernel function. This is known as
the kernel trick. In general any valid kernel function between arbitrary objects implicitly
corresponds to a dot product in some feature space [4]. If we are defining kernel functions, we
have thus to ensure that this property is fulfilled. Given a set of patterns x1, …, xn ∈ X one can
show that this is exactly the case, if the so-called kernel matrix ( , ))i j ik x x=K
i
is symmetric
and positive definite, i.e. for all α ∈ℜi,j
0i j ijαα ≥it holds∑ K [4].
Popular examples of kernel functions are the radial basis functions (RBFs)
2
2
|| ||( , ) exp2RBFkσ
− −=
x x'x x' and the homogenous polynomial kernels
( , ) , dpolyk =x x' x x' d N∈ ( ). An interesting property of kernels is the fact that products and
sums of kernels are valid kernels again [4].
We now turn to the construction of our optimal assignment kernel as a positive definite and
symmetric similarity measure for chemical structures.
2.2 Optimal Assignment Kernels for Chemical Molecules
Let us assume we have two molecules M and M’, which have atoms and .
Let us further assume we have some non-negative kernel function , which compares a pair
of atoms from both molecules, including information on their neighborhoods,
membership to certain substructures (like aromatic systems, donors, acceptors, and so on) and
other chemical properties (e.g. mass, partial charge [18], etc.). We now want to assign each
atom of the smaller of both molecules to exactly one atom of the bigger one such that the
1,..., na a 1' ,..., 'ma a
neik
'( , ' )h ha a

overall similarity score, i.e. the sum of kernel values between individual atoms, is maximized.
Figure 3 illustrates this idea: Between any pair of atoms from the left and the right structure
there is some similarity, which can be thought of as the edge weights of a bipartite graph. We
now have to find a combination of edges such that the sum of edge weights is maximized.
Thereby each edge can be used at most once. That means in the end exactly out of
edges are used up. Mathematically this can be formulated as follows: Let
min( , )n m
n m⋅ π denote a
permutation of an n -subset of natural numbers 1,…,m, or a permutation of an m -subset of
natural numbers 1,…,n, respectively (this will be clear from context). Then we are looking for
the quantity
(1) ( ') '
' 1
( ')1
max ( , ' ) if ( , ') :
max ( , ' ) otherwise
m
nei h hh
A n
nei h hh
k a a n mk M M
k a a
π π
π π
=
=
>=
∑
∑
As one can show [34], indeed is a valid kernel function and hence a similarity measure for
molecules. We call it an optimal assignment kernel. Implicitly it computes a dot product
between two vector representations of molecules in some Hilbert space (section 2.1). Thereby
calculations can be carried out efficiently in O n [49].
Ak
3(max( , ) )m
In order to prevent larger molecules to achieve a higher kernel value than smaller ones, we
should further normalize our kernel [4], i.e.
( , ')( , ')( , ) ( ', ')
AA
A A
k M Mk M Mk M M k M M
← (2)
This normalization gives us a similarity score in [0, 1].
We now have to define the kernel . For this purpose let us suppose we have two RBF-
kernels and k , which compare the atom and bond labels, respectively. The set of
labels associated with each atom or bond can be interpreted as a feature vector. As the
individual features for an atom or a bond can live on different numerical scales, it is beneficial
neik
atomk bond

to normalize the feature vectors e.g. to length 1. Let us introduce the notation now
for the bond connecting atom a with its ith neighbor atom . Let us further denote by |a|
the number of neighbors of atom a. We now define a kernel
( )ia n a→
( )in a
0R , which compares all direct
neighbors of atoms (a, a’) as the optimal assignment kernel between all neighbors of a and a’
and the bonds leading to them, i.e.
)
)
) if | | |
)) otherw
a( ) ( )
( ),
i
i
n
n a a
,π
0
(
( ( )
| '|
( )1
0 | |
( )1
1 max ( ( ), ( ')) ( ' ( ') ' || |
( , ') :1 max ( ( ), ( ')) ( ' ( ' ise
| ' | i
a
atom i i bond ii
a
atom i i bondi
k n a n a k a a a n a aa
R a ak n a n a k a n a
a π
π π
π π
=
=
⋅ → → >=
⋅ → →
∑
∑(3)
As an example consider the C-atom 3 in the left and the C-atom 5 in the right structure of
figure 2: If our only features for atoms and bonds would consist of the element type and bond
order, respectively, and and k would simply count a match by 1 and a mismatch by
0, our kernel
atomk
5' )
bond
0 3( ,R a a would tell us that 2 of 3 possible neighbors of atom 3 in the left
structure match with the neighbors of atom 5 in the right structure, i.e. R calculates the
fraction of matching neighbors of ( , . It is worth mentioning that the computation of 3a a 5' ) 0R
can be done in constant time complexity as for chemical compounds |a| and |a’| can be upper
bounded by a small constant (e.g. 4).
Of course it would be beneficial not to consider the match of direct neighbors only, but also
that of indirect neighbors and atoms having a larger topological distance. For this purpose we
can evaluate 0R not at (a, a’) only, but also at all pairs of neighbors, indirect neighbors and so
on, up to some topological distance L. In our example that would mean we also evaluate
and so on. The mean of all these values
corresponds to the average match of all indirect neighbors and atoms of larger topological
distance. Adding them to
0 2 2 4 2 0 7 2 0 2 3( , ' ), , ' ), ( , ' ), ( , ' ),..R a a a a R a a R a a
0( , ') ( , ')atomk a a R a a
0 (R .
+ leads to the following definition of the kernel
: neik

(4) 01
( , ') : ( , ') ( , ') ( ) ( , ')L
nei atomk a a k a a R a a R a aγ=
= + +∑ ll
l
Here Rl denotes the mean of all 0R evaluated at neighbors of topological distance , and l
( )γ l is a decay parameter, which reduces the influence of neighbors that are further away and
depends on the topological distance l to (a, a’). It makes sense to set ( ) ( ) '( )p pγ =l l l , where
are the probabilities for molecules M, M’ that neighbors with topological distance
are considered.
( )
l
, '(p pl )l
A key observation is that Rl can be computed efficiently from 1R −l via the recursive
relationship
1,
1( , ') ( ( ), ( '))| || ' | i j
i j
R a a R n a n aa a −= ∑l l (5)
I.e. we can compute k by iteratively revisiting all direct neighbors of a and a’ only. Thereby
for any finite L an O(1) time complexity for the calculation of is guaranteed.
nei
neik
To briefly summarize, our approach works as follows: We first compute the similarity of all
atom and bond features using the kernels and . Having these results we can
compute the match of direct neighbors
atomk bondk
0R for each pair of atoms from both molecules by
means of (3). From 0R we can compute 1,..., LR R by iteratively revisiting all direct neighbors
of each pair of atoms and computing the recursive update formula (5). Having and atomk
0 ,..., LR R directly gives us , the final similarity score for each pair of atoms, which
includes structural information as well as chemical properties. With we can finally
compute the optimal assignment kernel between two molecules M and M’ using (1) and (2).
Thereby (1) can be e.g. calculated using the Hungarian method
neik
neik
1 [22].
1 A C and Java source code of the Hungarian method can be found in the supplement of this paper as well as the class-files of our JAVA implementation of the optimal assignment kernel.

3 Extensions
3.1 Reduced Graph Representation
The main intuition of our method lies in the matching of substructures from both molecules.
In the previous section we achieved this by using structural, neighborhood and other
characteristic information for each single atom and bond, and computing the optimal
assignment kernel between atoms of both molecules. A natural extension of this idea is to
collapse structural features, like rings, donors, acceptors and others, into a single node of the
graph representation of a molecule. Atoms not matching a-priori defined types of structural
features can even be removed [28]. This allows us to concentrate on important structural
elements of a molecule, where the definition of what an important structural element actually
is, depends on the QSAR/QSPR problem at hand and could be given by expert knowledge e.g.
in form of certain SMARTS2 patterns. The high relevance of such a pharmacophore mapping
for QSAR/QSPR models is also reported e.g. in [26, 27]. If atoms match more than one
SMARTS pattern, a structural feature consists of the smallest substructure that cannot be
further divided into subgroups with regard to all patterns. That means in our reduced graph we
may get a substructure node describing a ring only and another one describing both, a ring and
an acceptor. Two principal problems have to be solved to implement the reduced graph:
Firstly, if certain atoms are removed from the molecular graph, then we may obtain nodes,
which are disconnected to the rest of the graph. They have to be reconnected by new edges
again such that these new edges preserve the neighborhood information, i.e. if before we had
and and atom is removed, we should obtain . These new edges
should contain information on the topological and geometrical distance of the substructures
connected by them. Thereby the topological distance between two substructures is calculated
as the minimal topological distance between the atoms belonging to them, whereas the
geometrical distance is computed between the centers of gravity in order to conserve
1a → 2a 3a 3a
2a → 2a 1a →
2 Daylight Chemical Information Systems Inc., http://www.daylight.com
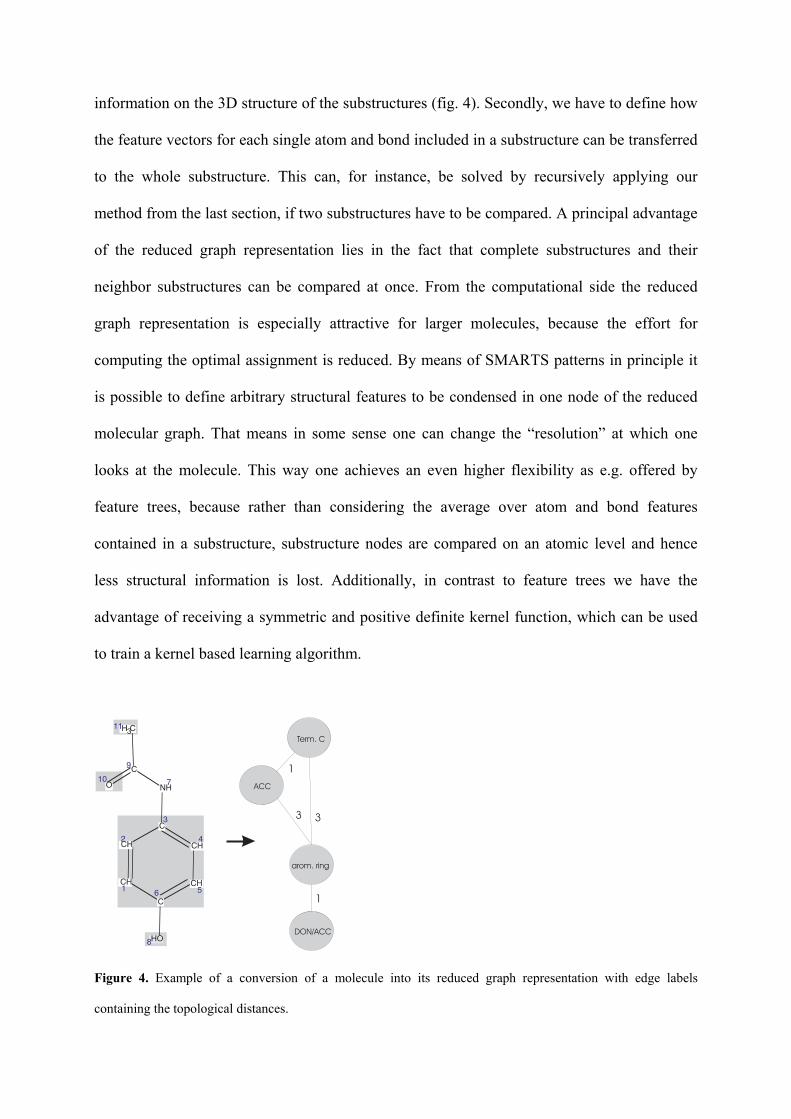
information on the 3D structure of the substructures (fig. 4). Secondly, we have to define how
the feature vectors for each single atom and bond included in a substructure can be transferred
to the whole substructure. This can, for instance, be solved by recursively applying our
method from the last section, if two substructures have to be compared. A principal advantage
of the reduced graph representation lies in the fact that complete substructures and their
neighbor substructures can be compared at once. From the computational side the reduced
graph representation is especially attractive for larger molecules, because the effort for
computing the optimal assignment is reduced. By means of SMARTS patterns in principle it
is possible to define arbitrary structural features to be condensed in one node of the reduced
molecular graph. That means in some sense one can change the “resolution” at which one
looks at the molecule. This way one achieves an even higher flexibility as e.g. offered by
feature trees, because rather than considering the average over atom and bond features
contained in a substructure, substructure nodes are compared on an atomic level and hence
less structural information is lost. Additionally, in contrast to feature trees we have the
advantage of receiving a symmetric and positive definite kernel function, which can be used
to train a kernel based learning algorithm.
Figure 4. Example of a conversion of a molecule into its reduced graph representation with edge labels
containing the topological distances.

3.2 Incorporation of Relevant Descriptor Information
For some QSAR/QSPR problems it is known that certain molecular descriptors are crucial.
E.g. for human intestinal absorption the polar surface area of molecules plays an important
role [15]. In some sense these descriptors describe global properties of a molecule, whereas
our kernel relies on the graph structure and hence on local properties of a molecule. It seems
obvious that if a-priori knowledge on certain relevant descriptors is available, then it should
be used for the QSAR/QSPR model. Naturally, descriptors of two molecules M and M’ can be
compared using a RBF kernel . On the other hand using the graph structure of M and M’
we receive an optimal assignment kernel (1), (2). Using the results from section 2.1 both
can simply be combined by taking the sum of them.
RBFk
Ak
4 Experiments
4.1 Datasets
The HIA (Human Intestinal Absorption) dataset consists of 164 structures from different
sources, which has been used in two earlier publications [16, 8] as a benchmark dataset for
descriptor selection. The dataset is a collection of Wessel et al. [7] (82 structures),
Gohlke/Kissel [37] (49 structures), Palm et al. [38] (8 structures), Balon et al. [39] (11
structures), Kansy et al. [40] (6 structures), Yazdanian et al. [41] (6 structures) and Yee [42]
(2 structures). The molecules are divided into 2 classes “high oral bio-availability” (106
structures) and “low oral bio-availability” (58 structures) based on a histogram binning [48].
After removing hydrogen atoms, the maximal molecule size was 57 and the average size 25

atoms. We considered one known relevant descriptor, the polar surface area [15]. The
descriptor information was calculated by means of the open source software JOELib3.
The Yoshida dataset [29] has 265 molecules that we divided into 2 classes “high bio-
availability” (bioavailability >= 50%, 159 structures) and “low bio-availability”
(bioavailability < 50%, 106 structures). The maximal molecule size was 36 and the average
size 20 atoms, after removing hydrogen.
The BBB dataset [43] consists of 109 structures having a maximal molecule size of 33 and an
average size of 16 atoms after removing hydrogen. The target is to predict the logBB value,
which describes up to which degree a drug can cross the blood-brain-barrier. We calculated
two descriptors (polar surface area and octane/water partition coefficient logP), which are
known to be relevant [15]. Again, both descriptors were computed by means of JOELib.
Finally, we investigated a set of 296 molecules published in [25] as a test dataset for the SOL
project4. The dataset consists of 4 different classes of inhibitors: thrombin inhibitors (75
molecules), serotonin inhibitors of the 5HT2 class (75 molecules), monoamine oxidase
inhibitors (71 molecules) and 5-hydroxytryptamine oxidase (75 molecules). The goal is to
learn the classification of the structures into these 4 categories. After removing hydrogen
atoms, the maximal molecules size was 48 and the average 28 atoms.
For comparison reasons for each dataset we computed a full descriptor model without making
any a-priori assumptions on the relevance of certain descriptors. This simulates a typical
situation in which there exists no prior knowledge on the problem. This way for the HIA
dataset we calculated 6603, for the Yoshida dataset 5867, for the BBB dataset 5607 and for
the SOL dataset 5774 descriptors. Thereby each descriptor set consists of all descriptors
available in MOE5 and JOELib. Besides others, the JOELib descriptors include the Radial
Distribution Function descriptor, the Moreau-Broto autocorrelation, the Global Topological
3 http://sourceforge.net/projects/joelib 4 Search and Optimization of Lead Structures (SOL), German Federal Ministry of Education and Research (bmb+f), contract no. 311681 5 MOE – Molecular Operating Environment, Chemical Computing Group Inc., 2003

Charge Index and Burden’s Modified Eigenvalues [17]. Thereby the descriptors are based on
the following atom properties: atom mass (tabulated), valence (calculated, based on graph
connectivity), conjugated environment (calculated, SMARTS based), van der Waals volume
(tabulated), electron affinity (tabulated), electro-negativity (tabulated, Pauling), graph
potentials (calculated, graph theoretical), Gasteiger-Marsili partial charges (calculated,
iterative), intrinsic state (calculated), electro-topological state (calculated), electro-
geometrical state (calculated). These atom properties were also used for the calculation of the
optimal assignment kernel (see also table 1 in the appendix).
Each dataset consists of energy-minimized structures using the MOE all-atom-pair force field
method [44], and was tested for duplicate molecules. Missing values in descriptors were
replaced by mean values, which corresponds to a maximum likelihood estimate.
4.2 Results
Before turning to the evaluation results, in figure 5 we show an optimal assignment calculated
by our method for the two example molecules, which were taken from the HIA dataset. As
one can see, the optimal assignment indeed nicely matches the ring atoms and the atoms of
the carbonyl groups and thus implements the intuition explained in the introduction.
Figure 5. Two molecules from the HIA dataset and the optimal assignment computed by our method.

Let us now turn to the evaluation of our method. We compared the optimal assignment kernel
(OA) from section 2 to a full descriptor model (DESC), a model where certain descriptors
were automatically selected by means of a descriptor selection algorithm (DESCSEL) and, in
case the corresponding information was available, a model based only on a few descriptors
known to be relevant for the problem by expert knowledge (EXPERT). As the descriptor
selection algorithm we chose the Recursive Feature Elimination (RFE) algorithm [30], which
is a wrapper algorithm especially designed for Support Vector Machines (SVMs) and is
known to give good results on QSAR/QSPR problems [16]. For the OA kernel the width of
the RBF kernels and were both set to , as the distance between two feature
vectors scaled to unit length can just be between 0 and 2. Furthermore, we explicitly set
to 0, if the element type of two atoms was different. Formally, this corresponds to the
multiplication with a so-called δ-kernel. The same was done for bonds, if one bond was in an
aromatic system and the other not, or if both bonds had a different bond order. The
probabilities to reach neighbors with topological distance l was set to
atomk
), '(p pl
bondk 0.52−
atomk
( )l
1L
−( ) '( )p p= =l l 1 l with . This allows us to consider the neighborhood of a whole 6-
ring of an atom.
3L =
We used a SVM on the HIA, Yoshida and SOL classification datasets and a Support Vector
Regression (SVR) [5, 6, 4] on the BBB regression problem trained either with our optimal
assignment kernel for the graph based or a usual RBF kernel for the descriptor based
representation. The prediction strength was evaluated by means of 10-fold cross-validation.
Thereby on the classification problems we ensured that the ratio of examples from both
classes in the actual training set was always the same (so called stratified cross-validation).
On each actual training fold a model selection for the necessary parameters was performed by
evaluating each candidate parameter set by an extra level of 10-fold cross-validation. For the
optimal assignment kernel the model selection included choosing the soft-margin parameter C

from the interval [2 , and on the BBB dataset additionally the width of the 2 14, 2 ]− ε -tube from
the interval [2 . For the descriptor based models we also tuned the width '8 ,− 12 ]− σ of the RBF
kernel in the range 'ˆ '/ 4, ˆ..., 4σ σ , where 'σ̂ was set such that (D =
dimensionality of the data). Furthermore, for the DESCSEL model we ran the RFE algorithm
to select a good subset of descriptors from all ones. Thereby the number of selected
descriptors was determined by an additional 10-fold cross-validation from {D, D/10, D/50,
D/100} on each actual training set. All descriptor values (also the logBB value in case of the
BBB dataset) were normalized to mean 0 and standard deviation 1 on each training fold, and
the calculated scaling parameters were then applied to normalize the descriptor values in the
actual testing set. Note that this is necessary to have strictly separate training and test sets.
2'ˆexp( /(2 0.1D σ− )) =
Table 2. 10-fold cross-validation error ± std. error. For the HIA, Yoshida and SOL dataset the classification loss
(%) is reported, for the BBB dataset we show the mean squared error × 10-2 and the mean squared correlation
(r2) between predicted and correct values (second row in brackets). Significant wins of the OA/OARG kernels
compared to the DESC or DESCSEL model at 10% significance level are marked by “*” and “**”, respectively;
losses by “-“ and “—“.
Method HIA Yoshida SOL BBB
DESC 21.43±3.79 33.18±3.24 7.77±1.42 70.51±10.05
(37.69±7.34)
DESCSEL 19.01±3.17 32.8±3.64 7.77±1.42 68.39±10.22
(39.38±7.36)
EXPERT 15.33±2.55* -- -- 38.1±5.38*,**
(65.28±6.08)
OA kernel 15.37±3.12*,** 31.74±3.25 1.69±0.05*,** 39.44±6.58*,**
(58.62±7.23)

OARG kernel 14.67±3.79*,** 32.18±3.23 3.02±0.78*,** 41.12±7.13*,**
(60.34±6.33)
OA + EXPERT 12.76±2.07* -- -- 38.56±5.17*,**
(58.18±7.64)
OARG + EXPERT 13.35±1.94*,** -- -- 34.27±3.64*,**
(65.74±5.84)
LITERATURE 15.76±2.54 [16] 40.00 [29] -- 23.04 [43]
(62.41)
Table 2 shows the results we obtained. Using our OA kernel we outperformed the DESC and
DESCSEL model statistically significant on all datasets except the Yoshida dataset, where we
also achieved a lower error rate, but the difference was not statistically significant. Thereby
statistical significance was tested by a two-tailed paired t-test at significance level 10%.
Furthermore, the results using our OA kernel were comparable to the EXPERT model (HIA
and BBB dataset), which demonstrates that our method already captures well the relevant
chemical and biological aspects that determine the similarity of molecules without using any
a-priori information.
We also investigated the effect of the reduced graph representation (OARG kernel) from
section 3. Thereby in the reduced graph representation only direct neighbors were considered
to compute (i.e. ), whereas for the comparison of nodes representing structural
elements we used as before. We considered the following pharmacophore features [47]
defined by SMARTS patterns: ring ([R]), donor ([$([NH2]-c),ND1H3,ND2H2,ND3H1,
ND2H1,$(Cl-[C,c]),$(Br-[C,c]),$(I-[C,c])]), donor or acceptor ([$([NH2]-C),$([OH]C),
$([OH]-c)]), acceptor ([$(N#C-[C,c]),OD1X1,OD2X2,ND3X3, ND2X2]), terminal carbon
([CH3,CD1H2,CD1H1]), positive ([+,++,+++]), negative ([-,--,---]). Molecules, which did
neik ' 1L =
3L =

not contain any of these features and hence lead to an empty graph, were removed. This
affected two molecules in the BBB dataset: N2 and C2HF3BrCl. As seen in table 2 the OARG
kernel lead to similar error rates than the original OA kernel. Again differences to the
DESC/DESCSEL models were significant. This shows that the reduced graph representation,
although using less structural information than the original OA kernel, covers well the
relevant biological and chemical aspects of the molecules in our data.
Next we investigated the effect of combining our method with expert provided descriptor
information. Thereby we just used a fixed width ˆ' 'σ σ= for the RBF kernel for the
descriptors. As shown in table 2 we obtained lower error rates for the OA and the OARG
kernel when combined with relevant descriptor information than without the incorporation of
this information (HIA and BBB dataset). However, the differences to the original OA/OARG
kernel were not statistically significant, which again underlines that our kernel already
contains most of the relevant information to guarantee state-of-the-art predictive performance.
We would like to point out that during all our evaluations we tried as carefully as possible to
estimate the true generalization performance of our QSAR/QSPR models reliably by using
10-fold cross-validation and computing normalization parameters on the training folds only.
Furthermore, we would like to emphasize the importance of statistical significance testing,
because otherwise comparing algorithmic performances is just based on random data
fluctuations.
A direct comparison of our classification/regression results to others from literature is quite
problematic, since first, not the same expert system to calculate descriptors is used, second,
the model is often evaluated using a single splitting into training and test set only, and third,
not the same learning algorithm to build the model is employed. We thus report these results
just for the sake of completeness in the last row of table 2 (LITERATURE). The
LITERATURE model on the HIA dataset is from one of our previous publications [16] using
the same data base, an older version of JOELIB and a SVM as a learning algorithm trained on
a set of 2929 descriptors. However, in contrast to here, normalization and model selection was
performed as a preprocessing step on the whole dataset there and thus results are not directly
comparable. In [29] the Yoshida dataset is handled as a 4 class problem. Doublets in the
dataset are not removed. Adaptive least squares is taken as the learning algorithm, which is
trained on a set of 232 molecules represented by 18 descriptors. The evaluation is done on a
separate test set of 40 structures. A direct comparison to the results reported here is
questionable. On the BBB dataset [43] the authors use a combined multiple linear regression
and spline model trained on 78 molecules using modified logP and polar surface area
descriptors and the molecular weight. Doublets in the dataset are not removed. The evaluation
is done on two test sets consisting of 14 and 23 compounds, respectively, where only the
second one was structurally diverse as the test sets used in our evaluation procedure. Hence,
we only show the result on the second test set in table 2. Again, a direct comparison is very
problematic, since no cross-validation was used and hence the reported estimate of the
generalization performance of the model is much less reliable than ours.
5 Conclusion
We introduced a new similarity score for chemical compounds based on a representation of
molecules as labeled graphs. This similarity score is a positive definite, symmetric kernel
function, which can be plugged into any kernel based Machine Learning algorithm, like e.g.
Support Vector Machines, Support Vector Regression, Kernel PLS [33] or others. The basic
idea of our optimal assignment kernel is to compute an optimal assignment of the atoms of
one molecule to those of another one, including information on neighborhood, membership to
certain structural elements and other characteristics. The optimal assignment can be computed
efficiently in O(n3) time. We showed how the inclusion of neighborhood information for each
single atom can be done efficiently via a recursive update equation, even if not only direct

neighbors are considered. Comparisons to a classical descriptor based approach showed a
significant improvement to models with and without automatic descriptor selection. At the
same time the performance is comparable to a model only containing descriptor information,
which is a-priori known to be relevant for the QSAR/QSPR problem at hand. Thereby it is
important to point out that in contrast to such an expert model, with our method we did not
use any problem dependent knowledge, i.e. there was no data dependent adaptation. We think
that this is a special benefit of our approach as it guarantees a unified, highly flexible, easy
and fast way to obtain reliable QSAR/QSPR models. We would like to add the remark that the
computation of the kernel function can be done very quickly: Using our JAVA
implementation on a Pentium IV 3GHz desktop PC one kernel evaluation on the HIA dataset
on average took 10±9 ms, on the Yoshida dataset 7±4 ms, on the SOL dataset 6±4 ms and on
the BBB dataset 6±9 ms.
We investigated two major extensions of our approach: the usage of a reduced graph
representation, in which certain structural elements are collapsed into a single node of the
molecular graph and hence allow to view molecules at different user-specified levels of
resolution, and the incorporation of descriptor information known to be relevant to the
QSAR/QSPR problem at hand. We showed that the latter in tendency leads to a further
reduction of the prediction error rate, whereas the major benefit of the reduced graph
representation lies in the fact that expert knowledge on important structural features can be
included.
There are several directions of future research concerning our optimal assignment kernels:
Besides a more systematic investigation of methods to incorporate knowledge on relevant
descriptors, e.g. by means of kernel CCA [31, 32] or semidefinite programming [12], one
could use our kernel to deduce pharmacophores on a dataset. Especially for this purpose the
reduced graph representation would be beneficial. The possibility of our method to use
arbitrary atom and bond features opens a rich field of potential information, which could be

incorporated. Thereby an important topic is the question how problem relevant atom and bond
features can be automatically selected among a candidate set of features.
All in all we think that the definition of kernel functions for chemical compounds opens a new
perspective in QSAR/QSPR modeling via kernel based learning algorithms, which are today
the state-of-the-art methods for data analysis. Rather than trying to find the most appropriate
description for a single molecule, in our approach we concentrate on the definition of kernels
between them. This is an important difference, because last but not least kernel based learning
algorithms work by comparing objects, and hence having a good similarity measure is the key
for getting high a predictive performance.
References
[1] Blum, A. L.; Langley, P, Selection of Relevant Features and Examples in Machine
Learning, Artificial Intelligence 1997, 97, 245 - 271.
[2] Cortes, C.; Vapnik, V., Support vector networks, Machine Learning 1995, 20, 273 - 297.
[3] Davies, S.; Russel, S. NP-Completeness of Searches for Smallest Possible Feature Sets, in:
Proc. 1994 AAAI Fall Symposion on Relevance, 1994, pp. 37 - 39.
[4] Schölkopf, B.; Smola, A. J., Learning with Kernels; MIT Press, Cambridge, MA, 2002.
[5] Vapnik, V., The Nature of Statistical Learning Theory; Springer, New York, 1995.
[6] Vapnik, V., Statistical Learning Theory; John Wiley and Sons, New York, 1998.
[7] Wessel, M. D.; Jurs, P. C.; Tolan, J. W.; Muskal, S. M. J., Prediction of Human Intestinal
Absorption of Drug Compounds from Molecular Structure, Chem. Inf. Comput. Sci. 1998, 38,
726 - 735.
[8] Wegner, J.; Fröhlich, H.; Zell, A., Feature Selection for Descriptor based Classification
Models: Part I - Theory and GA-SEC Algorithm, J. Chem. Inf. Comput. Sci. 2003, 44, 921 -
930.

[9] Wolpert, D.; Macready, W., No Free Lunch Theorems for Search, Technical Report SFI
TR-95-02-010, Santa Fee Institute, 1995.
[10] Wolpert, D.; Macready, W., No Free Lunch Theorems for Optimization, in: Proc. IEEE
Transactions on Evolutionary Computation 1997, 1, pp. 67 – 82.
[11] Byvatov, E.; Fechner, U.; Sadowski, J.; Schneider, G., Comparison of Support Vector
Machine and Artificial Neural Network Systems for Drug/Nondrug Classification, J. Chem.
Inf. Comput. Sci. 2003, 43, 1882 - 1889.
[12] Lanckriet, G.; Cristianini, N.; Bartlett, P.; Ghaoui, L. E.; Jordan, M., Learning the kernel
matrix with semidefinite programming., J. Machine Learning Research 2004, 5, 27 - 72.
[13] Vishwanathan, S.; Smola, A., Fast Kernels for String and Tree Matching, in: Schölkopf,
B.; Tsuda, K.; Vert, J.-P. (Eds.), Kernel Methods in Computational Biology, MIT Press,
Cambridge, MA, 2004.
[14] Leslie, C.; Kuang, R.; Eskin, E. Inexact Matching String Kernels for Protein
Classfication, in: Kernel Methods in Computational Biology, Schölkopf, B.; Tsuda, K.; Vert,
J.-P. (Eds.), MIT Press, Cambridge, MA, 2004.
[15] van de Waterbeemd, H.; Gifford, E., ADMET In Silico Modelling: Towards Prediction
Paradise?, Nature Reviews: Drug Discovery 2003, 2, 192 - 204.
[16] Fröhlich, H.; Wegner, J. K.; Zell, A., Towards Optimal Descriptor Subset Selection with
Support Vector Machines in Classification and Regression, QSAR Comb. Sci. 2004, 23, 311 -
318.
[17] Todeschini, R.; Consonni, V. (Eds.), Handbook of Molecular Descriptors, Wiley-VCH,
Weinheim, 2000.
[18] Gasteiger, J.; Marsili, M., A New Model for Calculating Atomic Charges in Molecules,
Tetrahedron Lett. 1978, 34, 3181 - 3184.
[19] Maggiora, G.; Shanmugasundaram, V., Molecular Similarity Measures, in: Bajorath, J.
(Ed.), Chemoinformatics, Humana Press, 2004.

[20] Carhart, R.; Smith, D.; Venkataraghavan, R., Atom pairs as molecular features in
structure activity studies: Definition and applications, J. Chem. Inf. Comput. Sci. 1985, 25, 64
- 73.
[21] Raymond, J.; Gardiner, E.; Willett, P.; Rascal, P., Calculation of graph similarity using
maximum common edge subgraphs, The Computer Journal 2002, 631 - 644.
[22] Kuhn, H., The hungarian method for the assignment problem, Naval Res. Logist. Quart.,
1955, 2, 83 - 97.
[23] Rarey, M.; Dixon, S., Feature trees: A new molecular similarity measure based on tree
matching, J. Computer-Aided Molecular Design 1998, 12, 471 - 490.
[24] Feher, M.; Sourial, E.; Schmidt, A simple model for the prediction of blood-brain
partitioning, J. Int. J. Pharmaceut. 2000, 201, 239 - 247.
[25] Abolmaali, S.; Ostermann, C.; Zell, A., The compressed feature matrix - novel descriptor
for adaptive similarity search, J. Mol. Model. 2003, 9, 66 - 75.
[26] Chen, X.; Rusinko, A.; Tropsha, A.; Young, S., Automated Pharmacophore Identification
for Large Chemical Data Sets, J. Chem. Inf. Comput. Sci. 1999, 39, 887 - 896.
[27] Oprea, T. I.; Zamora, I.; Ungell, A.-L., Pharmacokinetically based mapping device for
chemical space navigation, J. Comb. Chem. 2002, 4, 258 - 266.
[28] Martin, Y. C., Pharmacophore mapping, Des. Bioact. Mol. 1998, 121 - 148.
[29] Yoshida, F.; Topliss, J., QSAR model for drug human oral bioavailability, J. Med. Chem.
2000, 43, 2575 - 2585.
[30] Guyon, I.; Weston, J.; Barnhill, S.; Vapnik, V., Gene Selection for Cancer Classification
using Support Vector Machines, Machine Learning 2002, 46, 389 - 422.
[31] Bach, F.; Jordan, M., Kernel independent component analysis, J. Machine Learning
Research 2002, 3, 1 - 48.
[32] Lai, P.; Fyfe, C., Kernel and nonlinear canonical correlation analysis, Int. Journal of
Neural Systems 2000, 10, 365 - 377.

[33] Rosipal, R.; Trejo, L., Kernel partial least squares regression in reproducing kernel
Hilbert space, J. Machine Learning Research 2001, 2, 97 - 123.
[34] Fröhlich, H.; Wegner, J.; Sieker, F.; Zell, A., Optimal Assignment Kernels For Attributed
Molecular Graphs, in: Proc. 22nd Int. Conf. Machine Learning, 2005, to appear.
[35] Kashima, H.; Tsuda, K; Inokuchi, A., Marginalized kernels between labeled graphs, in:
Proc. 20th Int. Conf. on Machine Learning, 2003.
[36] Shawe-Tylor, J.; Cristianini, N, Kernel Methods for Pattern Analysis, Cambridge
University Press, 2004.
[37] Gohlke, H.; Dullweber, F.; Kamm, W.; März, J.; Kissel, T.; Klebe, G., Prediction of
human intestinal absorption using a combined 'simmulated annealing/backpropagation neural
network' approach, Rational Approaches Drug Des. 2001, 261 - 270.
[38] Palm, K.; Stenburg, P.; Luthman, K.; Artursson, P., Polar molecular surface properties
predict the intestinal absorption of drugs in humans, Pharam. Res. 1997, 14, 586 - 571.
[39] Balon, K.; Riebesehl, B.; Müller, B., Drug liposome partitioning as a tool for the
prediction of human passive intestinal absorption, Pharam. Res. 1999, 16, 882 - 888.
[40] Kansy, M.; Senner, F.; Gubernator, K., Physicochemical high throughput screening:
Parallel artificial membrane permeation assay in the description of passive absorption
processes, J. Med. Chem. 1998, 41, 1007 - 1010.
[41] Yazdanian, M.; Glynn, S.; Wright, J.; Hawi, A., Correlating partitioning and caco-2 cell
permeability of structurally diverse small molecular weight compounds, Pharm. Res. 1998,
15, 1490 - 1494.
[42] Yee, S., In vitro permeability across caco-2 cells (colonic) can predict in vivo (small
intestinal) absorption in man - fact or myth?, Pharam. Res. 1997, 14, 763 - 766.
[43] Hou, T.; Xu, X., ADME evaluation in drug discovery. 3. Modelling Blood-Brain Barrier
Partitioning Using Simple Molecular Descriptors, J. Chem. Inf. Comput. Sci. 2003, 43(6),
2137 - 2152.

[44] Martin, Y.; Kofron, J., Traphagen, L., Do Structurally Similar Molecules Have Similar
Biological Activity?, J. Med. Chem. 2002, 45, 4350 – 4358.
[45] Bonchev, D.; Rouvray, D. H. (Eds.), Chemical Graph Theory: Introduction and
Fundamentals; Gordon and Breach Science Publishers, London, UK, 1990.
[46] Figueras, J., Ring Perception Using Breadth-Firsth Search, J. Chem. Inf. Comput. Sci.
1996, 36, 986 – 991.
[47] Böhm, M.; Klebe, G., Development of New Hydrogen-Bond Descriptors and Their
Application to Comparative Molecular Field Analysis, J. Med. Chem. 2002, 45, 1585 – 1597.
[48] Wegner, J.; Fröhlich, H.; Zell, A., Feature Selection for Descriptor based Classification
Models: Part II – Human Intestinal Absorption, J. Chem. Inf. Comput. Sci., 2003, 44, 931 -
939.
[49] Mehlhorn, K.; Näher, S., The LEDA Platform of Combinatorial and Geometric
Computing; Cambridge University Press, 1999.
Appendix
A Tabular Material
Table 1. Atom and bond features chosen in our experiments.
features nominal real valued
atom element type, in donor, in acceptor,
in donor or acceptor [47], in terminal
carbon, in aromatic system [45],
negative/positive, in ring [46], in
conjugated environment, free
electrons, implicit valence, heavy
electro-topological state [17],
Gasteiger/Marsili partial charge [18], mass,
graph potentials [17], electron-affinity, van
der Waals volume, electro-geometrical state
[17], electro-negativity (Pauling), intrinsic
state [17]

valence, hybridization, is chiral, is
axial
bond order, in aromatic system [45], in
ring [46], is rotor, in carbonyl/amide/
primary amide/ester group
geometric length
B Figure Captions
Figure 1. Matching regions of two molecular structures.
Figure 2. Direct and indirect neighbors of atom 3 in the left and atom 5 in the right molecule.
Figure 3. Possible assignments of atoms from molecule 2 to those of molecule 1. The kernel function k measures
the similarity of a pair of atoms including information on structural and chemical properties. The goal is
to find the optimal assignment, which maximized the overall similarity score, i.e. the sum of edge weights in the
bipartite graph, where each edge can be used at most once.
( , ')i ja a
Figure 4. Example of a conversion of a molecule into its reduced graph representation with edge labels
containing the topological distances.
Figure 5. Two molecules from the HIA dataset and the optimal assignment computed by our method.
Top Related
Copyright © 2022 FDOKUMEN

