

Bahasa
Halaman
Hukum

BioMed CentralBMC Plant Biology
ss
Open AcceResearch articleIsolation and characterization of novel microsatellite markers and their application for diversity assessment in cultivated groundnut (Arachis hypogaea)Luu M Cuc1,2, Emma S Mace1,3, Jonathan H Crouch1,4, Vu D Quang2, Tran D Long5 and Rajeev K Varshney*1Address: 1International Crop Research Institute for the Semi Arid Tropics (ICRISAT), Patancheru- 502 324, Greater Hyderabad, Andhra Pradesh, India, 2Agriculture Genetics Institute, Vietnamese Academy Agriculture Science, Van Dien, Thanh Tri, Hanoi, Vietnam, 3Department of Primary Industries & Fisheries, Hermitage Research Station, 604 Yangan Road, Warwick, QLD 4370, Australia, 4International Wheat and Maize Improvement Centre (CIMMYT), Apdo. Postal 6-641, 06600 Mexico, D.F., Mexico and 5Vietnamese Academy Agriculture Science, Van Dien, Thanh Tri, Ha Noi, Vietnam
Email: Luu M Cuc - [email protected]; Emma S Mace - [email protected]; Jonathan H Crouch - [email protected]; Vu D Quang - [email protected]; Tran D Long - [email protected]; Rajeev K Varshney* - [email protected]
* Corresponding author
AbstractBackground: Cultivated peanut or groundnut (Arachis hypogaea L.) is the fourth most important oilseedcrop in the world, grown mainly in tropical, subtropical and warm temperate climates. Due to its originthrough a single and recent polyploidization event, followed by successive selection during breedingefforts, cultivated groundnut has a limited genetic background. In such species, microsatellite or simplesequence repeat (SSR) markers are very informative and useful for breeding applications. The low level ofpolymorphism in cultivated germplasm, however, warrants a need of larger number of polymorphicmicrosatellite markers for cultivated groundnut.
Results: A microsatellite-enriched library was constructed from the genotype TMV2. Sequencing of 720putative SSR-positive clones from a total of 3,072 provided 490 SSRs. 71.2% of these SSRs were perfecttype, 13.1% were imperfect and 15.7% were compound. Among these SSRs, the GT/CA repeat motifswere the most common (37.6%) followed by GA/CT repeat motifs (25.9%). The primer pairs could bedesigned for a total of 170 SSRs and were optimized initially on two genotypes. 104 (61.2%) primer pairsyielded scorable amplicon and 46 (44.2%) primers showed polymorphism among 32 cultivated groundnutgenotypes. The polymorphic SSR markers detected 2 to 5 alleles with an average of 2.44 per locus. Thepolymorphic information content (PIC) value for these markers varied from 0.12 to 0.75 with an averageof 0.46. Based on 112 alleles obtained by 46 markers, a phenogram was constructed to understand therelationships among the 32 genotypes. Majority of the genotypes representing subspecies hypogaea weregrouped together in one cluster, while the genotypes belonging to subspecies fastigiata were groupedmainly under two clusters.
Conclusion: Newly developed set of 104 markers extends the repertoire of SSR markers for cultivatedgroundnut. These markers showed a good level of PIC value in cultivated germplasm and therefore wouldbe very useful for germplasm analysis, linkage mapping, diversity studies and phylogenetic relationships incultivated groundnut as well as related Arachis species.
Published: 15 May 2008
BMC Plant Biology 2008, 8:55 doi:10.1186/1471-2229-8-55
Received: 22 February 2008Accepted: 15 May 2008
This article is available from: http://www.biomedcentral.com/1471-2229/8/55
© 2008 Cuc et al; licensee BioMed Central Ltd. This is an Open Access article distributed under the terms of the Creative Commons Attribution License (http://creativecommons.org/licenses/by/2.0), which permits unrestricted use, distribution, and reproduction in any medium, provided the original work is properly cited.
Page 1 of 11(page number not for citation purposes)
BMC Plant Biology 2008, 8:55 http://www.biomedcentral.com/1471-2229/8/55
BackgroundThe cultivated peanut or groundnut, Arachis hypogaea L.,(2n = 4x = 40) is a major crop in most tropical and sub-tropical areas of the world, with 68% of groundnut culti-vated world-wide produced in Asia (23 Mt), 24% in Africa(8 Mt) and the remaining 8% (3.5 Mt) from North Amer-ica, the Caribbean, Europe and Oceania [1]. The seeds areused for direct human consumption, and as an oil andprotein source [2]. Additionally, plant residues areextremely important as fodder for cattle in many regionsof the world [3]. The crop is becoming increasingly impor-tant as an income source in tree plantations before treecrops mature. In Africa and Asia, groundnut is inter-cropped between maize, sorghum, and soybean or, in afew areas, between mature coconut trees [4].
In contrast to the wealth of phenotypic diversity observedwithin cultivated groundnut, the genetic diversityobserved to date within the cultivated gene-pool is muchlower. This low level of genetic variation in cultivatedgroundnut is attributed to its origin from a single poly-ploidization event that occurred relatively recently on anevolutionary time scale [5]. However, additional contrib-uting factors to the low levels of molecular polymorphismobserved to date could be the marker techniques used andthe amount of diversity of samples tested [6].
Molecular markers, in general, and microsatellites or sim-ple sequence repeats (SSRs) in particular have proven veryuseful for crop improvement in many species [7]. Ingroundnut, the use of molecular markers for breedingapplications, however, has been limited by the low levelof the genetic variation in this species. Nevertheless, inrecent years, significant efforts have been made to developthe SSR markers in groundnut [8-10]. Development ofSSR markers traditionally requires cloning and sequenc-ing and hence is more cost and labour-intensive, com-pared to PCR arbitrary priming techniques e.g. randomlyamplified polymorphic DNAs (RAPDs), amplified frag-ment length polymorphism (AFLP) [7]. However, oncethe SSR markers are developed, their applications inbreeding activities particularly using high throughputapproaches becomes very cost effective. To isolate theSSRs from genomic DNA libraries, several approaches forcreating SSR-enriched genomic libraries have been devel-oped, with SSR selection either before [11-13] or aftergenomic library construction [14].
By using different approaches, > 500 SSRs have beendeveloped in groundnut [15]. By using these SSR markers,good progress has been made in developing the geneticmaps and diversity studies in AA- and BB-genome ground-nut species [8,9,16-22]. In case of cultivated germplasm,however, these SSR markers showed very low level of pol-ymorphism [8,19-22]. This is one of the reasons that
despite the availability of moderate number of SSR mark-ers in groundnut, not a single genetic map based on culti-vated germplasm has been published so far. To overcomethe low level of polymorphism, one of simple solutionswill be to develop a critical number of SSR markers ingroundnut so that a repertoire of about 200–300 poly-morphic SSR markers for cultivated groundnut germ-plasm may be available.
The present study was initiated in order to isolate andcharacterize new microsatellite markers from groundnut,following a microsatellite enriched genomic libraryapproach. The overall aim of this study is to enhance therepertoire of polymorphic SSR markers for cultivatedgroundnut germplasm so that genetic mapping and traitmapping could be feasible in cultivated groundnut.
Results and DiscussionSSR-enriched libraryThe SSR enriched library was constructed from the geno-type TMV2 following by modified method of Fischer andBachmann [23]. This library was enriched for CA and CTSSR repeat motifs. From this library, 3,072 clones werepicked from 32 96-well plates. Hybridization of theseclones with digoxigenin-labeled SSR probes (CA and CT)provided 720 (23.4%) putatively positive clones.Sequencing of these clones indicated the insert size in therange of 50 bp to 792 bp with an average size of 309 bp.Majority of clones (43.9%) contained the insert of moder-ate size (200 bp-400 bp) while 34.6% clones containedsmall inserts (50 bp-200 bp) and 21.5% clones containedinserts of > 500 bp.
Analysis of sequence data mentioned above with TandemRepeat Finder (TRF) had 490 (68%) clones which con-tained one or more SSRs. The efficiency of the enrichmentprocedure for the constructed library was higher as com-pared to other SSR isolation studies of groundnut. Like thepresent study, 61% of clones were found to contain SSRsin the study of He and colleagues [20], 56% clones hadSSRs in the study of Gimenes and colleagues [18] and43.7% clones were reported to contain SSRs by Wang andcolleagues [24]. However very low enrichment efficiency(10% to 31%) were obtained in some other librariesenriched for SSRs [8,9,21]. Indeed, this enrichment effi-ciency depends on many factors including the choice ofrestriction enzyme used for library construction, the SSRprobes used for enrichment, etc. The approach used in thepresent study seems to be the most efficient enrichmentstrategy for SSR isolation in groundnut.
A redundancy level of 26% in the SSR-enriched genomiclibrary was observed through multiple sequence align-ment analysis using the ClustalW programme; in total 5copies of one clone was observed, 4 copies of five clones,
Page 2 of 11(page number not for citation purposes)
BMC Plant Biology 2008, 8:55 http://www.biomedcentral.com/1471-2229/8/55
3 copies of 10 clones and 2 copies of 65 clones. The rateof redundant SSR-containing clones was found to be com-parable (26%) to other studies utilizing microsatellite-enriched genomic libraries in other plant species, e.g.,olive tree (Olea europaea L., 16.6%) [25], onion (Alliumcepa L. 24.3%) [23]. As compared to SSR isolation studiesin groundnut where upto 67% redundancy has beenobserved [8,20,21], the strategy employed in the presentstudy seems to be quite effective to isolate a higher pro-portion of novel and unique SSRs. Observed level ofredundancy in this study could be explained due to theexistence of multiple copies of some SSRs in the ground-nut genome, which may be present on both the A and Bgenomes within cultivated A. hypogaea. The bias observedfor some SSRs being repeated in multiple clones couldalso be explained by the fact that during the enrichmentprocedure (adaptor ligation, amplification of single-strand enriched DNA, bacterial growth before plating)some fragments can be arbitrarily selected over the rest.
Despite the addition of excess adapter during the enrich-ment procedures, 7.2% of clones were identified as con-catenates, generated during the initial restriction/ligationstep, by the presence of internal RsaI and MluI restrictionsites. Another type of concatenation may be formed dur-ing the PCR step of the enrichment cloning procedure[27]. Such chimeras usually remain undetected and mayresult in the failure of some primer pairs to amplifygenomic DNA templates in the evaluation of primers [28].
Occurrence and features of SSRsSequence analysis of 720 clones showed the presence ofone or more SSRs in 490 (68%) clones. Following the def-initions of Weber [29], 71.2% of the SSRs identified wereperfect, 13.1% were imperfect (when SSRs are interruptedby few bases) and 15.7% were compound (when morethan one SSRs are spaced by few base pairs) with 9.8%being compound perfect and 5.9% being compoundimperfect. Similar kind of distribution of different SSRclasses was observed in different SSR isolation studies ingroundnut [8,9,18].
In terms of the repeat motifs, the GT/CA repeat motif wasthe most common, accounting for 37.6% of all repeattypes, followed by GA/CT repeat at 25.9%. The previoussurveys carried out on microsatellite abundance in plantgenomes have shown AT as the most frequently occurringdinucleotide repeat motifs followed by AG/CT and GT/CA[30-34]. The AT repeat is self-complementary and is diffi-cult to screen for by colony hybridization, hence thelibrary was not enriched for AT. Abundance of GA/CT,GT/CA, AT and ATT repeat motifs in isolated SSRs ingroundnut in the present study is in agreement with ear-lier reports on isolation of SSRs in groundnut [8,9,20,24].The use of separate GA and GT filters could increase the
ability of detecting perfect GA/CT and GT/CA repeatmotifs or the frequency of the repeats, in comparison tousing mixtures of different repeat motifs in the samehybridization. However several studies have shown theretrieval of higher proportion of compound SSRs (upto75%) when the library was enriched using a mixture ofdifferent SSR oligos [18,35,36].
The maximum repeat unit number of dinucleotide repeatmotifs of GT/CA and GA/CT were 48 and 50 units, respec-tively; the overall repeat motif number ranging from 7 to50. In fact, in some studies, the markers developed forlonger repeat motifs were found more informative fordetection of polymorphism in cultivated groundnutgermplasm [9]. In addition to GT and GA repeats contain-ing SSRs, several SSRs containing the repeat motifs-(AAG)n, (CAA)n, (TAA)n, (TTG)n, (GTT)n, (TTC)n, (CCT)n,(AAAG)n, (TTTC)n, (TTCTC)n, (CTTTT)n, (CTCTTT)n and(GTGTTT)n with 2–11 repeat numbers were also isolated.It was interesting to note that most of the clones contain-ing these repeats had an additional repeat of GT/CA orGA/CT. Gimenes and colleagues [18] also observed 37%SSRs with different repeats, like in the present study, thatwere not totally complementary sequences to the oligo-nucelotide probes used. However, the repeat motif ATT ishighly abundant and informative in several legume spe-cies like soybean [37], chickpea [38] and pea [39] was notobserved abundant in the present study. In case ofgroundnut, many reports are available on isolation anddistribution of SSRs, only two studies [8,9] indicated theabundance of AAT repeat motifs. In the present study, asonly 720 clones sequenced were selected randomly fromthe set of 3072 clones, probably sequencing of largernumber of clones could have showed the abundance ofAAT repeat motifs.
Marker developmentSSR containing sequences were used for primer designingusing Primer3 programme. Following the standard crite-ria: primer length- 18–27 bp; Tm- 57–63°C; GC content– 40–60%, maximum Tm difference between forward andreverse primer – 1.5°C, primer pairs were designed for170 SSR containing clones [see Additional file 1]. Of thisset, 47.1% primer pairs were designed for perfect repeats,18.2% for imperfect repeats while the remaining 34.7%for compound repeats. For the remaining sequences, theprimer designing could not be possible as in some casessequence quality was poor while in some cases the SSRswere too near the start or end of the insert. The percentageof primers designed, in relation to the number of clonessequenced (23.6%) is higher than some studies ingroundnut like Moretzsohn and colleagues [9] (10.5%),He and colleagues [20] (14.0%) and Ferguson and col-leagues [8] (21.3%) while lower than some other reportssuch as Moretzsohn and colleagues [21] (41.4%) and
Page 3 of 11(page number not for citation purposes)
BMC Plant Biology 2008, 8:55 http://www.biomedcentral.com/1471-2229/8/55
Wang and colleagues [24] (43.7%). This may be attrib-uted to the size range of insert, the restriction enzymeused for genomic DNA library construction and theapproach used for SSR enrichment, etc. [7].
Newly designed SSR markers were tested for amplificationon two genotypes i.e. TMV2 and ICG 99001. Of this set,only 104 (61.2%) primer pairs yielded the scorable ampli-con in the genotypes examined (Table 1). The functional-ity of the primer pairs is comparatively lower than thestudies of Ferguson and colleagues [8] and Moretzsohnand colleagues [9] who observed amplification in 84.9%and 81.6% cases, respectively. It is noteworthy that severalPCR profiles and PCR optimization strategies wereadopted in above mentioned studies, however in thepresent study to save costs and time, PCR conditions fornon-amplifiable markers were not optimized repeatedly.Out of 104 working primers, 89 (85.6%) primer pairswere optimized on 65°C -60°C touch down profile, 14(13.5%) primer pairs optimized on 60°C -55°C touchdown profile while only one (0.9%) primer pair was opti-mized on 55°C -45°C specific profiles. It is quite likely toincrease the rate of functionality of newly developedmarkers by using different PCR conditions and profiles.
It is also noted that the markers for less than 20 repeatunits produced amplicons in about 73% cases, while themarkers containing the higher number of repeat units (>20) yielded amplicon in 16.7% – 54.5% cases only. It ispossible that higher number of repeat units make the Taqpolymerase unstable that makes it unable to extend along-with the template DNA [7].
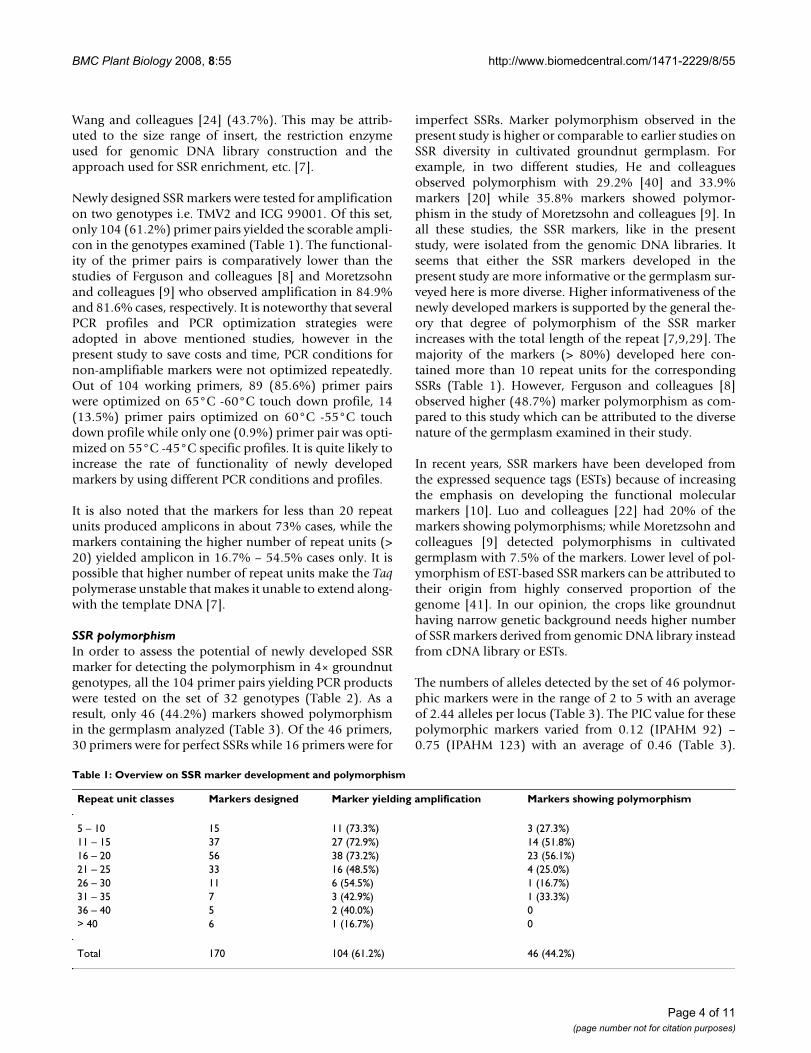
SSR polymorphismIn order to assess the potential of newly developed SSRmarker for detecting the polymorphism in 4× groundnutgenotypes, all the 104 primer pairs yielding PCR productswere tested on the set of 32 genotypes (Table 2). As aresult, only 46 (44.2%) markers showed polymorphismin the germplasm analyzed (Table 3). Of the 46 primers,30 primers were for perfect SSRs while 16 primers were for
imperfect SSRs. Marker polymorphism observed in thepresent study is higher or comparable to earlier studies onSSR diversity in cultivated groundnut germplasm. Forexample, in two different studies, He and colleaguesobserved polymorphism with 29.2% [40] and 33.9%markers [20] while 35.8% markers showed polymor-phism in the study of Moretzsohn and colleagues [9]. Inall these studies, the SSR markers, like in the presentstudy, were isolated from the genomic DNA libraries. Itseems that either the SSR markers developed in thepresent study are more informative or the germplasm sur-veyed here is more diverse. Higher informativeness of thenewly developed markers is supported by the general the-ory that degree of polymorphism of the SSR markerincreases with the total length of the repeat [7,9,29]. Themajority of the markers (> 80%) developed here con-tained more than 10 repeat units for the correspondingSSRs (Table 1). However, Ferguson and colleagues [8]observed higher (48.7%) marker polymorphism as com-pared to this study which can be attributed to the diversenature of the germplasm examined in their study.
In recent years, SSR markers have been developed fromthe expressed sequence tags (ESTs) because of increasingthe emphasis on developing the functional molecularmarkers [10]. Luo and colleagues [22] had 20% of themarkers showing polymorphisms; while Moretzsohn andcolleagues [9] detected polymorphisms in cultivatedgermplasm with 7.5% of the markers. Lower level of pol-ymorphism of EST-based SSR markers can be attributed totheir origin from highly conserved proportion of thegenome [41]. In our opinion, the crops like groundnuthaving narrow genetic background needs higher numberof SSR markers derived from genomic DNA library insteadfrom cDNA library or ESTs.
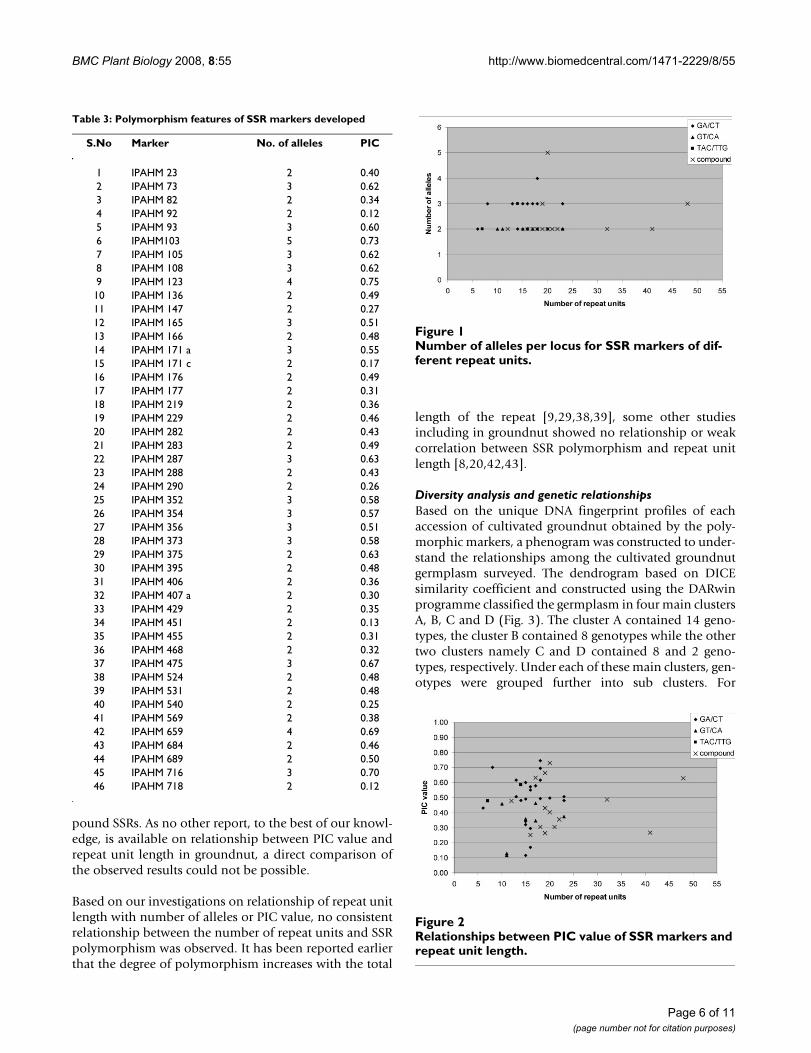
The numbers of alleles detected by the set of 46 polymor-phic markers were in the range of 2 to 5 with an averageof 2.44 alleles per locus (Table 3). The PIC value for thesepolymorphic markers varied from 0.12 (IPAHM 92) –0.75 (IPAHM 123) with an average of 0.46 (Table 3).
Table 1: Overview on SSR marker development and polymorphism
Repeat unit classes Markers designed Marker yielding amplification Markers showing polymorphism
5 – 10 15 11 (73.3%) 3 (27.3%)11 – 15 37 27 (72.9%) 14 (51.8%)16 – 20 56 38 (73.2%) 23 (56.1%)21 – 25 33 16 (48.5%) 4 (25.0%)26 – 30 11 6 (54.5%) 1 (16.7%)31 – 35 7 3 (42.9%) 1 (33.3%)36 – 40 5 2 (40.0%) 0> 40 6 1 (16.7%) 0
Total 170 104 (61.2%) 46 (44.2%)
Page 4 of 11(page number not for citation purposes)
BMC Plant Biology 2008, 8:55 http://www.biomedcentral.com/1471-2229/8/55
When looking at SSR classes and motifs, the trinucleotideSSRs showed higher allele numbers (average 2.5 perlocus) and PIC values (average 0.53 per marker) followedby dinucleotide (average alleles- 2.45 per locus; PIC value-average 0.45 per marker) and compound SSRs (averagealleles- 2.35 per locus; PIC value- average 0.44 permarker). Among dinucleotide SSRs, GA/CT repeat motifsexhibited more informativeness (average alleles- 2.6 perlocus and PIC value- average 0.50 per marker) as com-pared to GT/CA repeat motifs (average alleles- 2.0 perlocus and PIC value- average 0.33 per marker). Fergusonand colleagues [8] as well as Moretzsohn and colleagues[9] observed higher informativeness of GA/CT repeatmotifs. Therefore to develop more polymorphic markersfor cultivated groundnut, we propose to isolate anddevelop the GA/CT repeat based SSR markers.
To understand the possible relationship between poly-morphism of SSR markers with the repeat unit length ofthe corresponding SSRs, two scatter plots were madebetween repeat unit length and number of alleles detected(Fig. 1) and the PIC value calculated (Fig. 2). The scatter
plot between number of alleles and repeat unit lengthshows the widest variation in number of alleles wasbetween 13 and 20 repeats and a lower number of allelesfound in the low number or very high number repeats.However it does not provide any conclusive relationshipsbetween the number of alleles and repeat unit length asindicated by Ferguson and colleagues [8] and Moretzsohnand colleagues [9] that loci with longer repeats are muchmore likely to be more variable. Indeed, among the poly-morphic SSR markers, the IPAHM 147 marker containinghighest number of repeat units (41) provided just 2 alleleswhile the IPAHM 103 markers with 20 repeat units longSSR revealed the highest number of alleles (5). This is pos-sible as the majority of the polymorphic SSR markersdetected 2 and 3 alleles in the present study.
The scatter plot between PIC value and repeat unit lengthindicates that the higher PIC values (> 0.50) were between13 and 20 repeats while lower PIC values were found inthe low number (< 13) or very high number (> 20)repeats. It is noteworthy that the relationship appeared tobe SSR class specific as it was more consistent for the com-
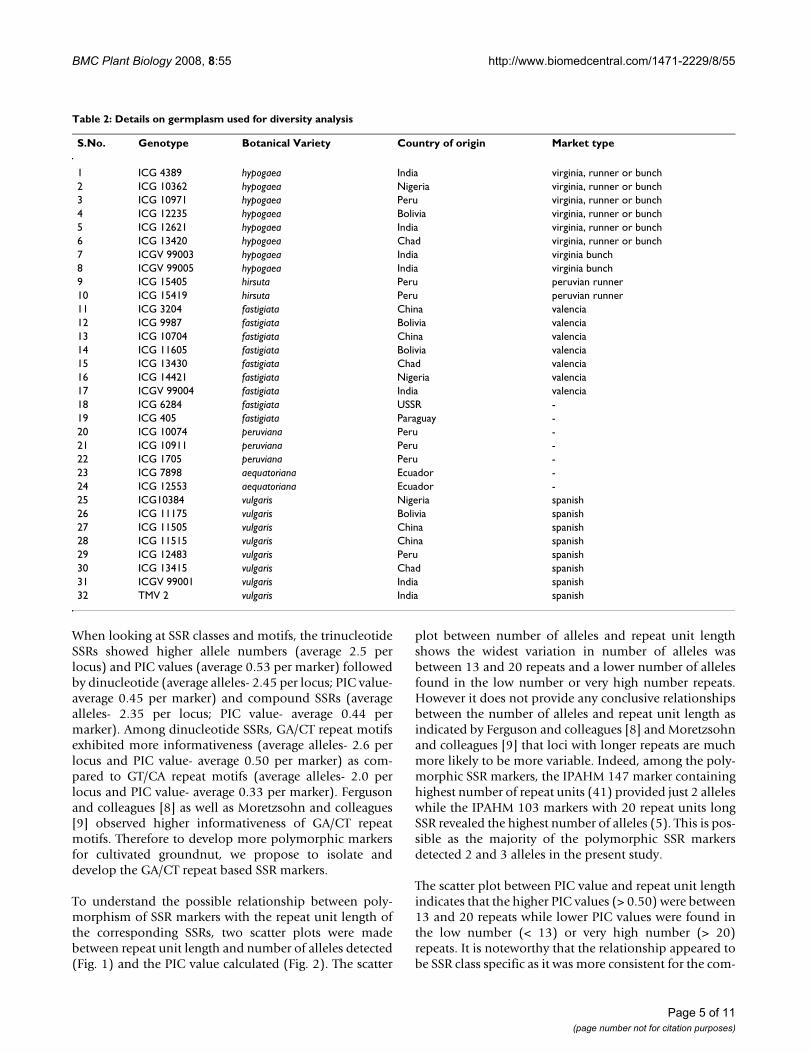
Table 2: Details on germplasm used for diversity analysis
S.No. Genotype Botanical Variety Country of origin Market type
1 ICG 4389 hypogaea India virginia, runner or bunch2 ICG 10362 hypogaea Nigeria virginia, runner or bunch3 ICG 10971 hypogaea Peru virginia, runner or bunch4 ICG 12235 hypogaea Bolivia virginia, runner or bunch5 ICG 12621 hypogaea India virginia, runner or bunch6 ICG 13420 hypogaea Chad virginia, runner or bunch7 ICGV 99003 hypogaea India virginia bunch8 ICGV 99005 hypogaea India virginia bunch9 ICG 15405 hirsuta Peru peruvian runner10 ICG 15419 hirsuta Peru peruvian runner11 ICG 3204 fastigiata China valencia12 ICG 9987 fastigiata Bolivia valencia13 ICG 10704 fastigiata China valencia14 ICG 11605 fastigiata Bolivia valencia15 ICG 13430 fastigiata Chad valencia16 ICG 14421 fastigiata Nigeria valencia17 ICGV 99004 fastigiata India valencia18 ICG 6284 fastigiata USSR -19 ICG 405 fastigiata Paraguay -20 ICG 10074 peruviana Peru -21 ICG 10911 peruviana Peru -22 ICG 1705 peruviana Peru -23 ICG 7898 aequatoriana Ecuador -24 ICG 12553 aequatoriana Ecuador -25 ICG10384 vulgaris Nigeria spanish26 ICG 11175 vulgaris Bolivia spanish27 ICG 11505 vulgaris China spanish28 ICG 11515 vulgaris China spanish29 ICG 12483 vulgaris Peru spanish30 ICG 13415 vulgaris Chad spanish31 ICGV 99001 vulgaris India spanish32 TMV 2 vulgaris India spanish
Page 5 of 11(page number not for citation purposes)
BMC Plant Biology 2008, 8:55 http://www.biomedcentral.com/1471-2229/8/55
pound SSRs. As no other report, to the best of our knowl-edge, is available on relationship between PIC value andrepeat unit length in groundnut, a direct comparison ofthe observed results could not be possible.
Based on our investigations on relationship of repeat unitlength with number of alleles or PIC value, no consistentrelationship between the number of repeat units and SSRpolymorphism was observed. It has been reported earlierthat the degree of polymorphism increases with the total
length of the repeat [9,29,38,39], some other studiesincluding in groundnut showed no relationship or weakcorrelation between SSR polymorphism and repeat unitlength [8,20,42,43].
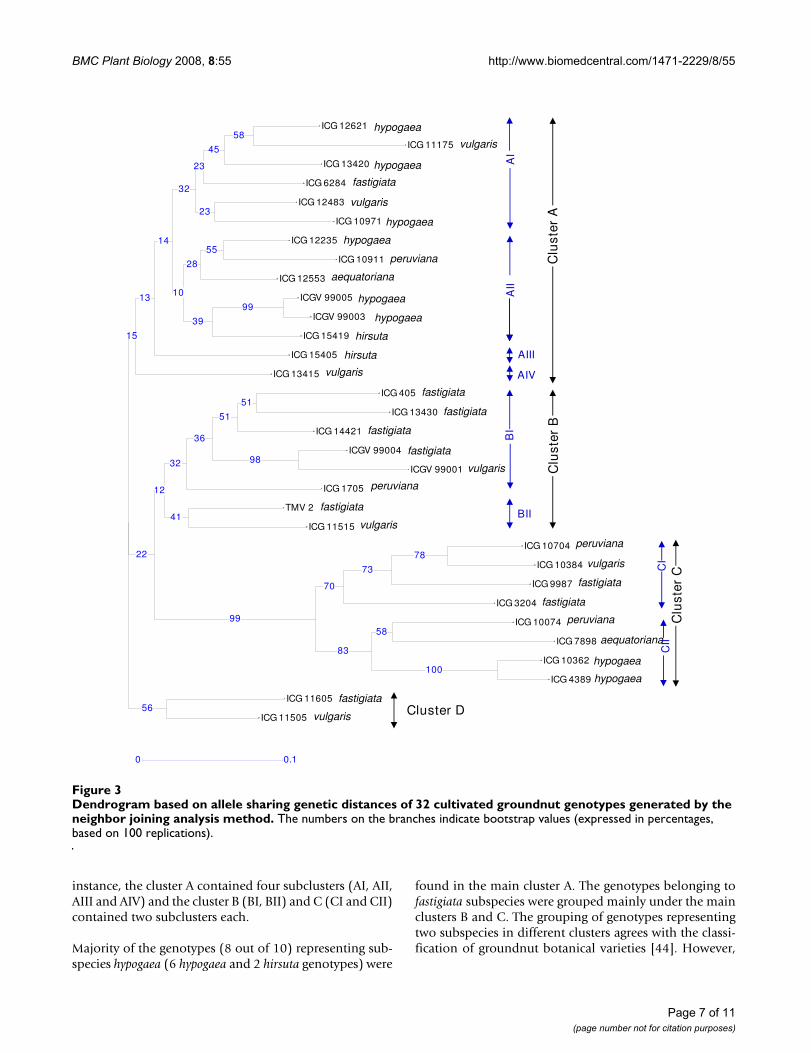
Diversity analysis and genetic relationshipsBased on the unique DNA fingerprint profiles of eachaccession of cultivated groundnut obtained by the poly-morphic markers, a phenogram was constructed to under-stand the relationships among the cultivated groundnutgermplasm surveyed. The dendrogram based on DICEsimilarity coefficient and constructed using the DARwinprogramme classified the germplasm in four main clustersA, B, C and D (Fig. 3). The cluster A contained 14 geno-types, the cluster B contained 8 genotypes while the othertwo clusters namely C and D contained 8 and 2 geno-types, respectively. Under each of these main clusters, gen-otypes were grouped further into sub clusters. For
Relationships between PIC value of SSR markers and repeat unit lengthFigure 2Relationships between PIC value of SSR markers and repeat unit length.
Number of alleles per locus for SSR markers of different repeat unitsFigure 1Number of alleles per locus for SSR markers of dif-ferent repeat units.
Table 3: Polymorphism features of SSR markers developed
S.No Marker No. of alleles PIC
1 IPAHM 23 2 0.402 IPAHM 73 3 0.623 IPAHM 82 2 0.344 IPAHM 92 2 0.125 IPAHM 93 3 0.606 IPAHM103 5 0.737 IPAHM 105 3 0.628 IPAHM 108 3 0.629 IPAHM 123 4 0.7510 IPAHM 136 2 0.4911 IPAHM 147 2 0.2712 IPAHM 165 3 0.5113 IPAHM 166 2 0.4814 IPAHM 171 a 3 0.5515 IPAHM 171 c 2 0.1716 IPAHM 176 2 0.4917 IPAHM 177 2 0.3118 IPAHM 219 2 0.3619 IPAHM 229 2 0.4620 IPAHM 282 2 0.4321 IPAHM 283 2 0.4922 IPAHM 287 3 0.6323 IPAHM 288 2 0.4324 IPAHM 290 2 0.2625 IPAHM 352 3 0.5826 IPAHM 354 3 0.5727 IPAHM 356 3 0.5128 IPAHM 373 3 0.5829 IPAHM 375 2 0.6330 IPAHM 395 2 0.4831 IPAHM 406 2 0.3632 IPAHM 407 a 2 0.3033 IPAHM 429 2 0.3534 IPAHM 451 2 0.1335 IPAHM 455 2 0.3136 IPAHM 468 2 0.3237 IPAHM 475 3 0.6738 IPAHM 524 2 0.4839 IPAHM 531 2 0.4840 IPAHM 540 2 0.2541 IPAHM 569 2 0.3842 IPAHM 659 4 0.6943 IPAHM 684 2 0.4644 IPAHM 689 2 0.5045 IPAHM 716 3 0.7046 IPAHM 718 2 0.12
Page 6 of 11(page number not for citation purposes)
BMC Plant Biology 2008, 8:55 http://www.biomedcentral.com/1471-2229/8/55
instance, the cluster A contained four subclusters (AI, AII,AIII and AIV) and the cluster B (BI, BII) and C (CI and CII)contained two subclusters each.
Majority of the genotypes (8 out of 10) representing sub-species hypogaea (6 hypogaea and 2 hirsuta genotypes) were
found in the main cluster A. The genotypes belonging tofastigiata subspecies were grouped mainly under the mainclusters B and C. The grouping of genotypes representingtwo subspecies in different clusters agrees with the classi-fication of groundnut botanical varieties [44]. However,
Dendrogram based on allele sharing genetic distances of 32 cultivated groundnut genotypes generated by the neighbor joining analysis methodFigure 3Dendrogram based on allele sharing genetic distances of 32 cultivated groundnut genotypes generated by the neighbor joining analysis method. The numbers on the branches indicate bootstrap values (expressed in percentages, based on 100 replications).
0 0.1
ICG 3204
ICG 4389
ICG 7898
ICG 9987
ICG 10074
ICG 10362
ICG 10384
ICG 10704
ICG 10911
ICG 10971
ICG 11175
ICG 11505
ICG 11515
ICG 11605
ICG 12235
ICG 12483
ICG 12553
ICG 12621
ICG 13415
ICG 13420
ICG 13430
ICG 14421
ICG 15405
ICG 15419
ICG 405
ICG 1705
ICG 6284
ICGV 99003
ICGV 99005
ICGV 99001
ICGV 99004
TMV 2
70
100
58
73
78
55
23
58
56
41
28
15
45
51
51
13
39
32
23
99
98
83
99
22
36
12
32
10
14
hypogaea
hypogaea
hypogaea
hypogaea
hypogaea
hypogaea
hypogaea
hypogaea
vulgaris
vulgaris
vulgaris
vulgaris
vulgaris
vulgaris
vulgaris
fastigiata
fastigiata
fastigiata
fastigiata
fastigiata
fastigiata
fastigiata
fastigiata
fastigiata
peruviana
peruviana
peruviana
peruviana
aequatoriana
aequatoriana
hirsuta
hirsuta
Clu
ster
AC
lust
er B
Clu
ster
C
Cluster D
AI
AII
AIII
AIV
BI
BII
CI
CII
Page 7 of 11(page number not for citation purposes)
BMC Plant Biology 2008, 8:55 http://www.biomedcentral.com/1471-2229/8/55
in an earlier study [45] genotypes representing the twosubspecies were classified in only two groups.
The cluster B contained 4 (out of 10) genotypes belongingto variety fastigiata and three genotypes belonging to vari-ety vulgaris. The cluster C also contained the genotypesfrom the fastigiata subspecies that includes 2 genotypes ofvariety fastigiata, 2 to variety peruviana and one each fromvarieties vulgaris and aequatoriana. The cluster D containedonly 2 genotypes belonging to subspecies fastigiata.Majority of the nodes under the main clusters were sup-ported by high bootstrap values.
It is important to note that positioning of botanical varie-ties aequatoriana and peruviana to the subspecies fastigiataor hypogaea has been debatable in the literature. Forinstance, in the past, based on morphological and physi-ological traits, two botanical varieties were classifiedunder the subspecies fastigiata (that includes other varie-ties fastigiata and vulgaris) while AFLP markers suggestedrelationships of aequatoriana and peruviana to hypogaearather than subspecies fastigiata [45]. The present studyincluded only two aequatoriana and three peruviana geno-types, and they were grouped under all three major clus-ters (A, B and C). Nevertheless, like the observations of Heand Prakash [45], four out of the five genotypes represent-ing aequatoriana and peruviana subspecies showed closerrelationships with the hypogaea genotypes (clusters AIIand CII) while only one genotype of peruviana subspecies(ICG 1705) showed some proximity to subspecies fastig-iata. The botanical variety peruviana, based on RAPD andISSR marker data, was classified as an operational taxo-nomic unit in addition to four varieties i.e. fastigiata, vul-garis (both belonging to subspecies fastigiata), runner andbunch (both belonging to subspecies hypogaea) [46].
It is interesting to note that the two accessions with resist-ance to leaf rust (ICGV 99003 and ICGV 99005) weregrouped together (AII) and similarly the other two acces-sions resistance to late leaf spot (ICGV 99001 and ICGV99004) were grouped together (BI). It seems that geno-types resistant to leaf rust and late leaf spot shared thepedigree or have the same resource of resistance. How-ever, three accessions resistance to early leaf spot (ICG405, ICG 1705 and ICG 6284) were scattered in the den-drogram. The accession, TMV2, susceptible to all three dis-eases (leaf rust, late leaf spot and early leaf spot) waspresent under cluster B. The dendrogram suggests thepotential parental genotypes having higher genetic diver-sity for constructing the mapping population(s) for map-ping the leaf rust, late leaf spot and early leaf spot. Evenselection and utilization of diverse cultivars in breedingprogrammes is needed to enhance the diversity of breed-ing populations for selection gains in the future [47].
ConclusionThe results of this study highlight a reliable and efficientway of obtaining microsatellites markers from cultivatedgroundnut. It is desirable to isolate and characterize moreDNA markers in cultivated groundnut for more produc-tive genomic studies, such as genetic mapping, marker-assisted selection, and gene discovery. Construction andsequencing of SSR enriched library yielded a total of 400SSRs, however, primer pairs could be designed for only170 SSRs of which 104 primer pairs showed the function-ality. As a result, the present study contributes a new set of104 SSR markers for cultivated groundnut. In order toassess the potential of newly developed markers for germ-plasm analysis, screening of these markers on 32 geno-types showed reasonable level of polymorphism. Newlydeveloped markers detected on average 2.44 alleles perlocus with an average PIC value 0.46. The present studyalso provided some indications about nature and type ofrepeat class or length of SSRs on the polymorphism of cor-responding SSR marker. Finally, the SSR markers, devel-oped in this study would be very useful for germplasmanalysis, population genetic structure and phylogeneticrelationships.
MethodsPlant materialFor constructing the SSR-enriched genomic libraries, thegroundnut germplasm line TMV2, belonging to the Span-ish botanical variety was used. While two genotypes(TMV2 and ICG 99001) were used for optimizing the PCRassays for newly developed SSR markers, a set of 32 geno-types were used for identifying the potential polymorphicmarkers for cultivated groundnut germplasm (Table 2).Of these 32 genotypes, 10 genotypes represent the subspe-cies hypogaea (2 to variety hirsuta and 8 to variety hypogaea)and the remaining 22 genotypes belong to subspecies fas-tigiata (10 to variety fastigiata, 7 to variety vulgaris, 3 tovariety peruviana and 2 to variety aequatoriana).
DNA extractionTotal genomic DNA was isolated from unfurled leavesaccording to a modified CTAB-based procedure [48]. Thequality of DNA was checked on 1% agarose gels and theDNA concentrations using spectrophotometer UV- 160Afollowing the recommendations of manufacturer (Shi-madzu Corporation, Japan).
Construction of SSR-enriched libraryA modified protocol of Fischer and Bachmann [23] wasused for constructing the SSR enriched library. Six micro-grams of genomic DNA genomic were digested by bluntend – generating restriction endonuclease RsaI. After con-firming digestion on agarose gel electrophoresis, the MluIadapter, consisting of a 21-mer (5'-CTCTTGCTTACGCGT-GGACTA-3') and a phosphorylated 25-mer (5'-pTAGTC-
Page 8 of 11(page number not for citation purposes)
BMC Plant Biology 2008, 8:55 http://www.biomedcentral.com/1471-2229/8/55
CACGCGTAAGCAAGAGCACA-3') was ligated to theblunt termini of restriction fragments using 50 ngadapter/μg of genomic DNA. Ligation was performed for2 hours at 37°C in order to allow the restriction digest tocontinue, hence preventing the DNA fragments from re-ligating to one another. The ligation products were thenseparated on a 1% TAE agarose gel and fragments sizefrom 100–900 bp and 900–1500 bp cut from the gel andpurified with GFX Gel Band Purification Kit (AmershamBiosciences, USA). The constructs were then heat dena-tured and hyribridised to biotinylated microsatellite oli-gonucleotides. The hybridizations were carried out using75 μl of 6×SSC and 150 nM of each biotinylated oligo(GT)15 and (GA)15 overnight at Thyb= Tm-5°C. The hybridswere subsequently bound to streptavidin – coated mag-netic beads (Dynabeads M -280 Streptavidin- Dynal, Nor-way). In order to capture the target sequences, the beadswere incubated either at room temperature for 15 min forthe 100–900 bp fragments or at 43°C for one hour for the900–1500 bp fragments. Non-hybridizing genomic DNAwas subsequently removed through a series of washes;twice in 2× SSC; 0.1% SDS (5 mins each, at 25°C), twicein 1× SSC (5 mins each, at 25°C) and finally twice in1×SSC at Thyb for 2 and 5 mins respectively. The boundDNA was eluted as single stranded fragments in TE pre-heated to 95°C.
The hybridized DNA fragments served as a template forPCR using the 21-mer oligonucleotide as the primer (30cycles with 56°C annealing temperature). Following PCR,like samples were combined and purified using the GFXcolumn purification Kit (Amersham Biosciences, USA).The purified PCR products were then digested with MluIto obtain vector-compatible, sticky ended fragments byincubation at 37°C overnight. The restriction fragmentswere purified using a MicroSpin™ column (AmershamBiosciences, USA) prior to ligation into a modifiedpUC19 vector (pJV1) (Edwards et al., 1996 [11]) whichhad been linearized with BssHII and dephosphorylated.The ligated vector fragments were transformed into com-petent E. coli DH5α cells (Invitrogen, USA), plated on LBagar containing ampicillin (100 μg/ml). To allow forblue-white selection, the plates were spread with 5-bromo-4-chloro-3-indolyl-β-D-galactopyranoside (X-gal;80 μg/ml) plus isopropyl β-D-thiogalactopyranoside(IPTG; 80 μg/ml). White colonies were picked and platedin a grid on LB containing ampicillin, prior to making col-ony lifts with Nylon Membranes, positively charged, fol-lowing the recommendation of manufacturer (AmershamBiosciences, USA). Hybridization was carried out at 42°Covernight using digoxigenin-labelled probes containingthe SSR motifs being searched (Roche, Germany).
Sequencing of SSR-positive clonesThe SSR positive clones identified after hybridization weregrown overnight in 3 ml LB broth with 100 μg/mL ampi-cillin. Plasmid DNA was extracted using GFX™ Micro Plas-mid Prep Kit (Amersham Biosciences, USA).Subsequently, the plasmid DNA was sequenced usingM13 Forward 24-mer Sequencing Primer following thedideoxynucleotide chain termination method on ABI3700 sequencer. Base calling was carried out using Phred[49]. Sequence data were quality trimmed using the slid-ing windows of 50 bp with a minimal average Phred scoreof 20.
SSR identification and primer designingThe sequencing data were analysed using the ClustalWprogramme in order to determine the rate of redundancyin the library. Non-redundant sequences were analysedwith Tandem Repeat Finder software [50]. The SSR con-taining sequences were subsequently used for primerdesign using Primer3 programme. Primers were designedfrom within the regions flanking the repeat motifs; fordinucleotides the repeat motifs selected were greater than14 bp in length, trinucleotides greater than 15 bp andtetranucleotides greater than 16 bp.
Amplification and visualization of microsatellite lociPCR reactions for all the primer pairs were performed in 5μl reaction volume following three touch down profilesi.e. 65–55°C (89 markers), 60–55°C (14 markers) and55–45°C (1 marker). The PCR was performed on 5 ng ofgenomic DNA with varying amount of primer pairs, Mg2+,dNTPs and Taq DNA polymerase. Details on these reac-tion components for each primer pair (marker), thatyielded PCR amplicon, are given in Additional file 1.Touch down amplification programs included 94°C for 2min, 30 cycles of 94°C for 45 sec, annealing temperature(65–55°C/60–55°/55–45°C) for 60 sec, 72°C for 60 secand a final extension of 10 min at 72°C.
The PCR products were separated on a non- denaturing6% polyacrylamide gel at 250 V for 2.5 to 3 hours in 1×TBE buffer and visualized by silver staining, modifiedfrom Kolodny [51]. The presence or absence of ampliconsin the genotypes examined was scored as 1 or 0, respec-tively.
Statistical analysisThe polymorphism information content (PIC) of eachmicrosatellite locus was determined as described by Weir[52]:
PIC = 1-Σ Pi2,
where Pi is the frequency of the ith allele in the genotypesexamined.
Page 9 of 11(page number not for citation purposes)
BMC Plant Biology 2008, 8:55 http://www.biomedcentral.com/1471-2229/8/55
Allelic data obtained in 0–1 fashion for all alleles at mic-rosatellite loci amplified were used for computing theinter-individual genetic dissimilarity following simplematching coefficient by using DARwin v 5.0.153 pro-gramme [53]. The dissimilarity matrix thus generated wasfurther used to generate UPGMA (Unweighted Pair GroupMethod with Arithmetic mean) dendrogram followingneighbour-joining (NJ) by using the DARwin programme.
Authors' contributionsLMC and ESM executed majority of the research work,VDQ, TDL and RKV analyzed the data. JHC, ESM and RKVwere involved in designing and planning the work andinterpreting the results. RKV drafted and edited the man-uscript critically with help of LMC. All authors read andapproved the final manuscript.
Additional material
AcknowledgementsAuthors gratefully acknowledge Mr. A. Gafoor for technical assistance and Dr H. D. Upadhyaya for providing the germplasm analysed in this study. Thanks are due to Asian Development Bank and Indian Council of Agricul-ture Research (National Fund, India) for sponsoring the research projects 'Rapid crop improvement for poor farmers in the semi-arid tropics of Asia' and 'Gene-based genetic maps and molecular markers for biotic and abiotic stress tolerance in cultivated groundnut', respectively that made this study possible.
References1. Dwivedi SL, Crouch JH: Proceedings of a Workshop for the
Asian Development Bank supported project on molecularbreeding of sorghum, groundnut and chickpea. ICRISAT2003:28-43.
2. Weiss EA: Oilseed Crops London, UK: Longman; 1983:660. 3. Savage GP, Keenan JI: The composition and nutritive value of
groundnut kernels. In The groundnut crop: A scientific basis forimprovement Edited by: Smart J. London, UK: Chapman and Hall;1994:173-213.
4. Stalker HT, Moss JP: Speciation, cytogenetics and utilization ofArachis species. Adv Agron 1987, 41:1-39.
5. Young ND, Weeden NF, Kochert G: Genome mapping in leg-umes (Fam. Fabaceae). In Genome Mapping in Plants Edited by:Paterson AH. Austin, USA: Landes Company; 1996:211-227.
6. Singh AK, Smartt J, Simpson CE, Raina SN: Genetic variation viamolecular polymorphism in groundnut, Arachis hypogaea L.Genet Resour Crop Evol 1998, 45:119-126.
7. Gupta PK, Varshney RK: The development and use of microsat-ellite markers for genetic analysis and plant breeding withemphasis on bread wheat. Euphytica 2000, 113:163-185.
8. Ferguson ME, Burow MD, Schultz SR, Bramel PJ, Paterson AH, Kres-ovich S, Mitchell S: Microsatellite identification and characteri-
zation in peanut (A. hypogaea L.). Theor Appl Genet 2004,108:1064-1070.
9. Moretzsohn MC, Leoi L, Proite K, Guimaraes PM, Leal-Bertioli SCM,Gimanes MA, Martin WS, Valls JFM, Grattapaglia D, Bertioli D: Amicrosatellite – based, gene-rich linkage map for the AAgenome of Arachis (Fabaceae). Theor Appl Genet 2005,111:1060-1071.
10. Mace ES, Varshney RK, Mahalakshmi V, Seetha K, Gafoor A, LeeladeviY, Crouch JH: In silico development of simple sequence repeatmarkers within the aeschynomenoid/dalbergoid and genis-toid clades of the Leguminosae family and their transferabil-ity to Arachis hypogaea, groundnut. Plant Sci 2007, 174:51-60.
11. Edwards KJ, Barker JHA, Daly A, Jones C, Karp A: Microsatellitelibraries enriched for several microsatellite sequences inplants. BioTechniques 1996, 20:759-760.
12. Karagyozov L, Kalcheva ID, Chapman VM: Construction of ran-dom small-insert genomic libraries highly enriched for sim-ple sequence repeats. Nucl Acids Res 1993, 21:3911-3912.
13. Kijas JMH, Fowler JCS, Garbett CA, Thomas MR: Enrichment ofmicrosatellites from the citrus genome using biotinylatedoligonucleotide sequences bound to streptavidin-coatedmagnetic particles. BioTechniques 1994, 16:656-662.
14. Ito T, Smith CL, Cantor CR: Sequence-specific DNA purificationby triplex affinity capture. Proc Natl Acad Sci USA 1992,89:495-498.
15. Varshney RK, Hoisington DA, Upadhyaya HD, Gaur PM, Nigam SN,Saxena K, Vadez V, Sethy NK, Bhatia S, Aruna R, Gowda MVC, SinghNK: Molecular genetics and breeding of grain legume cropsfor the semi-arid tropics. In Genomic Assisted Crop ImprovementGenomics Applications in Crops Volume II. Edited by: Varshney RK, Tube-rosa R. Dordrecht, The Netherlands: Springer; 2007:207-242.
16. Hopkins MS, Casa AM, Wang T, Mitchell SE, Dean RE, Kochert GD,Kresovich S: Discovery and characterization of polymorphicsimple sequence repeats (SSRs). Crop Sci 1999, 39:1243-1247.
17. Palmieri DA, Hoshino AA, Bravo JP, Lopes CR, Gimenes MA: Isola-tion and characterization of microsatellite loci from the for-age species Arachis pintoi (Genus Arachis). Mol Ecol Notes 2002,2:551-553.
18. Gimenes MA, Hosino AA, Barbosa AVG, Palmieri DA, Lopes CR:Characterization and trasferability of microsatellite mark-ers of cultivated peanut (Arachis hypogaea). BMC Plant Biol2007, 7:9.
19. He G, Prakash CS: Identification of polymorphic DNA markersin cultivated peanut (Arachis hypogaea. L.). Euphytica 1997,97:143-149.
20. He G, Meng R, Newman M, Gao GM, Pittman RN, Prakash CS:Microsetellites as DNA markers in cultivated peanut (Arachishypogaea L.). BMC Plant Biology 2003, 3:3.
21. Moretzsohn MC, Hopkins MS, Mitchell SE, Kresovich S, Valls JFM, Fer-reira ME: Genetic diversity of peanut (Arachis hypogaea L.)and its wild relatives based on the analysis of hypervaraibleregions of the genome. BMC Plant Biology 2004, 4:11.
22. Luo M, Dang P, Guo BZ, He G, Holbrook CC, Bausher MG, Lee RD:Generation of expressed sequence tag (ESTs) for gene dis-covery and marker development in cultivated peanut. CropSci 2005, 45:346-353.
23. Fischer D, Bachmann K: Microsatelite enrichment in organismswith large genomes (Allium cepa L.). Biotechniques 1998,24(5):796-800, 802.
24. Wang CT, Yang XD, Chen DX, Yu SL, Liu GZ, Tang YY, Xu JZ: Iso-lation of simple sequence repeats from groundnut. Elect JourBiotechnol 2007, 10:473-480.
25. Rallo P, Dorado G, Martin A: Development of simple sequencerepeats (SSRs) in olive tree (Olea europaea L.). Theor ApplGenet 2000, 101:984-989.
26. Fisher PJ, Richardson TE, Gardner RC: Characteristics of single-and multi-copy microsatellites from Pinus radiata. Theor ApplGenet 1998, 96:969-979.
27. Koblizkova A, Dolezel J, Macas J: Subtraction with 3' modified oli-gonucleotides eliminates amplification artifacts in DNAlibraries enriched for microsatellites. BioTechniques 1998,25:32-38.
28. Becher SA, Steinmetz K, Weising K, Boury S, Peltier D, Renou JP, KahlG, Wolff K: Microsatellites for cultivar identification in Pelar-gonium. Theor Appl Genet 2000, 101:643-651.
Additional file 1Features and polymorphism status of new set of SSR markers developed. The data provided represent the details of the new set of SSR markers e.g. marker name, Genbank accession IDs, primer sequences, PCR conditions and amplification status.Click here for file[http://www.biomedcentral.com/content/supplementary/1471-2229-8-55-S1.doc]
Page 10 of 11(page number not for citation purposes)
BMC Plant Biology 2008, 8:55 http://www.biomedcentral.com/1471-2229/8/55
Publish with BioMed Central and every scientist can read your work free of charge
"BioMed Central will be the most significant development for disseminating the results of biomedical research in our lifetime."
Sir Paul Nurse, Cancer Research UK
Your research papers will be:
available free of charge to the entire biomedical community
peer reviewed and published immediately upon acceptance
cited in PubMed and archived on PubMed Central
yours — you keep the copyright
Submit your manuscript here:http://www.biomedcentral.com/info/publishing_adv.asp
BioMedcentral
29. Weber JL: Informativeness of human (cC-dA)n (dG-dT)n poly-morphisms. Genomics 1990, 7:524-530.
30. Condit R, Hubbel SP: Abundance and DNA sequence of two-base repeat regions in tropical tree genomes. Genome 1991,34(1):66-71.
31. Largercrantz U, Ellegren H, Andersson L: The abundance of vari-ous polymorphic microsatellite motifs differs between plantsand vertebrates. Nucleic Acids Res 1993, 21:1111-1115.
32. Morgante M, Olivieri AM: PCR-amplified microsatellites asmarkers in plant genetics. Plant J 1993, 3(1):175-182.
33. Wang Z, Weber JL, Zhong G, Tanksley SD: Survey of plant shorttandem repeats. Theor Appl Genet 1994, 88:1-6.
34. Powell W, Machray GC, Provan J: Polymorphism revealed bysimple sequence repeats. Trends Plant Sci 1996, 1:215-222.
35. De Wiel CV, Arens P, Vosman B: Microsatellite retrieval in let-tuce (Lactuca sativa L.). Genome 1998, 42:139-150.
36. Butcher PA, Decroocq S, Gray Y, Moran GF: Development, inher-itance and cross-species amplification of microsatellitemarkers from Acacia mangium. Theor Appl Genet 2000,101:1282-1290.
37. Akkaya MS, Bhagwat AA, Cregan PB: Length polymorphism ofsimple sequence repeat DNA in soybean. Genetics 1992,132:1131-1139.
38. Hüttel B, Winter P, Weising K, Choumane W, Weigand F, Kahl G:Sequence-tagged microsatellite-site markers for chickpea(Cicer arietinum L.). Genome 1999, 42:210-217.
39. Burstin J, Deniot G, Potier J, Weinachter C, Aubert G, Baranger A:Microsatellite polymorphism in Pisum sativum. Plant Breed2001, 120:311-317.
40. He G, Meng R, Gao H, Guo B, Newman M, Pittman RN, Prakash CS:Simple sequence repeat markers for botanical varieties ofcultivated peanut (Arachis hypogaea. L.). Euphytica 2005,142:131-136.
41. Varshney RK, Graner A, Sorrells ME: Genic microsatellite mark-ers in plants: features and applications. Trends Biotechnol 2005,23(1):48-55.
42. Love J, Knight A, Mc Aleer M, Todd J: Towards construction of ahigh-resolution map of the mouse genome using PCR ana-lyzed microsatellites. Nucleic Acids Res 1990, 18:4123-4130.
43. Yu K, Park S, Poysa V: Abundance and variation of microsatel-lite DNA sequence in Beans (Phaseolus and Vigna). Genome1999, 42:27-34.
44. Krapovickas A, Gregory WC: Taxonomia del genero Arachis(Leguminosae). Bonplandia 1994, 8:1-186.
45. He G, Prakash C: Evaluation of genetic relationships amongbotanical varieties of cultivated peanut (Arachis hypogaea L.)using AFLP markers. Genet Resour Crop Evol 2001, 48:347-353.
46. Raina SN, Rani V, Kojima T, Ogihara Y, Singh KP, Devarumath RM:RAPD and ISSR fingerprints as useful genetic markers foranalysis of genetic diversity, varietal identification, and phyl-ogenetic relationships in peanut (Arachis hypogaea) cultivarsand wild species. Genome 2001, 44:763-772.
47. Krishna GK, Zhang J, Burow M, Pittman RN, Delikostadinov SG, LuY, Puppala N: Genetic diversity analysis in Valencia peanut(Arachis hypogaea L.) using microsatellite markers. Cell MolBiol Lett 2004, 9:685-697.
48. Mace ES, Buhariwalla HK, Crouch JH: A high-throughput DNAextraction protocol for tropical molecular breeding pro-grams. Plant Mol Biol Rep 2003, 21:459a-459h.
49. Ewing B, Hillier L, Wendl MC, Green P: Base-calling of automatedsequencer traces using phred. I. Accuracy assessment.Genome Res 1998, 8:175-185.
50. Benson G: Tandem Repeats Finder: a program to analyseDNA sequence. Nucleic Acid Res 1999, 27:573-580 [http://tandem.bu.edu/trf/trf.html].
51. Kolodny GM: An improved method for increasing the resolu-tion and sensitivity of silver staining of nucleic acid bands inpolyacrylamide gels. Anal Biochem 1984, 138(1):66-67.
52. Weir BS: Genetic data analysis. Methods for discrete geneticdata. Sunderland Massachusetts: Sinauer Associates; 1990:125.
53. Perrier X, Jacquemond-Collet JP: DARwin software. 2006 [http://darwin.cirad.fr/darwin/].
Page 11 of 11(page number not for citation purposes)
Top Related
Copyright © 2022 FDOKUMEN

