


Bahasa
Halaman
Hukum


1
Iron-Nickel Alloy Smelting Production in Luwu,
South Sulawesi during the pre-Islamic period
Misol Do
Dissertation submitted in partial fulfilment of the requirements for the degree of
MSc in the Technology and Analysis of Archaeological Materials
of University College London in 2013
UCL INSTITUTE OF ARCHAEOLOGY

I
Iron-nickel alloy has been an interesting research area for archaeologists and
archaeometallurgists. This investigation comprises of the analysis of archaeometallurgical
material related to iron-nickel production that was recovered from pre-Islamic iron smelting
sites in the Luwu region within South Sulawesi.
This study provides the first archaeometallurgical investigation of the iron-nickel
smelting technology using laterite iron ore in Luwu. Sites at Lake Matano were excavated by
the OXIS project and their archaeological associations dating from the 15th to 19th centuries
was subsequently examined using optical microscopy, and SEM-EDS. As a result, it was
possible to gain an insight into the technical processes of iron extraction that were carried
out in Luwu.
The results showed that the iron-nickel alloy extraction technologies in Luwu during
the pre-Islamic period were characterised by the local resource. Nickeliferous lateritic iron
ore was used as an ore, and this resulted in corrosion resistant iron production, which
included one or two per cent nickel. This iron-nickel alloy was likely to lead the Luwu
kingdom to mighty power and wealth.
Note: cover images from Backscattered electron images of slag LMG 713A-L and microphotographs of slag PSN
4240-2 after etching
ABSTRACT

II
First and foremost, I would like to express my deepest gratitude to my supervisor Marcos
Martinón-Torres for the most valuable guidance and support throughout the year, particularly
during my dissertation work. I would also like to thank to Professor Ian Freestone for his
considerable help and guidance over the course of the year. Thanks must also go to Dr. David Bulbeck
and Dr. Oliver Pryce, who provided both the Luwu iron samples and Southeast Asian archaeological
background. I would also like to thank Harriet White and Kevin Reeves for their invaluable technical
guidance in the basement labs.
I also want to thank all my classmates, MSc Techs 2012-2013. Ana, Enrica, Giovanni, Jeremy,
Laura. C, Laura. W, Lylliam, and Tere. I cannot imagine my Masters degree without you guys. My
immense gratitude goes to all of my friends for their great energy in supporting me.
Last but not least, I am grateful to my family for their endless encouragement, faith and love,
and Hyunseok for his support and patience.
ACKNOWLEDGMENT

III
CHAPTER ONE: INTRODUCTION…………………………………………………………………………………1
1.1 Introduction…………………………………………………………………………………………………...1
1.2 Historical Background of Luwu………………………………………………………………………..3
1.3 Iron production and use in Indonesia……………………………………………………………….5
1.4 Archaeological background of Luwu…………………………………………………………………9
1.4.1 Lake Matano………………………………………………………………………………..…………………………11
1.4.2 Katue…………..………………………………………………………………………………………………………...18
1.4.3 Sabbang Loang and Pinanto…………..………………………………………………………………………..20
1.4.4 Ethnohistorical iron smelting sites………………………………………………………………………....23
1.5 Aims and objectives………………………………………………………………………………………24
CHAPTER TWO: MATERIAL AND METHODS……………………………………………………………...25
2.1 Material………………………………………………………………………………………………………..25
2.1.1 Sample…………………………………………………………………………………………………………………..25
2.1.2 Sample preparation………………………………………………………………………………………………..26
2.2 Analytical methods………………………………………………………………………………………..27
2.2.1 Optical Microscopy…………………………………………………………………………………………………27
2.2.2 SEM-EDS………………………………………………………………………………………………………………..29
CHAPTER THREE: RESULTS……………………………………………………………………………………...31
3.1 Ore and Gangue…………………………………………………………………………………………….31
3.2 Ceramic………………………………………………………………………………………………………..38
3.3 Slag………………………………………………………………………………………………………………46
3.4 Iron artefact………………………………………………………………………………………………….61
CHAPTER FOUR: DISCUSSION…………………………………………………………………………………..69
4.1 Possible operating parameters………………………………………………………………………69
4.2 Further operating parameters……………………………………………………………………….71
4.3 Archaeological interpretation………………………………………………………………………..74
CHAPTER FIVE: CONCLUSION…………………………………………………………………………………...76
BIBLIOGRAPHY………………………………………………………………………………………………………..78
LIST OF CONTENTS

IV
Figure 1 Sulawesi in Indonesia, Southeast Asia ........................................................................................ 3
Figure 2 Recorded Southeast Asian Metal Production. 1500-1800 AD .................................................. 6
Figure 3 Principal sources of metals used in Southeast Asia, 1500-1800AD ......................................... 7
Figure 4 Iron weapons from Makassar, South Sulawesi .......................................................................... 8
Figure 5 Examples of Indonesian Pamor patterns ................................................................................... 9
Figure 6 Relevant iron smelting relevant sites excavated and surveyed by OXIS in Luwu ................ 10
Figure 7 Iron conglomerate on the shore of Lake Matano ..................................................................... 12
Figure 8 Excavation unit 12, test pit 1 at Nuha ....................................................................................... 13
Figure 9 Stratigraphy of Nuha test pit. .................................................................................................... 13
Figure 10 Pandai Besi square U1T3, end of excavation of unit 4 .......................................................... 15
Figure 11 Plan of Rahampu’u 1 in Kampung Matano ............................................................................. 16
Figure 12 Rahampu’u 1 square S6T5 ....................................................................................................... 16
Figure 13 Rahampu’u 1 square S6B10 .................................................................................................... 17
Figure 14 Lemogola square 1 ................................................................................................................... 17
Figure 15 Plan of Katue ............................................................................................................................. 18
Figure 16 Katue cacao orchard and drainage ditches ............................................................................ 19
Figure 17 Katue metal specimens ............................................................................................................ 19
Figure 18 Plan of Sabbang Loang ............................................................................................................. 21
Figure 19 Plan of Pinanto ......................................................................................................................... 22
Figure 20 Stratigraphy of Sabbang Loang square 1-4. ........................................................................... 23
Figure 21 Pinanto square U61B7 and U121B15 ..................................................................................... 23
Figure 22 Microstructures of etched standards in 4% Nital . ................................................................ 28
Figure 23 Backscattered electron image of PDB 890-L and-R. .............................................................. 33
Figure 24 Backscattered electron image of PDB 646A . ......................................................................... 33
Figure 25 Backscattered electron image of PDB 885 ............................................................................. 34
Figure 26 Backscattered electron image of PDB 897 ............................................................................. 35
Figure 27 Backscattered electron image of PDB 897 of slaggy area ..................................................... 35
Figure 28 Backscattered image of PDB 897 of charcoal. ........................................................................ 36
Figure 29 Microphotographs of RHP 541. ............................................................................................... 36
Figure 30 Microphotographs of MTN 866-R .......................................................................................... 40
Figure 31 Microphotographs of MTN 866-L .......................................................................................... 40
Figure 32 Backscattered images of MTN 866-R. ..................................................................................... 40
Figure 33 Microphotographs of NUH 4597A x100. ................................................................................ 41
Figure 34 Microphotographs of NUH 4597A x50. .................................................................................. 42
Figure 35 Backsacattered image of NUH 4597A ..................................................................................... 42
Figure 36 Microphotographs of tuyère RHP 4220-L ............................................................................. 44
Figure 37 Backscattered images of RHP 4220-R ................................................................................... 45
LIST OF FIGURES

V
Figure 38 Ratios of alumina to silica of Luwu slags ............................................................................... 48
Figure 39 Scatter plot between MgO and CaO for slags.......................................................................... 49
Figure 40 Photomicrograph and backscattered electron image of slag PDB 888A ............................. 49
Figure 41 Backscattered images of slag LMG 707A-2 ............................................................................ 51
Figure 42 Backscattered images of slag LMG 707A-1 and LMG 707A-3 ............................................... 51
Figure 43 Backscattered image of PDB 888A and NUH 2638. ............................................................... 53
Figure 44 Maximum chromium, nickel, copper, and arsenic contents in prills in slags. ..................... 54
Figure 45 Backscattered image of LMG 707A-1 and L?MG 713A-L ...................................................... 54
Figure 46 Secondary electron images of slag PDB 888A. ....................................................................... 55
Figure 47 Photograph of PSN 4240-2. ..................................................................................................... 56
Figure 48 Microphotograph of PSN 4240-2 ............................................................................................ 56
Figure 49 Microphotograph of PSN 4240-2 after etching in Nital 3% etchant. ................................... 56
Figure 50 Secondary electron images of slag PSN 4240-2 after etching .............................................. 57
Figure 51 Microphotographs of RHP 526. ............................................................................................... 58
Figure 52 Microphotographs of MTN 820. .............................................................................................. 58
Figure 53 Backscattered image of MTN 820 ........................................................................................... 59
Figure 54 Microphotographs of PNT 1745B ........................................................................................... 59
Figure 55 Microphotograph of metallic islands of RHP 159 .................................................................. 63
Figure 56 Backscattered electron image and microphotograph of RHP 159 ....................................... 63
Figure 57 Photograph of SBL 5089B, SBL 1247, and RHP 164 .............................................................. 64
Figure 58 Microphotograph and backscattered image of RHP 184A .................................................... 64
Figure 59 Microphotograph of Iron tube KTE 2545 ............................................................................... 65
Figure 60 Backscattered image of KTE 2545. ......................................................................................... 65
Figure 61 Backscattered image of PNT 1664-R ...................................................................................... 66
Figure 62 Microphotographs of the cross-section of an Indonesian Kris. ............................................ 67
Figure 63 Backscattered image of PSN 4240-1 ...................................................................................... 67
Figure 64 Ternary phase diagram ............................................................................................................ 72

VI
Table 1 Descriptions of Luwu sites. ......................................................................................................... 11
Table 2 Radiocarbon dated from Nuha. ................................................................................................... 13
Table 3 Radiocarbon dated from Pandai Besi, Rahampu’u 1 and Lemogola ........................................ 14
Table 4 Radiocarbon dated from Katue. .................................................................................................. 20
Table 5 Radiocarbon dates from Sabbang Loang. ................................................................................... 21
Table 6 Specimens excavated or collected in sites in Luwu. .................................................................. 26
Table 7 Accuracy and precision test using the standards ...................................................................... 30
Table 8 Bulk chemical composition data by SEM-EDS for ore and gangue .......................................... 32
Table 9 SEM-EDS analytical results for some phases shown in Figure 27b. ........................................ 35
Table 10 Bulk chemical composition data using SEM-EDS for ceramics. ............................................. 39
Table 11 SEM-EDS spot analyses for some phases shown in Figure 35a. ............................................ 43
Table 12 SEM-EDS spot analyses for some phases in RHP 4220-L ....................................................... 44
Table 13 The “bulk” chemical composition data by SEM_EDS for slag samples. .................................. 47
Table 14 Microscopic observation of slag samples from Luwu ............................................................. 50
Table 15 Chemical composition data by EDS spot analyses in PDB 888A, prills in LMG 713A-R ....... 52
Table 16 Chemical composition data by EDS spot analyses in NUH 4628 ........................................... 53
Table 17 SEM-EDS analytical results for some phases shown in Figure 53. ........................................ 59
Table 18 Bulk chemical composition data analysed by SEM-EDS for iron artefacts ........................... 62
Table 19 SEM-EDS analytical results for iron prills in RHP 184A ......................................................... 64
Table 20 SEM-EDS analytical results for phases shown in Figure 61. .................................................. 65
Table 21 Spot and area analyses by SEM-EDS for PSN 1664-R. ............................................................ 66
Table 22 Analytical results for some phases shown in Figure 63. ........................................................ 68
LIST OF TABLES

1
1.1 Introduction
Studies of iron production are based on the understanding and comprehension of chemical and
mineralogical research for debris, including iron metal produced, slag, ore, furnace lining, technical
ceramics, and other relative materials from the smelting and/or smithing sites (Bachmann, 1982;
Bayley et al, 2008; Tylecote, 1962; Tylecote, 1986). Slags on archaeological sites have been widely
examined because they are the most abundant and durable of waste products and are potential
sources of crucial information about iron smelting and/or smithing (Bachmann, 1982; Bayley et al,
2001; Rehren et al, 2007). Compositional data of iron slags, which provide information about raw
materials, the operational conditions in the furnace, and the type of metal extracted from the ore.
Iron slags generally show similar characteristics, despite different iron ore sources being used. It
means that there are similarities in furnace environments, such as the temperatures and duration of
the smelting process (Bayley et al, 2008:44).
There are two major methods to extract iron to the metal phase: the direct smelting process
and indirect smelting process. Firstly, the direct smelting process, which is called the bloomery
process, produced metallic blooms of solid state wrought iron (<0.1% C) under the melting point of
the metal. This type of metal could be forged directly after smelting. The wrought iron was carburised
to make steel, but it was possible for steel (0.1-2% C) also to be produced by the bloomery smelting
process (Bayley et al, 2001; David et al, 1989; Gordon and Killick, 1993; Miller and Van Der Merwe,
1994; Renfrew and Bahn, 2008: 354-355; Tylecote, 1987: 272). African iron smelting proceeded in
bloomery furnaces, producing bloom with variable carbon content (David et al, 1989; Gordon and
Killick, 1993; Miller and Van Der Merwe, 1994). The bloomery process does not far exceed 1250℃,
which is below the melting temperature of plain iron (1534℃) (Bayley et al, 2001). On the other hand,
indirect processes by blast furnaces produce cast iron, which includes two to five percent of high
carbon. Cast iron is produced in the liquid state and this is decarburised below one per cent of carbon
and used in the forming of the final objects (David et al, 1989). So this process is known as the indirect
process. However, some studies (e.g. Crew, 2004; Crew and Charlton, 2007) have revealed and
proved that the production of cast iron in the form of bloom could be possible in the bloomery furnace,
albeit only occurring when the production sufficiently satisfies the very hot and reducing condition.
CHAPTER ONE: INTRODUCTION

2
Iron-nickel alloy came to the fore again when scientifically re-examined research studies
about meteoritic iron beads were recently published (Johnson et al, 2013; McCoy et al, 2008; Rehren
et al, 2013). Nickel rich iron artefacts have been found in Europe, the east Mediterranean, and
Southeast Asia (Bjorkman, 1987; Bronson, 1987; Buchwald and Mosdal, 1985; Coghlan, 1956; Desch,
1928; Photos et al, 1988) and many archaeologists and archaeometallurgists have constantly
discussed and tried to solve the question of the origins of these iron-nickel materials. There are three
sources of iron-nickel alloy: meteoritic iron, telluric iron and nickeliferous ores (Craddock, 2010;
Photos, 1989; Tylecote, 1987:99). Meteoritic iron is characterised by high nickel contents in the range
of 5 to 12 per cent but there are some meteoritic iron that has as much as 60 wt% of nickel (Scott,
2013: 24). Another typical feature of meteorite is a widmanstätten structure, which is fine
interleaving of kamacite and taenite bands (Scott, 2013: 26; Photos, 1989), as found in Egyptian iron
beads (Johnson et al, 2013; Rehren et al, 2013). Telluric, or terrestrial iron, is found in a limited
number of geological regions with native iron bearing basalts, such as Disco Island in Greenland. This
type of iron-nickel source has less nickel content, lower than four per cent (Craddock, 2010; Photos,
1989; Tylecote, 1987:99). The third type is smelting nickeliferous ores. There are a number of iron
ores that can yield nickel. Among them, nickel rich iron laterites are frequently reported to have been
used for the smelting of iron (Abendanon 1917; cited in Bronson, 1992).
Laterite is defined as iron and aluminium rich ore derived from a basic igneous rock formed
under wet conditions (McNeil, 1974). This type of iron ore is frequently found in Africa, Southeast
Asia in the form of eluvial and alluvial deposits (Aleva 1994; Braucher et al, 1998; Pendleton 1941;
Takimoto and Suzuka 1968). Laterites have also commonly been major sources of nickel as they
contain one or two per cent of nickel (Dalvi et al, 2004) and it is ethnographically known to have been
used for the iron smelting (Bronson, 1987; 1992; Photos, 1989). The evidence from archaeological
remains is that nickel-rich iron prills were trapped in iron smithing slags and bloom from a
Hellenistic settlement of Petres in north Greece, dated second century BC (Photos, 1988) and nickel
rich lateritic iron deposits in Greece support the evidence of the iron-nickel alloys smelting process
having occurred (Garagounis, 1971; cited in Photos, 1989).
Iron-nickel alloy has been frequently used in the Indonesian Archipelago. Iron-nickel alloy
daggers from Indonesia, kris, have a lower nickel content than meteoritic iron, at about four per cent.
Previous literatures have noted that the iron-nickel alloy for kris may have been produced using
meteoritic iron or through the smelting process using nickeliferous ores (Bronson, 1987; 1992).
There was, however, no archaeometallurgical evidence that indicated iron-nickel alloy smelting in

3
Indonesia because iron production technology in the country, especially Sulawesi, has not been
studied much. This is in contrast to the continents of Europe, Africa, and Asia, where it has been
continuously documented. This study, therefore, reports the first case of an iron-nickel alloy smelting
process from Luwu, South Sulawesi, in which the iron-nickel alloy was produced to manufacture iron
objects. This study would help Luwu’s iron-nickel smelt operating technology and metallurgy,
according to the microstructural and chemical analyses of Luwu’s samples related to iron.
1.2 Historical Background of Luwu
It is believed that the Austronesian settlers (Bugis, Makasar, Toraja, and Mandar groups) moved into
South Sulawesi from Taiwan and the Philippines around 1500 BC (Bougas, 2007). Bugis, the largest
ethnic group of South Sulawesi (Figure 1), began to unite the Luwu region from the early 14th century
(Bulbeck and Caldwell, 2000; Pelras, 1996).
Figure 1 Sulawesi in Indonesia, Southeast Asia (Druce, 2009:2, Figure 1)

4
Luwu is known as the largest and oldest prestigious Bugis kingdom of South Sulawesi in
Indonesia (Bulbeck and Caldwell, 2000; Bulbeck and Prasetyo, 2000). Luwu is thought to have been
a mighty chiefdom during the pre-Islamic period in spite of there being no clear evidence of this
(Bulbeck and Prasetyo, 2000). The topographical territories of Luwu are separated into two
categories: a large, high, mountainous vicinity and a smaller coastal alluvial plain (Bulbeck and
Caldwell, 2000).
In around 1530, the Portuguese, the first European navigators, arrived on the west coast.
After 1625, major European traders from the Netherlands, Denmark, England, and France had
arrived (Caldwell, 1995; Pelras, 1996: 5). Luwu embraced Islam in 1605, shortly before the Dutch
arrived. This period is called the pre-Islamic Luwu period from the early seventeenth century
(Bellwood, 1997:139; Bulbeck, 2000; Caldwell, 1995; Druce, 2009: 1). Religious conversion
progressed over the following centuries (Koolhof, 2010: 44) and their trading enterprises led to the
relatively quick spread of the Islamic religion in Indonesia (Bellwood, 1997: 139).
Southeast Asia, especially South Sulawesi, was described as a district of cross-cultural
interaction (Lape, 2002; Macknight, 1993:5). Trade was an important part of the political economy
during South Sulawesi’s pre-Islamic period (Caldwell, 1995; Druce, 2009:34). The primary trade
network from Sulawesi was set up to China and India, as a result of the increasing importance of
maritime trade (Guy, 1986; Lape, 2000). During the early trade period, an enormous quantity of
Chinese ceramics were imported (Macknight, 1993:15-16, 39). Thai and Vietnamese ceramics also
flooded into South Sulawesi during the most of the second millennium AD (Macknight, 2000).
Additional trade routes emerged to the outside world during the fourteenth century to early
sixteenth century (Bellwood, 1997:136; Hall, 1985:223; Hall, 2011:318; Osborne, 2010:58). These
newly established patterns of the world trade system allowed for a more direct exchange system by
linking the continents of Asia and Europe (Hall, 1985:223). Sulawesi’s natural resources, including
copper ore, gold dust, sandal wood, resins and iron ore, were exploited and transported by the inter-
island trade network (Caldwell, 1995; Macknight, 1993:39; Pelras, 1996:7, 48). Historically, the most
important product from Lake Matano was iron ore (Bulbeck and Caldwell, 2000). Writing in the
seventeenth century, naturalist Rumphius declared that the iron produced at Lake Matano was as
good as steel (Beekman, 1999), and iron tools made there were also traded (Bronson, 1992;
Macknight, 1993:40). According to the earliest literature by Speelman (1670; cited in Caldwell, 1995;
Bulbeck and Caldwell, 2000:11), Luwu was an important region for the iron exporter. Iron in Lake
Matano contained small quantities of nickel and was probably traded to Java. Ware, the ruling Bugis

5
elite group, collected and exchanged their valuable local sources. (Bulbeck, 2000). They controlled
trade routes and the export of iron from Lake Matano (Caldwell, 1995). Then, Luwu began to enlarge
their power through the maritime trade system with surrounding islands, but the elite group
monopolised essential commodities, such as high quality iron wares for attaining surplus property
(Blok:1759; cited in Bulbeck and Caldwell, 2000; Bulbeck and Prasetyo, 2000; Bulbeck and Caldwell,
2008; Bulbeck, 2010; Speelman, 1670 cited in; Bulbeck and Caldwell, 2000).
Throughout the Dutch colonial period, most historical and archaeological literature in
Indonesia was written from a colonialist perspective, giving emphasis to the civilising influence that
European had on Indonesia and de-emphasising its indigenous ingenuity (Lape, 2002). Therefore,
not many of Luwu’s written traditions exist now that would enable us to report on the historical
background of the Bugis kingdom of Luwu (Bulbeck and Caldwell, 2000:5).
1.3 Iron production and use in Luwu
There are several studies that present iron in relation to the issues of economics (Bulbeck, 2000) and
trade (Bellwood, 1997; Bronson, 1992; Bulbeck, 2000; Hall, 1985; Hall, 2011; Lape, 2000; Osborne,
2010), but there is no comprehensive study in terms of the reconstruction of iron manufacturing
technology in Luwu, South Sulawesi, from the mining to smelting process of iron ores, and the forging
of iron products (O’Connor, 1975:174).
General iron deposits are distributed widely in the deposition of sedimentary rocks
(Bellwood, 1997:11-12). Distribution of high grade iron ore is uneven in the iron ore deposits in
Southeast Asia. The Indonesian islands of Java and Sulawesi were poor in providing excellent iron
ores, exceeding approximately 60 per cent iron (Bronson, 1992). Indonesia has abundant laterite
deposits (Aleva, 1994; Bellwood, 1997:11-12; Golightly and Arancibia, 1979; Purwanto et al, 2002)
but no haematite ore deposit (Purwanto et al, 2002). Laterite is defined as iron and aluminium rich
ore that is formed under tropical conditions (McNeil, 1974). Lateritic iron deposits bearing nickel is
a distinct feature in South Sulawesi (Figure 2). Typical iron content of laterites is between 15 and 30
wt% (Aleva, 1994) and their nickel content does not exceed two per cent (Bronson, 1987:13;
1992:85). An exploration by a geological team (Abendanon, 1917-1918; cited in Bronson, 1987:13)
discovered that a considerable tonnage of lateritic iron ores, with an average of 1.75 per cent of nickel
content, was deposited at Lake Matano. Deposits of the iron laterite and lump deposits are situated

6
in Eastern Sulawesi, and deposits of primary chromite are in south western and eastern Sulawesi.
The laterites are still in current mineral production for nickel and ferronickel alloy (Dorian et al,
1986).
Figure 2 Recorded Southeast Asian Metal Production. 1500-1800 AD. The figure showing iron and iron-nickel alloy called “pamor” production from Sulawesi. (Ag=silver, Au=gold, Cu=copper, Cu/Au=tambac, Cu/Pb=Copper-read, Cu/Ni=paktong, Cu/Sn=bronze, Cu/Zn=brass, C·Fe=cast iron, Fe=iron, Fe/Ni=”pamor”, Hg=mercury, Pb=lead, Sb=antimony, Sn=tin, steel, Zn=zinx, Zn/X=calamine) (Bronson, 1992:87, Figure 4).
Metalwork was amongst the most impressive objects exported from Southeast Asia in the
pre-Islamic period (Marschall, 2010:80). The great majority of exported metal was iron, as
mentioned above. Although smelters in some areas produced iron for local use only, other iron
makers tended to ship their iron to markets out of their area, rather than sell the metal in their local
market (Bronson, 1992). This is supported by the fact that most of smelting sites in Southeast Asia
were located away from the smithing sites. For example, the kris makers of Semarang in Java and the
bronze vessel casters of Sungai Puar in west Sumatra. It is presumed that this is connected with
7
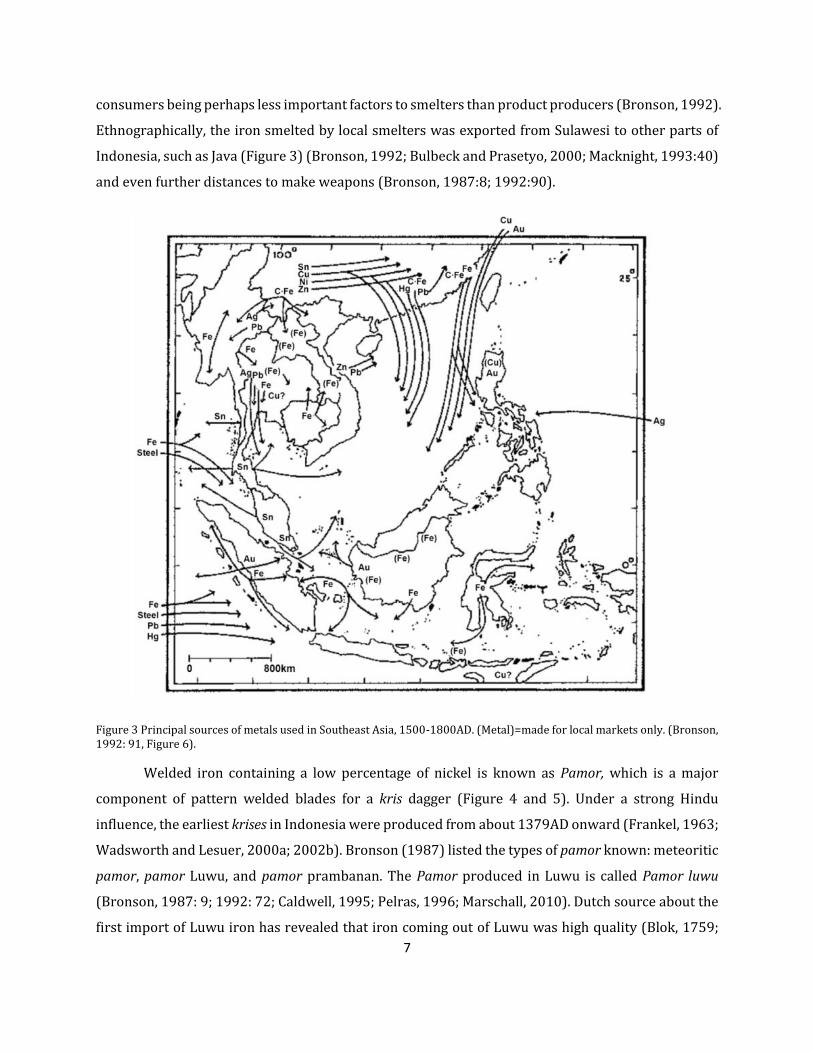
consumers being perhaps less important factors to smelters than product producers (Bronson, 1992).
Ethnographically, the iron smelted by local smelters was exported from Sulawesi to other parts of
Indonesia, such as Java (Figure 3) (Bronson, 1992; Bulbeck and Prasetyo, 2000; Macknight, 1993:40)
and even further distances to make weapons (Bronson, 1987:8; 1992:90).
Figure 3 Principal sources of metals used in Southeast Asia, 1500-1800AD. (Metal)=made for local markets only. (Bronson, 1992: 91, Figure 6).
Welded iron containing a low percentage of nickel is known as Pamor, which is a major
component of pattern welded blades for a kris dagger (Figure 4 and 5). Under a strong Hindu
influence, the earliest krises in Indonesia were produced from about 1379AD onward (Frankel, 1963;
Wadsworth and Lesuer, 2000a; 2002b). Bronson (1987) listed the types of pamor known: meteoritic
pamor, pamor Luwu, and pamor prambanan. The Pamor produced in Luwu is called Pamor luwu
(Bronson, 1987: 9; 1992: 72; Caldwell, 1995; Pelras, 1996; Marschall, 2010). Dutch source about the
first import of Luwu iron has revealed that iron coming out of Luwu was high quality (Blok, 1759;

8
cited in Bulbeck and Caldwell, 2000; Speelman, 1670 cited in; Bulbeck and Caldwell, 2000; Bulbeck
and Prasetyo, 2000; Bulbeck, 2010). Bronson (1978) concluded that most pamor came from the
Sulawesi owing to the advantage they had large iron-nickel ore deposits. The highly reputable
blacksmiths produced the kris dagger by welding, twisting, and bending the two different metals
together (Marschall, 2010: 82). The nickel in the pamor has an influence on the properties of kris,
which are resistance to corrosion and a texture of distinctive, fabulous silvery lines (O’Connor,
1975:176; Bronson, 1987:9; Marschall, 2010:82). The patterns show up on the blade’s surface only
after acid etching (O’Connor, 1975: 176; Bronson, 1987: 9). Lime juice was one of the main
ingredients for the etching process (Marschall, 2010: 82). Another significant characteristic of kris is
the straight or wavy blade (Bronson, 1987: 8; Frey, 2010; Pelras, 1996: 59). Kris is the representative
iron object that shows how Indonesian iron working achieved high value (O’Connor, 1975: 175). The
most famous krises are those from Java and Bali, but South Sulawesi also made good kris (Marschall,
2010: 82).
Figure 4 Iron weapons from Makassar, South Sulawesi. Knife (left): L 41.cm, W 10.5cm, Dagger (right): L 40cm, W 2.5cm (Marschall, 2010: 80, 81, Fig 91, 93).

9
Figure 5 Examples of Indonesian Pamor patterns. a) Watermelon skin b) Golden rain c) Arranged boning pieces d) Tricolor e) A string of flowers f) Kenanga flower petals (Frankel, 1963:19, Figure1).
1.4 Archaeological background in Luwu
Southeast Asia’s Prehistoric era started with the Palaeolithic period. This followed the Neolithic
period in Indonesia, which is called the Bronze-Iron Age (Van Heekeren, 1958) or the Early Metal
Phase (Bellwood, 1997), as there was no distinct Bronze Age (Bellwood, 1997; Bougas, 2007; Van
Heekeren, 1958). There has been iron in Southeast Asia since 400-200 BC (Bellwood, 2007:268;
Higham, 1989:190).
An international multidisciplinary research project, called the Origin of Complex Society in
South Sulawesi Project (OXIS), looked at the social complexity of the pre-Islamic history of the
kingdom of Luwu (Bulbeck and Caldwell, 2000). Indonesia is located in Southeast Asia. It is composed
of approximately seventeen thousands (17,508) islands and Sulawesi is its fourth largest island.

10
Sulawesi is divided into North, Central, Southeast, and South Sulawesi (Bruce, 2009:13). The OXIS
project focused on the Luwu sites in South Sulawesi and ran for three years, from October 1997 to
October 2000. It carried out excavations both in Luwu in the Gulf of Bone and in the western Cenrana
valley. These sites were territories of the kingdom of Luwu (Bulbeck and Caldwell, 2000).
The OXIS survey was directed towards the local iron industry. It excavated 29 sites, involving
107 square metres, and surveyed 56 sites in total. This study mainly discusses 12 sites, where iron
smelting remains were found (Figure 6 and Table 1). Luwu’s archaeological association with early
iron extraction dates from the early century to 1200. These finds indicate an elementary technology
of the iron roasting process. Practical iron bloomery smelting began at Lake Matano in the 15th
century (Bulbeck, 2010b). Iron smelting was a strike industry for Bugis in Luwu during the pre-
Islamic period (Bulbeck and Caldwell, 2000; Bulbeck, 2010a). Test pits were always one square metre,
apart from the Rahampu’u 1 where the original size was extended by an additional square metre.
Two additional test pits were surveyed in Rahampu’u 1. Nine, 11, and 22 test pits areas were
excavated in Katue, Sabbang Loand, and Pinanto. Each of the layers within the test pits are referred
to as units.
Figure 6 Relevant iron smelting relevant sites excavated and surveyed by OXIS in Luwu (map image from Google Earth).
11
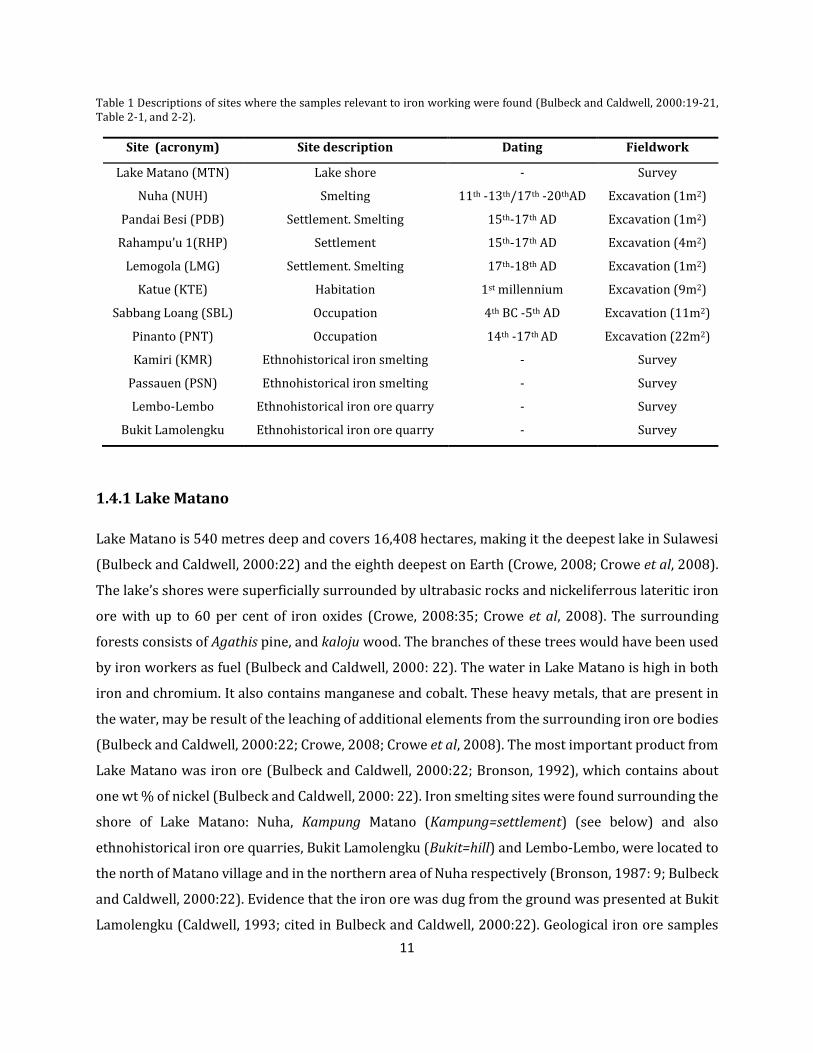
Table 1 Descriptions of sites where the samples relevant to iron working were found (Bulbeck and Caldwell, 2000:19-21, Table 2-1, and 2-2).
Site (acronym) Site description Dating Fieldwork
Lake Matano (MTN) Lake shore - Survey
Nuha (NUH) Smelting 11th -13th/17th -20thAD Excavation (1m2)
Pandai Besi (PDB) Settlement. Smelting 15th-17th AD Excavation (1m2)
Rahampu’u 1(RHP) Settlement 15th-17th AD Excavation (4m2)
Lemogola (LMG) Settlement. Smelting 17th-18th AD Excavation (1m2)
Katue (KTE) Habitation 1st millennium Excavation (9m2)
Sabbang Loang (SBL) Occupation 4th BC -5th AD Excavation (11m2)
Pinanto (PNT) Occupation 14th -17th AD Excavation (22m2)
Kamiri (KMR) Ethnohistorical iron smelting - Survey
Passauen (PSN) Ethnohistorical iron smelting - Survey
Lembo-Lembo Ethnohistorical iron ore quarry - Survey
Bukit Lamolengku Ethnohistorical iron ore quarry - Survey
1.4.1 Lake Matano
Lake Matano is 540 metres deep and covers 16,408 hectares, making it the deepest lake in Sulawesi
(Bulbeck and Caldwell, 2000:22) and the eighth deepest on Earth (Crowe, 2008; Crowe et al, 2008).
The lake’s shores were superficially surrounded by ultrabasic rocks and nickeliferrous lateritic iron
ore with up to 60 per cent of iron oxides (Crowe, 2008:35; Crowe et al, 2008). The surrounding
forests consists of Agathis pine, and kaloju wood. The branches of these trees would have been used
by iron workers as fuel (Bulbeck and Caldwell, 2000: 22). The water in Lake Matano is high in both
iron and chromium. It also contains manganese and cobalt. These heavy metals, that are present in
the water, may be result of the leaching of additional elements from the surrounding iron ore bodies
(Bulbeck and Caldwell, 2000:22; Crowe, 2008; Crowe et al, 2008). The most important product from
Lake Matano was iron ore (Bulbeck and Caldwell, 2000:22; Bronson, 1992), which contains about
one wt % of nickel (Bulbeck and Caldwell, 2000: 22). Iron smelting sites were found surrounding the
shore of Lake Matano: Nuha, Kampung Matano (Kampung=settlement) (see below) and also
ethnohistorical iron ore quarries, Bukit Lamolengku (Bukit=hill) and Lembo-Lembo, were located to
the north of Matano village and in the northern area of Nuha respectively (Bronson, 1987: 9; Bulbeck
and Caldwell, 2000:22). Evidence that the iron ore was dug from the ground was presented at Bukit
Lamolengku (Caldwell, 1993; cited in Bulbeck and Caldwell, 2000:22). Geological iron ore samples

12
were collected during the excavation from the traditional ore collection sites, and samples of MTN
866 (sherd) and MTN 820 (fuel ash slag) were collected from the lake shore surface while surveying
the area (Figure 7).
Figure 7 Iron conglomerate on the shore of Lake Matano. Zone 74 of Matano village survey (Bulbeck, 2012: 15, Plate 17).
(1) Nuha
Between February and March 1999, the OXIS team excavated 1m2 in the Nuha area (NUH) to a 92
centimetres depth (Figure 8 and 9). The OXIS team found 25.6 kilograms of iron smelting debris, a
half kilogram of charcoal, 3.2 kilograms of technical ceramics, two other iron fragments, 59
earthenware sherds with accreted iron bloom, and flaked cherts. Two radiocarbon dates form Nuha
using charcoals, revealed an early phase of iron smelting from the 11th to the 13th centuries and a late
phase of iron smelting from the 17th century to the second millennium CE. These two dates (see Table
2) from different units (unit 15 and unit 3) indicate that iron smelting appears to have commenced
during the early second millennium AD, and continuously conducted throughout the second
millennium AD (Bulbeck and Caldwell, 2000: 23-24).

13
Table 2 Radiocarbon dated from Nuha (modified from Bulbeck and Caldwell, 2010:24, Table 2-3).
OXIS Sample Label Date (BP) Two-sigma calibration
Early Iron Smelting
Nuha Test Pit 1, unit 15 960±70 BP AD 980-1260
Late Iron Smelting
Nuha Test Pit 1, unit 3 130±50 BP AD 1670-1945
Figure 8 Excavation of unit 12, test pit 1, feature penetrating the dark reddish brown sand at Nuha (Bulbeck, 2012: 16, Plate 20).
Figure 9 Stratigraphy of Nuha test pit (Bulbeck, 2012: 15, Plate 18).

14
(2) Kampung Matano (Matano Village)
The three main iron smelting sites of Kampung Matano (Matano Village: settlements) were excavated.
These were Pandai Besi (PDB), Rahampu’u 1 (RHP) and Lemogola (LMG). The sites were settlements
having evidence of major iron smelting. Pandai Besi is on the Lake Matano’s west shore, Rahampu’u
1 is situated 70 metres west of the lake Matano, and Lemogola is located slightly to the north part of
Rahampu’u. Pandai Besi and Rahampu’u 1 are estimated to be from the early iron smelting period of
the 15th to 17th century and Lemogola from the late iron smelting period from the 17th to 18th century,
according to the radiocarbon dating using charcoal found from each site (Table 3). According to the
Land of Iron (Bulbeck and Caldwell, 2000), traditional iron smelting technology and working
industry were developed and well established at Matano Village by the early 16th century.
Table 3 Radiocarbon dated from Pandai Besi (PDB), Rahampu’u 1 (RHP) and Lemogola (LMG) (Bulbeck and Caldwell, 2010:30, Table 2-5)
OXIS Sample Label Date (BP) One-sigma calibration Two-sigma calibration
Pre-Iron Smelting
RHP1.U12B5.14.7 1400±110 BP AD 540-770 AD 420-890
RHP1.U12B5.13.4 1000±40 BP AD 1000-1150 AD 980-1160
Early Iron Smelting
RHP1.S6T5.13.1 400±60 BP AD 1440-1620 AD 1430-1640
RHP1.S6T5.15.1 310±90 BP AD 1450-1790 AD 1430-1810
RHP1.S6T5.17.1 410±80 BP AD 1430-1630 AD 1400-1660
RHP1.S6B10.16.1 350±70 BP AD 1480-1640 AD 1430-1670
RHP1.S6B10.18.1 310±90 BP AD 1450-1670 AD 1430-1810
RHP1.S6B10.17.1 430±120 BP AD 1410-1630 AD 1290-1680
PDB.U1T3.13.73 480±130 BP AD 1330-1620 AD 1280-1670
PDB.U1T3.14.18 410±70 BP AD 1440-1630 AD 1420-1640
Late Iron Smelting
LMG.1.13.10 120±70 BP AD 1680-1930 AD 1670-1950
Pandai Besi (PDB) site (Figure 10) was a settlement on the west shore of Lake Matano. This
site was excavated 1m2, and dates from the 16th century, according to radiocarbon dating. The name
of Pandai Besi in Malay language means iron smith (Bulbeck and Caldwell, 2000). 285 flaked cherts

15
charcoal, iron smelting slags, and iron ores were found from the Pandai Besi site. One iron slag and
six iron ore/gangue samples were prepared for the examination.
Figure 10 Pandai Besi square U1T3, end of excavation of unit 4 where PDB 643A (iron ore) was collected (Bulbeck, 2012: 11, Plate 11).
Rahampu’u 1 (RHP) site is situated 70 metres west of the lake. The site was excavated in a
4m2 area (Figure 11), dating from the 15th to the 17th century after calibrating at one sigma. The main
ironworking deposit in this site was marked by a dark yellowish brown colour and was noticed with
dense smelting debris from the S6T5/S6B10. The S6T5 square (Figure 12) and S6B10 square (Figure
13) were suggested by Bellwood as the main ironworking deposit due to the high density that was
found. The S6B10 test pit was deposited one metre deeper than the S6T5 test pit, therefore the
evidence of ironworking from S6B10 should be slightly older than those from S6T5 and radiocarbon
dating using charcoal samples confirmed this. Iron smelting at the Rahampu’u 1 site seems to have
occurred from the 17th to 18th or 19th century. In this site, ceramic sherds, iron slags, and flaked cherts
were excavated (Bulbeck and Caldwell, 2000:29-30). Three iron slags, two ore/gangue samples, and
two iron artefacts were prepared for this study. One ceramic sample collected on the surface of this
site was also analysed.

16
Figure 11 Plan of Rahampu’u 1 in Kampung Matano showing the excavated test pits in relation to their heights above the lake surface (Bulbeck and Caldwell, 2000: 26, Map 3).
Figure 12 a) Rahampu’u 1 square S6T5, at end of excavation of unit 5 where RHP 158A was excavated b) Rahampu’u 1 square S6T5, at end of excavation of unit 14 where sample RHP 512A was excavated (Bulbeck, 2012: 9, Plate 7 and 8).

17
Figure 13 Rahampu’u 1 square S6B10, at end of excavation of unit 5 which yielded sample RHP 184A (Bulbeck, 2012: 10, Plate 10).
Lemogola (LMG) is situated to the north of Rahampu’u 1. The 1m2 area of site was excavated
(Figure 14) and the result of radiocarbon dating determined it to be 17th to 18th century. Iron smelting
at Lemogola was progressed after smelting had stopped at Rahampu’u 1. As much as 2.4 kilograms
of tuyère fragments were found from the fieldwork and there were amound of piled-up ironstone,
slag and other smelting waste (Bulbeck and Caldwell, 2000). Six slag samples and one iron ore sample
were prepared and analysed.
Figure 14 a) Lemogola square 1, excavation at end of excavation of unit 4 where LMG 704A and LMG 707A were collected (Bulbeck, 2012: 13, Plate 14). b) Lemogola square 1, excavation at end of unit 5 where LMG 713A was found (Bulbeck, 2012: 13, Plate 15). c) Lemogola square 1, excavation at end of excavation of unit 9 where LMG 812A was collected (Bulbeck, 2012: 14, Plate 16).

18
1.4.2 Katue
Along the River Cerekang, there is a Katue settlement that was excavated by the OXIS team. Katue, a
first millennium site, was a local settlement and it preserved ancient inhabitation debris. The
surveyed and excavated sites (9m2) of Katue are shown in Figure 15 and 16. Surface collection and
excavation revealed glass beads, iron ores, pebbles, and ceramics. Radiocarbon dating was conducted
only from test pit 5 (Table 4) and they determined the date to the first millennium. Six test pits
(Square 1,2,5,6,9 and one missing number) yielded debris corresponding to iron smelting and/or
working activities (iron ore, lumps of slag, and iron artefact fragments, see Figure 17) but the amount
of iron-related waste is less than that observed at the Lake Matano sites. It may indicate that there
were a range of economic activities at Katue and iron smelting was just one of those. Nevertheless,
the debris could prove that the entire iron producing process, from smelting to forging once took
place at Katue, perhaps in the second half of the first millennium AD (Bulbeck and Caldwell, 2000:
38-40).
Figure 15 Plan of Katue showing the extent of the site as determined through the subsurface survey and the excavated squares (Bulbeck and Caldwell, 2000: 39, Map 4)

19
Figure 16 Katue cacao orchard and drainage ditches near where specimen KTE 4231 was collected (Bulbeck, 2012: 3, Plate 2).
Figure 17 Katue metal specimens including KTE 2816 (iron prills) and KTE 2545 (iron tube fragment). KTE 2545 was recorded as a copper or bronze fragment but was identified as an iron fragment after EDS analysis (see chapter 3.4 Iron artefact) (Bulbeck, 2012: 17, Plate 21).
20
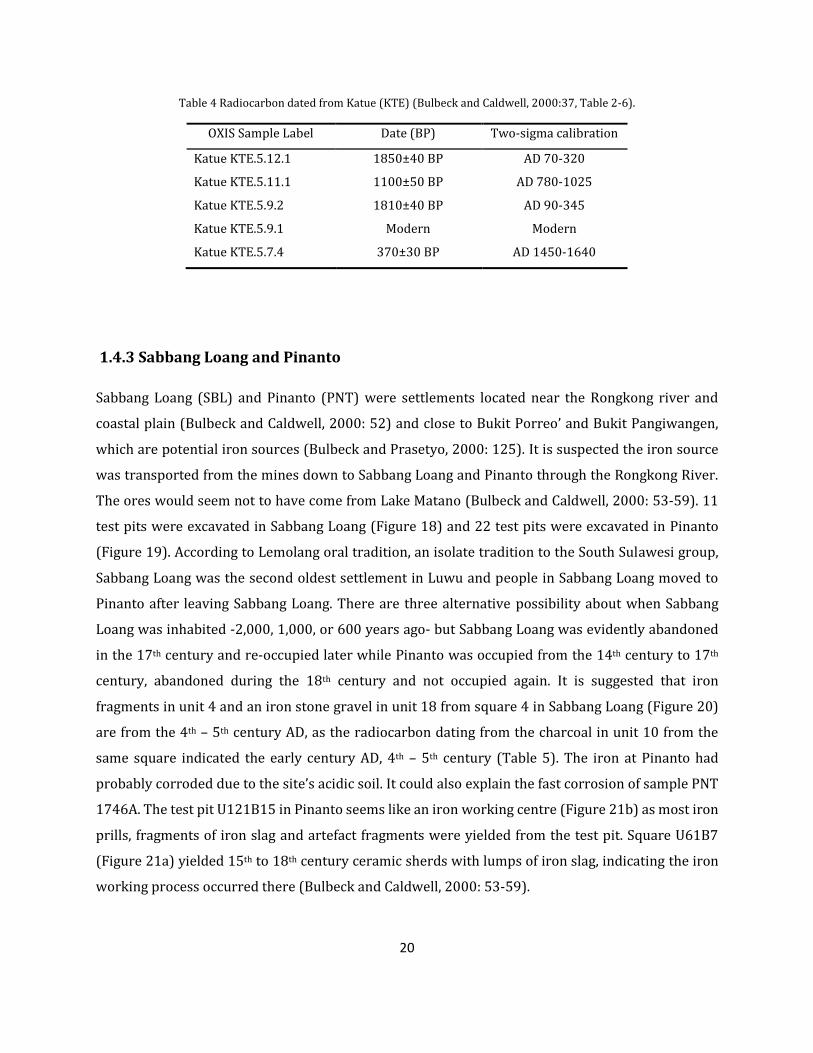
Table 4 Radiocarbon dated from Katue (KTE) (Bulbeck and Caldwell, 2000:37, Table 2-6).
OXIS Sample Label Date (BP) Two-sigma calibration
Katue KTE.5.12.1 1850±40 BP AD 70-320
Katue KTE.5.11.1 1100±50 BP AD 780-1025
Katue KTE.5.9.2 1810±40 BP AD 90-345
Katue KTE.5.9.1 Modern Modern
Katue KTE.5.7.4 370±30 BP AD 1450-1640
1.4.3 Sabbang Loang and Pinanto
Sabbang Loang (SBL) and Pinanto (PNT) were settlements located near the Rongkong river and
coastal plain (Bulbeck and Caldwell, 2000: 52) and close to Bukit Porreo’ and Bukit Pangiwangen,
which are potential iron sources (Bulbeck and Prasetyo, 2000: 125). It is suspected the iron source
was transported from the mines down to Sabbang Loang and Pinanto through the Rongkong River.
The ores would seem not to have come from Lake Matano (Bulbeck and Caldwell, 2000: 53-59). 11
test pits were excavated in Sabbang Loang (Figure 18) and 22 test pits were excavated in Pinanto
(Figure 19). According to Lemolang oral tradition, an isolate tradition to the South Sulawesi group,
Sabbang Loang was the second oldest settlement in Luwu and people in Sabbang Loang moved to
Pinanto after leaving Sabbang Loang. There are three alternative possibility about when Sabbang
Loang was inhabited -2,000, 1,000, or 600 years ago- but Sabbang Loang was evidently abandoned
in the 17th century and re-occupied later while Pinanto was occupied from the 14th century to 17th
century, abandoned during the 18th century and not occupied again. It is suggested that iron
fragments in unit 4 and an iron stone gravel in unit 18 from square 4 in Sabbang Loang (Figure 20)
are from the 4th – 5th century AD, as the radiocarbon dating from the charcoal in unit 10 from the
same square indicated the early century AD, 4th – 5th century (Table 5). The iron at Pinanto had
probably corroded due to the site’s acidic soil. It could also explain the fast corrosion of sample PNT
1746A. The test pit U121B15 in Pinanto seems like an iron working centre (Figure 21b) as most iron
prills, fragments of iron slag and artefact fragments were yielded from the test pit. Square U61B7
(Figure 21a) yielded 15th to 18th century ceramic sherds with lumps of iron slag, indicating the iron
working process occurred there (Bulbeck and Caldwell, 2000: 53-59).

21
Table 5 Radiocarbon dates from Sabbang Loang (SBL) (Bulbeck and Caldwell, 2000:61, Table 2-7).
OXIS Sample Label Date (BP) Two-sigma calibration
SBL.1-2.5.1 (square 2, unit 5) 1750±50 BP AD 160-420
SBL.1-3.4.1 (square 3, unit 4) 1780±50 BP AD 130-390
SBL.3-1.9.4 (square 1, unit 9) 1910±70 BP 50 BC-AD 320
SBL.1-4.10.3 (square 4, unit 10) 1990±200 BP 410 BC- AD 435
SBL.1-4DB.1 (square 4, west wall) 2020±140 BP 380 BC-AD 320
SBL.1-4.19.1 (square 4. Unit 19) Modern Modern
Figure 18 Plan of Sabbang Loang illustrating the test pits within five sectors (Bulbeck and Caldwell, 2000: 60, Map 6).

22
Figure 19 Plan of Pinanto showing the extent of the site and the excavated test pits (Bulbeck and Caldwell, 2000: 57, Map 5).

23
Figure 20 Stratigraphy of Sabbang Loang square 1-4, showing approximate provenance of iron specimens (Bulbeck, 2012: 6, Plate 5).
Figure 21 a) Pinanto square U61B7, at end of excavation of unit 10 where PNT 1664 was recovered from the habitation deposit. b) Pinanto square U121B15, at end of excavation of unit 4 where PNT 1745B and 1746A were found from a shallow deposit with evidence of ironworking (Bulbeck, 2012: 18-19, Plate 22-23)
1.4.4 Ethnohistorical iron smelting sites
Two ethnohistorical iron smelting sites were surveyed: Kamiri (KMR) and Passauen (PSN). The two
sites are located in the northern area of the Bukit Porreo’ and northwest of the Sabbang Loang. One
iron ore sample was collected from Kamiri and one slag and one iron artefacts were collected from
the surface of Passauen (Bulbeck and Caldwell, 2012).

24
1.5 Aims and objectives
The pre-Islamic period in South Sulawesi is not well understood but iron production technology in
South Sulawesi, especially the Luwu region, is historically and archaeologically crucial. This is
because this region was recorded as one of the major places where iron-nickel alloy production took
place by smelting lateritic iron ores. The iron-nickel alloy source produced in Luwu, pamor Luwu,
was used to produce the Indonesian dagger kris (Bronson, 1987). Previous studies about pamor have
suggested a few possibilities how the nickel was alloyed with iron (Bronson, 1987; Frankel, 1963;
Maisey, 1988), but did not revealed how the pamor Luwu was produced.
In Luwu, the archaeological remains excavated and/or surveyed from the 12 sites include
mainly iron smelting slag, iron ore, and a few ceramic samples. Slag is a valuable source that indicates
the use of smelting technology, as it is mostly found at the smelting sites (Bachmann, 1982: 10). It
can also be used to detect the temperature and the furnace atmosphere at the time of solidification
when its chemical composition and the minerals in it are analysed (Killick, 2001). Not only slag
analyses, but also iron ore and ceramic analyses will allow us to reconstruct how the technology could
contribute to the slag formation.
These archaeometallurgical approaches will consider the smelting operation parameters,
including the technical efficiency, ore charge, and their influence during the smelting constraints.
They will also consider the types of iron being produced depending on the sites. Thus this study will
shed light on all the aspects of the technical and social complexity of iron-nickel alloy production
technology in Luwu during the pre-Islamic period, reconstructing the technology through a
characterisation and evaluation of archaeological iron smelting debris from the sites in Luwu, South
Sulawesi. It will also examine why the Bugis made iron in the Luwu region, why they produced iron
in the way they did, why they exported iron to other regions and how this iron technology is related
to the history of Luwu. Once these reasons have been established, they will be compared with the
results generated by the analyses as well as the archaeological contexts. Finally, this will be a
fundamental study for further research into the iron production in Luwu during pre-Islamic period
or iron-nickel alloy smelting process.

25
2.1 Material
2.1.1 Sample
The archaeometallurgical remains on which this study is focused on, were excavated from 12 sites in
Luwu, South Sulawesi, Indonesia: Lake Matano (Nuha, Matano village, Lembo-Lembo, and Bukit
Lamolengku), Katue, Sabbang Loang and Pinanto, Kamiri and Passauen.
During the excavation from 1997 to 2000, 44 specimens (Table 6), relating to iron production
were discovered at the archaeological and ethnohistorical sites of Luwu (Bulbeck, 2012) and were
chosen and analysed. Only a limited number of samples from each site, however, could be studied.
The materials consist of slag, the waste product of the iron smelting operation, as well as several iron
objects and ceramics. The samples were labelled in the order of the site acronym and given a
specimen number. By investigating the slag samples based on their chemical composition, and
microstructure, iron production technology could be reconstructed with the study of ores and gangue
from ethnohistorical iron smelting sites and potential mining sites. Iron artefacts were additionally
studied to determine their technology of iron artefacts production, and their relation to the sites’ slag,
mineral and archaeological ore samples.
All samples were given to me as specimens for metallographic analysis after being prepared
by the late Dr Len Hogan, who worked at the Department of Mining and Metallurgical Engineering at
the University of Queensland between 1998 and 2000 (Bulbeck, 2012). The samples had been looked
at previously but the researcher unfortunately died before the study was finished. Since all the
polished blocks had been prepared about ten years ago, they blocks seem to have been severely
corroded. Also, for whatever reason, several samples were cut into small pieces. Archaeological
information about the Luwu prepared samples were documented by Bulbeck (2012). The
documentation gave the excavated location, specimen identification number, fieldwork identification
and previous laboratory identification, but unfortunately some of the samples’ identification was
misinterpreted and there was an absence of images. Therefore, all specimens were required
individual identification again. Descriptions and images of samples are presented in Table 6 and
Appendix 1. Two samples, PNT 1746 and Lamolengku 124, could not be analysed due to their
CHAPTER TWO: MATERIAL AND METHODS

26
severely corroded condition. Two slag samples recorded as RHP 158A and LMG 812A were not
labelled in the samples so it was not possible to distinguish them.
Table 6 Specimens excavated or collected in sites in Luwu are categorised according to the material types including slag, ore, gangue, ceramic, and object.
Site Slag Ore Gangue Ceramic Object Total
Lake Matano (MTN) 1 1 2
Nuha (NUH) 1 1 2
Pandai Besi (PDB) 1 3 2 1 7
Rahampu’u 1(RHP) 3 1 1 3 8
Lemogola (LMG) 6 1 7
Katue (KTE) 1 1 1 3
Sabbang Loang (SBL) 2 3 5
Pinanto (PNT) 1 3 4
Kamiri (KMR) 1 1
Passauen (PSN) 1 1 2
Lembo-Lembo 1 1 2
Bukit Lamolengku 1 1
Total 15 7 7 3 12 44
2.1.2 Sample preparation
Sample preparation was carried out as polished blocks by Dr. Hogan in about 2000. For whatever
reason, most of the samples had an irregular and uneven surface. The samples therefore were
polished to make a flat surface by grinding them back with grinding papers of 360 to 620 grit. As the
surfaces of the samples were contaminated and corroded, the surfaces were ground on successive
grades of grinding paper, from 2500 to 4000 grit, and then polished with diamond paste down to one
micron in order to analyse the 44 specimens for their chemical composition and microstructure. As
a final stage, the sample blocks were coated with a thin layer of carbon and applied with carbon tape
in order to reduce the charging of samples under SEM (Kim et al, 2010).
SEM-EDS analysis cannot detect carbon content in the metallic iron samples because of the
carbon coating on the sample surface. Therefore, after chemical composition analyses through SEM-
EDS, the metallic samples including iron prills in slags and metallic iron were re-polished to one
micron again in order to remove carbon coating on the sample surface, and were then etched. The

27
sample PSN 4240-2 was etched in etchant solution of three per cent Nital in ethanol for 45 seconds.
There was an attempt to etch prills in slags and iron islands in artefacts in three per cent Nital, but
the microstructures did not show up. Thus, they were etched again in four per cent Nital in ethanol
for one minute to five minutes according to the guide by Petzow (1978). All samples were instantly
washed with ethanol and properly dried. In the case of the sample PSN 4240-2, it was coated with
gold when the microstructure was identified under Hitachi SEM.
2.2 Analytical methods
The material was examined at the Wolfson Archaeological Science Laboratories at the UCL Institute
of Archaeology, London, UK. The aim of the analyses was to compositionally characterise the
materials indicating the metallurgical processes, to explore their technological significance. Optical
Microscopy (OM) and Scanning Electron Microscope with Energy Dispersive Spectrometry (SEM-EDS)
were chosen because the sample had been cut and polished as blocks. The chemical analyses of the
iron smelting debris was used to access the iron smelting slag formation, the furnace conditions, and
iron smelting operation parameter. The optical analyses could be used to interpret the cooling rate
of slag, inclusions in ceramic, and the presence of carbon. Overall, the results could be used to
determine the nature and spatial arrangement of the phases present and to reconstruct the chemical
and redox environments during slag formation, and to delineate the original parameters.
2.2.1 Optical microscopy
Before analysing SEM, optical microscopy, which used a binocular microscope with an external light
source, was primarily conducted to scrutinise the metallic microstructure under various
magnifications (x50, x100, and x200). Microstructures were observed using LEICA Microsystem Ltd
with CH-9435 Heerbrugg, DFC290HD. The areas of interest were identified under plane polarized
light (PPL) and cross-polarized light (XP). This study was used to identify the areas of interest in
preparation for further SEM-EDS study.
The microstructure of metallic samples can be identified after etching to discover whether
the sample is an iron or steel. To confirm three and four per cent Nital etchant works properly, plain

28
carbon steel standards (BAS S.S 431-435 by BAS Ltd) and a low phosphorous iron standard (SUS
1/19 by BAS Ltd) were etched in advance. The standards are varying with six different carbon
concentrations. The carbon contents of the standard samples and microstructures of etched standard
samples are given in Figure 22.
Figure 22 Microstructures of etched standards in 4% Nital for one minute. a) S.S 431 (0.019% C, ferrite), b) S.S 432 (0.093% C, wrought iron), c) S.S 433(0.19% C, low carbon steel), d) S.S 434 (0.37% C, steel), e) S.S 435 (0.49% C, steel), f) SUS 1/9 low phosphorous iron (3.1% C, cast iron).

29
2.2.2 SEM-EDS
The samples were quantitatively analysed using a Philips XL30 scanning electron microscope (SEM),
equipped with an Oxford Instruments energy dispersive X-ray spectrometer (EDAX system). Both
secondary electron (SE) and backscattered electron (BSE) imaging were used to investigate the
phases, but the backscattered electron (BSE) image detector was mainly used to study the
microstructure of the samples. The SEM-EDS system used an accelerating voltage of 20kV, a working
distance of 10mm, a spot size of 5.8 and a process time 5, corresponding to an average dead time of
35-40%.
Data was processed by INCA Oxford spectrometer software, outputting data as elements in
metal droplets and artefacts. Oxygen was added automatically by stoichiometry in ores, gangue,
ceramic, and slags from the measured analytical spectra. Calibration of the EDS was undertaken at
approximately 20 minute intervals throughout by analysing a cobalt standard. This was done in order
to correct for the spectrum drift and beam current drift to ensure the operation continued at a
sufficient level of quantitative reliability. Two standards, low phosphorus iron (SUS 1/19) and
Iceland basalt (BIR-1) of known chemical compositions (Certified Reference Materials, CRM), were
run in order to identify instrumental errors. This allowed the test of the accuracy and precision
corresponding reliability of data to be tested. Accuracy and precision are represented in Table 7. The
bulk chemical composition was obtained by averaging five analyses of areas from 1190 ㎛ ×924 ㎛
to 398 ㎛ ×309 ㎛, depending on the magnifications (x100 or x300). Point and area analyses were
undertaken to produce chemical analyses of the individual phases within the samples. Considering
the variable beam intensity of the SEM system and the porosity of the samples, all the data has been
normalized to 100%, but analytical totals are also provided. Iron standard, which has been
normalised to 96.9% due to carbon content (3.1%) is an exception. The detection limits for most
elements were c. 0.1 to 0.2 wt%.
To identify the presence of carbon, the essential element in steel, in the metallic sample, a
Hitachi S-3400N scanning electron microscope (SEM) equipped with an attached Oxford Instruments
EDX was used after etching the samples. This SEM equipment is suitable for obtaining high
magnification and high quality images but it also provides semi-quantitative data rather than
quantitative data. Under the SEM, the etched microstructure was observed and the carbon content
were qualitatively analysed.

30
Table 7 Accuracy and precision test using the standards of low phosphorus iron (SUS 1/19) by BAS Ltd and Iceland basalt (BIR-1) by USGS. These were used to monitor the reliability of SEM-EDS analysis. Data of iron standard was normalised to 96.9% because the standard contains 3.1% carbon which was not able to be detected due to carbon coating. Basalt standard was normalised to 100%. Original analytical totals are given.
Composition (%)
Iron Si V Cr Mn Fe Ni Cu Mo Total
1 2.81 0.06 0.57 0.41 91.69 0.28 0.46 0.62 92.07
2 3.01 0.05 0.56 0.44 91.17 0.25 0.53 0.89 91.02
3 2.91 0.14 0.55 0.34 91.58 0.19 0.54 0.67 89.34
Average 2.91 0.08 0.56 0.40 91.48 0.24 0.51 0.72
Given number 2.8 0.04 0.50 0.44 91.9 0.19 0.47 0.33
CV (%RSD) 3.48 54.73 2.42 12.55 0.30 19.67 8.77 20.06
δ relative 3.91 108.57 12.26 10.21 0.46 27.29 7.78 119.44
Basalt Na2O MgO Al2O3 SiO2 CaO TiO2 MnO FeO Total
1 1.74 9.98 15.58 47.64 13.41 1.01 0.13 10.52 119.12
2 1.74 10.09 15.32 47.54 13.35 0.98 0.21 10.76 119.09
3 1.80 9.97 15.71 47.43 13.36 1.01 0.20 10.52 118.44
Average 1.76 10.01 15.54 47.54 13.37 1.00 0.18 10.60
Given number 1.82 9.70 15.5 47.96 13.3 0.96 0.175 8.34
CV (%RSD) 2.11 0.67 1.28 0.22 0.22 1.50 24.46 1.30
δ relative 3.32 3.21 0.23 0.88 0.54 4.21 3.97 37.13

31
3.1 Ore and Gangue
The property of iron ore charged into the furnace contributes to the largest proportion of slag
formation (Paynter, 2006). Depending on the type of ore used, different chemical composition of iron
metal and/or slag could be produced. High quality iron minerals can be informed as hydrated iron
oxide (Limonite), iron carbonate (Siderite), and iron oxide (Haematite) (Bayley et al, 2001). Bog iron
could have been used as a main source for the bloomery smelting process (Bayley et al, 2001) as bog
ores consist of fine ore grains, which could be small lumps after roasting the ore (Tylecote, 1987:53).
A total 14 iron ore samples, including gangue materials, were sampled from five excavation
sites (Pandai Besi, Rahampu’u 1, Lemogola, Katue, and Sabbang Loang), an ethnohistorical iron
smelting site at Kamiri and two ethnohistorical iron ore quarry near the Lake Matano (Lembo-Lembo
and Bukit Lamolengku). Lembo-Lembo was the ethnohistorical iron ore source for the ironworkers
at Nuha and Bukit Lamolengku was the ethnohistorical iron source for Matano village (Bulbeck,
2012). The iron ore sample from Bukit Lamolengku (Lamolengku 124) was sampled, but
unfortunately it could not be analysed due to its poor condition. The results of the bulk analyses of
the iron ore and gangue samples are given in Table 8. Full compositional data and spot analyses are
presented in Appendix 2-1.
The major compounds of the iron ore and gangue samples were iron oxide (FeO), magnesia
(MgO), alumina (Al2O3), and silica (SiO2) but chromium oxide (Cr2O3) and nickel oxide (NiO) were
also frequently recorded, which was peculiar. However, none of the samples had cobalt above the
detection limits as was expected. This is despite, as I state above, there being an expectation that iron
ore from Lake Matano may contain cobalt because of heavy metals present in water (Bulbeck and
Caldwell, 2000:22; Crowe, 2008; Crowe et al, 2008).
Half of the iron ores and gangue were found in Matano villages: the 15th -17th century village
Pandai Besi (PDB), and Rahampu’u 1 (RHP), and the 17th – 19th century village Limogole (LMG). Three
of the iron ores (PBD 890-L, -R, and LMG 704A) had high concentrations of iron oxide, which is high
quality material for iron extraction. PDB 646A contained relatively high iron oxide proportion of 41
wt%. Another reasonably high grade iron ores were collected from Kamiri (KMR) and Lembo-Lembo
CHAPTER THREE: RESULTS

32
contained about 50% and 61% of FeO, respectively. The iron ores predominantly associated with
silicates or aluminosilicates (Tylecote, 1991; Bayley et al, 2001) are called gangue. Gangue from Luwu
were high in silica content, ranging 44 to 96 wt%, and had a lower proportion of iron oxide, spanning
from 2 to maximum 22 per cent. The iron source from Pandai Besi, Lembo-Lembo included chromium
and nickel oxides in the EDS bulk analyses and an iron ore from Katue contained chromium oxide.
Most of them had below four per cent of Cr2O3 and two per cent of NiO. The chromium and nickel
oxides are likely to be connected to the geological feature of South Sulawesi, which has large lateritic
iron deposits bearing less than two per cent of nickel (Bronson, 1987; 1992; Dorian et al, 1986;
Marschall, 2010) with small quantities of chromium, and manganese (Dorian et al, 1986).
Table 8 Bulk chemical composition data by SEM-EDS for ore and gangue samples from Luwu sites, normalised to 100% with original analytical totals given. All values are an average of five analyses of each sample and calculated in compound % by stoichiometry (bd= below detection limit).
Composition (%)
Sample MgO Al2O3 SiO2 P2O5 K2O CaO TiO2 Cr2O3 MnO FeO NiO Total
PDB 646A 9.8 18.0 0.9 bd bd bd 0.2 29.8 bd 41.0 0.3 115.1
PDB 890-L 1.1 4.6 10.5 bd bd 0.8 bd 2.0 0.3 80.7 bd 119.2
PDB 890-R bd 0.9 3.3 bd bd bd bd 0.8 bd 93.6 1.4 95.7
PDB 885 0.6 4.5 88.7 bd 0.6 1.3 0.3 bd 0.4 4.3 bd 85.3
PDB 897 1.2 6.6 70.2 bd 0.6 4.7 0.4 0.3 0.4 15.4 0.2 96.5
RHP 541 3.9 4.5 85.8 0.8 1.3 1.2 0.2 bd bd 2.4 bd 96.5
LMG 704A bd bd 0.4 bd bd bd bd bd 0.6 99.0 bd 94.1
KTE 4231 27.8 2.2 44.2 bd bd 4.0 bd 0.7 1.2 19.9 bd 69.5
SBL 5076A bd 16.6 59.0 0.8 bd bd 1.0 bd bd 22.6 bd 64.4
SBL 5089B 6.1 17.0 60.9 0.3 3.5 3.5 1.5 bd bd 9.8 bd 68.5
KMR 4246 0.5 28.2 19.7 0.3 bd 0.2 0.7 bd 0.2 50.0 bd 77.8
Lembo-Lembo 4561-1 bd 20.6 13.6 bd bd bd bd 3.4 0.3 61.5 0.7 69.5
Lembo-Lembo 4561-2 bd bd 96.4 bd bd bd bd 0.1 bd 3.4 bd 77.0
Among iron ore samples from Pandai Besi site, PDB 890-L and -R (Figure 23) included high
grade iron ore, consisting of over 80 wt% iron oxide. By contrast gangue samples PDB 897 and PDB
885 had low concentrations of FeO at about 15 and 5 wt% respectively. The samples were combined
with some impurities of magnesium oxide, alumina, silica, and so on. In addition, oxides such as Cr2O3
and NiO were detected from the samples.

33
Figure 23 a) Backscattered electron image of PDB 890-L showing different types of minerals dominated in the sample. It also has high concentration of iron oxide and cherts are present in the matrix. b) Backscattered image of PDB890-R showing texture of the ore.
PDB 646A contained just over 40 per cent of FeO and around 30 per cent of Cr2O3, by far the
highest concentration of chromium oxide in the assemblage of Pandai Besi (PDB). The high
concentration of chromium oxide was because of numerous chromite minerals (Figure 24). The
chromite minerals were made of chromium oxide (c. 45%), magnesia (c. 14%), and alumina (c. 25%)
in iron rich matrix, as FeO can be replaced by MgO, and Al2O3 can replace Cr2O3 in a chromite spinel
of FeO·Cr2O3 (FeCr2O4). This PDB 646A sample was exceptional and so may not be totally
representative of the typical ore make up the furnace charge, but it is useful to identify that chromite
was available in the environment, as the presence of chromite in the ore will help to explain
chromium oxide concentration in the slag (see Chapter 3.3).
Figure 24 Backscattered electron image of PDB 646A showing chromite particles in iron rich matrix.

34
Two samples (PDB 885 and PDB 897), initially classified as ores, showed evidence that they
had been exposed to high temperatures under microscopic examination. PDB 885 mostly consists of
quartz and pores in a glassy matrix. The quarts in PDB 885 contain polycrystalline quartz, scattered
quartz as small particles and recrystallised quartz particles after partial dissolution crystals (Figure
25). The distributed quartz and porosities in the samples are evidence that the sample was affected
by extremely high temperature treatment, as quartz can recrystallise at around 1200-1300 in a flux-
rich environment. PDB 897 is an iron mineral conglomerate with slaggy material inside (Figure 26).
The sample involves metallic iron-nickel alloy (about 35% nickel) in a crescent shape (Figure 27a)
that may not be representative of the original concentration of the alloy. In the slaggy area, there are
small wüstite dendrites, abundant porosity and quartz particles (Figure 27b), whereas iron minerals
and a small piece of charcoal are present in the conglomerate area (Figure 28). The SEM-EDS
analytical data of a small wüstite dendrite contained not only typical compounds of 74.5 wt% FeO,
6.5 wt% Al2O3, and 10.3 wt% SiO2, but also 4.3 % Cr2O3, and 1.4 wt% NiO (Table 9). Nickel content in
the crescent shaped iron-nickel alloy and the wüstite dendrite indicate that the metallic iron
produced in Pandai Besi may be nickeliferous alloy (see Chapter 3.3 for more on this). Based on the
features mentioned above, iron oxide concentrations of PDB 897 and 885 are too low to allow
reduction of a significant amount of iron in a slag-melting process so that these seems to be gangue-
rich parts of the ore that were either left in the furnace because they did not react completely, or were
discarded after some high-temperature preparation of the ore.
Figure 25 Backscattered image of PDB 885 showing a) polycrystalline quartz and scattered quartz in glassy matrix with porosities. b) recrystallised quartz particles after partial dissolution crystal.

35
Figure 26 a) Backscattered electron image of PDB 897 showing the slag part inside of the sample. Quartz crystals and scattered quartz are dominated and porosities from heating treatment are present. b) Backscattered electron image of conglomerate part in sample PDB 897 illustrating iron rich minerals.
Figure 27 a) Backscattered image of PDB 897 showing the border between the slaggy area and conglomerate area. There is crescent shaped metallic iron-nickel alloy (bright grey). b) Backscattered image of PDB 897 presenting wüstite and quartz in glassy matrix.
Table 9 SEM-EDS analytical results for some phases shown in Figure 27b. All data is normalized to 100% with original analytical totals given. All values are calculated in compound % by stoichiometry (bd= below detection limit).
Composition (wt%)
MgO Al2O3 SiO2 K2O CaO TiO2 Cr2O3 MnO FeO NiO Total
Wüstite 1.0 6.5 10.3 bd bd 0.9 4.3 1.2 74.5 1.4 93.0 Glassy matrix 2.1 13.6 54.4 0.8 6.7 0.5 bd 2.3 19.6 bd 112.5
Quartz bd bd 99.0 bd 0.2 bd bd bd 0.8 bd 117.1

36
Figure 28 Backscattered image of PDB 897 showing a piece of charcoal embedded in the conglomerate area in the sample.
Figure 29 Microphotographs of RHP 541 under a) PPL b) XP showing quartz grains and iron mineral.
From the Rahampu’u 1 site, only one iron ore was prepared for a sample. RHP 541 is low
in FeO consisting of under three per cent FeO and high in SiO2, which is 85 wt% so it should rather
be labelled as gangue. No chromium and nickel oxides were detected above detection limit from this
sample. The microphotographs show numerous quartz grains and few iron minerals (Figure 29). One
ore sample found from Lemogola (LMG 704A) is composed of tiny particles of iron mineral, with just
one per cent of silica and manganese oxide, and it is extremely high in iron oxide (99 wt% FeO). It is
likely that the ore had been perfectly prepared for iron extraction.
Apart from the sites in Matano village (Pandai Besi, Rahampu’u 1, and Lemogola), iron ore
and/or gangue samples were also collected from Katue (KTE), Sabbang Loang (SBL), Pinanto (PNT),
Kamiri (KMR), and Lembo-Lembo, and were analysed. Sample KTE 4231 contains c. 44 wt% SiO2, c.
20 wt% FeO, and an unexpectedly high level of MgO (c. 27 wt%), that reflected in magnesium rich

37
olivine. SBL 5076A and 5089B contained under 23 wt% FeO associated with aluminosilicates (c. 17
wt% Al2O3, c. 60 wt% SiO2), which are not viable iron ores. Two iron ores with 50-60 wt% of iron
oxide were collected from Kamiri (KMR 4246) and Lembo-Lembo (Lembo-Lembo 4561-1). The latter
iron ore contained 3.4 wt% Cr2O3 and 0.7 wt% NiO. There was one more sample collected from
Lembo-Lembo (Lembo-Lembo 4561-2) that was simply composed of silica (c. 96 wt%) and just 0.1
wt% chromite oxide and 3.4 wt% iron oxide, identified as gangue. Lembo-Lembo, where is there is
an ethnohistorical iron ore quarry, is known as an iron ore deposit for the iron smelting at Nuha.
Therefore, the Lembo-Lembo ore will be compared to a slag from Nuha and be discussed below.
38
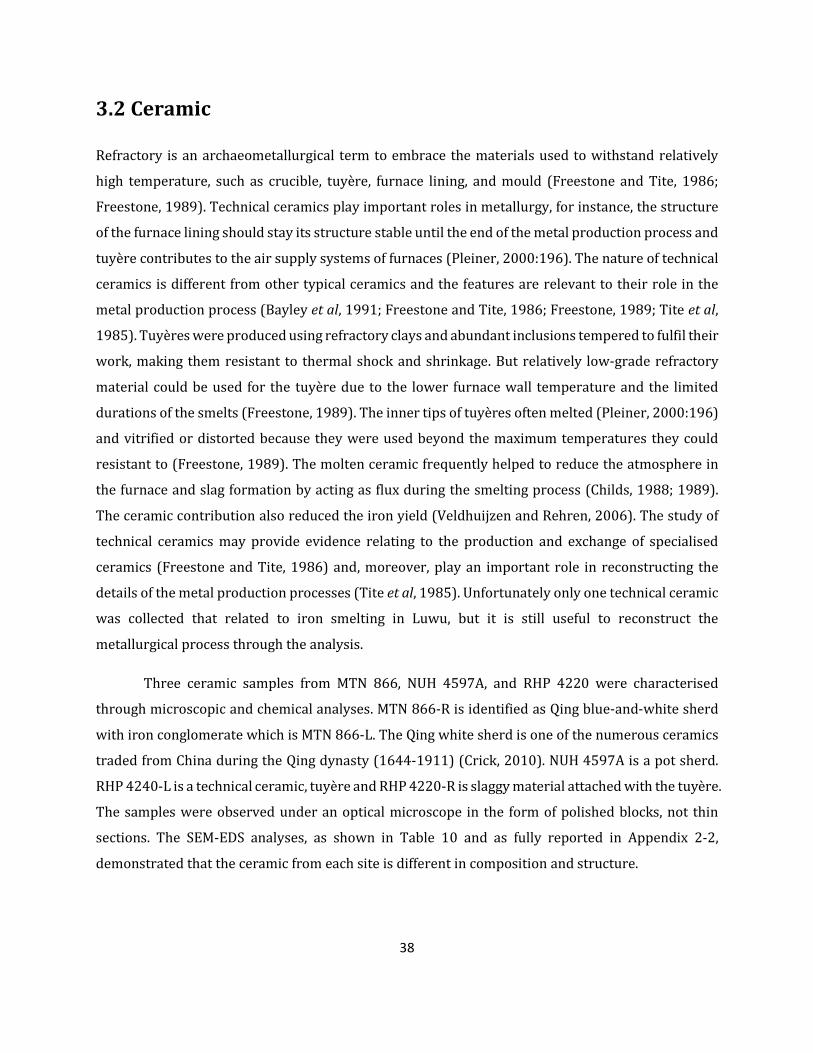
3.2 Ceramic
Refractory is an archaeometallurgical term to embrace the materials used to withstand relatively
high temperature, such as crucible, tuyère, furnace lining, and mould (Freestone and Tite, 1986;
Freestone, 1989). Technical ceramics play important roles in metallurgy, for instance, the structure
of the furnace lining should stay its structure stable until the end of the metal production process and
tuyère contributes to the air supply systems of furnaces (Pleiner, 2000:196). The nature of technical
ceramics is different from other typical ceramics and the features are relevant to their role in the
metal production process (Bayley et al, 1991; Freestone and Tite, 1986; Freestone, 1989; Tite et al,
1985). Tuyères were produced using refractory clays and abundant inclusions tempered to fulfil their
work, making them resistant to thermal shock and shrinkage. But relatively low-grade refractory
material could be used for the tuyère due to the lower furnace wall temperature and the limited
durations of the smelts (Freestone, 1989). The inner tips of tuyères often melted (Pleiner, 2000:196)
and vitrified or distorted because they were used beyond the maximum temperatures they could
resistant to (Freestone, 1989). The molten ceramic frequently helped to reduce the atmosphere in
the furnace and slag formation by acting as flux during the smelting process (Childs, 1988; 1989).
The ceramic contribution also reduced the iron yield (Veldhuijzen and Rehren, 2006). The study of
technical ceramics may provide evidence relating to the production and exchange of specialised
ceramics (Freestone and Tite, 1986) and, moreover, play an important role in reconstructing the
details of the metal production processes (Tite et al, 1985). Unfortunately only one technical ceramic
was collected that related to iron smelting in Luwu, but it is still useful to reconstruct the
metallurgical process through the analysis.
Three ceramic samples from MTN 866, NUH 4597A, and RHP 4220 were characterised
through microscopic and chemical analyses. MTN 866-R is identified as Qing blue-and-white sherd
with iron conglomerate which is MTN 866-L. The Qing white sherd is one of the numerous ceramics
traded from China during the Qing dynasty (1644-1911) (Crick, 2010). NUH 4597A is a pot sherd.
RHP 4240-L is a technical ceramic, tuyère and RHP 4220-R is slaggy material attached with the tuyère.
The samples were observed under an optical microscope in the form of polished blocks, not thin
sections. The SEM-EDS analyses, as shown in Table 10 and as fully reported in Appendix 2-2,
demonstrated that the ceramic from each site is different in composition and structure.

39
Table 10 Bulk chemical composition data using SEM-EDS for ceramics from Luwu sites, normalized to 100% with original analytical totals given. All values are the average of five analyses of each sample and calculated in compound % by stoichiometry (bd= below detection limit).
Composition (%)
Na2O MgO Al2O3 SiO2 SO3 K2O CaO TiO2 Cr2O3 MnO FeO NiO Total
MTN 866-L bd 7.1 6.8 13.6 0.3 bd 0.7 bd 5.1 0.4 65.5 0.5 95.7
MTN 866-R 2.3 bd 22.7 70.5 bd 3.2 0.5 bd bd bd 0.9 bd 95.1
NUH 4597A bd 10.0 16.5 49.0 bd 1.0 1.4 0.7 6.5 bd 14.9 bd 85.0
RHP 4220-L bd 0.3 5.4 88.4 bd 0.2 0.9 0.2 bd 0.5 4.3 bd 76.8
RHP 4220-R bd 0.4 5.5 86.9 bd 0.3 1.5 0.4 bd 0.4 4.5 bd 74.8
MTN 886-R, Qing sherd, is a translucent white colour ceramic sherd (Figure 30). The selection
of this ceramic sherd was taken from the surface on the Matano Lake shore. This sherd was chosen
on the basis of the apparent metallurgical residue (slag) on the surface of the sherd. The ceramic is
composed of high silicate matrix at about 60 per cent of silica and 22 per cent of alumina. Inclusions
in the ceramic were molten because of vitrification, so that the vitreous matrix includes only small
size residual quartz. There are numerous small spherical vesicles in this sample and these are
bloating pores resulting from the release of gases during the vitrification procedure at high
temperature (Quinn, 2013). On the surface of the ceramic, a lump of equant and round minerals is
attached, but the lump did not penetrated into the ceramic and there is a clear interface between the
lump and the vitrified ceramic. Part of the lump (MTN 866-L), which has been detached from the
ceramic sherd MTN 866-R, showed that the lump contains iron-rich minerals, probably weathered
or eroded by the action of the water. The minerals in this lump are surrounded by ferruginous ooids
(c. 90% of iron oxide). Ferruginous ooids (Figure 31) have an onion-like globular texture, which is
very typical of weathered structures, resulting from the lateritic weathering (Nahon et al, 1980).
Therefore, the iron hydroxide rich ooid matrix is probably laterite soil from Lake Matano (Crowe,
2008; Crowe et al, 2008). The eroded iron-rich minerals, ferruginous ooids, and clear interface
between the residue and the vitreous ceramic, indicate there was no hot contact between them. Tiny
wüstite that is present in the lump (Figure 32) was perhaps moved with the other minerals during
the weathering process. The ceramic was then deposited over the eroded mineral lumps.

40
Figure 30 Microphotographs of MTN 866-R under a) PPL and b) XP showing the vitrified ceramic with a lump of round minerals on the ceramic’s surface. The ceramic is translucent white in colour. The small spherical vesicles in this sample are bloating pores resulting from the release of gases during the vitrification at high temperature. Note, the samples were observed in the form of polished blocks, not thin sections.
Figure 31 Microphotographs of MTN 866-L under a) PPL and b) XP showing minerals and iron hydroxide rich ooid matrix.
Figure 32 Backscattered images of MTN 866-R showing a) vitrified ceramic with bloating porosities affected by releasing of gases during virification and b) lump of round minerals and wüstite (white) surrounded by ferruginous ooids is attached on the surface of the Qing sherd. There is clear interface between the lump and the sherd.

41
The fabric of pot sherd NUH 4597A could be described as a relatively homogeneous fabric,
showing abundant iron minerals and chromite grains of various sizes, surrounded by expansion
voids and elongated cracks. Equant to elongate, and angular to rounded medium sand sized
inclusions (0.25-0.5mm) are present in a non-calcareous clay matrix. The inclusions are well sorted
and mainly composed of ferruginous minerals (c. 80 wt% of FeO) and chromite (up to 58% Cr2O3)
(Table 11). The angularity and selective inclusion size are both crucial criteria to decide whether the
inclusion was added naturally or manually (Rye, 1981; Rice, 1987; Woodward, 2002). Bimodal grain
size distribution, which is present in both fine and coarse inclusions was observed, corresponding to
the intentional addition of temper (Gibson and Woods, 1997; Maritan et al, 2009). The chemical
features of the inclusions has led to higher concentrations in MgO (10 wt%), Cr2O3 (6.5 wt%), and
FeO (14.9 wt%), which were discovered when the sample was analysed in bulk chemical composition.
The sample contained expansion voids and elongated cracks parallel to the surface of the sherd
(Figure 33). The alignment of the voids is likely to have resulted from the application of pressure
during the drying, firing, or forming process, which was probably wheel-throwing (Rye, 1981; Rice,
1987; Quinn, 2013). The ceramic was fired in a reducing atmosphere with insufficient penetration of
oxygen during the firing process, shown in Figure 34. The sample has oxidised narrow margins
(reddish colour) and dark cores (grey colour), suggesting that it was incompletely oxidised due to a
short firing duration, or was reduced and rapidly cooled by air. The bottom of the ceramic has
porosities derived from heat treatment after the ceramic was formed (Figure 35).
Figure 33 Microphotographs of NUH 4597A showing abundant iron mineral and chromite grains of various sizes surrounded by expansion voids, and elongated cracks parallel to the surface of the sherd. The thin elongate voids appear black in PPL. Note, the samples were observed in the form of polished blocks, not thin sections.

42
Figure 34 Microphotographs of NUH 4597A a) PPL and b) XP showing firing condition which was under reducing atmosphere due to the narrow oxidised margins on the left and there are porosities on the right surface which suggest heat treatment after the ceramic was formed. Note, the samples were observed in the form of polished blocks, not thin sections. Microphotographs were taken in 50 magnifications and merged all together.
Figure 35 a) Backsacattered image of NUH 4597A showing a position that was less affected by heat treatment. There are equant round to angular inclusions and elongate voids parallel to the surface of the sherd. b) Backscattered image of NUH 4597A showing porosities in the bottom of ceramic where affected heat after the ceramic was formed.

43
Table 11 SEM-EDS spot analyses for some phases shown in Figure 35a. The chemical composition data, normalized to 100% with the original analytical totals given. All values were calculated in compound % by stoichiometry (bd= below detection limit).
Composition (wt%)
MgO Al2O3 SiO2 K2O CaO TiO2 V2O5 Cr2O3 MnO FeO NiO Total
Iron mineral 1.4 8.7 3.7 bd 0.3 bd bd 5.5 bd 80.4 bd 101.2
Chromite 8.1 11.3 bd bd bd bd 0.4 58.9 0.5 20.8 bd 100.8
Chromite 17.6 46.9 bd bd bd bd bd 21.7 bd 13.3 0.4 98.1
Chromite 8.9 19.7 bd bd bd bd 0.4 49.3 bd 21.6 bd 97.5
Chromite 14.4 46.2 0.4 bd bd 0.3 bd 22.7 bd 16.0 bd 84.4
Chromite 9.6 12.2 bd bd bd bd 0.5 57.2 0.6 19.9 bd 88.0
Chromite 18.6 50.3 bd bd bd bd bd 17.5 Bd 13.2 0.4 84.6
Ca-Feldspar 17.5 5.5 50.2 bd 21.9 bd bd 1.3 bd 3.6 bd 87.9
Ca-Feldspar 17.9 5.4 50.1 bd 21.7 bd bd 1.3 bd 3.6 bd 95.5
Clay 5.9 12.9 67.5 1.3 1.4 0.6 bd bd bd 10.4 bd 66.4
Clay 4.6 11.7 71.4 1.1 0.9 0.6 bd bd bd 9.7 bd 61.7
The last ceramic sample, tuyère RHP 4220-L, consists of reddish brown clay matrix, voids,
and mineral inclusions that are dominated by quartz and iron rich mineral (Figure 36 and Table 12).
The fabric contains poorly sorted inclusions, which appear to be elongated sub-angular to elongate
very angular in shape, and the inclusions are surrounded by voids and elongated cracks. It seems
likely from this tuyère that short melting times were used as quartz particles remain and they did not
react extensively with the matrix (Freestone, 1989). A high silica concentration of clay matrix and
quartz inclusions has resulted in a bulk chemical composition of 88 per cent of silica. Pure silica is a
refractory material that can stay in a stable state over the temperature used. The heavy additions of
silica to the low refractory clay would have increased its temperature resistance and minimised the
shrinkage of the tuyère (Freestone, 1989). About four per cent of the iron oxide was derived from the
iron mineral inclusion. Quartz in the ceramic fabric increased the volume of quartz when it was
heated over 573℃ during the firing process and quartz shrinks back when the ceramic cools down
after the firing process has finished. The heating and cooling process leaves the elongated voids along
the fabric and the round voids around the quartz (Freestone, 1989; Bayley et al, 1991). It contains
low compositions in MgO, K2O, CaO, and FeO which degrade the refractory properties of the ceramic
(Bayley et al, 1991).

44
Figure 36 Microphotographs of tuyère RHP 4220-L under a) PPL and b) XP representing mineral inclusions and silica rich clay. Note, the samples were observed in the form of polished blocks, not thin sections.
Table 12 SEM-EDS spot analyses for some phases in RHP 4220-L showing that quartz and iron minerals were tempered. The chemical composition data, normalized to 100% with original analytical totals given. All values were calculated in compound % by stoichiometry (bd= below detection limit).
Composition (wt%)
MgO Al2O3 SiO2 P2O5 K2O CaO TiO2 MnO FeO NiO Total
1 Matrix 0.4 7.2 85.3 0.4 0.2 0.6 0.5 0.7 4.6 bd 179.6 2 Matrix 0.7 8.4 82.9 0.3 0.3 1.0 0.8 0.5 5.1 bd 127.2 3 Quartz bd bd 98.2 bd bd 0.6 bd bd 1.2 bd 118.3 4 Quartz bd bd 100 bd bd bd bd bd bd bd 146.5 5 Iron mineral bd 0.5 2.7 bd bd bd bd bd 93.3 3.5 106.3 6 Iron mineral bd bd 3.1 bd bd bd bd bd 91.9 5.0 105.4
By contrast, RHP 4220-R had been attached to the tuyère RHP 4220-L, showing numerous
porosities, cracked and scattered quartz embedded in the glassy matrix (Figure 37a). Furthermore,
wüstites and tiny chromite spinels (c. Cr2O3 40 wt%) are present in some parts of the sample (Figure
37b). The presence of chromite spinels in this sample could strengthen the links of chromium oxide
content between the technical ceramic, the iron ore, and the slags. The compositional data between
RHP 4220-L and R is pretty similar, the tuyère are hence likely to be a technical ceramic, which must
have played its role within the furnace, and it was influenced by a relatively high temperature
operated during the smelting process.

45
Figure 37 Backscattered images of RHP 4220-R showing a) wüstites, recrystallized SiO2, porosities with glassy matrix and b) chromite spinels embedded in glassy matrix.
It could be assumed that craftsmen collected the most of the locally available raw materials
and prepared the clay matrix carefully, then added a non-plastic tempering material (Freestone,
1989). Craftsmen in Rahampu’u produced refractory, tuyère RHP 4240-L, by adding a substantial
amount of quartz and reducing the components of fluxes (MgO, K2O, CaO, and FeO) in order to
improve resistance to high temperature, while NUH 4597A was produced by adding the dominant
chromite, feldspar and iron mineral which are locally collectable raw materials as temper.

46
3.3 Slag
Fifteen slag samples from eight sites were identified under the Optical Microscope (OM), although
the macroscopic morphology of slag, which allows for easier differentiation among, for instance,
furnace slag, tap slag, or smithing slag, could not be reported owing to a lack of information such as
the original shape of the lumps from which the samples were removed. Two slag samples, LMG 812A
and RHP 158A, had not been properly labelled and were mixed up. They, therefore, could not be
attributed to a specific site. The attempt to classify them by comparing the resulting data to those of
samples with safe attributions was not possible as there were not any notable differences, but the
analytical results of the slags are given in Appendix 2-3. MTN 820, one of surface collections from
Matano, was initially labelled copper/iron slag, RHP 526 was labelled as a limestone gravel with
copper oxide coating, and PNT 1745B as iron reduction product, but chemical and microscopic
analyses of the samples revealed the two samples were more consistent with slag. All three of these
samples will be discussed separately from other slag samples at the end of this semi-chapter. The
“bulk” chemical compositions of slag samples were obtained with area analyses SEM-EDS, avoiding
iron prills and residual grains. The results are presented below in Table 13 and fully reported in
Appendix 2-3.
All slag samples excepting MTN 820, RHP 526, and PNT 1745B, had a rather similar
composition, although there was some variability. FeO levels ranged between 48 and 77 wt%, levels
of SiO2 between 14 and 25 wt%, and Al2O3 between three and 13 wt%. Silica and iron oxide
concentrations in most Luwu slag samples were within the range of those in typical bloomery
smelting slags, reported as 40-70 wt% FeO and 15-40 wt% SiO2 (Pleiner, 2000:252). Slag with more
than 50 wt% FeO is considered rich in iron. Luwu smelting slags, therefore, had a significant higher
proportion of FeO with a mean value of 62 wt%. Slag LMG 707A-3 is the only one exception, having
just below 50 per cent of iron oxide, whereas LMG 713A-R, KTE 2816A, and PSN 4240-2 exceed the
typical range of FeO 70 wt%, with readings of 73.0, 77.4, and 73.4 wt% respectively. The high iron
oxide in slag indicated that further free iron oxides from the ore could have been reduced to metal
and have been separated from the slag, but only relatively small amounts of the iron oxides were
reduced to iron metal and separated successfully. Therefore, the high FeO content is due to a
significant number of free FeO in slag.

47
Table 13 The “bulk” chemical composition data by SEM_EDS for slag samples from Luwu sites, normalized to 100% with original analytical totals given. All values are the average of five analyses of each sample and calculated in compound % by stoichiometry. Q1 and Q2 slags were mixed up and not able to distinguish between RHP 158A and LMG 812A. Grey shading lows are fuel ash slags (bd= below detection limit).
Composition (%)
Na2O MgO Al2O3 SiO2 P2O5 SO3 K2O CaO TiO2 Cr2O3 MnO FeO Total
MTN 820 0.3 1.4 5.6 77.4 bd bd 1.1 8.4 0.4 0.2 0.6 4.7 84.4
NUH 4628 bd 3.9 6.2 17.1 0.1 bd 0.6 3.1 bd 1.7 4.7 62.6 73.8
PDB 888A 0.3 1.1 9.3 14.1 0.2 0.4 1.0 5.1 0.2 0.7 0.8 66.6 113.6
RHP 512A 0.6 1.0 6.4 23.4 bd 0.1 1.2 2.1 bd 0.6 0.4 64.4 117.1
RHP 526 bd 1.8 2.5 77.3 bd bd 2.7 9.3 0.4 bd 0.4 3.0 125.4
Q1 0.4 2.5 7.9 25.2 0.3 bd 2.0 4.3 0.2 1.0 0.8 55.5 81.0
Q2 0.4 1.6 8.0 14.8 0.1 0.5 0.8 2.3 0.2 1.3 1.9 68.3 92.3
LMG 707A-1 0.4 2.7 12.5 23.9 bd bd 0.6 6.7 0.5 1.5 1.0 50.2 88.7
LMG 707A-2 0.4 2.2 6.3 17.6 0.1 bd 0.6 4.3 bd 2.0 1.5 64.9 110.9
LMG 707A-3 0.4 3.2 13.2 23.8 0.2 bd 0.5 6.6 0.5 2.5 0.9 48.0 100.5
LMG 713A-L 0.5 2.6 8.2 17.6 0.2 bd 0.9 4.1 0.2 1.1 5.3 59.4 111.0
LMG 713A-R 0.5 1.1 6.3 14.3 0.1 0.3 0.6 1.7 0.1 0.5 1.5 73.0 112.2
KTE 2816A bd 1.1 3.2 16.5 0.4 bd bd 1.5 bd bd bd 77.4 84.7
PNT 1745B 0.3 1.9 7.2 64.2 2.6 bd 9.7 7.2 0.4 bd bd 6.5 70.8
PSN 4240-2 0.7 0.5 6.5 16.9 bd bd 0.7 0.8 bd bd 0.5 73.4 104.6
In terms of silica, the concentrations span from 14 to 25 wt%, which is almost within the
typical silica range of bloomery smelting slag (15-40 wt% SiO2). More than 34 wt% silica is
considered a high concentration (Pleiner, 2000: 252), so all slag from Luwu lie in the optimal silica
contents. The amount of alumina in the slags was unexpectedly high in all of the samples, far over the
6 per cent of alumina, excepting KTE 2816A, which has only 3.2 wt% Al2O3. Theoretically, alumina is
derived from ore, gangue, or furnace lining and it appears usually in amounts from one to six wt%
and with more than six wt% being considered high (Pleiner, 2000: 252). The average ratios of
alumina to silica of the Luwu slags was 1:2.4. The high Al2O3/SiO2 ratio (Figure 38) is significantly
dissimilar to the typical ratios 1:4 of smelting slags from Europe (Pleiner, 2000: 252).
The slags show variation in the CaO concentration, ranging from 1.7 to 6.7 per cent, whereas
the proportion of sodium oxide and potassium oxides was approximately under 1 per cent. CaO in
slag may derive from the ore, the furnace wall and the fuel ash. Na2O and K2O derived from the fuel
ash and the fuel ash has important influence on the melting point of slags. (Pleiner, 2000: 252). The
concentrations of magnesium oxide (usually in the range c. 0.5 - 3.0 %), manganese oxide (below 1%)
and titanium dioxide levels were within the typical range of bloomery smelting slag, while some slag

48
samples are significantly higher in magnesia (LMG 707A-3 and NUH 4628) and manganese oxide
contents (LMG 713A-L and NUH 4628).
Figure 38 Ratios of alumina to silica of Luwu slags showing higher ratios than the Al2O3/SiO2 ratios of typical European iron smelting slags (1:4).
The most distinctive characteristic of the slags composition was chromium oxide (Cr2O3),
between 0.5 and 2.5 wt%. This is unusually high when compared to most bloomery slags recovered
archaeologically. KTE 2816A and PSN 4240-2 are exceptions, which do not show Cr2O3 above the
detection limits. As discussed below, the chemical composition of chromium oxide was reflected in
the microstructures, revealing the dominance of chromite spinels (FeCr2O4). Chromium oxide may
be indicative of a particular type of iron ore charged for iron smelting.
Notwithstanding these overall similarities, there were small differences between some of the
compound levels. The slag samples from Katue and Passauen had a higher average FeO content of 75
wt%. Magnesium, aluminium oxides and lime levels appeared to be slightly higher in slags from
smelting sites near Lake Matano: Pandai Besi (PDB), Rahampu’u 1 (RHP), Lemogola (LMG), and Nuha
(NUH) than slags from Katue (KTE), and Passauen (PSN). Chromium oxide was found only in the slag
from the Lake Matano region (Figure 39).

49
Figure 39 Scatter plot showing the positive correlation between MgO and CaO for slags samples and slightly higher levels in slags from the smelting sites near Lake Matano including Pandai Besi, Tahampu’u1, Lemogola, and Nuha than slags from Katue and Passauen.
Most slag samples comprise metal prills and quite a lot of free FeO which was unreduced, in
the form of wüstite (Table 14). In addition to this, slags are generally dominated by olivine and
residual grains in a dark coloured glassy matrix, as can be seen in Figure 40. This microscopic
observation also indicates those iron slag that is bloomery smelting slag and not smithing or blast
furnace slag. This is because wüstite is an indicator of strongly reducing conditions and blast furnace
slag has glassy texture owing to its extremely reducing condition (Pleiner, 2000: 255).
Figure 40 Photomicrograph under PPL (a) and backscattered electron image (b) of slag PDB 888A, showing a glassy matrix (dark grey), with skeletal fayalite (mid grey), wüstite (light grey), iron droplet (white), and a residual chromite grain. The residual grain size is approximately 500 x 350 ㎛. The boundary of broken chromite was reduced.

50
Table 14 Microscopic observation of slag samples from Luwu. Q1 and Q2 slags were mixed up and not able to distinguish between RHP 158A and LMG 812A. Grey shading lows are fuel ash slags.
The Iron oxides (FeO) vary in shape, forming from dendritic to rounded structure within one
sample. LMG 707A-2 and NUH 4628 revealed dendritic wüstite on the one side and rounded wüstite
on the other side (Figure 41). Dendritic wüstites indicate the fast cooling rate of slags (Donaldson,
1976; Paynter, 2007). There is a lot of wüstite crystallising because there is quite a high FeO
concentration of bulk chemical compositions, in the contrast, the slightly lower FeO content of bulk
analyses in LMG 707A-1 and 3 result in a smaller quantity of tiny flakes of wüstite that are embedded
in the slags (Figure 42).
Metal prill Wüstite Olivine Glassy matrix Spinel
MTN 820 Fe, Ni No No Yes Chromite
NUH 4628 No
Extreme dendritic Rounded dendritic
Calcium rich fayalite
No Hercynite (Zoning/
Skeletal shape)
PDB 888A Fe, Ni Rounded dendritic
Calcium rich fayalite
Yes Chromite Hercynite
RHP 512A No Rounded Calcium rich
fayalite Yes Hercynite
RHP 526 No No No Yes No
Q1 Fe, Cr, Ni Round Calcium rich
fayalite Yes No
Q2 Fe, Cr, Ni Round No Yes Chromite (Zoning)
LMG 707A-1 Fe, Ni Few Calcium rich
fayalite Yes
Chromite (Zoning)
LMG 707A-2 Fe, Ni
Extreme dendritic Rounded dendritic
No Yes Chromite (Zoning)
LMG 707A-3 Fe, Ni Few Calcium rich
fayalite Yes
Chromite (Zoning)
LMG 713A-L Cr, Fe, Ni Reoxidised prill
Dendritic Calcium rich
fayalite Yes Chromite
LMG 713A-R Fe, Ni Dendritic Rounded
Calcium rich fayalite
Yes Hercynite
KTE 2816A Fe, Ni, Cu, As Dendritic Calcium rich
fayalite Yes Magnetite
PNT 1745B No No No Yes No
PSN 4240-2 Fe Round dendritic Fayalite Yes No

51
Figure 41 Backscattered images of slag LMG 707A-2 showing a) dendritic wüstite one side and b) rounded wüstite on the other side in glassy matrix.
Figure 42 a) Backscattered images of slag LMG 707A-1 showing fayalite (bright grey) with tiny flakes of wüstite (white) in glassy matrix. Iron prill and trapped gas bubble are present. b) Backscattered image of LMG 707A-3 showing fayalite (bright grey), tiny flakes of wüstite (white) and chromite spinels. Spinel has zoning.
As a result of spot analyses of the olivine by SEM-EDS, they can be identified as fayalite
(Fe2SiO4) or kirschsteinite (CaFeSiO4), or a solid solution between both, combining with some
substitution of manganese (MgO), manganese (MnO), and alumina (Al2O3) for iron. As an example,
the EDS spot analyses for chromite, hercynite, wüstite, fayalite, and glassy matrix in PDB 888A and
prills in LMG 713A-R are presented in Table 15. The rest spot analyses for slags are presented in the
Appendix 2-3. Fayalite is an elongated and skeletal structure in all the samples, excepting LMG 707A-
2 which does not show fayalite. The elongate and skeletal structures of fayalite lath suggests rapid
cooling time (Paynter, 2007).

52
Table 15 Chemical composition data by EDS spot analyses for chromite, hercynite, wüstite, fayalite, glassy matrix in slag samples PDB 888A and prills in slag samples LMG 713A-R, normalized to 100% with original analytical totals given. All values are calculated in compound % by stoichiometry, excepting iron-nickel prill (bd= below detection limit).
Composition (wt%)
Na2O MgO Al2O3 SiO2 P2O5 SO3 K2O CaO TiO2 Cr2O3 MnO FeO Total
Chromite bd 13.0 22.7 bd bd bd bd bd bd 44.2 0.4 19.7 113.6 Chromite bd 2.6 21.0 bd bd bd bd bd bd 35.7 0.7 40.0 111.6 Hercynite bd 2.9 51.0 bd bd bd bd bd bd 2.1 1.0 42.6 108.3 Hercynite bd 2.6 51.0 bd bd bd bd bd bd 2.2 0.8 43.3 107.5 Wüstite bd bd 1.0 bd bd bd bd bd 0.3 0.5 0.5 97.7 113.8 Fayalite bd 2.1 1.3 31.3 bd bd 0.9 16.3 bd bd 1.1 47.0 110.6
Glassy matrix 1.2 bd 15.5 33.4 0.4 1.9 5.8 11.9 bd bd 0.3 29.6 108.5
O Fe Ni Total
Prill 2.1 97.6 0.3 114.6 Prill bd 94.5 5.5 100.1
Residual ore grain (about 500 x 350 ㎛) shown in PDB 888A which did not react has kept the
original grain shape due to viscosity of slag (Figure 40). Residual grains in slags were identified by
spot analyses as hercynite and chromite, which are types of the spinel group being composed of
FeAl2O4 and FeCr2O4 with approximately 50 wt% and 22 wt% of Al2O3 (Table 15). The alumina
contents in the residual grains corresponded with high Al2O3/SiO2 ratio of slags. Hercynite derived
from aluminium rich ores and chromite was from chromium rich ore. Most of them were cubic crystal
shaped spinels observed in the high magnification of SEM, although sometimes they formed skeletal
crystals (Figure 43b). As seen in the bulk analyses described above, the most unique feature of these
slag samples was their chromium oxide content (Cr2O3), which is an unusual chemical composition
from slag. Each slag is composed of small number of chromite spinels with 23–50 wt% of Cr2O3, so
the levels of chromium oxide in the bulk analyses, which were under three per cent, is relavant.
Chromium oxides were also detected from wüstite, but chromium oxide content is mainly related to
the spinel. The spinel was discovered to occur in two kinds of zones in the spinel grains, as a dark
grey coloured central zone and a light grey outer zone surrounding them. Several examples of zoning
(Figure 42b and 43b) within spinel crystals were observed in Slag LMG 707A-1,-2,-3 and NUH 4628.
The inner zone of chromite spinel has higher Al2O3 and Cr2O3 than the outer area and revealed a lower
SiO2 and FeO concentration (Table 16).

53
Figure 43 a) Backscattered image of PDB 888A showing cubic shaped hercynite (mid grey) and chromite spinels (light grey). Also shown are globular wüstite (white). Dark grey is glassy matrix. b) Backscattered image of NUH 2638 showing skeletal spinels (mid grey) and tiny wüstite flakes (white) embedded in straight fayalite (grey).
Table 16 Chemical composition data by EDS spot analyses for zoning within chromite in slag NUH 4628, normalized to 100% with original analytical totals given. All values are calculated in compound % by stoichiometry (bd= below detection limit).
Composition (wt%)
MgO Al2O3 SiO2 CaO TiO2 Cr2O3 MnO FeO Total
Chromite in 4.3 13.5 0.4 bd bd 31.1 2.6 48.0 95.7 Chromite out 2.3 7.4 1.1 0.3 0.4 0.4 2.6 85.5 92,.7
Most slags showed globular iron prills, excepting for NUH 4628 and RHP 512A. Prills attached with
porosity in LMG 707A-1 showed that the gas bubble was expanded to fluid out but there was not
enough time to release the gas due to the fast cooling and/or high viscosity (Figure 42a Figure 45a).
The chemical composition of the iron droplets were generally pure iron or iron alloy with the nickel,
and prills in LMG 713A, Q1, and Q2 are composed of additional metallic chromium (0.4 wt% Cr). A
prill in KTE 2816A contained copper and arsenic as well as iron and nickel (Figure 44). In the case of
LMG 713A-L, iron oxide rims the prill’s surface (Figure 45b). The prills suggest that the smelting
condition in the furnace stopped reducing. This led to the prills being reduced to metallic drops and
then being reoxidised from the rim. Prills in PSN 4240-2 consisted of iron only. Pieces of charcoal
were identified in the slag PDB 888A. Charcoal applied during the smelting process for fuel did not
react and were embedded as small pieces in slag PDB 888A (Figure 46). Unconsolidated slag areas
were characterised as heterogeneous and coarse microstructures with the presence of more charcoal
fragments, surrounded by partially reduced ore particles and small metallic iron particles. All the
features in the poorly consolidated regions are consistent with slow cooling. By contrast, more
homogeneous regions have finer microstructures towards the slag surface, which indicate rapid

54
cooling (Donaldson, 1976; Paynter, 2007). It is indicative of variable cooling rates for the different
parts of the slag samples (Donaldson, 1976).
Figure 44 Maximum chromium, nickel, copper, and arsenic contents in prills are presented. A prill in KTE 2816 contain Ni 43.2 wt%, Cu 1.5 wt%, and 3.8 wt%. Prills in Q1, Q2, and LMG 713A-L include chromium at about 0.4 wt%. Prills in PSN 4240-2 consist of iron only. Other slags contain no prill.
Figure 45 a) Backscattered image of LMG 707A-1 showing iron prill (white) with a trapped gas bubble due to fast cooling and/or high viscosity. b) Backscattered image of LMG 713A-L presenting globular iron-nickel alloy droplets (white). Prills are covered with iron oxide on the surface.

55
Figure 46 Secondary electron images of slag PDB 888A showing charcoal remains which probably used as fuel.
Sample PSN 4240-2 was initially labelled as an iron ore, but during the re-polishing
procedure a shiny metallic material was revealed. This sample could be distinguished into two
different material areas: slag and metallic iron at the bottom of the slag (Figure 47 and 48a). It might
be smelted iron with slag in the furnace or iron attached with slag during the smithing process
considering the plano-convex bottoms (PCB’s) (Crew, 1996; Pleiner, 2000:255). The slag region is
dominated by wüstite, amd fayalite and there are not many iron prills in the glassy matrix. By contrast,
there are numerous fine, irregular, slightly elongated slag inclusions embedded in the bulky metallic
iron area (Figure 48b). SEM-EDS analyses cannot measure carbon because the samples were coated
with carbon on the surface. Thus, to identify whether the metallic iron smelted contains carbon or
not, the structure of the metallic iron area was observed under an Optical Microscope and Hitachi
SEM-EDS after etching the sample in the Nital 3% etchant for about 45 seconds. The appearance
seems like an eutectic mixture of pearlite (alpha +Fe3C) that covers the whole area of the metallic
iron. This iron and carbon eutectoid occur at the point of 0.8% carbon (Scott, 1991:16-17). In the
section of edge, ferrite grain was formed at the original austenitic grain boundaries. The other grains
occurred with pearlite infill (Figure 49). Thus, the metallic iron consists of carbon and it is estimated
that the carbon content, in the absence of nickel, is about 0.8% C (see Figure 50). To measure the
presence and absence of carbon in prills in other slags, etching was tried. Four per cent of Nital was
used at 15 seconds intervals accumulating for five minutes, but it did not prove successful.

56
Figure 47 Photograph of PSN 4240-2 after re-polishing up to 1 micron showing metallic iron and slag on the top.
Figure 48 a) Microphotograph of PSN 4240-2 before etching illustrating slag and metallic iron attached together in PPL b) Microphotograph of PSN 4240-2 before etching illustrating slag inclusions embedded in the metallic iron under PPL.
Figure 49 Microphotograph of PSN 4240-2 after etching in Nital 3% etchant showing blocky ferritic grains and pearlite and pearlite structure was infilled densely. a) under PPL x200 b) under XP x200.
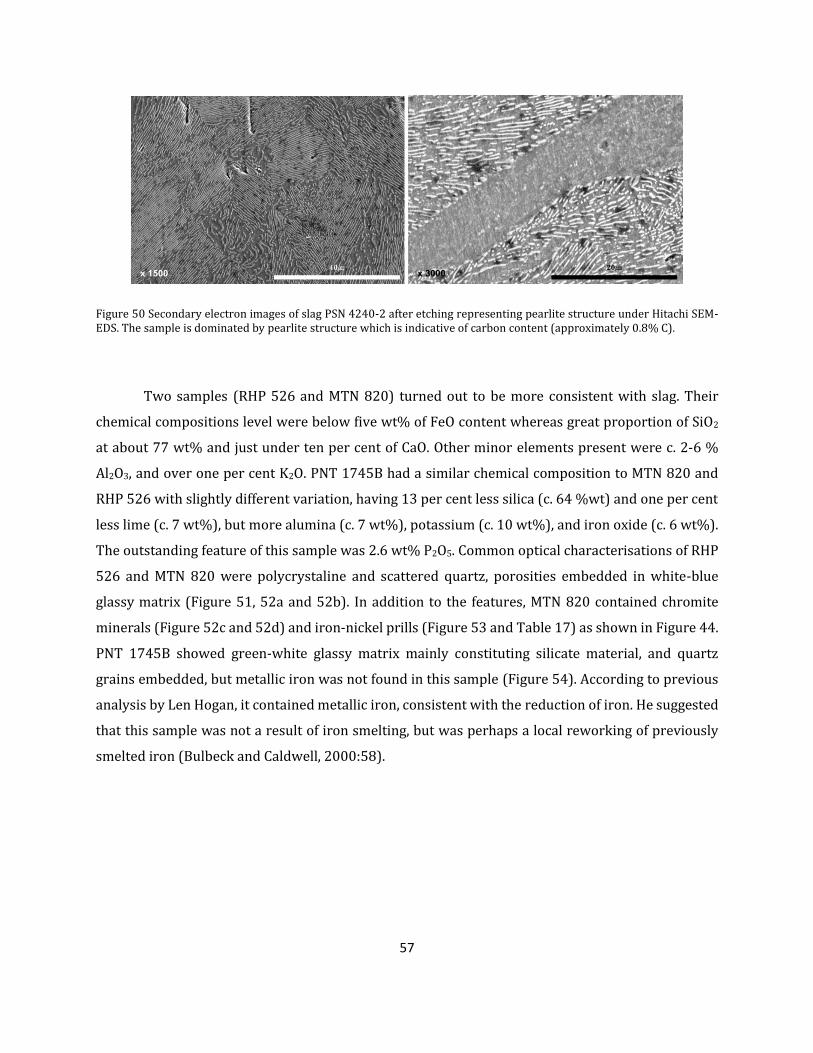
57
Figure 50 Secondary electron images of slag PSN 4240-2 after etching representing pearlite structure under Hitachi SEM-EDS. The sample is dominated by pearlite structure which is indicative of carbon content (approximately 0.8% C).
Two samples (RHP 526 and MTN 820) turned out to be more consistent with slag. Their
chemical compositions level were below five wt% of FeO content whereas great proportion of SiO2
at about 77 wt% and just under ten per cent of CaO. Other minor elements present were c. 2-6 %
Al2O3, and over one per cent K2O. PNT 1745B had a similar chemical composition to MTN 820 and
RHP 526 with slightly different variation, having 13 per cent less silica (c. 64 %wt) and one per cent
less lime (c. 7 wt%), but more alumina (c. 7 wt%), potassium (c. 10 wt%), and iron oxide (c. 6 wt%).
The outstanding feature of this sample was 2.6 wt% P2O5. Common optical characterisations of RHP
526 and MTN 820 were polycrystaline and scattered quartz, porosities embedded in white-blue
glassy matrix (Figure 51, 52a and 52b). In addition to the features, MTN 820 contained chromite
minerals (Figure 52c and 52d) and iron-nickel prills (Figure 53 and Table 17) as shown in Figure 44.
PNT 1745B showed green-white glassy matrix mainly constituting silicate material, and quartz
grains embedded, but metallic iron was not found in this sample (Figure 54). According to previous
analysis by Len Hogan, it contained metallic iron, consistent with the reduction of iron. He suggested
that this sample was not a result of iron smelting, but was perhaps a local reworking of previously
smelted iron (Bulbeck and Caldwell, 2000:58).

58
Figure 51 Microphotographs of RHP 526 under PPL and XP showing polycrystalline quartz and porosity in blue glassy matrix.
Figure 52 Microphotographs of MTN 820 under PPL and XP showing a,b) chromite (white), scattered quartz, porosity in blue –white colour glassy matrix (upper two images) and c,d) polycrystalline quartz and scattered quartz particles (bottom two images).

59
Figure 53 Backscattered image of MTN 820 showing iron-nickel alloy prills in the glassy matrix.
Table 17 SEM-EDS analytical results for some phases shown in Figure 53 presenting iron and nickel contents with phosphrous and surphur. All data is normalized to 100% with original analytical totals given.
Figure 54 Microphotographs of PNT 1745B under a) PPL and b) XP showing quartz, amd porosity in green –white colour glassy matrix.
Not only the chemical properties such as high SiO2, CaO and low FeO but also the colour,
glassy matrix of the sample, and the iron prills might lead one to conclude that they constitute blast
furnace slag. However, the samples were too rich in SiO2 (c. 77%) and poor in CaO (c. 9%) to be blast
furnace slags. This is because blast furnace slags normally comprise of silica levels of around 50~54%
and CaO reaches levels reach 10-30% due to lime flux being added to decrease the melting
Composition (wt%)
P S Fe Ni Total
1 Prill 6.3 0.2 85.7 7.8 97.1 2 Prill 7.3 0.4 81.0 11.0 96.3

60
temperature of iron (Pleiner, 2000:255). Also, there is no evidence of the early technical introduction
of Chinese blast furnace technology to Southeast Asia (Bronson, 1992; Pigott, 1986). In accordance
with these features, the samples are likely to be a kind of by-product composed of a mixture of molten
ceramic materials, such as furnace lining or tuyère, with fuel ash during the iron smelting operation.
This material is sometimes called fuel ash slag (Biek and Bayley, 1979) or ceramic rich slag
(Veldhuijzen and Rehren, 2007).

61
3.4 Iron Artefact
Twelve iron artefact samples were collected but only 11 of these samples were observed under high
magnification and examined for element concentrations by SEM-EDS. This was to determine the
nature of the materials even after complete corrosion of the iron metal. The samples are iron artefact
fragment PDB 643A, an imported steel RHP 159, an iron spearhead fragment RHP 164, a prill RHP
184A, an iron tube KTE 2545, an iron blade fragment SBL 1247A, an iron fragment SBL 5015-L and
R, an iron lump PNT 1664-L and R, an iron prill PNT 1746A and an iron fragment PSN 4240-1. PSN
4240-1 originally labelled as an iron ore turned out to be more consistent with iron fragment. PNT
1746A which was labelled as an iron prill, was totally corroded to a powder state so that it could not
be analysed.
The compositional data is presented in normalised weight per cent with original analytical
totals and re-normalised without oxygen and presented iron and nickel content only in order to give
an idea of the original nickel concentration, even if the data does not give the exact chemical
compositions of the objects before they were corroded. Iron and nickel were chosen for the
renormalisation because nickel was the element detected with iron in uncorroded prills in many slag
samples due to its requirement for relatively low reducing condition. Chromium was not
renormalised as chromium oxide requires too high reducing condition to transform as a metallic
phase, although a mere trace of chromium was found in prills of slag LMG 713A-L and Q2. SEM-EDS
identified the iron artefacts and materials to be composed of iron, some of the objects had 0.65 wt%
average nickel content. Most samples were more than 99.9 % corroded, with virtually no metallic
form of iron remaining, excepting RHP 159 and PSN 4240-1.
With the exception of RHP 159, labelled as an imported steel from Rahampu’u 1, the nickel
contents were covered from metallic iron samples from Pandai Besi, Rahampu’u 1, Katue, and
Pinanto. No nickel was detected in samples from Sabbang Loang and Passauen. The first group had
average compositions of 62 wt% iron, 33.5 wt% oxygen, and 0.6 wt% nickel. One sample from each
site contained a small quantity of chromium up to 1.3 wt%. On the other hand, samples from Sabbang
Loang (SBL 5015-L,-R, and SBL 1247A), Passauen (PSN 4240-1), and RHP 159 composed of an
average of 67.7 wt% iron and 31.9 wt% oxygen, but had no nickel above the detection limit of SEM-
EDS (see Table 18 for full results). The substitute elements present in all of these samples were
magnesium, aluminium, silicon, and phosphorous. Those elements may be contamination from slag
inclusions in metal that subsequently corroded.

62
Table 18 Bulk chemical composition data analysed by SEM-EDS for iron artefacts from Luwu sites, normalized to 100% with original analytical totals given. All values are the average of five analyses of each sample and given in weight per cent to estimate how much the artefacts were corroded. Data was re-normalised without oxygen and present Fe and Ni contents to estimate the original nickel content in the artefacts roughly. Those figures are given in extra columns (bd= below detection limit).
Composition (%)
O Mg Al Si P S Cl K Ca Cr Mn Fe Ni Total Fe Ni
PDB 643A 35.4 bd 0.4 0.7 bd bd bd bd bd 0.3 bd 62.8 0.4 86.3 97.2 0.6
RHP 159 32.6 bd bd 0.6 0.1 bd bd bd bd bd bd 66.7 bd 97.2 99.0 bd
RHP 164 36.7 0.3 0.3 3.1 1.3 bd bd bd 0.1 0.1 bd 57.5 0.5 109.2 91.0 0.8
RHP 184A 23.3 0.3 bd 1.1 1.3 bd bd bd 0.2 bd bd 74.9 0.3 75.1 95.9 0.4
KTE 2545 38.3 0.2 4.6 4.7 0.5 bd bd 0.3 bd 1.3 bd 49.7 0.3 90.4 80.7 0.5
SBL 5015-L 32.9 bd bd 0.3 bd bd bd bd bd bd bd 66.8 bd 92.0 99.6 bd
SBL 5015-R 31.2 bd bd 0.2 bd bd bd bd bd bd bd 68.5 bd 93.3 99.7 bd
SBL 1247A 29.8 bd bd 0.2 0.2 0.3 bd bd bd bd bd 69.5 bd 86.0 99.0 bd
PNT 1664-L 34.7 bd 0.6 1.6 bd bd 0.1 bd bd bd bd 62.3 0.8 86.7 95.3 1.2
PNT 1664-R 32.6 bd 0.5 0.6 bd bd bd bd bd 0.7 bd 64.8 1.0 90.7 95.9 1.5
PSN 4240-1 32.8 bd bd bd bd bd bd bd bd bd 0.2 67.0 bd 92.3 99.7 bd
PDB 643 had a slightly gloss brown featureless microstructure, showing only cracks and
porosity. Dr. Len Hogan labelled sample RHP 159 as an imported steel. He noted that this sample
seems like a steel spike that would not have been locally made (Bulbeck and Caldwell, 2000:30).
Scrap iron and steel goods were imported into Makassar (South Sulawesi’s capital and main port)
from Europe from the 17th century onward (Pelras, 1996:249; Poelinggomang, 1993). There is an
ethnohistorical evidence of the use of imported steel goods. This would have been undertaken by the
Soroako forgers and tradition iron working at Tana Toraja also used railway sleepers and Land Rover
springs for an iron forging source (Zerner, 1981).
This sample contains two small metallic islands remaining (Figure 55). These metallic forms
of iron were analysed and only iron was detected by SEM-EDS. The chemical compositions of the
metallic islands were 100 per cent of iron when they were normalised to 100 wt%. In order to
discover whether the sample was iron or steel like the label was an imported steel, the metallic
islands were etched after the carbon coating on the sample’s surface was repolished. After etching in
four per cent Nital etchant for three minutes, the microstructure had been changed to a mixture of
iron ferrite grains and intergranular Fe3C as a form of small crab-type graphite (Figure 56), which
was indicative of a carbon content of three per cent (Scott, 1991: 41).

63
Figure 55 Microphotograph of RHP 159 imported steel showing two metallic islands in corrosion area (photos merged, PPL).
Figure 56 a) Backscattered image of metallic islands in RHP 159 (imported steel) before etching. b) Microphotograph of a metallic island in RHP 159 under PPL after etching in 4% Nital for three minutes. The microstructure shows crab-type graphite.
While there was an absence of nickel in the imported steel, the iron spearhead fragment RHP
164 excavated from the next layer in the same unit (Figure 57, right) had a nickel concentration of
about 0.7 wt% even though the sample had only a corrosion layer left. 0.1 wt% of chromium was
found as well. Therefore, smelters at Rahampu’u 1 probably produced iron-nickel alloy for iron
implement.

64
Figure 57 Photograph of SBL 5089B (Iron ore) left, SBL 1247 (Iron blade fragment) centre, and RHP 164 (Iron spearhead fragment) right (Bulbeck, 2012:7, Plate 6).
RHP 184A is labelled as a prill and it contained 75 wt% iron, 23 wt% oxygen, and 0.4 per
cent of nickel. No chromium oxide was detected from this sample. A prominent spherical gas bubble
appeared and the sample comprised of tiny prills between the iron oxide grains (Figure 58). The prills
were identified by EDS results as iron nickel alloy but had a high concentration of nickel with around
37 % (Table 19). Considering the porosity, this is indicative of exposure to high temperature.
Figure 58 a) Microphotograph under PPL and b) Backscattered image of RHP 184A showing tiny iron nickel prills (shiny white dot), corrosions (bluish grey).
Table 19 SEM-EDS analytical results for iron prills in RHP 184A presenting iron and nickel contents with trace of oxygen. All data is normalized to 100% with original analytical totals given.
Composition (wt%)
O Fe Ni Total
1 Prill 2.2 60.7 37.1 98.7 2 Prill 2.8 59.4 37.8 91.1

65
Iron tube KTE 2545 is also totally corroded (Figure 59). Spot analyses identified tiny quartz,
and aluminosilicate inclusions in the sample (Figure 60 and Table 20). Some inclusions in the sample
have approximately two per cent of chromium, resulting in 1.3 wt% of chromium in bulk chemical
analysis.
Figure 59 Microphotograph of Iron tube KTE 2545 under PPL showing corrosion (photos merged, PPL).
Figure 60 Backscattered image of KTE 2545 showing angular, elongate inclusions.
Table 20 SEM-EDS analytical results for phases shown in Figure 60. All data is normalized to 100% with original analytical totals given.
Composition (%)
O Na Mg Al Si P K Cr Fe Total
1 51.4 bd bd bd 47.5 bd bd bd 1.1 97.4
2 48.1 5.7 bd 21.7 22.2 bd 0.6 bd 1.8 95.8
3 51.0 bd bd bd 47.4 bd bd bd 1.6 95.9
4 43.1 bd 1.1 12.8 16.1 0.2 3.3 0.4 23.1 91.0
5 50.5 bd bd 15.6 30.5 bd 0.3 bd 3.0 94.4
6 42.4 bd 0.4 13.1 12.4 0.3 1.9 0.8 28.7 92.5
7 38.7 bd bd 5.2 1.6 0.6 bd 1.9 52.1 91.6
8 38.0 bd bd 4.2 1.8 0.5 bd 2.0 53.5 89.7
9 38.6 bd bd 4.3 2.4 0.3 bd 2.1 52.3 91.0

66
SBL 5015-L, -R, and SBL 1247A (Figure 57, centre) are composed of iron, ranging between 66
and 69 wt% and no nickel above detection limits. The sample PNT 1664-L and R show laminates and
the lamination of PNT 1664-R showing high and low nickel layers (Figure 61 and Table 21). The
nickel content in the brighter areas was four times as much as that in darker areas as around two per
cent of nickel was found in the brighter area. This lamination of high and low nickel content seems to
have been produced during the corrosion process unintentionally produced as the layers in pamor
were bonded with sharp interfaces (Figure 62) (Wadsworth and Lesuer, 2000a; 2000b).
Figure 61 Backscattered image of PNT 1664-R showing lamination of high and low nickel. The boxes and numbers are the location of analyses by EDS and the results are given in Table 21.
Table 21 Spot and area analyses by SEM-EDS for PSN 1664-R, normalized to 100% with original analytical totals given. All the data is given in weight per cent to estimate how much the artefacts were corroded. Data was renormalised without oxygen and present Fe and Ni contents to estimate the original nickel content in the artefacts roughly. Those figures are given in extra columns (bd= below detection limit).
Composition (wt%)
O Al Si S Cl Fe Ni Total Fe Ni
1 Brighter area 28.1 bd 0.2 bd bd 69.4 2.3 108.4 96.5 3.2 2 Brighter area 28.9 bd 0.2 0.2 bd 68.9 1.8 108.3 96.9 2.5 3 Brighter area 30.0 bd 0.2 bd 0.2 67.8 1.8 107.9 96.9 2.6 4 Darker area 35.9 0.3 0.9 bd bd 62.6 0.4 101.5 97.5 0.6 5 Darker area 35.6 bd 0.8 bd bd 63.2 0.4 102.7 98.1 0.6 6 Darker area 36.5 0.6 1.5 bd bd 61.0 0.4 98.8 96.1 0.6 7 Brighter area 26.9 bd 0.2 bd bd 70.9 2.0 107.1 97.0 2.7 8 Brighter area 30.8 bd 0.4 bd bd 66.8 2.0 105.9 96.5 2.9 9 Brighter area 31.1 bd 0.4 bd bd 66.5 2.0 104.3 96.5 2.9
10 Darker area 36.3 0.2 1.1 bd bd 62.0 0.4 100.5 97.3 0.6 11 Darker area 36.1 bd 0.9 bd bd 62.3 0.6 100.1 97.6 0.9 12 Darker area 36.0 bd 1.0 bd bd 62.6 0.4 99.9 97.8 0.6

67
Figure 62 Microphotographs of the cross-section of an Indonesian Kris. a) Transverse (x20) b) Longitudinal (x20) c) A detail of the Longitudinal cross section (x300) (Frankel, 1963: 18, Figure 2).
PSN 4240-1 has also two small iron islands (Figure 63) in the completely corroded iron,
including 67 wt% iron and 32 wt% oxygen. The metallic form of iron is composed of an average of
99.7 wt% iron and 0.3 wt% manganese (Table 22).
Figure 63 Backscattered image of PSN 4240-1 showing two metallic islands in the corrosion sample.

68
Table 22 Analytical results for some phases shown in Figure 63 presenting iron and manganese contents. All data is normalised to 100% with original analytical totals given.
Composition (wt%)
Mn Fe Total
Metallic island 0.2 99.8 99.87 Metallic island 0.4 99.6 100.14 Metallic island 0.4 99.6 100.20
The analytical results of the iron artefacts were intimately consistent with the type of iron
ore charged in the iron smelting sites. This was done by comparing the chemical composition of the
ore and/or slag from same site. The nickel contents in the iron artefacts from Pandai Besi, Rahampu’u
1 and Katue correlate to the type of iron ores charged in the iron smelting sites. The smelters in three
sites probably used locally available lateritic iron ore for iron smelting and produced iron-nickel alloy,
which might have been the source for manufacturing the iron-nickel alloy objects. Unfortunately, it
was difficult to come to the same conclusion in terms of the iron materials from Pinanto albeit its
nickel content because there were no slag and ore samples found from the site. Conversely, not only
the iron materials but also the gangue or slag from Sabbang Loang and Passauen, do not contain
nickel concentration above the detection limit. This concomitant feature could support the possibility
that the objects were locally produced in each site, with the metallic iron produced depending on the
type of ore charged in the smelting process.

69
The most of slag samples analysed in this study have peculiar characterisatics as chromium oxide
was found in them, in spite of there being just a small amount of the element and iron-nickel prills.
Also, the ratio alumina to silica is higher than the ratio that is typically found in bloomery smelting
slag. Obviously, there was a different system in operation in Luwu, especially the iron smelting sites
near the Lake Matano. As mentioned above, various elements can have an influence on the final
composition of slag. Ore contributes the largest proportion, but furnace lining and fuel ash also make
a significant contribution to the slag formation with technical ceramics. The analytical results of the
iron smelting remains presented above have suggested several interesting points about the possible
operating parameters, technical efficiency, types of ore sources charged, and their influence in
smelting constraints, as well as the types of iron being produced in Luwu, South Sulawesi during the
pre-Islamic period.
4.1 Possible operating parameters
In order to reduce more iron oxides per ore unit, more charcoal might have been needed for a higher
reduction condition and high temperature. The iron ore quality can have considerable effects on the
smelting efficiency. Two iron ores from the ethnohistorical iron quarry Lembo-Lembo contain 61.5
and 3.4 wt% FeO, showing a wide variation of iron oxide. Archaeological iron ores excavated sites
from Lake Matano are high in FeO, above 80 wt%. This amount of iron oxide is unlikely to be common
in Southeast Asian Laterites (Aleva, 1994) as laterites are too low in iron grade at about 15 wt% to
30 wt% (Gordon and Killick, 1993; Miller and Van Der Merwe, 1994; Pryce and Natapintu, 2009).
However, laterites could contain a high enough percentage of iron for smelting (Pendleton, 1941).
Archaeological laterite samples from Thailand showed iron oxide range between 35 and 65 wt%
(Pryce and Natapintu, 2009) and a lateritic iron ore containing at least 80 wt% FeO was smelted in
Ethiopia (Severin et al, 2011). Also, geological researches presented that some laterites from Soroako
at Lake Matano contained over 50 wt% iron oxide (Golightly and Arancibia, 1979; Purwanto et al,
2002). Also, literatures on the subject has repeatedly mentioned that high grade iron ores and iron
metal from Lake Matano were the main productions of export (Bronson, 1992; Bulbeck and Prasetyo,
CHAPTER FOUR: DISCUSSION

70
2000; Macknight, 1993:40; Speelman, 1670 cited in; Bulbeck and Caldwell, 2000). Therefore, it could
be suggested that the high grade iron laterite might already have been used up and turned to metal,
leaving the current laterite ore with low amounts of iron. The other possibility is that the smelters at
Lake Matano might have treated low iron grade to upgrade the iron proportion prior to the smelting
operation, and then exported and smelted the high quality iron laterite. Iron ore from Lembo-Lembo,
which is the ethnohistorical iron ore source for iron production at Nuha, contained chromium and
nickel oxide as well as iron oxide. A Nuha slag also contained chromium oxide in chemical
composition, but nickel oxide content could not be identified as the slag contained no iron prill. Iron
smelters at Nuha could have obtained the iron resource from Lembo-Lembo, but Lembo-Lembo
might have been one of the possible iron ore quarries.
Despite the possibility of a high iron ore charged, the ores yielded low iron metal. The average
FeO content of the Luwu’s fayalitic slag samples is 63.6 wt%, with many of the samples registering
levels over 70 wt%, and only one sample having a reading of under 50 wt%. Such high iron oxide
levels in smelting slags are typically seen as an indication of a non-efficient smelting process, with
relatively large quantity of iron lost as slag material. This apparent low efficiency is reinforced by the
presence of free iron oxide in the microstructure, as discussed above. The slag samples from Katue
and Passauen have the worst efficiency, with an average FeO content of 75 wt%. The efficiency issues
concerning smelts operating parameters. One possibility is a low smelting temperature and not
enough reduction condition. The second possibility is short reducing duration. The heterogeneity of
slags, including residual chromite and hercynite grains, recrystallized and scattered quartz, and the
variability of wüstite in slags, are related to the apparently low yield iron metal, as well as the
relatively high operating temperatures derived from high Al2O3:SiO2 ratios. A reasonably high
reduction condition is suggested by the partially reduced chromite. Skeletal fayalite, spinel zoning,
and trapped gas bubbles suggest rapid cooling of the slag (Donaldson, 1976; Paynter, 2007). All the
interpretation for slags suggests the iron smelts operation parameter was carried out at a reasonably
high temperature with a high reducing condition. Therefore, it seems like that the reducing condition
during the iron production might not have maintained long enough to transform iron oxide to iron
metal. Despite the low efficiency, the quality of iron produced at Lake Matano must have been great
(Blok, 1759; cited in Bulbeck and Caldwell, 2000:98).

71
4.2 Further operating parameters
The bulk chemical compositions of the analysed iron slags were plotted in a ternary diagram to gain
a more complete understanding of how the iron smelt system would have been operated and to make
a comparison with equilibrium phase diagrams. FeO-SiO2-Al2O3 system forms the basis for the slags
produced in iron smelting process. The phase diagram could be interpreted to estimate the
temperature required to melt the slag, which gives an indication of the minimum smelting
temperature achieved during smelting operations in the smelting furnace (Bachmann, 1982;
Freestone and Tite, 1986). But the temperature in the furnace could be different, depending on the
location. For example, the temperature in the furnace centre is the highest, whereas the temperature
in areas further from centre is 100-300 degree lower (Freestone and Tite, 1986; Freestone, 1988;
1989).
Several slag studies (Ige and Rehren, 2003; Illes and Martinón-Torres, 2009) highlighted that
non-European slags cannot be easily and always interpreted with reference to the European slags,
which tend to be based around the assumption of fayalitic slag and typical FeO-SiO2-Al2O3 phase
diagrams. Similar to these non-European slags, most slags from Luwu were composed of chromium
oxide and lime as additional elements. To describe the roles of these element in the system, alumina
and chromium oxide were plotted together in the one vertex of an angle as both behave in a similar
role in terms of raising the melting point of the slag. Iron oxide and lime, which behave similarly by
decreasing the melting temperature, were plotted in the other vertex. Minor compounds were
omitted to fit this ternary diagram (e.g. alkali oxides). The compositions of iron ores and the technical
ceramic (tuyère) were also plotted in the phase diagram to estimate their behaviour such as how the
materials are refractory and require a high temperature to melt, and their relative contributions to
forming slag.
In this ternary diagram (Figure 64), Luwu’s tuyère, gangue and fuel ash slag were plotted
toward silica, suggesting the high melting temperature ranging between 1500 and 1600℃. Iron ores
were plotted toward iron oxide. Slags were plotted in the fayalitic region generally between iron ore
and technical ceramic like most smelting slags (Rehren et al, 2007). To be specific, the plots were
gathered near optimum 2, where approximately 75% FeO (+CaO), 20% SiO2, 5 wt% Al2O3 (+Cr2O3)
rather than optimum 1 which is composed of 50 wt% FeO (+CaO), 40 wt% SiO2, and 10 wt% Al2O3
(+Cr2O3). Slags in the optimum 2 has a quarter per cent of iron oxide more, whereas they have just
half of the silica and alumina concentration than those in optimum 1. Hence, it is possible to suggest

72
that it is likely that these smelt systems in Luwu would have operated in at a temperature of between
c. 1200℃ and 1400℃. That is relatively higher than most fayalitic iron slags formed in the region of
optimum 1. The melting temperature of slag could be lower than 1200℃ because the omitted element
may have acted as a flux. Luwu slag approaches closer toward optimum 2, where was a less strongly
reducing condition and more free iron oxide remains during the smelts (Charlton et al, 2013; Rehren
et al, 2007).
Figure 64 Ternary phase diagram showing liquidus temperatures for the system FeO-SiO2-Al2O3. The two areas most suitable for bloomer smelting are marked Optimum 1 and Optimum 2. They combine low-temperature melting with low-viscosity compositions (Rehren et al, 2007:212, Figure 1).
A further aspect of the slag compositions to be explained is the chromium oxide in slags and
the nickel concentration in the iron prills in slags from the sites surrounding Lake Matano. These two
features are highly likely to be associated with the use of the lateritic iron ore, which contained up to
two or three per cent of nickel and chromium. In the laterite iron ore, the amounts of chromium oxide

73
present were in a state of the chromite mineral (FeCr2O4). When the laterites were added to a smelt,
nickel was primarily a partition into the chromium-rich phase and the wüstite. Nickel changed in the
metallic phase, absorbed into iron bloom, as nickel needs lower CO/CO2 ratio than iron and much
lower than chromite (see Appendix 3), so that some iron prills in slags could have contained nickel
after the majority of nickel content went into the iron bloom (Photos, 1989; Pleiner, 2000:252;
Tylecote, 1987:52). Iron objects were produced using the bloom, which contained nickel, after slag
inclusions were expelled. Silica (SiO2) combines with the iron in the ore to form fayalite (Fe2SiO4), for
which two iron ions are required. The remaining chromite, which consists of chromium, aluminium
and iron, does not react in the furnace because chromium oxide is rather demanding to reduce as a
metal because chromium oxide requires more free energy to transform to chromium, as mentioned
above. Therefore, since nickel, iron, and chromium have separate reduction rates, initially nickel
reduction, then rapid the reduction of Fe3+ to Fe2+ in the spinel occur. Then, finally, a relatively rapid
and complete reduction of iron oxide and a rather slow reduction of chromium oxide occur (Dawson
and Edwards, 1986). Thus, chromite minerals are confined in slag, rather than absorbed in metal.
However, a small amount of Cr was detected in the prills in the three slags from Lemogola and
Rahampu’u 1 (LMG 713A, Q1 and Q2). This may indicate that the smelting conditions in the furnace
of Lemogola and Rahampu’u 1 sites could have been maintained at extremely high temperatures and
reduction condition, allowing the chromite to be extracted as metal, despite the small quantity. The
chromite minerals were also found in the pot sherd (NUH 4597A) as temper, and the mineral lump
(MTN 866-L) attached on the ceramic may explain these high levels on the background geology.
Laterite smelting production has been reported (Gordon and Killick, 1993; Miller and Van
Der Merwe, 1994; Pendleton, 1941; Pryce and Natapintu, 2009; Severin et al, 2011) but these studies
mentioned about the viability of the laterite for iron production only. Photos et al (1988) and Photos
(1989) have reported iron-nickel alloy production through the smelting laterite ore containing nickel.
Examination of iron slags and objects excavated from Petres in Greece (Photos et al, 1988) revealed
there were prills in the slags and very few objects (two of thirty objects) contained at about three per
cent of nickel. Based on the case of Petres, Photos (1989) carried out smelting experiments using iron
laterite, which consisted of 1-2% NiO, 2.5% Cr2O3, 65-70% FeO, 0.5-3% CaO, 7-14% SiO2, 10-14%
Al2O3, 1.5-2.5% MgO in an experimental bloomery shaft furnace. The experiments resulted in
chromium rich phase, wüstite, and kirschsteinite (CaFeSiO4) in produced slag samples. The
chromium-rich phases were composed of 55 wt% Cr2O3, 20 wt% FeO, and 20 wt % Al2O3+ SiO2 that
are chemically similar to the chromite spinels in Luwu slags. A wide variation in nickel content was

74
detected in iron-nickel prills ranging from 0 to 67 wt% nickel, with 0-0.5 per cent of chromium, 0.4-
1.5 per cent arsenic and 0.2-0.3 per cent copper. Therefore, the nickel concentration of iron prills in
Lake Matano slags may be explained by the nickel compositions that could be derived from the
lateritic iron ore. In addition, iron objects from Petres were analysed and nickel was not found in the
iron objects. It was suggested that local smiths were not used to the forging of nickel rich iron alloy
that was consistent with the brittleness of the alloy (Photos et al, 1988), while most iron prills in
Luwu slags and objects contained nickel. In this sense, smiths in Luwu were likely to be experienced
in forging iron nickel alloy and they were likely to be aware of the properties of iron-nickel alloy for
the production of objects.
On the other hand, other smelting slags (Katue and Passauen) are typical fayalitic slags, which
consist of Al2O3, SiO2, and FeO without Cr2O3. Nevertheless, Katue slag (KTE 2628A) contained only
one prill that consisted of an extremely high nickel proportion of 43 wt%, 1.5 wt% copper, and 3.8
wt% arsenic. The presence of copper and arsenic could come from the laterite smelting operation as
the Photos experiment (1989) showed. The laterite charged to the furnace in Katue may have
contained more copper and arsenic as trace elements than the laterite used for Lake Matano.
Passauen slag (PSN 2420-2) had iron prills without nickel. Instead of nickel, the metallic iron attached
with PSN 4240-2 contained approximately 0.8 per cent of carbon. Experiments carried out by Crew
and Charlton (2007) proved that cast iron block can be produced in a bloomery furnace, albeit under
clearly extreme hot and reducing conditions (Crew, 2004). Therefore, the smelting operating
parameter in Passauen must have had a great reduction atmosphere during the smelting operation.
4.3 Archaeological interpretation
The archaeological association foundings in the Rongkong River region, including Sabbang Loang
(the second oldest Luwu settlement, the early century AD) and the peripheral areas, support the early
iron use in Luwu dating from the early century. 15th to 18th century Pinanto site yielded remains
relevant to iron production, but not with iron smelting as no iron bloomery slag was found. Bulbeck
and Caldwell (2000:58) suggested Pinanto as a local reworking area of previously smelted iron. All
the association from the Rongkong River region over the period contain iron, but no detectable
quantities of chromium or nickel excepting iron object PNT 1664-L, and -R. As discussed above, the
iron in the Rongkong river periphery is not consistent with the nickeliferous laterite. This region is

75
geologically apart from nickeliferous laterite deposits at the Lake Matano. Bukit Porreo’ and Bukit
Pangiwangen would have mainly mined for the iron source, as suggested by Bulbeck and Caldwell
(2000) and extracted iron metal from the iron source.
By some point during the first millennium CE, the entire iron smelting was being processed
at Katue on the coast of the Gulf of Bone (Bulbeck, 2010b). The people of Katue used iron ore from
the shores of the Lake Matano. They were engaged in the export of the ore. The geographical location
of Katue played an important role in this long distance trade (Bulbeck and Caldwell, 2000:95). During
pre-Islamic period, from the 15th century to 19th century, a strike iron production industry of Luwu
was concentrated at the Lake Matano (Bulbeck and Caldwell, 2000; Bulbeck, 2010a; Bulbeck, 2010b).
Overall, the above analyses of all iron bloomery slags, iron ore, and artefacts excavated at the
Kampung Matano: Pandai Besi, Rahampu’u 1, and Lemogola have shown that very similar technical
operation taken at the sites of Lake Matano. The association contained iron, chromium, and nickel
and those elements originated from nickeliferous laterite. The lateritic iron ore containing nickel was
effectively used to produce iron-nickel alloy despite the poor yields of iron. The poor yields might be
due to the scarce of the charcoal to last long the iron smelting operation or abundant quantities of
laterite as the iron producers do not necessarily seems to have pushed higher yield per ore unit.
Over the five centuries, the Bugis at Lake Matano kept using laterite iron ore for iron
production and also temper, since the abundant nickel rich lateritic iron ore were easily available
due to the geological feature. Therefore, iron-nickel alloy could be produced in the district. The
production of iron-nickel alloy allowed Indonesian people to manufacture the distinct pattern that
was welded on to their kris weapon, piling on different nickel content irons. This was different to
most pattern welded weapon, which was produced by the lamination of two different layers, mainly
different carbon content, such as Damascus sword. The high quality iron ore and iron-nickel alloy
smelted at the Lake Matano region were exported for exotic goods based on the maritime trade
network (Blok:1759; cited in Bulbeck and Caldwell, 2000; Speelman, 1670 cited in; Bulbeck and
Caldwell, 2000; Bulbeck and Prasetyo, 2000; Bulbeck, 2010). Through this system during the pre-
Islamic period in South Sulawesi, the Bugis kingdom might have expanded into the Gulf of Bone
(Bulbeck and Caldwell, 2000:96). Also, Luwu might have been the largest, and mighty Bugis kingdom.
But after cheap imported scrap iron and steel was imported into Sulawesi from Europe, the
indigenous iron smelting operation at Lake Matano could not survive because of the competition and
had totally declined by the end of the 19th Century (Bronson, 1987).

76
This study attempts to present in a coherent iron-nickel alloy production technology during the pre-
Islamic period by analysing excavated and collected samples in Luwu, South Sulawesi. Iron slags, ore,
and artefacts at the Lake Matano region showed different feature in terms of the chromium and nickel
components. The Bugis in the area used easily available lateritic iron ore for iron extraction. The
nickel and chromium concentrations in the laterite had a significant influence on the outcome of the
iron production process. It is known that laterite at Lake Matano contained up to two per cent of
nickel and chromium concentrations (Bronson, 1987:13; 1992:85; Dalvi et al, 2004; Dorian et al,
1986; Marschall, 2010). The archaeological iron ores found surrounding Lake Matano revealed the
peculiar elements. The Bugis exploited the ore and produced iron-nickel alloy with the bloomery
smelting process.
A model of the smelting of laterite ore is proposed, with an extremely high temperature and
reducing atmosphere. Even though the efficiency of iron smelting was not effective, the quality of the
metal was likely to have been great. The iron metal with nickel has attractive features, such as the
corrosion resistance and its shiny silvery colour (O’Connor, 1975:176; Bronson, 1987:9; Marschall,
2010:8). Therefore, the high quality goods they produced were exported to other Islands and were
used to produce iron production of objects such as kris (Bronson, 1992; Bulbeck and Prasetyo, 2000;
Macknight, 1993:40; Marschall, 2010:80; Speelman, 1670 cited in; Bulbeck and Caldwell, 2000). The
exports were likely to make the Luwu wealthy and enabled them to become a mighty kingdom, before
the import of cheap scrap metal from Europe during Dutch colonial (Bronson, 1987; Pelras, 1996:249;
Poelinggomang, 1993). This investigation has focused primarily on the some iron smelting sites at
Lake Matano in Luwu. Much more can be learnt about past activities by taking a wider approach to
the smelting processes, and this study will have provided a starting point into more studies on the
iron-nickel alloy smelting operation technology using nickeliferous laterite in Indonesia.
There are several ways in which this study could be extended. In order to understand more
completely the technical choices made within these iron production episodes, it would be useful to
study the composition of the technical ceramics such as the furnace lining, and tuyère. A greater
consideration of the collection of laterites and charcoal production would also be useful in terms of
what raw materials were being used and how these materials were obtained and prepared. The
CHAPTER FIVE: CONCLUSION

77
proportion of iron, nickel and chromium in laterite would be important depending on the deposit
locations as small variation in content could lead to a significantly different outcome.

78
Aleva, G. J. J. 1994. Laterites: Concepts, Geology, Morphology, and Chemistry. Wageningen, The
Netherlands:International Soil Reference and Information Center.
Bachmann, H. G. 1982. The Identification of Slags from Archaeological Sites. London: Institute of
Archaeology.
Bayley J, Freestone I, Jenner A and Vince A G. 1991. Aspects of Saxon and Norman London: Metallurgy.
In A G Vince (ed), Aspects of Saxon and Norman London 2: Finds and Environmental Evidence
(London and Middlesex Archaeological Society Special Paper 12), 389–405.
Bayley, J. Dungworth, D. and Paynter, S. 2001. Archaeometallurgy: centre for archaeology guidelines.
London: English Heritage.
Bayley, J. Crossley, D. W. and Ponting, M. 2008. Metals and metalworking: a research framework for
archaeometallurgy. London: Historical Metallurgy Society. HMS Occasional publication No. 6.
Beekman, E.M. 1999. The Ambonese curiosity cabinet; George Everhardus Rumphius. New Haven: Yale
University Press.
Bellwood, P. 1997. Prehistory of the Indo-Malaysian archipelago. (Revised ed.). Honolulu: University
of Hawai'i Press.
Biek, L. and Bayley, J. 1979. Glass and other vitreous materials. World Archaeology, 11(1), 1-25.
Bjorkman, J. K. 1973. Meteors and Meteorites in the Ancient Near East. Center for Meteorite Studies,
Arizona State University, Publication 12.
Blomgren, S. 1980. The possibilities of producing iron nickel alloys in prehistoric times. The Journal
of the Historical Metallurgy Society, 14(2), 103-104.
Bougas, W. A. 2007. Gold looted and excavated from late (1300 AD-1600 AD) Pre-Islamic Makasar
graves. Archipel, 73(1), 111-166.
BIBLIOGRAPHY

79
Braucher, R. F. Colin, E. T. Brown, D. L. Bourle`s, O. Bamba, G. M. Raisbeck, F. Yiou, and J. M. Koud.
1998. African laterite dynamics in situ-produced 10Be. Geochimica et Cosmochimica Acta 62:
1501–1507.
Bronson, B. 1987. Terrestrial and meteoritic nickel in the Indonesian Kris. The Journal of the Historical
Metallurgy Society, 21(1), 8-15.
Bronson, B. 1992. Patterns in the Early Southeast Asian Metals Trade. In I. Glover, P. Suchitta and I.
Glover (Eds.), Early Metallurgy, Trade and Urban Centres in Thailand and Southeast Asia. (63-
114). Bangkok: White Lotus.
Buchwald, V. F. and Mosdal, G. 1985. Meteoritic iron, telluric iron and wrought iron in Greenland.
Meddeleser om GrØnland, Man and Society 9. 1-49.
Bulbeck, D. 1996-7. The Bronze-Iron Age of South Sulawesi, Indonesia: mortuary traditions,
metallurgy and trade. In Bulbeck, D and Barnard, N (Eds.), Ancient Chinese and Southeast Asian
Bronze Age Cultures, 2, (1007-1076). Taipei: Southern Materials Center Inc.
Bulbeck, D. 2000. Economy, Military and Ideology in Pre-Islamic Luwu, South Sulawesi, Indonesia.
Australasian Historical Archaeology, 18, 3-16.
Bulbeck, D. and Caldwell, I. 2000. Land of iron: the historical archaeology of Luwu and the Cenrana
valley: results of the Origin of Complex Society in South Sulawesi Project (OXIS). Centre for
South-East Asian Studies, University of Hull.
Bulbeck, D. and Prasetyo, B. 2000. Two millennia of socio-cultural development in Luwu, South
Sulawesi, Indonesia. World archaeology, 32(1), 121-137.
Bulbeck, D. and Caldwell, I. 2008. Oryza sativa and the origins of kingdoms in South Sulawesi,
Indonesia: evidence from rice husk phytoliths. Indonesia and the Malay World, 36(104). 1-20.
Bulbeck, D. 2010a. Ian Golver’s contribution to the development of archaeology in Island Southeast
Asia. In B. Bellina, E. A. Bacus, T. O. Pryce and J. W. Christie (Eds.), 50 years of archaeology in
Southeast Asia. Essays in Honour of Ian Glover. (27-40). Bangkok: River Books.

80
Bulbeck, D. 2010b. Uneven development in Southwest Sulawesi, Indonesia during the Early Metal
Phase. In B. Bellina, E. A. Bacus, T. O. Pryce and J. W. Christie (Eds.), 50 years of archaeology in
Southeast Asia. Essays in Honour of Ian Glover. (153-170). Bangkok: River Books.
Bulbeck, D. 2012. Available documentation of luwu prepared metal samples. Unpublished manuscript,
Department of Archaeology and Natural History. Canberra: Australian National University.
Caldwell, I. 1995. Power, state and society among the pre-Islamic Bugis. Bijdragen tot de Taal-, Land-
en Volkenkunde, Deel, 151(3). 394-421.
Charlton, M. F. Shennan, S. J. Rehren, T. and Crew, P. 2013. Evolutionary analysis of ironmaking slag.
In: Humpris, J. and Rehren, T. (Eds.). The world of iron. (288-295). London: Archetype
Publications Ltd.
Childs, S. T. 1988. Clay resource specialisation in Tanzania: implications for cultural process. In: Kolb,
C. (ed.) Ceramic Ecology Revisited 1987: the technology and socioeconomics of pottery. (2-31).
Oxford: BAR.
Childs, S. T. 1989. Clays to Artifacts: resource selection. In African Early Iron Age iron-making
technologies. In. Bronitsky, G. (Eds.) Pottery Technology: ideas and approaches. (139-164).
London: Westview Press.
Coghlan, H. H. 1956. Notes on Prehistoric and Early Iron in the Old World. Oxford: Pitt Rivers Museum.
Craddock, P. T. 2010. Early metal mining and production. (Revised ed.). London: Archetype
Publication Ltd.
Crew, P. 1996. Bloom refining and smithing, slags and other residues. Historical Metallurgy Society,
Archaeology Datasheet, (6).
Crew, P. 2004. Cast iron from a bloomery furnace. HMS News, 57, 1-2.
Crew, P and Charlton, M. 2007. The anatomy of a furnace…and some of its ramifications. In S. LaNiece,
D. Hook & P. Craddock (Eds.), Metals and Mines studies in Archaeometallurgy (219-225).
London: Archetype/British Museum.
Crick, M. 2010. Chinese Trade Ceramics for South-East Asia from the 1st to the 17th Century. Foundation
Baur and 5 Continents Editions, Geneva and Mailan.
Crowe, S. A. 2008. Biogeochemical cycling in iron-rich Lake Matano, Indonesia: An early ocean
analogue, Ph. D. thesis, McGill University.

81
Crowe, S. A. O’Neill, A. H. Katsev, S. Hehanussa, P. Haffner, G. D. Sundby, B. and Fowle, D. A. 2008. The
biogeochemistry of tropical lakes: A case study from Lake Matano, Indonesia. Limonology and
Oceanography, 53(1). 319-331.
Dalvi, A. D. Bacon, W. G. and Osborne, R. C. 2004. The past and the future of nickel laterites. In PDAC
2004 International Convention, Trade Show & Investors Exchange (pp. 1-27). Toronto: The
prospectors and Developers Association of Canada.
David, N. Heimann, R. Killick, D. and Wayman, M. 1989. Between bloomer and blast furnace: Mafa
iron-smelting technology in North Cameroon. African Archaeological Review, 7, 183-208.
Dawson, N. F. and Edwards, R. I. 1986. Factors affecting the reduction of chromite. INFACON, 4, 105-
113.
Desch, C. H. 1928. Reports on the metallurgical examination of specimens for the Sumerian
Committee of the British Association. Reports of the British Association for the Advancement
of Science.
Donaldson, C. H. 1976. An experimental investigation of olivine morphology. Contributions to
Mineralogy and Petrology, 57(2), 187-213.
Dorian, J.P. Clark, A. L. and Djumhani. 1986. A geologic and mineral resource assessment of Indonesia.
Journal of Southeast Asian Earth Sciences, 1(1), 33-44.
Druce, S. C. 2009. The lands west of the lakes: a history of the Ajattappareng Kingdoms of South
Sulawesi, 1200 to 1600 CE. Leiden: KITLV Press.
Frankel, T. P. 1963. The origin of Indonesian “Pamor”, Technology and Culture 4(1). 14-21.
Freestone, I. C. 1988. Melting points and viscosities of ancient slags: a contribution to the discussion.
The Journal of the Historical Metallurgy Society, 22(1), 49-51.
Freestone, I. C. and Tite, M. S. 1986. Refractories in the ancient and preindustrial world. In: W.D.
Kingery (Ed.), High-Technology Ceramics: Past, Present and Future, Ceramics and Civilisation,
vol. III, (35-63). Wesercille: The American Ceramic Society.
Freestone, I. C. 1989. Refractory materials and their procurement. In A Hauptmann, A. Pernicka, E.
and Wagner, G. A (Eds), Old World Archaeometallurgy, Proceedings of the International
Symposium,Heiderberg 1987 (Bochum), 155–162.

82
Frey, E. 2010. The Kris Mystic Weapon of The Malay World. ITBM.
Gibson, A., and Woods, A. 1997. Prehistoric pottery for the archaeologist. (2nd eds.). London:
Leicester University Press.
Golightly, J. P. and Arancibia, O. N. 1979. The chemical composition and intrafed spectrum of nickel
and iron-substituted serpentine from a nickeliferous laterite profile, Soroako, Indonesia.
Canadian Mineralogist. 17. 719-728.
Gordon, R. B. and Killick, D. J. 1993. Adaption of technology to culture and environment: bloomery
smelting in America and Africa. Technology and Culture. 34(2). 243-270.
Guy, J. 1986. Oriental trade ceramics in Southeast Asia ninth to sixteenth centuries. Oxford. Oxford
University Press.
Hall, K. R. 1985. Maritime Trade and State Development in Early Southeast Asia. Honolulu: University
of Hawaii press.
Hall, K. R. 2011. A History of Early Southeast Asia. Maritime trade and societal development 100-1500.
Plymouth: Rowman & Littlefield Publishers, Inc.
Higham, C. 1989. The Archaeology of Mainland Southeast Asia—from 10,000 BC to the Fall of Angkor.
Cambridge:Cambridge University Press.
Ige, A. and Rehren, T. 2003. Black sand and iron stone: iron smelting in Modakeke, Ife, south western
Nigeria. Institute for Archaeo-Metallurgical Studies 23. 15-20.
Illes, L. and Martinón-Torres, M. 2009. Pastoralist iron production on the Laikipia Plateau, Kenya:
wider implications for archaeometallurgical studies. Journal of Archaeological Science 36(10).
2314-2326.
Killick, D. 2001. Science, speculation and the origins of extractive metallurgy. In D. Brothwell & A.
Pollard (Eds.), Handbook of Archaeological Sciences (483-492). Chichester: John Wiley.
Kim, K. H. Akase, Z. Suzuki, T. and Shindo, D. 2010. Charging Effects on SEM/SIM Contrast of
Metal/Insulator System in Various Metallic Coating Conditions. Materials transactions, 51(6),
1080-1083.
Koolhof, S. 2010. South Sulawesi. In S. Kuhnt-Saptodewo, D. Pospíšilová and P. Hesser (Eds.), Sulawesi
and Beyond. The František Czurda Collection (42-47). Wien: Museum für Völkerkunde.

83
Lape, P. V. 2002. On the use of Archaeology and History in Island Southeast Asia. Journal of the
Economic and Social History of the Orient 45(4). 468-491.
Lathief, H. 2010. Revisiting the collection of Dr. František Czurda. In S. Kuhnt-Saptodewo, D.
Pospíšilová and P. Hesser (Eds.), Sulawesi and Beyond. The František Czurda Collection (96-
109). Wien: Museum für Völkerkunde.
Macknight, C. C. 1993. Early History of South Sulawesi: Some Recent Advances, The Working Papers
81. Monash University. Centre of Southeast Asian Studies.
Macknight, C. 2000. Report on a workshop on early South Sulawesi. 18-19. Aug. 2000.
Maisey, A. 1988. Kris and meteorites. Journal of Historical Metallurgy 22. 58-59.
Maritan, L. Mazzoli, C. Tenconi, M. Leonardi, G. and Boaro, S. 2009. Provenance and technology of
Early Bronze Age pottery from a lake-dwelling settlement at Arqua Petrarca, Padova, Italy. In
Quinn, P. S. (Ed.). Interpreting Silent Artefacts: Petrographic Analysis of Archaeological
Ceramics. Oxford: Archaeopress.
Marschall, W. 2010. Metal-work in and from south sulawesi. In S. Kuhnt-Saptodewo, D. Pospíšilová
and P. Hesser (Eds.), Sulawesi and Beyond. The František Czurda Collection (80-83). Wien:
Museum für Völkerkunde.
McCoy, T. J. Marquardt, A. E. Vicenzi, E. P. Ash, R. D. and Wasson, J. T. 2008. Meteoritic Metal Beads
from the Havana, Illinois, Hopewell Mounds: A Source in Minnesota and Implications for
Trade and Manufacture. In 39th Lunar and Planetary Institute Science Conference Abstracts.
1984.
McNeil, M. 1974. Lateritic soils. Scientific American, 211(5). 68-73.
Miller, D. E. and Van Der Merwe, N. J. 1994. Early metal working in Sub-Saharan Africa: A review of
recent research. Journal of African History. 35. 1-36.
Nahon, D. Carozzi, A. V. and Parron, C. 1980. Lateritic weathering as a mechanism for the generation
of ferruginous ooids. Journal of Sedimentary Research, 50(4), 1287-1298.
O'Connor, S. J. 1975. Iron working as spiritual inquiry in the Indonesian Archipelago. History of
Religions, 14(3), 173-190.

84
Osborne, M. 2010. Southeast Aasia. An introductory history. (10th ed.). Crows Nest: Allen & Unwin.
Paynter, S. 2006. Regional variations in bloomery smelting slag of the Iron Age and Romano-British
Periods. Archaeometry 48(2). 271-292.
Paynter, S. 2007. Innovations in bloomery smelting in Iron Age and Romano-British England. In S.
LaNiece, D. Hook & P. Craddock (Eds.), Metals and Mines studies in Archaeometallurgy (202-
210). London: Archetype/British Museum.
Pelras, C. 1996. The bugis. Oxford: Blackwell Publishers Ltd.
Pendleton, R. L. 1941. Laterite and its structural uses in Thailand and Cambodia. Geographical Review
31. 177–202.
Petzow, G. 1978. Metallographic Etching: metallographic and ceramographic methods for revealing
microstrucure. Ohio: American Society for Metals.
Photos, E. Tylecote, R. F. and Adam-Veleni, P. 1988. The possibility of smelting nickel-rich lateritic
iron ores in the Hellenistic settlement of Petres, N. W. Greece. Aspects of Ancient Mining and
Metallurgy: Acta of a British School at Athens Centenary Conference (ed. J.E.Jones). University
College of North Wales. 35-43.
Photos, E. 1989. The question of meteoritic versus smelted nickel-rich iron: archaeological evidence
and experimental results. World Archaeology. 20(3). 403-421.
Pigott, V. 1986. Pre-industrial mineral exploitation and metal production in Thailand. Masca Journal.
3. 170–174.
Pleiner, R. 2000. Iron in Archaeology: the European bloomery smelters. Prague: Archeologigky Ustav
Avcr.
Poelinggomang, E. L. 1993. The Dutch trade policy and its impact on Makassar's trade. Review of
Indonesian and Malaysian affairs, 27, 61-76.
Pryce, T. O. and Natapintu, S. 2009. Smelting Iron from Laterite: Technical Possibility or Ethnographic
Aberration? Asian Perspectives, 48: 249-264.
Purwanto, H. Shimada, T. Takahashi, R. Yagi, J. 2002. Lowering of grinding energy and enhancement
of agglomerate strength by dehydration of Indonesian Laterite ore. ISIJ International. 42(3). 243-247.
Quinn, P. S. 2013. Ceramic Petrography. The Interpretation of Archaeological Pottery and Related
Artefacts in Thin Section. Oxford: Archaeopress.
Rehren, T. Charton, M. Chirikure, S. Humphris, J. Ige, A. and Veldhuizen, H. A. 2007. Decisions set in
slag: the human factor in African iron smelting. In S. LaNiece, D. Hook & P. Craddock (Eds.),

85
Metals and Mines studies in Archaeometallurgy (211-218). London: Archetype/British
Museum.
Renfrew, C. and Bahn, P. 2008. Archaeology: Theories, methods and practices. (5th ed.). London:
Thames & Hudson.
Rice, P. M. 1987. Pottery Analysis. Chicago: University of Chicago Press.
Robino, C. V. 1996. Representation of mixed reactive gases on free energy (Ellingham-Richardson)
diagrams. Metallurgical and Materials Transactions B. 27(1). 65-69.
Rye, O. S. 1981. Pottery Technology: principles and reconstruction. Manuals on Archaeology. 4.
Washington D. C: Taraxacum.
Scott, D. A. 1991. Metallography and microstructure of ancient and historic metals. Getty Conservation
Institute; J. Paul Getty Museum, in association with Archtype Books.
Scott, D. A. 2013. Ancient Metals: Microstructure and Metallurgy Ⅳ: Iron and Steel.
Severin, T. Rehren, T. and Schleicher, H. 2011. Early metal smelting in Aksum, Ethiopia: copper or
iron?. European Journal of Mineralogy, 23(6), 981-992.
Takimoto, K., and Suzuka, T. 1968. General statement on geology and ore deposits in Thailand and
Malaya, In K. Takimoto (Eds.) Geology and Mineral Resources in Thailand and Malaya. Kyoto:
The Centre for Southeast Asian Studies, Kyoto niversity.
Tite, M. S., Freestone, I. C., Meeks, N., and Craddock, P. T. 1985. The examination of refractory ceramics
from metal-production and metalworking sites (Council for British Archaeology Research
Report 58). London: council for British Archaeology.
Tylecote, R. F. 1962. Metallurgy in archaeology: The prehistory of Metallurgy in the British Isles.
London: Edward Arnold.
Tylecote, R. F. 1986. The prehistory of Metallurgy in the British Isles. London: Institute of Metals.
Tylecote, R. F. 1987. The Early History of Metallurgy in Europe. London and New York: Longman.
Tylecote, R. F. 1991. Iron in the industrial revolution. In J. Day and R. Tylecote (Eds.), The Industirial
Revolution in Metals. (200-260) London: The Institute of Metals.
Van Heekeren, H. R. (1958). The bronze-iron age of Indonesia. Nijhoff.
Veldhuijzen, H. A, and Rehren, T. 2006. Iron smelting slag formation at Tell Hammeh (Az-Zarqa),
Jordan. In J. Perez-Arantegui (ed.) Proceedings of the 34th International Symposium on
Archaeometry. 3-7 May 2004 in Spain. Zaragoza: Institucion Fernando el Catolico, 245-250.

86
Veldhuijzen, H. A., and Rehren, T. 2007. Slags and the city: early iron production at Tell Hammeh,
jordan, and tel beth-shemesh, israel. In S. LaNiece, D. Hook & P. Craddock (Eds.), Metals and
Mines studies in Archaeometallurgy (189-201). London: Archetype/British Museum.
Wadsworth, J. and Lesuer, D. R. 2000a. Ancient and modern laminated composites-from the Great
Pyramid of Gizeh to Y2K. International Metallographic Society Conference. 21. Oct-3. Nov 1999.
Ohio: International Metallographic society, 1-24.
Wadsworth, J. and Lesuer, D. R. 2000b. Ancient and modern laminated composites-from the Great
Pyramid of Gizeh to Y2K. Materials Characterization 45(4). 289-313.
Woodward, A. 2002. Inclusions, impressions and interpretation. Prehistoric Britain The Ceramic Basis
[= PCRG Occasional Publication 3]. (106-118). Oxford: Oxbow.
Zerner, C. 1981. Signs of the spirits, signature of the smith: iron forging in Tana Toraja. Indonesia, 31,
89-112.

87
APPENDIX

88
Site Site location Slag Ore Gangue Ceramic Object
Matano MTN.T74 MTN 866-L.R
MTN.T34 MTN 820
Nuha NUH.1.7 NUH 4597A
NUH.1.12 NUH 4628
Pandai Besi PDB.U1T3.4 PDB 643A
PDB.U1T3.5 PDB 646A
PDB.U1T3.8 PDB 888A PDB 890-
L.R
PDB 885
PDB.U1T3.9 PDB 897
Rahampu’u 1 RHP.S6T5.5 RHP 158A RHP 159
RHP.S6T5.6 RHP 164
RHP.S6T5.14 RHP 512A
RHP.S6T5.15 RHP 526
RHP.S6B10.5 RHP 184A
RHP.S6B10.18 RHP 541
RHP.0.1 surface RHP 4220-
L.R
Lemogola LMG.1.4 LMG 707A-
1.2.3
LMG 704A
LMG.1.5 LMG 713A-L.R
LMG.1.9 LMG 812A
Katue KTE.1.6 KTE 2545
KTE.2.9 KTE 2816A
KTE.0.3 surface KTE 4231
Sabbang Loang SBL.1-4.4 SBL 5015-L.R
SBL.1-4.17 SBL 5076A
SBL.1-4.19 SBL 5089B
SBL.3-1.8 SBL 1247A
Pinanto PNT.U61.B7.10 PNT 1664-
L.R
PNT.U121B15.4 PNT 1745B PNT 1746A
Kamiri KMR.0.1 surface KMR 4246
Passauen PSN.0.1 surface PSN 4240-2 PSN 4240-1
Lembo-Lembo 4561-1 4561-2
Bukit
Lamolengku 124
APPENDIX 1-1: Luwu sample information

89
Site/ location
Speci-men ID
Laboratory identification
Explanation Sample image
Matano MTN.T74.2
866 (2 speci-
mens)
Sherd (right) with iron conglomerate (left)
Surface of Matano collection, 2 Qing blue-and-white sherds (10grams) coated with iron conglomerate from zone 74 on the shore of Lake Matano below the Lemogola excavation. One sherd selected
Matano MTN.T34.11
820 Fuel ash slag (Initially labelled as a copper/iron slag)
Surface collection, collected from zone 34 (c. 100grams). intensities of melted copper run over most of the surface, sometimes as sparse veins, sometimes as a thin coat, covering basal iron slag.
Nuha NUH.1.7.1
4597A Pot sherd Excavated from unit 7 in the thick of the smelting deposit, consisted of 6 pottery sherds with adhering iron slag. Largest sherd weighing 16.7grams was chosen for analysis
Nuha NUH.1.12.1
4628 Iron slag Recovered from the unit 12 feature beneath the main Nuha smelting deposit. 2.3 grams.
Pandai Besi PDB.U1T3.4.1
643A Iron artefact fragment
Found in unit 4 of square U1T3.

90
Site/ location
Speci-men ID
Laboratory identification
Explanation Sample image
Pandai Besi PDB.U1T3.5.1
646A Iron stone (ore)
At unit 5, black iron conglomerate layer Ironstone weighing 1.1kg among 95 lumps
Pandai Besi PDB.U1T3.8.55
888A Bloomery iron slag
In unit 8, One of 10 lumps, weighing 50 grams (total weigh was 103grams)
Pandai Besi PDB.U1T3.8.54
890 (2 speci-
mens)
Iron ore In unit 8, iron conglomerate containing flaked chert weighing 60 grams
Pandai Besi PDB.U1T3.8.56
885 Gangue (Initially labelled as copper/iron smelting product)
In unit 8, weight was 19.7g
Pandai Besi PDB.U1T3.9.48
897 Gangue Unit 9, another lump of iron conglomerate containing flaked chert. Slag material inside.
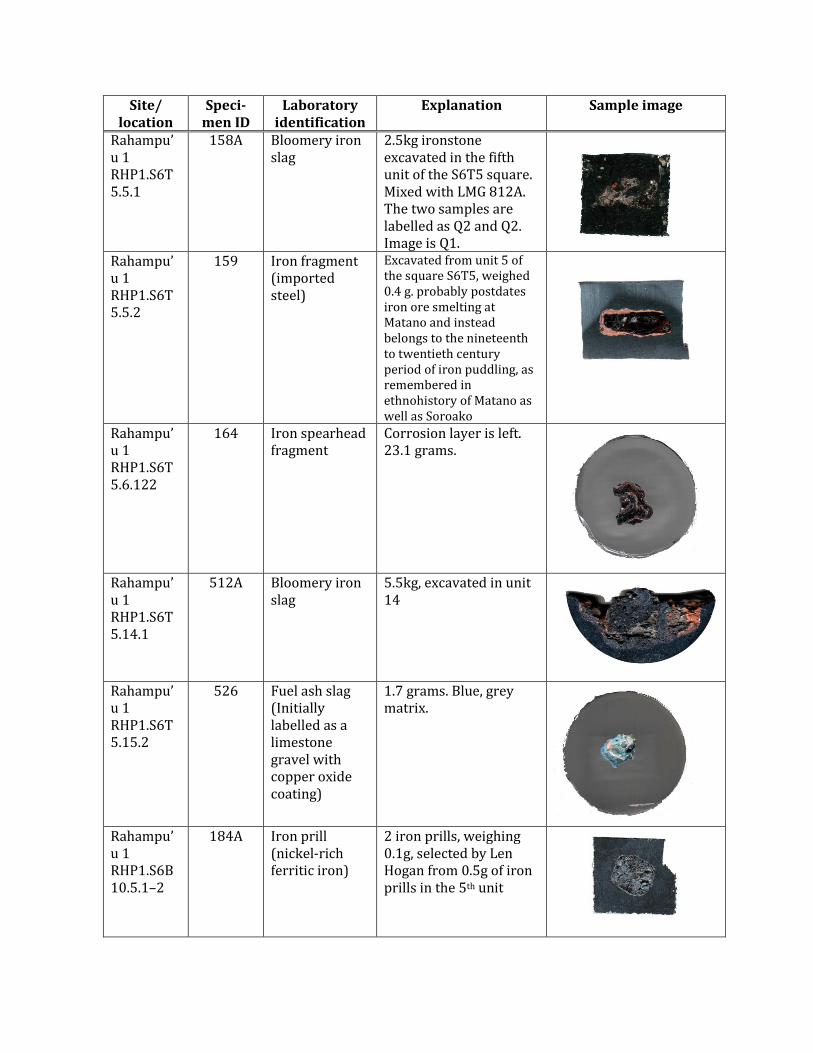
91
Site/ location
Speci-men ID
Laboratory identification
Explanation Sample image
Rahampu’u 1 RHP1.S6T5.5.1
158A Bloomery iron slag
2.5kg ironstone excavated in the fifth unit of the S6T5 square. Mixed with LMG 812A. The two samples are labelled as Q2 and Q2. Image is Q1.
Rahampu’u 1 RHP1.S6T5.5.2
159 Iron fragment (imported steel)
Excavated from unit 5 of the square S6T5, weighed 0.4 g. probably postdates iron ore smelting at Matano and instead belongs to the nineteenth to twentieth century period of iron puddling, as remembered in ethnohistory of Matano as well as Soroako
Rahampu’u 1 RHP1.S6T5.6.122
164 Iron spearhead fragment
Corrosion layer is left. 23.1 grams.
Rahampu’u 1 RHP1.S6T5.14.1
512A Bloomery iron slag
5.5kg, excavated in unit 14
Rahampu’u 1 RHP1.S6T5.15.2
526 Fuel ash slag (Initially labelled as a limestone gravel with copper oxide coating)
1.7 grams. Blue, grey matrix.
Rahampu’u 1 RHP1.S6B10.5.1–2
184A Iron prill (nickel-rich ferritic iron)
2 iron prills, weighing 0.1g, selected by Len Hogan from 0.5g of iron prills in the 5th unit

92
Site/ location
Speci-men ID
Laboratory identification
Explanation Sample image
Rahampu’u 1 RHP1.S6B10.18.1
541 Gangue (sand grain)
Excavated beneath the main iron smelting deposit (weight 10 grams).
Rahampu’u 1 RHP.0.1 (Surface)
4220 (2 speci-
mens)
Tuyère (left) with iron slag material (right)
Surface fine collected on 9 Feb 1999 and identified in Indonesia as a tuyere fragment with a metallic coating. Not weighed.
Lemogola LMG.1.4.3–4
707A (3 speci-
mens)
Iron slag Unit 4, flat iron slag fragments, 0.8 grams.
Lemogola LMG.1.4.2
704A Iron silicate-fayalite
15 fragments, weighed 150grams, were found in unit 4. one of them was analysed. It has glassy matrix

93
Site/ location
Speci-men ID
Laboratory identification
Explanation Sample image
Lemogola, LMG.1.5.1
713A (2 speci-
mens)
Bloomery iron slag
Unit 5, 50 grams of iron slag, of which 10 grams were selected
Lemogola LMG.1.9.1
812A Bloomery iron slag
Unit 9, one lump of 29 lumps (total 150g), but mixed with RHP 158A. The two samples are labelled as Q2 and Q2. Image next is Q2.
Katue KTE.1.6.5
2545 Iron tube (Initially labelled as an iron or bronze tube)
Collected from first millennium CE habitation deposit. It weighed 1.6 g, and was described as virtually uncorroded, with the hardness of steel, and coloured red on the surface becoming dark reddish brown interiorly. Its extant length was 15.2mm, thickness of the tube was about 1.7mm, and diameter between 12.1 and 13.5mm
Katue KTE.2.9.18–19
2816A Iron slag (Initially labelled as an iron prill)
Weighed 0.7 grams. Described as having an uncorroded appearance and a dark reddish brown surface colour.
Katue KTE.0.3
4231 Iron ore lump Collected from the surface of the site 2 meters north of square 1.

94
Site/ location
Speci-men ID
Laboratory identification
Explanation Sample image
Sabbang Loang SBL.1-4.4.3
5015 (2 speci-
mens)
Iron fragment Corroded iron weighing 0.3 grams.
Sabbang Loang SBL.1-4.17.1
5076A Iron stone Ironstone manuport in the stratigraphy of Sabbang Loang square 1-4. weighed at 62.4g
Sabbang Loang SBL.1-4.19.51
5089B Ironstone (Initially labelled as an iron-coated gravel)
Ironstone gravels referred to in the stratigraphy of Sabbang Loang square 1-4. 12.3grams
Sabbang Loang SBL.3-1.8.1
1247A Iron blade fragment
Weighed to 6.6 grams including 4.7 grams of artefact, and 1.9 grams of removed corrosion product. 4.7 grams of sample was selected and measured 38.6mm from its tip to the semi-oval cross-section at the other end, which was 14.2mm wide and 2.6mm thick.
Pinanto PNT.U61B7.10.1
1664 Baked clay lumps mixed with iron
Found form a shallow feature in habitation deposit (unit 10). Identified as possibly a lump of baked clay mixed with iron or corroded iron, weighed at 10 grams

95
Site/ location
Speci-men ID
Laboratory identification
Explanation Sample image
Pinanto PNT.U121B15.4.1
1745B Iron slag (Iron reduction product, not smelting. Probably iron working)
Found from a shallow deposit with evidence of iron working. Site included one finger of iron slag, weighing 13.1 grams among 10.
Pinanto PNT.U121B15.4.2
1746A Iron prills (metallic iron + aluminium silicate)
Found from a shallow deposit with evidence of iron working. Among 4 iron prills, 2 samples were identified as metallic iron.
Kamiri KMR.0.1–2
4246 Iron ore Surface collection from a soccer field bordered by features locally identified as the remnants of an ironworking shed, a locality where iron ore was crushed with large stones and a slag heap. Two sample weighed 101.8g, were locally identified as Bukit Pangiwangen iron ores
Passauen PSN.0.1–2
4240 (2 speci-
mens)
4240-1 metallic iron 4240-2 slag (Both initially labelled as ores)
Collected from a pathway exposure that also contained burnt earthenware sherds. Two samples weighed 66.8grams.

96
Site/ location
Speci-men ID
Laboratory identification
Explanation Sample image
Lembo-Lembo
4561 (2 speci-
mens)
Iron ores Ethnohistorical iron ore source for the ironworkers at Nuha (northshore of Lake Matano). Eight lumps (2.077kg) were collected and two of them were selected for analysis.
Lamaleng-ku
124 Iron ore (ironstone)
Ethnohistorical iron ore source for the ironworkers at the west end of Lake Matano. Two iron ore block, weighing 817 grams were collected and one of them was samples.

97
APPENDIX 1-2: Sample images before repolishing
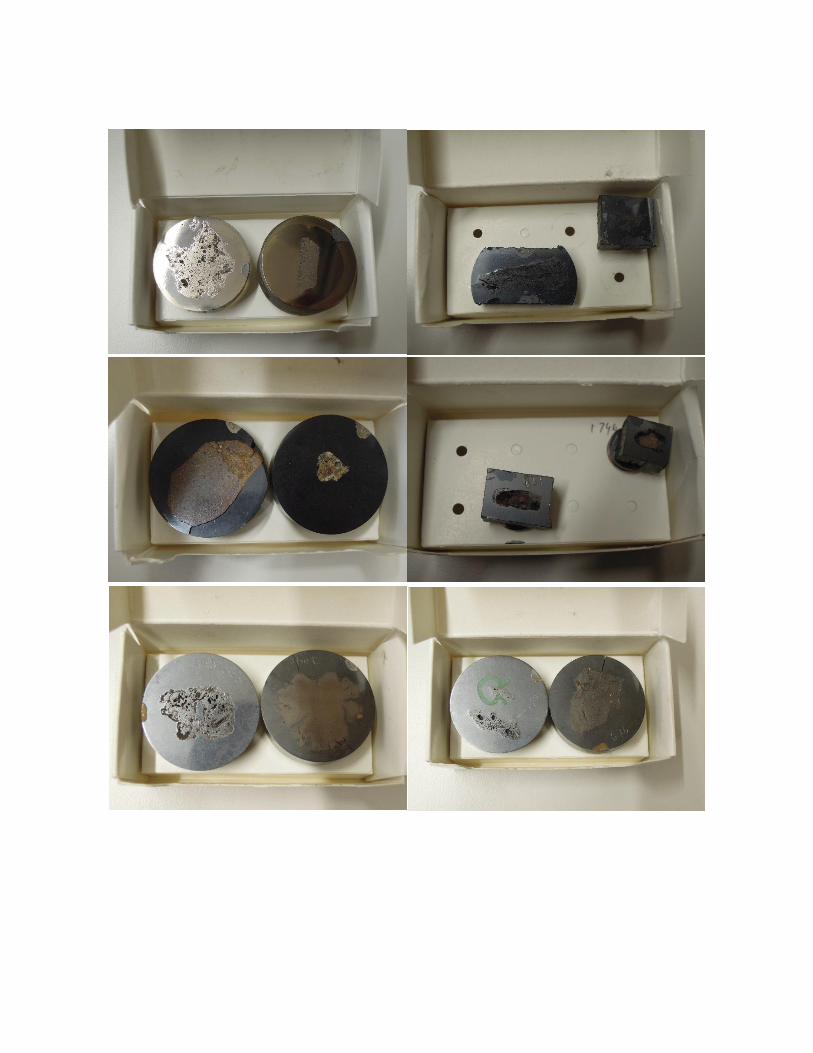
98

99

100
Note: Bulk chemical composition data by SEM-EDS for iron ore and gangue samples from Luwu sites, normalized to 100% with original analytical totals given. All values are the average of five analyses of each sample and calculated in compound % by stoichiometry. x100 or x300 is a magnification of bulk analyses. (bd= below detection limit).
Composition (wt%)
MgO Al2O3 SiO2 P2O5 K2O CaO TiO2 Cr2O3 MnO FeO NiO Total
PDB 1 11.2 20.2 0.7 bd bd bd 0.3 33.8 bd 33.4 0.3 118.5 646A 2 11.1 19.2 0.6 bd bd bd 0.3 33.4 bd 35.2 0.2 117.8 X300 3 11.1 19.0 0.7 bd bd bd 0.2 31.7 bd 37.0 0.2 118.5
4 7.2 14.5 1.2 bd bd bd 0.1 22.5 bd 54.2 0.3 109.2 5 8.7 17.2 1.1 bd bd bd 0.2 27.5 bd 45.0 0.4 111.5 mean 9.8 18.0 0.9 bd bd bd 0.2 29.8 bd 41.0 0.3 115.1
PDB 1 1.4 5.8 14.3 bd bd 1.3 bd 1.5 0.3 75.5 bd 118.8 890-L 2 1.0 4.2 10.0 bd bd 0.7 bd 1.3 0.4 82.5 bd 117.3 X100 3 0.9 3.2 6.2 bd bd 0.2 bd 2.9 0.1 86.6 bd 119.5
4 1.2 4.5 8.0 bd bd 0.4 bd 3.1 0.2 82.6 bd 120.3 5 1.3 5.3 14.0 bd bd 1.5 bd 1.4 0.3 76.3 bd 119.8 mean 1.1 4.6 10.5 bd bd 0.8 bd 2.0 0.3 80.7 bd 119.2
PDB 1 bd 0.8 3.6 bd bd bd bd 0.8 bd 93.4 1.4 90.2 890-R 2 bd 0.6 3.4 bd bd bd bd 0.7 bd 93.9 1.5 96.4 X100 3 bd 0.7 3.2 bd bd bd bd 0.8 bd 93.9 1.3 97.6
4 bd 0.8 3.3 bd bd bd bd 0.7 bd 93.8 1.4 95.8 5 bd 1.4 3.0 bd bd bd bd 0.9 bd 93.2 1.4 98.4 mean bd 0.9 3.3 bd bd bd bd 0.8 bd 93.6 1.4 95.7
PDB 1 0.9 5.0 85.6 bd 1.1 2.0 0.3 bd 0.5 4.5 bd 87.8 885 2 0.5 4.4 88.8 bd 0.4 0.9 0.3 bd 0.4 4.4 bd 83.3 X50 3 0.3 4.5 89.5 bd 0.3 0.8 0.4 bd 0.3 3.7 bd 86.3
4 0.5 4.8 89.0 bd 0.2 1.3 0.4 bd 0.4 3.4 bd 83.5 5 0.7 3.8 87.7 bd 0.9 1.3 0.2 bd 0.2 5.2 bd 85.7 mean 0.6 4.5 88.7 bd 0.6 1.3 0.3 bd 0.4 4.3 bd 85.3
PDB 1 1.6 8.3 65.5 bd 0.6 5.0 0.5 0.1 0.7 17.5 0.2 102.8 897 2 1.0 5.9 69.6 bd 0.7 3.4 0.3 0.2 0.3 18.2 0.5 97.0
X300 3 1.1 6.5 75.2 bd 0.5 4.0 0.3 0.2 0.4 11.5 0.1 95.8 4 1.1 5.9 74.7 bd 0.6 4.9 0.3 0.1 0.3 13.8 0.3 90.7 5 1.4 6.2 68.0 bd 0.8 6.0 0.5 0.6 0.4 16.0 0.1 96.1 mean 1.2 6.6 70.2 bd 0.6 4.7 0.4 0.3 0.4 15.4 0.2 96.5
RHP 1 3.6 4.7 86.0 0.5 1.3 0.9 0.2 bd bd 2.7 bd 86.0 541 2 3.5 3.9 87.4 0.6 1.1 1.0 0.3 bd bd 2.2 bd 96.1
X100 3 4.3 4.6 85.1 0.8 1.4 1.2 0.2 bd bd 2.4 bd 101.9 4 4.0 4.3 85.7 1.2 1.0 1.5 0.2 bd bd 2.1 bd 102.5 5 4.0 5.1 84.8 0.7 1.5 1.3 0.3 bd bd 2.4 bd 95.8 mean 3.9 4.5 85.8 0.8 1.3 1.2 0.2 bd bd 2.4 bd 96.5
LMG 1 bd bd 0.2 bd bd bd bd bd 0.5 99.3 bd 91.8 704A 2 bd bd 0.4 bd bd bd bd bd 0.8 98.8 bd 96.5 X100 3 bd bd 0.6 bd bd bd bd bd 0.5 98.9 bd 88.1
4 bd bd 0.3 bd bd bd bd bd 0.5 99.3 bd 92.0 5 bd bd 0.8 bd bd bd bd bd 0.5 98.8 bd 102.2 mean bd bd 0.4 bd bd bd bd bd 0.6 99.0 bd 94.1
APPENDIX 2-1: EDS Analyses on iron ore/gangue

101
Composition (wt%)
MgO Al2O3 SiO2 P2O5 K2O CaO TiO2 Cr2O3 MnO FeO NiO Total
KTE 1 29.0 1.4 41.4 bd bd 2.6 bd 0.3 1.1 24.2 bd 65.4 4231 2 26.2 0.7 31.9 bd bd 0.6 bd bd 0.4 40.2 bd 49.2 X100 3 27.9 3.6 51.7 bd bd 3.4 bd 1.2 2.3 9.9 bd 77.4
4 28.5 2.7 48.7 bd bd 6.9 bd 1.0 1.6 10.6 bd 80.8 5 27.5 2.9 47.1 bd bd 6.5 bd 1.3 0.3 14.4 bd 75.0 mean 27.8 2.2 44.2 bd bd 4.0 bd 0.7 1.2 19.9 bd 69.5
SBL 1 bd 8.9 68.4 0.6 bd bd 0.8 bd bd 21.3 bd 65.1 5076A 2 bd 20.1 61.1 0.6 bd bd 0.5 bd bd 17.8 bd 63.5 X100 3 bd 23.8 46.2 1.0 bd bd 1.1 bd bd 27.8 bd 59.3
4 bd 12.4 57.3 1.2 bd bd 1.5 bd bd 27.5 bd 61.5 5 bd 17.5 61.9 0.5 bd bd 1.3 bd bd 18.7 bd 72.7 mean bd 16.6 59.0 0.8 bd bd 1.0 bd bd 22.6 bd 64.4
SBL 1 6.2 15.7 63.0 0.6 3.2 0.5 1.3 bd bd 9.4 bd 71.0 5089B 2 5.0 13.3 68.2 bd 2.8 2.8 1.2 bd bd 8.2 bd 73.5 X100 3 7.5 19.6 54.8 0.4 2.1 2.1 1.9 bd bd 12.6 bd 61.3
4 6.7 20.6 53.4 0.3 5.6 5.6 1.6 bd bd 10.7 bd 71.6 5 5.2 16.0 65.0 0.3 3.7 3.7 1.4 bd bd 7.9 bd 64.9 mean 6.1 17.0 60.9 0.3 3.5 3.5 1.5 bd bd 9.8 bd 68.5
KMR 1 0.6 31.6 22.9 0.2 bd 0.3 0.6 bd 0.3 43.6 bd 75.8 4246 2 0.6 32.1 22.1 0.4 bd 0.1 0.9 bd 0.3 43.5 bd 80.3 X100 3 0.1 26.8 21.2 0.6 bd 0.1 0.5 bd bd 50.6 bd 81.6
4 0.5 23.6 16.4 0.3 bd 0.3 0.9 bd 0.2 57.8 bd 74.0 5 0.6 27.0 16.1 0.2 bd 0.3 0.8 bd 0.2 54.8 bd 77.3 mean 0.5 28.2 19.7 0.3 bd 0.2 0.7 bd 0.2 50.0 bd 77.8
Lembo 1 bd 19.9 12.7 bd bd bd bd 2.2 0.4 64.2 0.6 67.9 Lembo 2 bd 21.2 15.7 bd bd bd bd 3.1 bd 59.2 0.7 67.1 4561-1 3 bd 21.9 13.5 bd bd bd bd 3.3 0.2 60.6 0.5 69.5 X100 4 bd 21.0 13.8 bd bd bd bd 3.2 0.2 61.1 0.6 74.9
5 bd 19.0 12.2 bd bd bd bd 5.1 0.5 62.4 0.9 68.2 mean bd 20.6 13.6 bd bd bd bd 3.4 0.3 61.5 0.7 69.5
Lembo 1 bd bd 96.5 bd bd bd bd 0.2 bd 3.3 bd 77.8 Lembo 2 bd bd 94.0 bd bd bd bd 0.4 bd 5.6 bd 77.8 4561-2 3 bd bd 95.4 bd bd bd bd 0.1 bd 4.5 bd 76.5 X100 4 bd bd 97.7 bd bd bd bd bd bd 2.3 bd 75.8
5 bd bd 98.5 bd bd bd bd bd bd 1.5 bd 77.2 mean bd bd 96.4 bd bd bd bd 0.1 bd 3.4 bd 77.0

102
PDB 646A
PDB 890-L
Composition (wt%)
MgO Al2O3 SiO2 CaO TiO2 Cr2O3 MnO FeO Total
1 11.1 31.1 0.7 0.3 bd 31.0 0.5 25.3 102.0 2 3.1 18.2 1.7 0.6 bd 36.4 0.6 39.3 97.1 3 3.9 22.4 1.5 0.4 bd 32.7 0.7 38.5 90.9 4 2.4 9.5 23.4 2.8 bd 0.6 0.6 60.7 81.3 5 0.5 3.8 4.4 0.5 Bd 0.8 0.4 89.6 89.2 6 0.7 3.6 6.3 1.2 0.3 1.1 0.5 86.3 81.7
Composition (wt%)
MgO Al2O3 SiO2 TiO2 Cr2O3 FeO NiO Total
1 Chromite 7.6 15.1 1.2 bd 24.2 51.4 0.5 82.0 2 Matrix bd 4.9 2.0 bd 6.8 85.3 1.0 86.7 3 Chromite 12.7 24.6 bd 0.3 44.5 17.9 bd 129.7

103
PDB 890-R
Composition (wt%)
MgO Al2O3 SiO2 Cr2O3 FeO NiO Total
1 Chromite 11.7 33.8 bd 25.2 28.8 0.4 133.2 2 Chromite 11.5 35.7 bd 24.8 27.7 0.3 136.5 3 Iron mineral bd 0.8 3.1 0.7 94.2 1.2 105.5 4 Iron mineral bd 1.4 3.2 0.6 93.0 1.8 106.4
PDB 885
Composition (wt%)
MgO Al2O3 SiO2 K2O CaO TiO2 MnO FeO Total
1 Quartz 0.3 1.9 94.7 0.5 0.2 bd bd 2.4 90.3 2 Quartz 0.1 1.1 97.3 0.1 0.2 bd bd 1.2 85.9 3 Quartz 0.2 1.1 96.9 0.2 0.6 bd bd 1.1 99.0 4 Glassy matrix 1.9 10.6 73.3 1.9 3.6 0.6 0.7 7.4 100.5

104
Composition (wt%)
MgO Al2O3 SiO2 K2O CaO TiO2 MnO FeO Total
1 Quartz bd 0.8 97.3 bd 0.2 bd bd 1.7 98.0 2 Quartz bd 0.8 97.9 bd 0.4 bd bd 0.8 96.7 3 Quartz 0.3 2.4 94.2 bd 1.1 0.3 bd 1.7 96.7 4 Glassy matrix 1.0 8.1 79.1 2.6 2.4 0.5 0.7 5.7 94.1
Composition (wt%)
MgO Al2O3 SiO2 K2O CaO TiO2 MnO FeO Total
1 Quartz bd 0.4 99.1 bd bd bd bd 0.5 89.8 2 Quartz bd 0.9 98.5 bd bd bd bd 0.6 94.5 3 Quartz bd bd 100 bd bd bd bd bd 89.3 4 Glassy matrix 1.4 17.4 66.3 0.9 2.1 0.9 1.2 9.9 92.0

105
PDB 897
Composition (wt%)
MgO Al2O3 SiO2 K2O CaO TiO2 Cr2O3 MnO FeO NiO Total
1 Wüstite 1.0 6.5 10.3 bd bd 0.9 4.3 1.2 74.5 1.4 93.0 2 Glassy matrix 2.1 13.6 54.4 0.8 6.7 0.5 bd 2.3 19.6 bd 112.5 3 Quartz bd bd 99.0 bd 0.2 bd bd bd 0.8 bd 117.1
Composition (wt%)
Fe Ni Total
1 Metal 73.1 26.9 130.9 2 Metal 74.6 25.4 117.7 3 Metal 73.0 27.0 122.1

106
Composition (wt%)
MgO Al2O3 SiO2 K2O CaO Cr2O3 MnO FeO NiO Total
1 Iron rich mineral bd 1.3 1.4 bd bd 0.7 bd 96.6 bd 55.4 2 Iron rich mineral 0.8 3.9 9.3 0.3 0.7 2.0 0.7 82.3 bd 100.3 3 Iron rich mineral 1.8 0.7 28.9 bd 0.7 bd bd 67.9 bd 52.2 4 Iron rich mineral 1.0 6.1 9.3 0.4 1.2 3.5 0.8 77.7 bd 28.8 5 Iron rich mineral bd bd 2.7 bd 0.6 bd bd 95.6 1.5 65.4
RHP 541
Composition (wt%)
F Na2O MgO Al2O3 SiO2 P2O5 SO3 K2O CaO TiO2 MnO FeO Total
1 bd bd 2.6 6.3 87.3 bd bd 2.0 bd bd bd 1.8 85.8 2 bd bd 2.3 1.5 5.1 bd bd 0.2 0.2 1.2 bd 89.5 98.8 3 2.0 0.3 10.9 5.3 20.2 24.6 0.6 0.3 32.2 bd 0.3 3.2 105.1

107
LMG 704A
KTE 4231
Composition (wt%)
MgO Al2O3 SiO2 CaO Cr2O3 FeO ZrO2 Total
1 Mg-rich olivine 35.8 0.9 46.5 0.2 0.4 15.6 0.5 78.4 2 Mg-Ca rich olivine 17.6 3.5 51.1 23.7 1.5 2.4 0.1 98.3
Composition (wt%)
SiO2 MnO FeO Total
1 Iron mineral 0.6 0.4 99.0 102.7 2 Iron mineral 0.5 0.5 99.0 95.4 3 Iron mineral bd 0.3 99.7 79.0 4 Iron mineral bd 0.6 99.4 76.8

108
SBL 5076A
Composition (wt%)
Al2O3 SiO2 P2O5 TiO2 Cr2O3 FeO Total
1 0.8 98.3 bd bd bd 0.9 96.7 2 41.9 20.0 0.6 3.8 0.4 33.3 67.1
Composition (wt%)
Al2O3 SiO2 P2O5 FeO Total
1 bd 100.0 bd bd 101.6
2 bd 99.7 bd 0.3 101.3
3 98.5 bd 0.6 1.0 62.2
4 97.3 bd 0.5 2.2 59.4

109
SBL 5089B
Composition (wt%)
Al2O3 SiO2 P2O5 TiO2 FeO Total
1 12.5 4.1 4.4 1.1 77.8 49.1 2 10.5 2.3 3.9 1.2 82.1 77.0 3 bd 38.5 bd bd 61.5 73.3
Composition (wt%)
MgO Al2O3 SiO2 K2O Cr2O3 FeO Total
1 bd bd 100 bd bd bd 96.7 2 17.6 23.9 39.6 0.9 0.5 17.5 86.0 3 7.8 32.4 44.2 6.8 0.3 8.6 89.1

110
KMR 4246
Composition (wt%)
MgO Al2O3 SiO2 TiO2 FeO Total
1 46.1 52.6 1.3 79.1 2 45.9 52.2 1.9 88.0 3 1.2 26.3 17.4 0.3 54.8 82.7
4 1.6 27.0 17.1 1.8 52.5 78.2
Composition (wt%)
MgO Al2O3 SiO2 SO3 TiO2 FeO ZrO2 Total
1 bd bd 30.6 bd bd 1.1 68.3 95.6 2 bd 46.5 52.4 bd bd 1.1 bd 80.2 3 0.6 20.6 7.7 0.6 bd 70.5 bd 71.3
4 0.7 41.7 13.9 bd 2.3 41.4 bd 58.4

111
Lembo-Lembo 4561-1
Composition (wt%)
Al2O3 SiO2 Cr2O3 MnO FeO NiO Total
1 0.5 1.3 bd bd 97.8 0.4 65.1 2 20.0 13.1 6.4 0.5 59.0 0.9 76.2
Lembo-Lembo 4561-2

112
Note: Bulk chemical composition data using SEM-EDS for ceramics from Luwu sites, normalized to 100% with
original analytical totals given. All values are the average of five analyses of each sample and calculated in
compound % by stoichiometry. x100 or x300 is magnification of bulk analyses (bd= below detection limit).
Composition (wt%)
Na2O MgO Al2O3 SiO2 SO3 K2O CaO TiO2 Cr2O3 MnO FeO NiO Total
RHP 1 bd 0.5 5.7 87.1 bd bd 0.7 bd bd 0.9 5.1 bd 72.0 4220-L 2 bd 0.6 6.6 74.2 bd 0.3 1.2 0.4 bd 0.8 5.9 bd 76.3 X100 3 bd bd 5.2 89.6 bd bd 0.9 0.5 bd bd 3.8 bd 7634
4 bd bd 3.0 94.0 bd 0.3 0.5 bd bd bd 2.2 bd 79.1 5 bd 0.3 6.4 87.1 bd 0.3 1.0 bd bd 0.5 4.4 bd 75.6 Mean bd 0.3 5.4 88.4 bd 0.2 0.9 0.2 bd 0.5 4.3 bd 76.8
RHP 1 bd 0.3 5.1 88.5 bd 0.2 1.4 0.5 bd 0.5 3.6 bd 79.1 4220-R 2 bd 0.5 4.9 88.6 bd 0.3 1.2 0.3 bd 0.4 3.8 bd 69.0 X100 3 bd 0.3 5.4 86.0 bd 0.3 1.6 0.4 bd 0.4 5.6 bd 76.7
4 bd 0.3 5.7 88.0 bd 0.3 1.5 0.3 bd 0.3 3.5 bd 77.3 5 bd 0.5 6.6 83.5 bd 0.6 1.8 0.6 bd 0.6 5.8 bd 71.8 Mean bd 0.4 5.5 86.9 bd 0.3 1.5 0.4 bd 0.4 4.5 bd 74.8
MTN 1 bd 6.4 8.5 10.0 0.3 bd 0.8 bd 7.6 0.5 65.1 0.7 92.4 866-L 2 bd 7.8 8.6 13.9 0.1 bd 0.6 bd 7.2 0.5 60.8 0.5 95.6 X100 3 bd 3.6 5.9 13.5 0.4 bd 1.1 bd 2.5 0.3 72.1 0.6 90.9
4 bd 9.0 4.8 16.9 0.5 bd 0.6 bd 3.7 0.4 63.8 0.3 95.0 5 bd 8.5 6.2 13.6 0.2 bd 0.3 bd 4.4 0.2 65.9 0.5 104.6 Mean bd 7.1 6.8 13.6 0.3 bd 0.7 bd 5.1 0.4 65.5 0.5 95.7
MTN 1 2.2 bd 21.8 71.4 bd 3.1 0.5 bd bd bd 0.9 bd 94.5 866-R 2 2.2 bd 22.7 70.4 bd 3.1 0.7 bd bd bd 0.9 bd 95.4 X100 3 2.4 bd 23.3 69.7 bd 3.2 0.5 bd bd bd 0.9 bd 94.3
4 2.2 bd 22.8 70.4 bd 3.2 0.5 bd bd bd 1.0 bd 95.2 5 2.2 bd 22.8 70.5 bd 3.2 0.4 bd bd bd 0.9 bd 96.1 Mean 2.3 bd 22.7 70.5 bd 3.2 0.5 bd bd bd 0.9 bd 95.1
NUH 1 bd 11.3 15.2 50.4 bd 1.2 1.4 0.6 6.0 bd 14.0 bd 81.4 4597A 2 bd 8.9 15.1 52.4 bd 1.2 1.5 0.8 6.8 bd 13.4 bd 87.6
3 bd 10.4 17.5 44.4 bd 0.8 1.3 0.7 5.6 bd 19.2 bd 85.8 4 bd 10.0 17.4 48.5 bd 1.0 1.3 0.7 7.5 bd 13.5 bd 86.7 5 bd 9.3 17.3 49.3 bd 1.0 1.5 0.7 6.4 bd 14.4 bd 83.6 Mean bd 10.0 16.5 49.0 bd 1.0 1.4 0.7 6.5 bd 14.9 bd 85.0
APPENDIX 2-2: EDS Analyses on ceramic

113
RHP 4220-L (Technical ceramic, Tuyère)
Composition (wt%)
MgO Al2O3 SiO2 K2O CaO TiO2 Cr2O3 MnO FeO Total
1 Matrix 0.6 8.3 83.1 0.4 1.4 0.5 bd 0.7 5.0 129.2 2 Quartz bd 0.4 99.6 bd bd bd bd bd bd 206.7 3 Iron mineral 1.2 4.9 24.5 0.2 1.6 bd 0.9 1.9 64.9 153.2
Composition (wt%)
MgO Al2O3 SiO2 P2O5 K2O CaO TiO2 MnO FeO NiO Total
1 Matrix 0.4 7.2 85.3 0.4 0.2 0.6 0.5 0.7 4.6 bd 179.6 2 Matrix 0.7 8.4 82.9 0.3 0.3 1.0 0.8 0.5 5.1 bd 127.2 3 Quartz bd bd 98.2 bd bd 0.6 bd bd 1.2 bd 118.3 4 Quartz bd bd 100 bd bd bd bd bd bd bd 146.5 5 Iron mineral bd 0.5 2.7 bd bd bd bd bd 93.3 3.5 106.3 6 Iron mineral bd bd 3.1 bd bd bd bd bd 91.9 5.0 105.4

114
RHP 4220-R (Slaggy material attached with Tuyère)
Composition (wt%)
MgO Al2O3 SiO2 K2O CaO TiO2 Cr2O3 MnO FeO NiO Total
1 Glassy matrix 2.0 9.1 57.4 1.9 8.6 0.5 bd 1.0 19.5 bd 102.7 2 Quartz bd bd 99.4 bd bd bd bd bd 0.6 bd 117.9 3 Wüstite 1.2 6.5 26.7 0.7 2.2 1.0 2.5 0.8 57.7 0.6 112.9
Composition (wt%)
MgO Al2O3 SiO2 P2O5 K2O CaO TiO2 Cr2O3 MnO FeO NiO Total
1 Glassy matrix 2.4 8.8 55.4 0.4 1.5 9.6 0.3 bd 1.3 20.3 bd 142.9 2 Glassy matrix 2.9 8.7 53.3 bd 1.4 10.5 0.4 bd 1.2 21.7 bd 135.7 3 Quartz bd bd 99.4 bd bd bd bd bd bd 0.6 bd 139.2 4 Wüstite 1.5 3.9 7.9 bd 0.3 0.9 1.3 4.5 0.6 78.0 1.1 131.0
5 Wüstite 1.6 4.7 16.5 bd 0.5 2.0 1.1 4.8 0.7 67.2 0.9 141.5
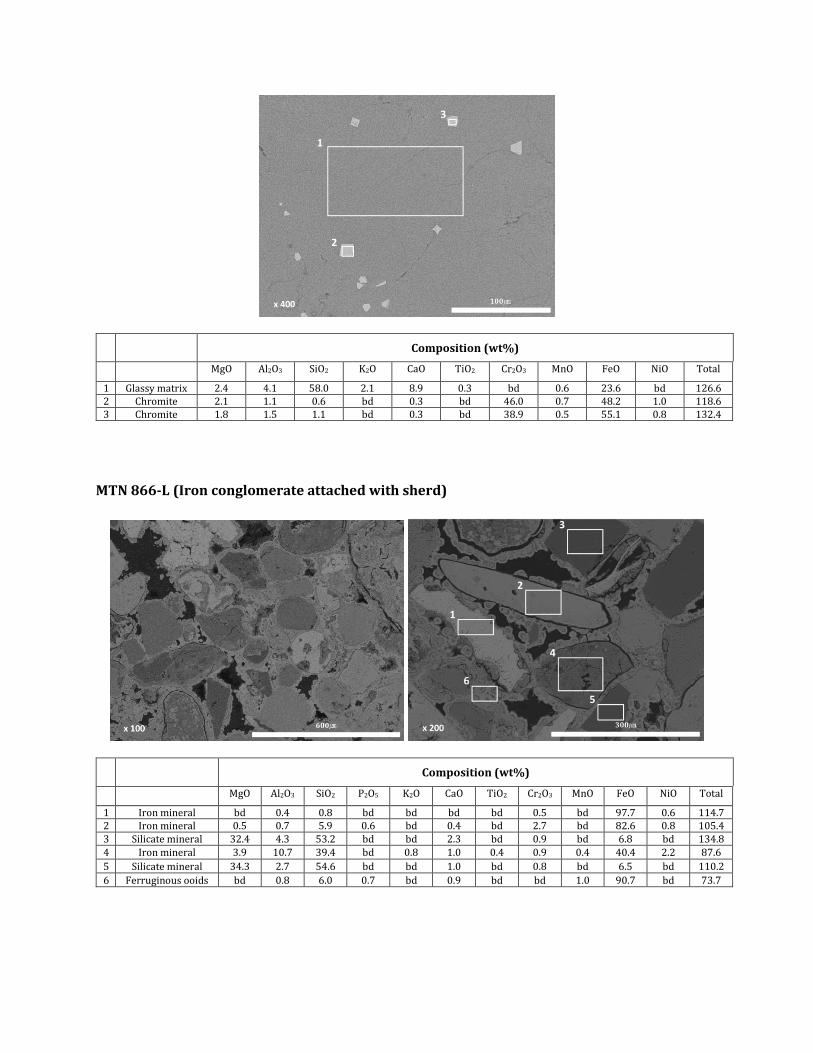
115
Composition (wt%)
MgO Al2O3 SiO2 K2O CaO TiO2 Cr2O3 MnO FeO NiO Total
1 Glassy matrix 2.4 4.1 58.0 2.1 8.9 0.3 bd 0.6 23.6 bd 126.6 2 Chromite 2.1 1.1 0.6 bd 0.3 bd 46.0 0.7 48.2 1.0 118.6 3 Chromite 1.8 1.5 1.1 bd 0.3 bd 38.9 0.5 55.1 0.8 132.4
MTN 866-L (Iron conglomerate attached with sherd)
Composition (wt%)
MgO Al2O3 SiO2 P2O5 K2O CaO TiO2 Cr2O3 MnO FeO NiO Total
1 Iron mineral bd 0.4 0.8 bd bd bd bd 0.5 bd 97.7 0.6 114.7 2 Iron mineral 0.5 0.7 5.9 0.6 bd 0.4 bd 2.7 bd 82.6 0.8 105.4 3 Silicate mineral 32.4 4.3 53.2 bd bd 2.3 bd 0.9 bd 6.8 bd 134.8
4 Iron mineral 3.9 10.7 39.4 bd 0.8 1.0 0.4 0.9 0.4 40.4 2.2 87.6
5 Silicate mineral 34.3 2.7 54.6 bd bd 1.0 bd 0.8 bd 6.5 bd 110.2
6 Ferruginous ooids bd 0.8 6.0 0.7 bd 0.9 bd bd 1.0 90.7 bd 73.7
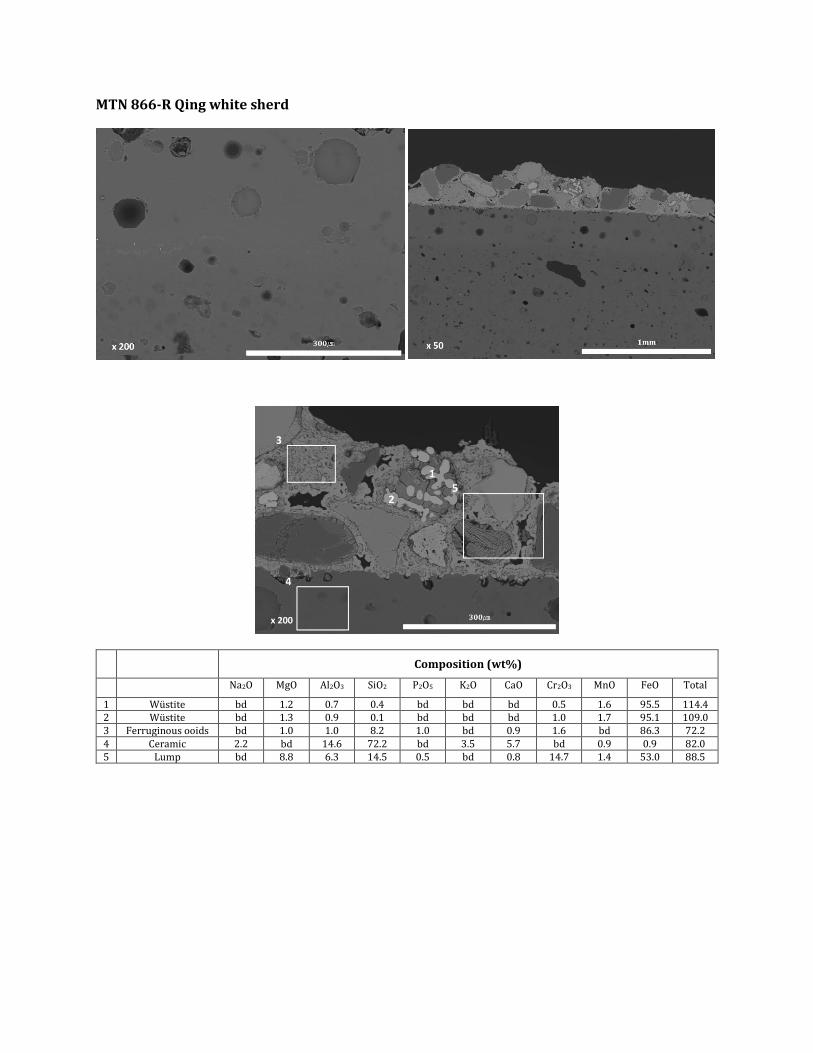
116
MTN 866-R Qing white sherd
Composition (wt%)
Na2O MgO Al2O3 SiO2 P2O5 K2O CaO Cr2O3 MnO FeO Total
1 Wüstite bd 1.2 0.7 0.4 bd bd bd 0.5 1.6 95.5 114.4 2 Wüstite bd 1.3 0.9 0.1 bd bd bd 1.0 1.7 95.1 109.0 3 Ferruginous ooids bd 1.0 1.0 8.2 1.0 bd 0.9 1.6 bd 86.3 72.2 4 Ceramic 2.2 bd 14.6 72.2 bd 3.5 5.7 bd 0.9 0.9 82.0 5 Lump bd 8.8 6.3 14.5 0.5 bd 0.8 14.7 1.4 53.0 88.5

117
NUH 4597A (Pot sherd)
Composition (wt%)
MgO Al2O3 SiO2 K2O CaO TiO2 V2O5 Cr2O3 MnO FeO NiO Total
1 Iron mineral 1.4 8.7 3.7 bd 0.3 bd bd 5.5 bd 80.4 bd 101.2 2 Chromite 8.1 11.3 bd bd bd bd 0.4 58.9 0.5 20.8 bd 100.8 3 Chromite 17.6 46.9 bd bd bd bd bd 21.7 bd 13.3 0.4 98.1 4 Ca-Feldspar 17.5 5.5 50.2 bd 21.9 bd bd 1.3 bd 3.6 bd 87.9 5 Ca-Feldspar 17.9 5.4 50.1 bd 21.7 bd bd 1.3 bd 3.6 bd 95.5 6 Chromite 8.9 19.7 bd bd bd bd 0.4 49.3 bd 21.6 bd 97.5 7 Clay 5.9 12.9 67.5 1.3 1.4 0.6 bd bd bd 10.4 bd 66.4 8 Clay 4.6 11.7 71.4 1.1 0.9 0.6 bd bd bd 9.7 bd 61.7 9 Chromite 14.4 46.2 0.4 bd bd 0.3 bd 22.7 bd 16.0 bd 84.4
10 Chromite 9.6 12.2 bd bd bd bd 0.5 57.2 0.6 19.9 bd 88.0 11 Chromite 18.6 50.3 bd bd bd bd bd 17.5 bd 13.2 0.4 84.6

118
Composition (wt%)
Na2O MgO Al2O3 SiO2 K2O CaO TiO2 V2O5 Cr2O3 FeO Total
1 Chromite bd 13.3 18.9 bd bd bd 0.3 bd 52.3 15.2 99.7 2 Chromite bd 13.6 18.7 bd bd bd 0.3 bd 53.5 13.9 98.4 3 Ca-Feldspar bd 22.3 2.0 56.0 0.3 13.3 bd bd 0.3 5.8 96.4 4 Matrix+Pore 1.0 9.5 15.1 37.2 1.9 2.1 0.8 bd bd 32.3 26.7 5 Chromite bd 11.0 21.4 0.5 bd bd bd 0.4 43.9 22.8 91.3

119
Note: The “bulk” chemical composition data by SEM_EDS for slag samples from Luwu sites, normalized to 100% with original analytical totals given. All values are the average of five analyses of each sample and calculated in compound % by stoichiometry. Q1 and Q2 slags were mixed up and not able to distinguish between RHP 158A and LMG 812A. Grey shading lows are fuel ash slags. x100 or x300 is magnification of bulk analyses (bd= below detection limit).
Composition (wt%)
Na2O MgO Al2O3 SiO2 P2O5 SO3 K2O CaO TiO2 Cr2O3 MnO FeO Total
MTN 1 0.4 3.2 6.2 62.7 bd bd 1.4 18.5 0.3 0.4 1.0 6.0 85.4 820 2 0.3 1.0 4.8 82.3 bd bd 0.9 5.8 0.3 0.1 0.4 4.0 88.9
X100 3 0.3 0.8 5.9 81.2 bd bd 1.0 4.8 0.4 bd 0.7 4.9 81.5 4 0.3 1.3 5.6 76.4 bd bd 0.9 9.0 0.5 0.2 0.6 5.2 85.9 5 0.3 0.6 5.5 84.3 bd bd 1.1 3.9 0.4 0.1 0.4 3.4 80.1 Mean 0.3 1.4 5.6 77.4 bd bd 1.1 8.4 0.4 0.2 0.6 4.7 84.4
NUH 1 bd 4.0 6.0 17.0 0.2 bd 0.6 3.2 bd 1.9 4.8 62.4 74.7 4628 2 bd 3.9 6.3 16.9 bd bd 0.6 3.1 bd 2.0 4.9 62.3 82.3 X100 3 bd 3.9 6.4 17.0 0.3 bd 0.7 3.0 bd 1.5 4.6 62.7 74.0
4 bd 3.7 6.0 17.5 bd bd 0.6 3.2 bd 1.3 4.7 63.0 69.9 5 bd 3.8 6.3 17.0 0.2 bd 0.6 3.1 bd 2.0 4.4 62.6 68.1 Mean bd 3.9 6.2 17.1 0.1 bd 0.6 3.1 bd 1.7 4.7 62.6 73.8
PDB 1 0.5 1.1 7.3 17.1 0.3 0.5 1.4 6.2 0.1 0.1 0.8 64.6 115.9 888A 2 0.1 1.4 9.8 11.8 0.2 0.3 0.5 3.1 0.1 2.1 0.7 70.0 112.1 X300 3 0.3 1.2 11.5 12.1 0.2 0.3 1.0 4.8 0.3 0.8 0.8 66.8 113.9
4 0.3 1.0 10.6 12.7 0.2 0.3 0.9 5.0 0.2 0.4 0.8 67.5 112.6 5 0.3 1.0 7.4 17.1 0.2 0.6 1.5 6.6 0.2 0.1 0.8 64.2 113.4 Mean 0.3 1.1 9.3 14.1 0.2 0.4 1.0 5.1 0.2 0.7 0.8 66.6 113.6
RHP 1 0.8 0.8 7.3 25.0 bd 0.6 1.7 2.8 bd 0.4 0.4 60.2 125.9 512 2 0.7 1.0 6.3 23.9 bd bd 1.1 2.2 bd 0.6 0.3 64.0 123.7
X100 3 0.6 1.0 5.8 22.9 bd bd 1.2 2.0 bd 0.4 0.4 65.8 115.7 4 0.4 1.1 6.1 22.2 bd bd 0.9 1.6 bd 0.8 0.5 66.2 119.3 5 0.5 1.1 6.3 22.7 bd bd 0.9 1.8 bd 0.6 0.4 65.7 101.2 Mean 0.6 1.0 6.4 23.4 bd 0.1 1.2 2.1 bd 0.6 0.4 64.4 117.1
RHP 1 bd 1.6 4.5 78.6 bd bd 2.6 9.0 0.4 bd 0.4 3.0 126.6 526 2 bd 2.2 4.3 76.2 bd bd 2.5 11.2 0.4 bd 0.5 2.8 128.9
X100 3 bd 1.6 6.1 76.9 bd bd 2.7 8.4 0.3 bd 0.4 3.5 121.0 4 bd 2.0 6.7 73.7 bd bd 3.1 10.3 0.4 bd 0.6 3.3 128.4 5 bd 1.5 4.2 81.1 bd bd 2.5 7.6 0.3 bd 0.3 2.4 122.0 mean bd 1.8 2.5 77.3 bd bd 2.7 9.3 0.4 bd 0.4 3.0 125.4
Q1 1 0.6 2.1 7.6 24.7 0.2 bd 2.1 4.2 0.2 1.1 0.7 56.3 80.9 X100 2 0.4 2.2 8.3 25.7 0.2 bd 0.9 4.2 0.2 0.7 0.9 55.2 80.1
3 0.2 2.7 8.0 27.0 bd bd 2.3 4.9 0.2 0.7 0.7 53.3 75.6 4 0.2 2.2 8.0 25.1 0.5 bd 2.0 4.2 0.2 1.1 0.7 55.8 85.9 5 0.4 3.4 7.5 23.5 0.5 bd 1.7 4.0 1.4 0.9 56.6 82.7 Mean 0.4 2.5 7.9 25.2 0.3 bd 2.0 4.3 0.2 1.0 0.8 55.5 81.0
Q2 1 0.7 1.6 6.6 13.5 bd 0.3 1.0 2.6 0.1 1.0 1.6 70.9 95.1 X100 2 0.6 1.6 6.3 14.1 0.3 0.3 1.1 2.9 0.1 0.9 1.4 70.4 94.9
3 0.2 1.5 8.4 14.1 0.2 0.5 0.6 1.7 0.2 0.6 2.8 69.2 91.3 4 0.4 1.6 8.3 18.3 bd 0.5 1.1 3.1 0.2 1.3 1.6 63.6 91.3 5 bd 1.4 10.4 13.9 bd 0.7 0.4 0.3 0.2 2.5 1.9 67.3 88.8 Mean 0.4 1.6 8.0 14.8 0.1 0.5 0.8 2.3 0.2 1.3 1.9 68.3 92.3
LMG 1 0.3 2.8 12.4 23.5 bd bd 0.6 6.7 0.5 1.2 1.1 51.1 80.4 707A-1 2 0.4 2.6 12.2 23.5 bd bd 0.6 6.7 0.5 1.7 1.0 50.8 89.3 X300 3 0.4 2.9 12.7 23.8 bd bd 0.5 6.5 0.3 1.6 1.1 50.1 91.4
4 0.5 2.7 12.4 24.4 bd bd 0.6 6.8 0.5 1.3 0.9 49.8 89.3 5 0.7 2.7 12.7 24.4 bd bd 0.6 6.9 0.4 1.7 1.0 49.0 92.9 Mean 0.4 2.7 12.5 23.9 bd bd 0.6 6.7 0.5 1.5 1.0 50.2 88.7
APPENDIX 2-3: EDS Analyses on iron slag
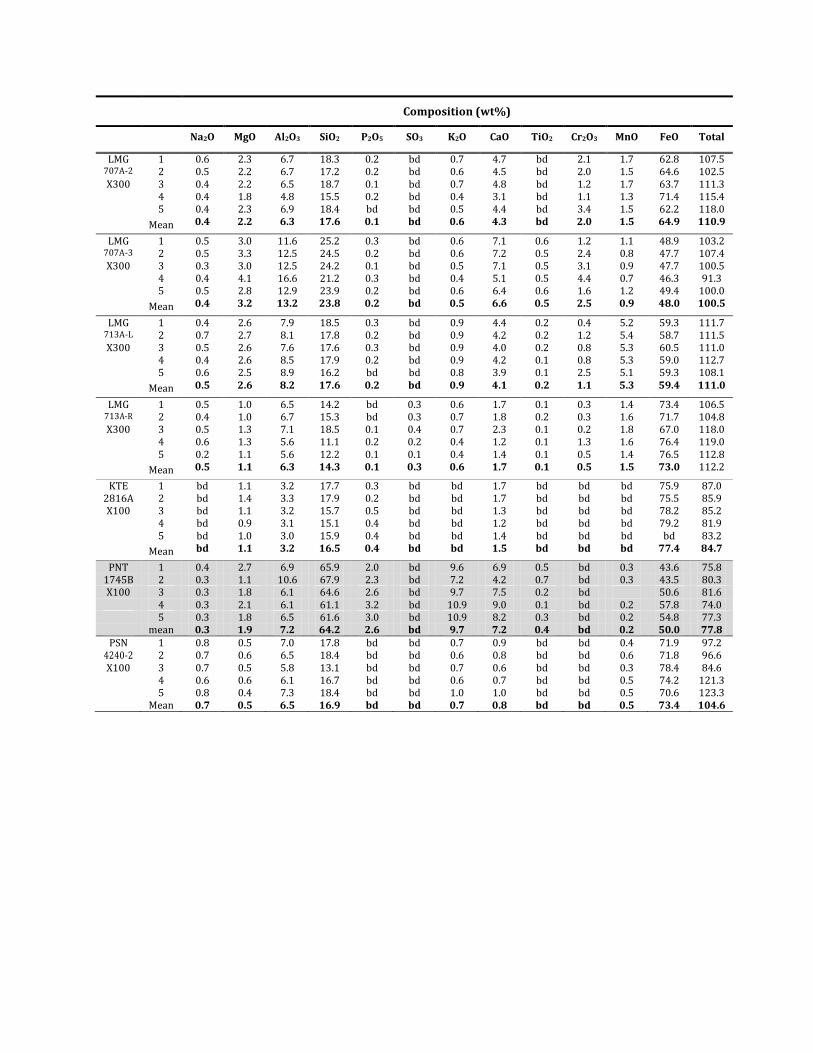
120
Composition (wt%)
Na2O MgO Al2O3 SiO2 P2O5 SO3 K2O CaO TiO2 Cr2O3 MnO FeO Total
LMG 1 0.6 2.3 6.7 18.3 0.2 bd 0.7 4.7 bd 2.1 1.7 62.8 107.5 707A-2 2 0.5 2.2 6.7 17.2 0.2 bd 0.6 4.5 bd 2.0 1.5 64.6 102.5 X300 3 0.4 2.2 6.5 18.7 0.1 bd 0.7 4.8 bd 1.2 1.7 63.7 111.3
4 0.4 1.8 4.8 15.5 0.2 bd 0.4 3.1 bd 1.1 1.3 71.4 115.4 5 0.4 2.3 6.9 18.4 bd bd 0.5 4.4 bd 3.4 1.5 62.2 118.0 Mean 0.4 2.2 6.3 17.6 0.1 bd 0.6 4.3 bd 2.0 1.5 64.9 110.9
LMG 1 0.5 3.0 11.6 25.2 0.3 bd 0.6 7.1 0.6 1.2 1.1 48.9 103.2 707A-3 2 0.5 3.3 12.5 24.5 0.2 bd 0.6 7.2 0.5 2.4 0.8 47.7 107.4 X300 3 0.3 3.0 12.5 24.2 0.1 bd 0.5 7.1 0.5 3.1 0.9 47.7 100.5
4 0.4 4.1 16.6 21.2 0.3 bd 0.4 5.1 0.5 4.4 0.7 46.3 91.3 5 0.5 2.8 12.9 23.9 0.2 bd 0.6 6.4 0.6 1.6 1.2 49.4 100.0 Mean 0.4 3.2 13.2 23.8 0.2 bd 0.5 6.6 0.5 2.5 0.9 48.0 100.5
LMG 1 0.4 2.6 7.9 18.5 0.3 bd 0.9 4.4 0.2 0.4 5.2 59.3 111.7 713A-L 2 0.7 2.7 8.1 17.8 0.2 bd 0.9 4.2 0.2 1.2 5.4 58.7 111.5 X300 3 0.5 2.6 7.6 17.6 0.3 bd 0.9 4.0 0.2 0.8 5.3 60.5 111.0
4 0.4 2.6 8.5 17.9 0.2 bd 0.9 4.2 0.1 0.8 5.3 59.0 112.7 5 0.6 2.5 8.9 16.2 bd bd 0.8 3.9 0.1 2.5 5.1 59.3 108.1 Mean 0.5 2.6 8.2 17.6 0.2 bd 0.9 4.1 0.2 1.1 5.3 59.4 111.0
LMG 1 0.5 1.0 6.5 14.2 bd 0.3 0.6 1.7 0.1 0.3 1.4 73.4 106.5 713A-R 2 0.4 1.0 6.7 15.3 bd 0.3 0.7 1.8 0.2 0.3 1.6 71.7 104.8 X300 3 0.5 1.3 7.1 18.5 0.1 0.4 0.7 2.3 0.1 0.2 1.8 67.0 118.0
4 0.6 1.3 5.6 11.1 0.2 0.2 0.4 1.2 0.1 1.3 1.6 76.4 119.0 5 0.2 1.1 5.6 12.2 0.1 0.1 0.4 1.4 0.1 0.5 1.4 76.5 112.8 Mean 0.5 1.1 6.3 14.3 0.1 0.3 0.6 1.7 0.1 0.5 1.5 73.0 112.2
KTE 1 bd 1.1 3.2 17.7 0.3 bd bd 1.7 bd bd bd 75.9 87.0 2816A 2 bd 1.4 3.3 17.9 0.2 bd bd 1.7 bd bd bd 75.5 85.9 X100 3 bd 1.1 3.2 15.7 0.5 bd bd 1.3 bd bd bd 78.2 85.2
4 bd 0.9 3.1 15.1 0.4 bd bd 1.2 bd bd bd 79.2 81.9 5 bd 1.0 3.0 15.9 0.4 bd bd 1.4 bd bd bd bd 83.2 Mean bd 1.1 3.2 16.5 0.4 bd bd 1.5 bd bd bd 77.4 84.7
PNT 1 0.4 2.7 6.9 65.9 2.0 bd 9.6 6.9 0.5 bd 0.3 43.6 75.8 1745B 2 0.3 1.1 10.6 67.9 2.3 bd 7.2 4.2 0.7 bd 0.3 43.5 80.3 X100 3 0.3 1.8 6.1 64.6 2.6 bd 9.7 7.5 0.2 bd 50.6 81.6
4 0.3 2.1 6.1 61.1 3.2 bd 10.9 9.0 0.1 bd 0.2 57.8 74.0 5 0.3 1.8 6.5 61.6 3.0 bd 10.9 8.2 0.3 bd 0.2 54.8 77.3 mean 0.3 1.9 7.2 64.2 2.6 bd 9.7 7.2 0.4 bd 0.2 50.0 77.8
PSN 1 0.8 0.5 7.0 17.8 bd bd 0.7 0.9 bd bd 0.4 71.9 97.2 4240-2 2 0.7 0.6 6.5 18.4 bd bd 0.6 0.8 bd bd 0.6 71.8 96.6 X100 3 0.7 0.5 5.8 13.1 bd bd 0.7 0.6 bd bd 0.3 78.4 84.6
4 0.6 0.6 6.1 16.7 bd bd 0.6 0.7 bd bd 0.5 74.2 121.3 5 0.8 0.4 7.3 18.4 bd bd 1.0 1.0 bd bd 0.5 70.6 123.3 Mean 0.7 0.5 6.5 16.9 bd bd 0.7 0.8 bd bd 0.5 73.4 104.6

121
MTN 820
Composition (wt%)
Na2O MgO Al2O3 SiO2 K2O CaO TiO2 Cr2O3 MnO FeO Total
1 White glassy 0.3 2.9 6.4 62.4 1.2 16.9 0.3 0.2 1.0 8.5 97.5 2 White glassy 0.4 2.9 6.6 62.4 1.1 16.3 0.4 0.4 0.9 8.6 94.3 3 White glassy 0.3 2.7 6.4 63.0 1.4 16.7 0.4 0.3 0.9 7.9 95.9
4 Blue glassy 0.3 3.7 6.1 58.8 1.5 20.3 0.3 0.4 1.3 7.2 95.6
5 Blue glassy 0.5 3.7 6.1 57.8 1.5 21.0 0.3 0.5 1.3 7.4 91.3
6 Blue glassy 0.3 3.8 5.7 57.1 1.4 22.2 0.3 0.3 1.3 7.5 66.8
7 Quartz bd 0.3 1.6 93.8 0.4 2.4 bd bd bd 1.5 67.9
P Fe Ni Total
8 Prill 2.6 92.9 4.6 83.9
Composition (wt%)
Na2O MgO Al2O3 SiO2 K2O CaO TiO2 MnO FeO Total
1 Black glassy 0.5 1.1 8.7 73.3 2.2 6.0 0.7 0.7 6.9 93.9 2 Black glassy 0.5 1.7 9.3 66.6 1.4 9.6 0.6 1.2 8.8 91.6 3 Quartz bd bd 0.6 98.4 bd 0.2 bd bd 0.8 93.6
4 Quartz bd bd bd 99.2 bd 0.2 bd bd 0.6 80.2

122
Composition (wt%)
MgO Al2O3 SiO2 K2O CaO Cr2O3 MnO FeO Total
1 Chromite 11.7 15.5 0.5 bd 0.3 53.5 0.5 18.1 87.1 2 Chromite 8.2 13.8 2.5 bd 0.6 54.2 1.3 19.4 76.0 3 Glassy matrix 2.4 6.7 65.1 1.5 14.5 0.9 0.9 7.7 82.5
4 Glassy matrix 2.3 7.4 64.6 1.4 15.1 0.5 0.6 8.0 58.3
Composition (wt%)
P S Fe Ni Total
1 Prill 6.3 0.2 85.7 7.8 97.1 2 Prill 7.3 0.4 81.0 11.0 96.3

123
NUH 4628
Composition (wt%)
MgO Al2O3 SiO2 K2O CaO Cr2O3 MnO FeO Total
1 Wüstite 0.6 1.8 4.1 bd 1.2 0.4 2.3 89.7 99.0 2 Fayalite 8.3 0.9 30.0 0.2 3.0 bd 7.8 49.6 97.3 3 Chromite 4.9 19.1 1.1 bd 0.5 35.7 3.1 35.6 97.2 4 X400 bulk 3.8 7.0 17.4 0.6 3.1 2.6 4.7 60.7 92.8

124
Composition (wt%)
MgO Al2O3 SiO2 K2O CaO TiO2 V2O5 Cr2O3 MnO FeO Total
1 Wüstite 3.2 5.2 13.5 0.4 3.0 bd bd 1.5 4.7 68.5 90.0 2 Wüstite 3.6 5.5 15.3 0.6 3.0 bd bd 1.4 4.9 65.7 91.0 3 Chromite 4.0 17.3 bd bd bd bd 0.5 41.7 2.6 33.9 94.6
4 Chromite 5.2 16.7 2.5 bd 0.8 0.3 bd 36.5 3.4 34.5 93.2
5 X400 bulk 3.6 5.7 17.3 0.5 2.9 bd bd 2.4 4.7 62.8 89.3
Composition (wt%)
MgO Al2O3 SiO2 K2O CaO TiO2 V2O5 Cr2O3 MnO FeO Total
1 Chromite in 4.3 13.5 0.4 bd bd bd bd 31.1 2.6 48.0 95.7 2 Chromite out 2.3 7.4 1.1 bd 0.3 0.4 bd 0.4 2.6 85.5 92,.7
3 Recrystalised
chromite 2.2 7.1 1.8 bd 0.2 0.5 bd 0.4 2.4 85.5 92.9
4 Fayalite 4.5 4.1 30.7 1.0 5.5 bd bd bd 6.4 47.9 97.0
5 X400 bulk 4.2 5.8 19.2 0.6 3.2 bd bd 1.4 4.6 61.0 95.5

125
PDB 888A
Composition (wt%)
Na2O MgO Al2O3 SiO2 P2O5 SO3 K2O CaO TiO2 Cr2O3 MnO FeO Total
1 Chromite bd 13.0 22.7 bd bd bd bd bd bd 44.2 0.4 19.7 113.6 2 Chromite bd 2.6 21.0 bd bd bd bd bd bd 35.7 0.7 40.0 111.6 3 Wüstite bd bd 1.0 bd bd bd bd bd 0.3 0.5 0.5 97.7 113.8 4 Fayalite bd 2.1 1.3 31.3 bd bd 0.9 16.3 bd bd 1.1 47.0 110.6 5 Glassy matrix 1.2 bd 15.5 33.4 0.4 1.9 5.8 11.9 bd bd 0.3 29.6 108.5
O Fe Ni 6 Prill 2.1 97.6 0.3 114.6
Composition (wt%)
MgO Al2O3 SiO2 CaO V2O5 Cr2O3 MnO FeO Total
1 Hercynite 2.4 49.5 1.4 0.7 bd 1.6 0.5 43.8 105.0 2 Chromite 1.8 26.4 bd bd bd 31.0 0.9 39.8 108.0 3 Chromite 13.0 24.9 bd bd 0.5 41.3 bd 20.4 105.6

126
Composition (wt%)
MgO Al2O3 SiO2 CaO TiO2 V2O5 Cr2O3 MnO FeO Total
1 Chromite 1.0 5.2 2.1 0.2 0.3 0.2 37.4 0.5 53.0 96.1 2 Wüstite 0.5 0.4 0.3 bd 0.3 bd 0.6 0.4 97.5 98.5 3 Wüstite 0.5 1.0 0.5 bd 0.2 bd 0.6 0.4 96.7 102.6
RHP 512A
Composition (wt%)
Na2O MgO Al2O3 SiO2 SO3 K2O CaO TiO2 Cr2O3 MnO FeO Total
1 Fayalite bd 2.8 0.8 29.5 bd 0.2 1.0 bd bd 0.6 65.1 113.3 2 Glassy matrix 2.0 bd 18.4 37.2 1.7 6.7 9.6 bd bd bd 24.4 99.9 3 Wüstite bd bd 0.8 0.7 bd bd bd bd 1.2 bd 97.3 71.7

127
Composition (wt%)
Na2O MgO Al2O3 SiO2 SO3 K2O CaO TiO2 MnO FeO Total
1 Wüstite bd bd 1.0 0.6 bd bd bd 0.2 bd 98.2 143.6
2 Wüstite bd bd 0.8 0.3 bd bd bd 0.2 bd 98.7 110.5
3 Fayalite 0.2 2.0 1.0 29.8 bd 0.3 1.2 bd 0.7 64.8 131.5
4 Fayalite 0.4 1.8 4.5 30.8 bd 0.9 2.1 bd 0.6 58.8 137.6
5 Glassy matrix 1.7 bd 14.6 34.2 1.7 4.2 8.4 bd 0.3 35.0 143.6
6 Glassy matrix 1.6 bd 15.9 34.7 1.9 4.6 8.4 bd 0.4 32.6 110.5
Composition (wt%)
Na2O MgO Al2O3 SiO2 SO3 K2O CaO TiO2 Cr2O3 MnO FeO Total
1 Glassy matrix 1.7 bd 15.5 35.7 1.6 4.9 8.0 bd bd bd 32.5 105.5
2 Fayalite bd 2.7 bd 30.3 bd bd 0.9 bd bd 0.7 65.3 89.3
3 Wüstite bd bd 1.2 0.8 bd bd bd bd 1.5 bd 96.5 106.4

128
RHP 526
Composition (wt%)
MgO Al2O3 SiO2 K2O CaO TiO2 MnO FeO Total
1 Quartz bd 0.4 98.6 0.3 0.1 bd bd 0.5 111.5 2 Quartz bd 1.1 96.3 0.7 0.9 bd bd 0.9 134.4 3 Glassy matrix 2.3 6.7 71.0 3.5 11.2 0.5 0.9 3.9 144.5 4 Glassy matrix 1.7 6.8 73.5 3.6 9.6 0.5 0.7 3.5 132.1
Q1
Composition (wt%)
Cr Fe Ni Total
1 Prill bd 99.3 0.7 90.3
2 Prill bd 99.3 0.7 89.3
3 Prill bd 99.4 0.6 89.5
4 Prill bd 100 bd 89.8
5 Prill 0.3 99.7 bd 87.7
6 Prill 0.4 99.6 bd 87.0

129
Composition (wt%)
Na2O MgO Al2O3 SiO2 SO3 K2O CaO TiO2 Cr2O3 MnO FeO Total
1 Wüstite bd bd bd bd bd bd bd 0.3 0.7 0.5 98.5 96.3 2 Wüstite bd bd bd bd bd bd bd bd 0.8 0.4 98.7 96.3 3 Fayalite bd 3.8 2.2 30.7 bd 0.7 7.7 bd bd 1.5 53.3 98.9 4 Fayalite bd 4.8 4.8 31.4 bd 1.6 5.0 bd bd 1.6 50.9 100.3 5 Glassy matrix 0.5 bd 18.6 38.4 0.9 8.9 9.5 bd bd bd 23.0 98.3 6 Glassy matrix 0.6 bd 23.4 43.3 bd 8.7 4.4 bd bd 0.4 19.2 92.0
Composition (wt%)
Na2O MgO Al2O3 SiO2 SO3 K2O CaO Cr2O3 MnO FeO Total
1 Wüstite bd 0.5 bd 0.5 bd bd bd 0.7 0.5 97.9 97.0 2 Wüstite bd 0.5 2.4 0.6 bd bd bd 1.1 0.6 94.9 97.3 3 Fayalite bd 5.6 2.1 30.8 bd 0.5 5.3 bd 1.8 53.9 97.7 4 Fayalite bd 5.4 2.7 31.0 bd 1.1 4.8 bd 1.7 53.3 98.7 5 Glassy matrix 0.7 bd 18.5 37.2 1.1 8.6 10.2 bd 0.4 23.3 98.3 6 Glassy matrix 1.9 bd 18.7 36.7 bd 12.6 8.1 bd 0.5 21.5 98.3
Cr Fe Ni Total 7 Prill 0.2 99.0 0.8 97.7 8 Prill 0.2 99.0 0.8 98.0

130
Q2
Composition (wt%)
MgO Al2O3 SiO2 K2O CaO Cr2O3 MnO FeO Total
1 Chromite 17.2 44.6 bd bd bd 23.4 bd 14.8 96.7 2 Chromite 17.0 45.1 bd bd bd 24.0 bd 13.9 94.2 3 Chromite 3.8 19.9 5.2 0.2 0.8 23.6 1.4 45.1 97.1 4 Chromite 5.0 26.2 3.4 bd bd 20.3 1.1 44.0 93.4
Composition (wt%)
Na2O MgO Al2O3 SiO2 SO3 K2O CaO Cr2O3 MnO FeO Total
1 Wüstite bd 1.7 1.3 bd bd bd bd 1.4 1.6 94.0 99.3 2 Wüstite bd 2.0 1.2 bd bd bd bd 1.6 1.6 93.7 99.2 3 Glassy matrix 0.9 2.2 11.8 33.3 0.8 2.8 8.3 bd 2.4 37.5 97.0 4 Glassy matrix 1.0 2.3 11.5 32.2 0.9 2.4 7.8 bd 2.5 39.4 96.7
Fe Ni Total 5 Prill 100 bd 98.8 6 Prill 99.4 0.6 98.5

131
Composition (wt%)
Na2O MgO Al2O3 SiO2 K2O CaO Cr2O3 MnO FeO Total
1 Wüstite bd 1.8 0.6 bd bd bd 1.1 1.6 94.8 97.8 2 Wüstite bd 1.6 3.3 7.4 1.1 1.7 0.9 1.5 82.5 95.7 3 Chromite bd 3.8 20.4 0.5 bd bd 35.5 1.1 38.6 99.2 4 Chromite bd 4.1 21.5 bd bd bd 34.5 0.8 39.1 99.1
Cr Fe Ni Total 5 Prill bd 95.2 4.8 99.4 6 Prill bd 100 bd 99.1 7 Prill 0.5 96.7 2.8 98.8
LMG 707A-1
Composition (wt%)
Na2O MgO Al2O3 SiO2 K2O CaO TiO2 V2O5 Cr2O3 MnO FeO Total
1 Chromite bd 11.9 20.8 bd bd bd bd bd 46.4 bd 20.9 101.5 2 Chromite in bd 5.2 34.7 0.5 bd bd bd 0.3 24.0 0.7 34.6 99.1 3 Chromite out bd 4.6 31.7 14.7 0.3 4.2 0.4 0.2 1.1 1.1 41.6 95.0 4 Wüstite bd 0.8 5.8 13.2 0.4 4.2 0.7 bd 0.3 0.6 73.9 101.9 5 Fayalite bd 8.0 1.8 29.5 bd 2.7 bd bd 0.6 1.6 55.8 103.1 6 Glassy matrix 0.8 0.6 16.0 31.8 1.2 13.5 0.6 bd bd 0.7 34.7 98.8

132
Composition (wt%)
Fe Ni Total 1 Prill 98.8 1.2 93.3 2 Prill 95.7 4.3 89.4
LMG 707A-2
Composition (wt%)
Na2O MgO Al2O3 SiO2 K2O CaO Cr2O3 MnO FeO Total
1 Rounded Wüstite area 0.5 2.5 5.8 19.7 0.6 4.8 0.6 1.6 63.8 90.3 2 Rounded Wüstite area 0.2 2.1 5.9 22.0 0.7 4.9 1.1 1.6 61.6 80.2 3 Dendritic Wüstite area 0.4 2.2 6.5 18.7 0.6 4.6 0.8 1.7 64.6 105.0 4 Dendritic Wüstite area 0.6 2.2 6.5 18.6 0.6 4.7 1.1 1.6 64.1 95.4

133
Composition (wt%)
Na2O MgO Al2O3 SiO2 K2O CaO V2O5 Cr2O3 MnO FeO Total
1 Chromite in bd 4.1 24.3 0.4 bd bd 0.2 35.5 1.7 33.8 119.1 2 Chromite out bd 4.2 23.5 0.5 bd 0.2 0.3 32.7 1.8 36.8 119.3 3 Wüstite bd 1.5 1.4 2.2 bd 0.7 bd 2.1 1.1 91.0 116.1 4 Glassy matrix 0.7 3.1 9.6 35.0 1.4 10.4 bd bd 2.0 37.9 116.6
Fe Ni Total 5 Prill 96.1 3.9 127.6 6 Prill 96.7 3.3 113.2
Composition (wt%)
Na2O MgO Al2O3 SiO2 P2O5 K2O CaO V2O5 Cr2O3 MnO FeO Total
1 Chromite in bd 3.8 25.1 0.4 bd bd bd 0.4 29.7 1.5 39.1 86.8 2 Chromite out bd 3.5 19.2 1.5 bd bd 0.5 0.4 30.8 1.1 43.1 87.2 3 Wüstite bd 1.6 1.9 4.4 bd bd 1.1 bd 0.3 1.0 89.7 85.1 4 Glassy matrix 0.7 3.0 8.1 34.0 0.4 1.6 8.8 bd bd 2.3 41.0 82.2

134
LMG 707A-3
Composition (wt%)
Na2O MgO Al2O3 SiO2 K2O CaO TiO2 Cr2O3 MnO FeO Total
1 Chromite in bd 4.8 28.4 0.5 bd 0.3 bd 28.3 0.5 37.2 106.8 2 Chromite out Bd 4.0 21.0 16.9 0.4 4.6 0.4 2.1 0.6 50.0 113.5
Fe Ni Total 3 Prill 96.4 3.6 105.5
Composition (wt%)
Na2O MgO Al2O3 SiO2 K2O CaO TiO2 MnO FeO Total
1 Wüstite bd 2.6 4.8 19.8 0.3 4.7 0.4 0.9 66.6 118.2 2 Fayalite bd 5.8 2.9 29.7 bd 4.2 bd 1.3 56.1 113.9 3 Glassy matrix 0.9 1.2 9.8 31.3 0.8 12.7 0.4 0.8 41.9 112.8

135
LMG 713A-L
Composition (wt%)
Na2O MgO Al2O3 SiO2 SO3 K2O CaO Cr2O3 MnO FeO Total
1 Chromite bd 4.9 23.9 bd bd bd bd 34.7 2.3 34.2 83.3 2 Wüstite bd 0.8 0.2 1.0 bd bd 0.2 0.4 3.7 93.7 89.8 3 Wüstite bd 0.5 0.7 0.3 bd bd 0.2 0.3 3.5 94.5 76.4 4 Fayalite 0.3 4.0 7.3 29.0 bd 1.3 5.2 bd 7.4 45.6 81.4 5 Fayalite 1.5 3.9 7.0 29.3 bd 0.9 5.3 bd 7.6 44.6 91.2 6 Glassy matrix 0.8 0.5 22.6 32.5 0.6 3.4 14.6 bd 2.7 22.3 80.8

136
Composition (wt%)
Na2O MgO Al2O3 SiO2 K2O CaO TiO2 Cr2O3 MnO FeO Total
1 Fayalite 0.4 3.6 6.9 27.8 1.0 5.0 bd bd 7.1 48.2 99.2 2 Glassy matrix 0.6 0.5 19.2 30.4 2.9 11.6 bd bd 3.7 31.1 102.4 3 Chromite bd 8.9 15.0 1.0 bd 0.3 0.3 50.5 0.8 23.2 100.9
Cr Fe Ni Total 4 Prill 0.3 97.6 2.1 98.0 5 Prill bd 97.8 2.2 98.4
Composition (wt%)
Si Mn Fe Ni Total
1 Prill bd 0.3 99.1 0.6 97.1 2 Prill 1.5 bd 97.7 0.8 86.0

137
Composition (wt%)
Cr Fe Ni Total
1 Prill 0.2 97.4 2.4 99.0
2 Prill 0.3 98.0 1.8 97.5
Na2O MgO Al2O3 SiO2 Cr2O3 MnO FeO
4 Oxidised prill 0.9 0.5 0.6 0.5 2.0 95.5 95.5
5 Oxidised prill 0.7 0.4 0.3 1.0 2.4 95.3 96.6
LMG 713A-R
Composition (wt%)
MgO Al2O3 SiO2 K2O CaO Cr2O3 MnO FeO Total
1 Hercynite 2.9 49.3 bd bd bd 2.9 0.8 44.2 99.2 2 Wüstite 1.0 1.2 bd bd bd 1.3 1.3 95.3 92.4 3 Fayalite 1.9 5.4 27.6 0.6 2.1 bd 2.4 60.0 104.0 4 Hercynite 2.9 49.6 bd bd bd 2.5 1.0 44.1 112.8
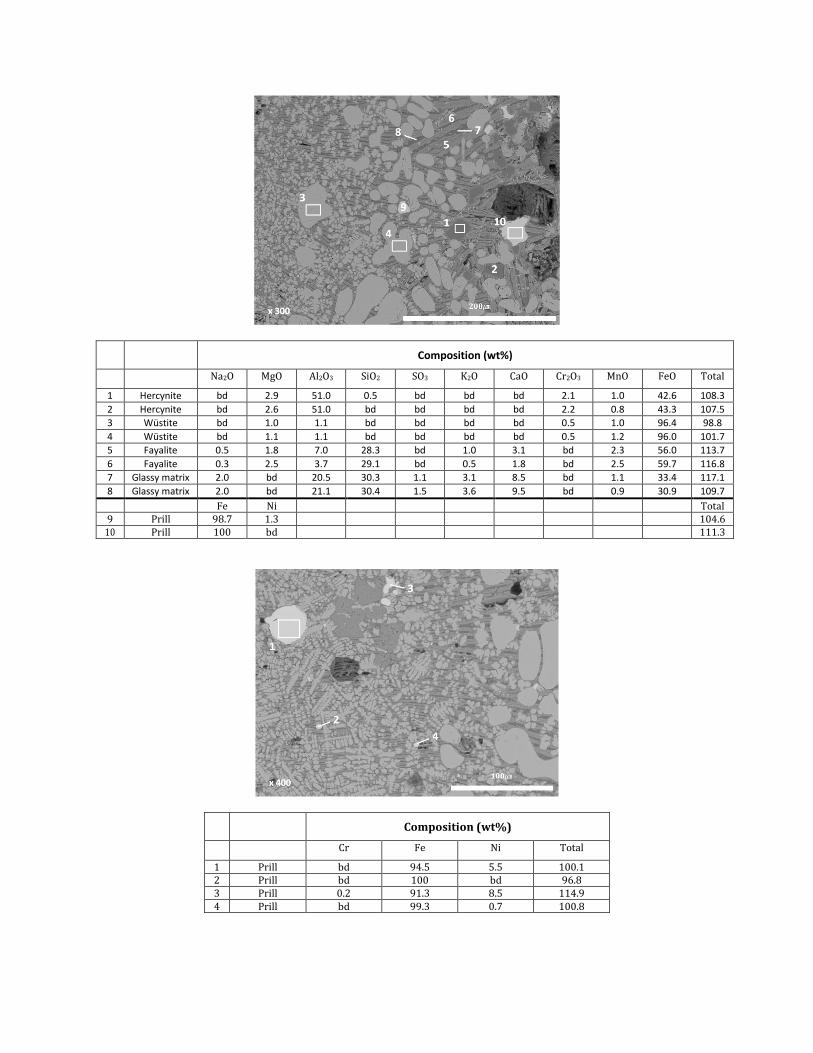
138
Composition (wt%)
Na2O MgO Al2O3 SiO2 SO3 K2O CaO Cr2O3 MnO FeO Total
1 Hercynite bd 2.9 51.0 0.5 bd bd bd 2.1 1.0 42.6 108.3
2 Hercynite bd 2.6 51.0 bd bd bd bd 2.2 0.8 43.3 107.5
3 Wüstite bd 1.0 1.1 bd bd bd bd 0.5 1.0 96.4 98.8
4 Wüstite bd 1.1 1.1 bd bd bd bd 0.5 1.2 96.0 101.7
5 Fayalite 0.5 1.8 7.0 28.3 bd 1.0 3.1 bd 2.3 56.0 113.7
6 Fayalite 0.3 2.5 3.7 29.1 bd 0.5 1.8 bd 2.5 59.7 116.8
7 Glassy matrix 2.0 bd 20.5 30.3 1.1 3.1 8.5 bd 1.1 33.4 117.1
8 Glassy matrix 2.0 bd 21.1 30.4 1.5 3.6 9.5 bd 0.9 30.9 109.7
Fe Ni Total 9 Prill 98.7 1.3 104.6
10 Prill 100 bd 111.3
Composition (wt%)
Cr Fe Ni Total
1 Prill bd 94.5 5.5 100.1 2 Prill bd 100 bd 96.8 3 Prill 0.2 91.3 8.5 114.9 4 Prill bd 99.3 0.7 100.8

139
Composition (wt%)
Na2O MgO Al2O3 SiO2 SO3 K2O CaO TiO2 Cr2O3 MnO FeO Total
1 Wüstite bd 1.1 1.1 bd bd bd bd bd 0.4 1.1 96.3 107.5 2 Wüstite bd 0.7 1.3 0.6 bd bd bd bd bd 1.1 96.3 105.0 3 Fayalite bd 2.5 3.6 28.6 bd 0.5 1.6 bd bd 2.8 60.4 109.8 4 Fayalite bd 2.7 3.9 28.2 bd 0.5 1.7 bd bd 2.7 60.3 109.4 5 Glassy matrix 1.8 bd 19.3 29.0 1.4 2.4 7.2 0.2 bd 1.2 37.5 113.0 6 Glassy matrix 1.7 bd 19.4 30.7 1.4 3.3 9.0 0.3 bd 0.9 33.3 104.6
KTE 2816A
Composition (wt%)
Na2O MgO Al2O3 SiO2 P2O5 SO3 CaO FeO Total
1 Wüstite bd 0.7 1.1 6.2 bd bd 0.6 91.4 94.4 2 Wüstite bd 0.6 1.1 5.3 bd bd 0.6 92.4 93.4 3 Fayalite bd 2.0 2.4 24.4 bd bd 2.5 68.6 89.5 4 Fayalite bd 2.4 2.5 28.1 bd bd 2.6 64.5 91.6 5 Glassy matrix bd bd 16.4 13.9 1.5 0.6 1.0 66.8 71.9 6 Glassy matrix bd bd 17.6 13.3 1.1 0.7 0.7 66.6 74.8
Fe Ni Cu As Total 7 Prill 50.6 43.2 1.9 4.4 97.3 8 Prill 51.5 43.2 1.5 3.8 96.9
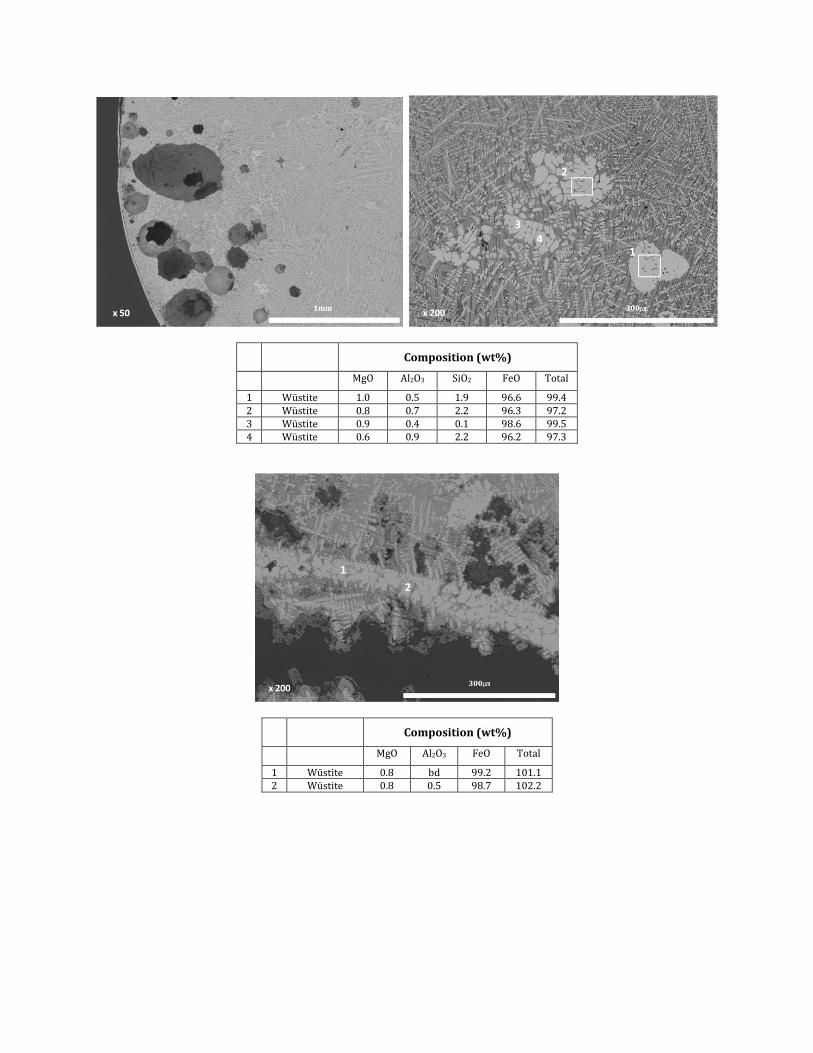
140
Composition (wt%)
MgO Al2O3 SiO2 FeO Total
1 Wüstite 1.0 0.5 1.9 96.6 99.4 2 Wüstite 0.8 0.7 2.2 96.3 97.2 3 Wüstite 0.9 0.4 0.1 98.6 99.5 4 Wüstite 0.6 0.9 2.2 96.2 97.3
Composition (wt%)
MgO Al2O3 FeO Total
1 Wüstite 0.8 bd 99.2 101.1 2 Wüstite 0.8 0.5 98.7 102.2

141
PNT 1745B
Composition (wt%)
MgO Al2O3 SiO2 P2O5 K2O CaO FeO Total
1 Glassy matrix 3.1 1.2 65.1 3.7 10.3 13.1 3.4 93.8 2 Glassy matrix 2.7 1.5 65.5 2.8 11.7 12.0 3.7 95.9 3 Glassy matrix 2.7 2.0 65.4 3.3 12.7 12.2 1.6 96.3
Composition (wt%)
MgO Al2O3 SiO2 P2O5 K2O CaO TiO2 FeO ZrO2 Total
1 Zirconium silicate bd bd 30.7 bd bd bd bd 0.5 68.7 93.8 2 Zirconium silicate bd bd 30.6 bd bd bd bd 0.5 68.9 91.8 3 Quartz bd bd 99.4 bd bd bd bd 0.6 bd 95.4
4 Quartz bd bd 99.6 bd bd bd bd 0.4 bd 95.1
5 Glassy matrix 0.7 35.0 48.4 0.9 3.1 0.4 1.8 9.8 bd 86.5
6 Glassy matrix 0.6 25.4 55.1 1.3 3.8 0.2 1.7 11.8 bd 73.9

142
PSN 4240-2
Composition (wt%)
Na2O MgO Al2O3 SiO2 P2O5 SO3 K2O CaO TiO2 MnO FeO Total
1 Wüstite bd bd 0.7 0.5 bd bd bd bd 0.3 bd 98.4 99.2 2 Wüstite bd bd 0.9 0.5 bd bd bd bd 0.4 bd 98.3 98.0 3 Fayalite bd 1.5 0.4 28.4 bd bd bd 0.3 bd 0.7 68.7 100.6 4 Fayalite bd 1.7 0.5 28.8 bd bd bd 0.3 bd 0.8 67.9 103.0 5 Glassy matrix 3.8 bd 19.5 41.5 0.6 bd 8.4 7.8 bd bd 18.4 99.7 6 Glassy matrix 3.5 bd 18.6 3.9.4 0.9 0.5 7.8 8.6 0.5 bd 20.1 102.4
Fe Total 7 Prill 100 102.9 8 Prill 100 102.5
Composition (wt%)
Na2O MgO Al2O3 SiO2 SO3 K2O CaO TiO2 MnO FeO Total
1 Wüstite bd bd 1.1 0.8 bd bd bd 0.6 bd 97.5 96.9 2 Fayalite bd 1.1 0.5 29.0 bd bd 0.4 bd 0.7 68.3 97.9 3 Glassy matrix 3.5 bd 18.0 38.8 0.5 6.9 6.6 bd bd 25.8 94.9
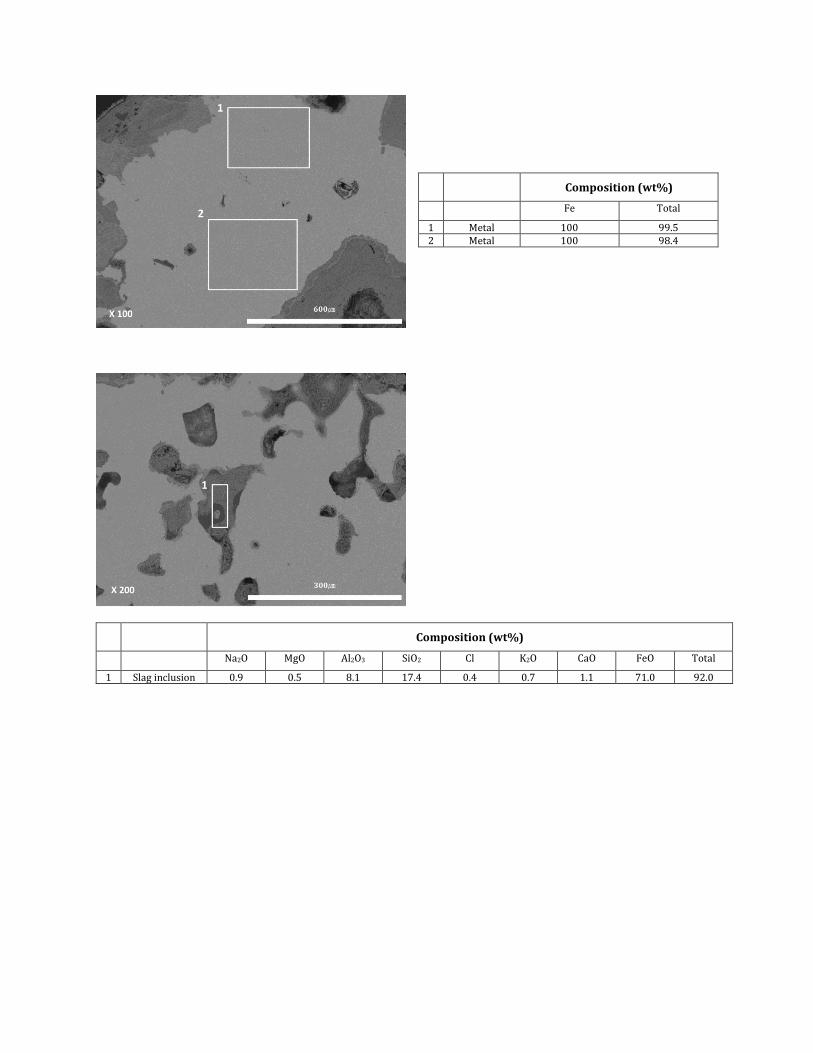
143
Composition (wt%)
Na2O MgO Al2O3 SiO2 Cl K2O CaO FeO Total
1 Slag inclusion 0.9 0.5 8.1 17.4 0.4 0.7 1.1 71.0 92.0
Composition (wt%)
Fe Total
1 Metal 100 99.5 2 Metal 100 98.4

144
PSN 4240-2 Metal area after etching

145
Note: Bulk chemical composition data analysed by SEM-EDS for iron artefacts from Luwu sites, normalized to
100% with original analytical totals given. All values are the average of five analyses of each sample and given
in weight per cent to estimate how much the artefacts were corroded. Data was re-normalised without oxygen
and present Fe and Ni contents to estimate the original nickel content in the artefacts roughly. Those figures
are given in extra coloumns. x100 or x300 is a magnification of bulk analyses (bd= below detection limit).
Composition (wt%)
O Mg Al Si P S Cl K Ca Cr Mn Fe Ni Total
PDB 1 35.5 bd 0.5 0.6 bd bd bd bd bd 0.3 bd 62.5 0.6 88.2 643A 2 35.4 bd 0.3 0.7 bd bd bd bd bd 0.1 bd 63.2 0.3 87.6 X300 3 35.2 bd 0.3 0.7 bd bd bd bd bd 0.5 bd 62.9 0.4 86.5
4 35.6 bd 0.4 0.7 bd bd bd bd bd 0.4 bd 62.5 0.4 83.9 5 35.5 bd 0.5 0.7 bd bd bd bd bd 0.3 bd 62.7 0.4 85.4 mean 35.4 bd 0.4 0.7 bd bd bd bd bd 0.3 bd 62.8 0.4 86.3
RHP 1 34.3 bd bd 1.9 0.5 bd bd bd bd bd bd 63.3 bd 95.3 159 2 30.5 bd bd 0.2 bd bd bd bd bd bd bd 69.3 bd 96.0
X100 3 32.8 bd bd 0.2 bd bd bd bd bd bd bd 67.0 bd 102.6 4 32.1 bd bd 0.4 bd bd bd bd bd bd bd 67.5 bd 95.9 5 33.4 bd bd 0.2 0.1 bd bd bd bd bd bd 66.3 bd 96.2 mean 32.6 bd bd 0.6 0.1 bd bd bd bd bd bd 66.7 bd 97.2
RHP 1 38.4 0.5 0.6 4.9 2.6 bd bd bd 0.2 0.3 bd 52.1 0.5 117.4
164 2 37.0 0.3 0.1 2.5 1.2 bd bd bd 0.1 bd bd 58.5 0.4 101.7
X100 3 36.6 0.3 0.5 3.0 1.5 bd bd bd 0.2 0.2 bd 57.5 0.3 106.5
4 36.5 0.5 0.1 3.5 0.6 bd bd bd bd 0.1 bd 58.4 0.3 109.4
5 35.2 0.1 0.1 1.6 0.8 bd bd bd 0.1 0.1 bd 61.3 0.8 110.7
mean 36.7 0.3 0.3 3.1 1.3 bd bd bd 0.1 0.1 bd 57.5 0.5 109.2
RHP 1 23.8 0.1 bd 1.3 bd bd bd bd 0.1 bd bd 74.5 0.2 79.0 184A 2 23.2 0.1 bd 1.0 bd bd bd bd 0.2 bd bd 75.2 0.3 75.7 X100 3 23.9 0.3 bd 1.3 bd bd bd bd 0.2 bd bd 73.7 0.6 72.9
4 22.6 0.5 bd 1.0 bd bd bd bd 0.1 bd bd 75.6 0.3 74.5 5 22.8 0.3 bd 1.1 bd bd bd bd 0.2 bd bd 75.3 0.2 73.3 mean 23.3 0.3 bd 1.1 bd bd bd bd 0.2 bd bd 74.9 0.3 75.1
KTE 1 38.0 0.2 4.5 5.0 0.5 bd bd 0.3 bd 0.9 bd 50.4 0.3 90.4 2545 2 38.1 0.2 5.0 4.3 0.6 bd bd 0.4 bd 0.9 bd 50.3 0.2 89.7 X100 3 38.6 0.3 4.6 5.3 0.4 bd bd 0.4 bd 1.4 bd 48.7 0.3 91.7
4 38.3 0.3 4.6 4.6 0.5 bd bd 0.4 bd 1.5 bd 49.7 0.3 90.3 5 38.7 0.2 4.4 4.4 0.4 bd bd 0.2 bd 1.5 bd 49.6 0.4 90.0 mean 38.3 0.2 4.6 4.7 0.5 bd bd 0.3 bd 1.3 bd 49.7 0.3 90.4
SBL 1 33.6 bd bd 0.3 bd bd bd bd bd bd bd 66.2 bd 91.8 5015-L 2 33.6 bd bd 0.6 bd bd bd bd bd bd bd 65.8 bd 92.0 X100 3 31.3 bd bd 0.1 bd bd bd bd bd bd bd 68.6 bd 93.0
4 31.3 bd bd 0.3 bd bd bd bd bd bd bd 68.4 bd 91.4 5 34.7 bd bd 0.2 bd bd bd bd bd bd bd 65.0 bd 91.7 mean 32.9 bd bd 0.3 bd bd bd bd bd bd bd 66.8 bd 92.0
SBL 1 31.7 bd bd 0.2 bd bd bd bd bd bd bd 68.1 bd 93.0 5015-R 2 31.9 bd bd 0.1 bd bd bd bd bd bd bd 68.0 bd 91.9 X100 3 28.9 bd bd 0.3 bd bd bd bd bd bd bd 70.9 bd 92.9
4 30.3 bd bd 0.3 bd bd bd bd bd bd bd 69.3 bd 94.8 5 33.4 bd bd 0.2 bd bd bd bd bd bd bd 66.4 bd 93.7 mean 31.2 bd bd 0.2 bd bd bd bd bd bd bd 68.5 bd 93.3
APPENDIX 2-4: EDS Analyses on iron artefact

146
Composition (wt%)
O Mg Al Si P S Cl K Ca Cr Mn Fe Ni Total
SBL 1 31.0 bd bd 0.2 0.3 0.3 bd bd bd bd bd 68.3 bd 88.6 1247A 2 29.1 bd bd bd bd 0.3 bd bd bd bd bd 70.6 bd 86.9 x100 3 28.6 bd bd 0.3 0.2 0.4 bd bd bd bd bd 70.5 bd 86.5
4 30.2 bd bd 0.3 0.3 0.3 bd bd bd bd bd 68.9 bd 83.2 5 30.1 bd bd 0.2 0.1 0.2 bd bd bd bd bd 69.4 bd 85.0 mean 29.8 bd bd 0.2 0.2 0.3 bd bd bd bd bd 69.5 bd 86.0
PNT 1 34.3 bd 0.3 0.9 bd bd bd bd bd bd bd 63.6 0.9 87.3 1664-L 2 35.5 bd 1.2 2.6 bd bd 0.3 bd bd bd bd 60.1 0.4 88.7 X100 3 33.4 bd 0.5 1.3 bd bd bd bd bd bd bd 63.8 1.0 87.3
4 35.1 bd 0.5 1.3 bd bd 0.2 bd bd bd bd 62.1 0.8 85.7 5 35.0 bd 0.5 1.7 bd bd bd bd bd bd bd 62.1 0.8 84.4 mean 34.7 bd 0.6 1.6 bd bd 0.1 bd bd bd bd 62.3 0.8 86.7
PNT 1 33.6 bd 0.2 0.7 bd bd bd bd bd bd bd 64.3 1.2 91.8 1664-R 2 33.0 bd 0.4 1.0 bd bd bd bd bd bd bd 64.8 0.7 89.7 X100 3 32.0 bd 0.5 0.4 bd bd bd bd bd 1.0 bd 65.0 1.1 91.8
4 32.0 bd 0.8 0.6 bd bd bd bd bd 1.1 bd 64.8 0.7 87.7 5 32.2 bd 0.4 0.5 bd bd bd bd bd 0.6 bd 65.3 1.1 92.3 mean 32.6 bd 0.5 0.6 bd bd bd bd bd 0.7 bd 64.8 1.0 90.7
PSN 1 32.6 bd bd bd bd bd bd bd bd bd 0.3 67.2 bd 92.9 4240-1 2 32.5 bd bd bd bd bd bd bd bd bd 0.2 67.3 bd 92.3 X100 3 33.5 bd bd bd bd bd bd bd bd bd 0.2 66.4 bd 91.4
4 33.4 bd bd bd bd bd bd bd bd bd 0.2 66.5 bd 92.1 5 32.3 bd bd bd bd bd bd bd bd bd 0.1 67.6 bd 92.6 mean 32.8 bd bd bd bd bd bd bd bd bd 0.2 67.0 bd 92.3

147
PDB 643A
RHP 159
Composition (wt%)
O Si Cl Fe Total
1 29.3 0.4 bd 70.3 98.5 2 36.2 0.4 bd 63.4 88.7 3 27.3 bd bd 72.7 87.4 4 33.5 bd 0.4 66.1 101.1 5 36.2 0.2 bd 63.6 104.3

148
RHP 164
Composition (wt%)
Fe Total
1 Steel 100 96.7 2 Steel 100 90.7
Composition (wt%)
O Si Cl Fe Total
1 29.3 0.4 bd 70.3 98.5 2 36.2 0.4 bd 63.4 88.7 3 27.3 bd bd 72.7 87.4 4 33.5 bd 0.4 66.1 101.1 5 36.2 0.2 bd 63.6 104.3

149
RHP 184
Composition (wt%)
O Mg Al Si Cl Ca Cr Fe Ni Total
1 34.4 bd 0.2 7.8 0.5 0.2 bd 45.2 2.1 90.4 2 33.5 bd bd 7.9 0.6 bd bd 45.4 1.9 89.3 3 27.5 bd bd 1.2 bd bd bd 64.1 bd 92.8
4 28.0 bd bd 1.4 bd bd bd 63.4 bd 92.7
5 21.3 0.3 bd bd bd bd 0.2 72.0 bd 93.9
6 20.9 0.4 bd bd bd bd 0.3 69.7 bd 91.2
7 Prill 2.1 bd bd bd bd bd bd 56.3 34.4 92.8
8 Prill 2.6 bd bd bd bd bd bd 54.1 34.5 91.1
Composition (wt%)
O Al Si P S Fe Ni Total
1 35.5 bd 1.2 0.6 0.2 61.8 0.7 113.0 2 37.7 0.2 2.2 0.5 bd 59.2 0.2 118.8 3 27.4 bd bd bd 0.4 72.3 bd 115.8 4 29.4 bd 0.2 bd 0.3 70.0 bd 116.7

150
KTE 2545
Composition (wt%)
O Na Mg Al Si P K Cr Fe Total
1 51.4 bd bd bd 47.5 bd bd bd 1.1 97.4 2 48.1 5.7 bd 21.7 22.2 bd 0.6 bd 1.8 95.8 3 51.0 bd bd bd 47.4 bd bd bd 1.6 95.9 4 43.1 bd 1.1 12.8 16.1 0.2 3.3 0.4 23.1 91.0 5 50.5 bd bd 15.6 30.5 bd 0.3 bd 3.0 94.4 6 42.4 bd 0.4 13.1 12.4 0.3 1.9 0.8 28.7 92.5 7 38.7 bd bd 5.2 1.6 0.6 bd 1.9 52.1 91.6 8 38.0 bd bd 4.2 1.8 0.5 bd 2.0 53.5 89.7 9 38.6 bd bd 4.3 2.4 0.3 bd 2.1 52.3 91.0
SBL 1247
Composition (wt%)
O Si P S Fe Total
1 33.1 0.2 0.4 0.4 65.8 92.4 2 33.8 0.2 0.4 0.3 65.3 92.5 3 30.3 0.3 0.4 0.2 68.8 89.5 4 29.6 0.2 0.2 0.3 69.7 91.3

151
Composition (wt%)
O Si P Fe Total
1 39.2 0.7 1.3 58.9 96.2 2 91.8 0.3 5.1 62.8 74.6
SBL 5015-L
Composition (wt%)
O Si S Fe Total
1 27.4 0.1 0.3 72.2 96.8 2 28.1 0.2 0.2 71.5 97.6 3 36.7 0.3 0.1 62.9 91.2 4 36.4 0.2 0.1 63.3 92.5

152
SBL 5015-R
Composition (wt%)
O Si Fe Total
1 27.7 0.2 72.2 101.9 2 27.6 0.1 72.3 102.9 3 37.1 0.2 62.6 96.2 4 36.1 0.2 63.8 97.3
PNT 1664-L
Composition (wt%)
O Al Si Cl Fe Ni Total
1 36.7 0.3 1.2 bd 61.4 0.5 85.7 2 36.9 0.6 1.4 0.2 60.9 bd 85.6 3 36.5 0.5 1.3 0.2 61.5 bd 85.9 4 31.3 bd 0.2 bd 67.1 1.4 87.1 5 31.7 bd 0.3 bd 66.5 1.4 87.8 6 31.5 bd 0.3 bd 66.7 1.5 87.3 7 35.6 bd 0.6 0.3 62.0 1.5 83.7 8 34.5 bd 0.3 bd 63.7 1.5 84.8 9 36.5 bd 0.5 0.2 61.3 1.5 82.5
10 28.1 bd 0.4 bd 69.9 1.6 85.6 11 28.6 bd 0.3 bd 69.4 1.6 85.7 12 28.8 bd 0.4 bd 69.1 1.9 85.8

153
PNT 1664-R
Composition (wt%)
O Al Si S Cl Fe Ni Total
1 28.1 bd 0.2 bd bd 69.4 2.3 108.4 2 28.9 bd 0.2 0.2 bd 68.9 1.8 108.3 3 30.0 bd 0.2 bd 0.2 67.8 1.8 107.9 4 35.9 0.3 0.9 bd bd 62.6 0.4 101.5 5 35.6 bd 0.8 bd bd 63.2 0.4 102.7 6 36.5 0.6 1.5 bd bd 61.0 0.4 98.8 7 26.9 bd 0.2 bd bd 70.9 2.0 107.1 8 30.8 bd 0.4 bd bd 66.8 2.0 105.9 9 31.1 bd 0.4 bd bd 66.5 2.0 104.3
10 36.3 0.2 1.1 bd bd 62.0 0.4 100.5 11 36.1 bd 0.9 bd bd 62.3 0.6 100.1 12 36.0 bd 1.0 bd bd 62.6 0.4 99.9
PSN 4240-1
Composition (wt%)
O S Mn Fe Cu Total
1 30.5 0.2 bd 68.8 0.4 99.16 2 36.3 0.3 0.3 63.0 bd 86.51 3 bd bd 0.2 99.8 bd 99.87 4 bd bd 0.4 99.6 bd 100.14 5 bd bd 0.4 99.6 bd 100.20

154
Ellingham diagram for oxides (Robino, 1996)
APPENDIX 3: Elingham Diagram
Top Related
Copyright © 2022 FDOKUMEN

