


Bahasa
Halaman
Hukum

Investigation of Liquidus Temperatures and Phase Equilibriaof Copper Smelting Slags in the FeO-Fe2O3-SiO2-CaO-MgO-Al2O3 System at PO2 10�8 atm
HECTOR M. HENAO, COLIN NEXHIP, DAVID P. GEORGE-KENNEDY,P.C. HAYES, and E. JAK
Copper concentrates and fluxes can contain variable levels of SiO2, CaO, and MgO in additionto main components Cu, Fe, and S. Metal recovery, slag tapping, and furnace wall integrity allare dependent on phase equilibria and other properties of the phases and are functions of slagcomposition and operational temperature. Optimal control of the slag chemistry in the coppersmelting, therefore, is essential for high recovery and productivity; this, in turn, requires detailedknowledge of the slag phase equilibria. The present work provides new phase equilibriumexperimental data in the FeO-Fe2O3-SiO2-CaO-MgO-Al2O3 system at oxygen partial pressureof 10�8 atm within the range of temperatures and compositions directly relevant to coppersmelting. For the range of conditions relevant to the Kennecott Utah Copper (South Magna,UT) smelting furnace, it was confirmed experimentally that increasing concentrations of MgOor CaO resulted in significant decreases of the tridymite liquidus temperature and in changes inthe position of the tridymite liquidus in the direction of higher silica concentration; in contrast,the spinel liquidus temperatures increase significantly with the increase of MgO or CaO. Olivineand clinopyroxene precipitates appeared at high MgO concentrations in the liquid slag. Theliquidus temperature in the spinel primary phase field was expressed as a linear function of 1/(wtpctFe/wt pctSiO2), wt pctCaO, wt pctMgO, and wt pctAl2O3. The positions of each of theliquidus points (wt pctFe)/(wt pctSiO2) at a fixed temperatures in the tridymite primary phasefield were expressed as linear functions of wt pctCaO, wt pctMgO, and wt pctAl2O3.
DOI: 10.1007/s11663-010-9369-1� The Minerals, Metals & Materials Society and ASM International 2010
I. INTRODUCTION
OPTIMAL control of the slag chemistry in coppersmelting is one of the important issues influencingefficient and stable operation of the process. Detailedknowledge of the slag phase equilibria, therefore, isessential to optimize the overall smelter performance.The effects of CaO, MgO, and Al2O3 impurities,introduced in the slag with the concentrates and fluxeson the tridymite (SiO2) and spinel primary phase fieldsof silica and spinel are of particular interest.
The average slag composition in the copper flashsmelting furnace (FSF) at Rio Tinto—Kennecott UtahCopper LLC (South Magna, UT) is given in Table I.The operational temperature is approximately 1588 K(1315 �C). The composition was recalculated with theelements as oxides and then normalized to 100 wt pct.
The direct measurement of oxygen partial pressure(PO2) with an oxygen probe in a slag under industrialprocess conditions indicated an average PO2 of10�8 atm at 1588 K (1315 �C). This oxygen partialpressure, therefore, was selected for the present exper-imental work. The system was simplified to six compo-nents (Fe-Si-O-Ca-Mg-Al), assuming that a small-concentration Cu oxide chemically dissolved in the slagat this low PO2 has a small effect on the liquidus.Table II indicates the range of target slag compositionsselected to investigate the effect of MgO on liquidus at agiven CaO (3.3 wt pct) and Al2O3 (3.3 wt pct) concen-trations in slag as well as the effect of CaO on liquidus ata given MgO (2.2 wt pct) and Al2O3 (3.3 wt pct) con-centrations in slag. The effect of MgO was investigatedat three levels of 2.2, 6.0, and 9.0 wt pct and the effect ofCaO was investigated at four levels of 0, 3.3, 4.5, and6.0 wt pct. In each case, the change in a concentrationof the minor component was offset by the change in sumof the ‘‘FeO’’ and SiO2 concentrations.Information in the literature related to the ‘‘FeO’’-
SiO2-CaO-MgO-Al2O3 multicomponent system at inter-mediate oxygen partial pressures and temperaturesrelevant to the copper smelting operation is limited.Henao et al.[1,2] reported experimental results for the‘‘FeO’’-SiO2-CaO-(MgO-Al2O3) system at 10�8 atm andat 1573 K (1300 �C) in the spinel primary phase field.Zhao et al.[3,4] studied the effect of Al2O3 and MgO on
HECTOR M. HENAO, Senior Research Fellow, is with thePyrometallurgy Research Centre (PYROSEARCH), School ofEngineering, The University of Queensland, Brisbane 4072, Australia.Contact e-mail: [email protected] COLIN NEXHIP, Man-ager - Technical Services (Smelter), and DAVID P. GEORGE-KENNEDY, Manager - Operations (Smelter) are with the RioTinto—Kennecott Copper LLC, Magna, UT 84044. P. C. HAYESand E. JAK, Professors, are with the Pyrometallurgy Research Centre(PYROSEARCH), School of Engineering, The University of Queens-land, Brisbane 4072, Australia.
Manuscript submitted December 2, 2009.Article published online April 14, 2010.
METALLURGICAL AND MATERIALS TRANSACTIONS B VOLUME 41B, AUGUST 2010—767
the liquidus temperatures of a fayalite slag at ironmetal saturation. Imlach et al.[5,6] reported the liquidussurfaces in the Al2O3-CaO-FeOX system at PO2 of10�8 atm. Muan et al.[7] reported the phase equilibriumand the liquidus temperatures in the system MgO-FeO-Fe2O3-SiO2 at various ratios of CO2/H2 fixed from 132to 24. Nikolic et al.[8,9] constructed the phase diagramsfor the system FeO-Fe2O3-SiO2-CaO at oxygen partialpressures and temperatures relevant to copper convert-ing. Wu et al.,[10,11] Eriksson et al.,[12] Degterov et al.,[13]
Jak et al.,[14,15] and Selleby et al.[16,17] reported predictedbinary and ternary phase diagrams related to the Fe-Si-Ca-O-Mg-Al multicomponent system. It seems, how-ever, that there are no systematic experimental studieson the combined effects of MgO, CaO, and Al2O3 in theFeO-Fe2O3-SiO2 system at the intermediate oxygenpartial pressures relevant to the copper smelting pro-cesses reported.
II. EXPERIMENTAL TECHNIQUEAND PROCEDURE
There are several difficulties in obtaining accuratechemical equilibrium data for complex slag systems atcontrolled laboratory conditions. Experimental proce-dures have been developed by the PyrometallurgyResearch Centre at the University of Queensland[18–20]
that have resolved several experimental difficulties andhave been applied successfully to several complexindustrial slags.
The technique for phase equilibrium measurements isbased on the high-temperature equilibration of thesynthetic slag sample in a controlled gas atmosphereand temperature followed by rapid quenching andanalysis of the composition of the phases present.
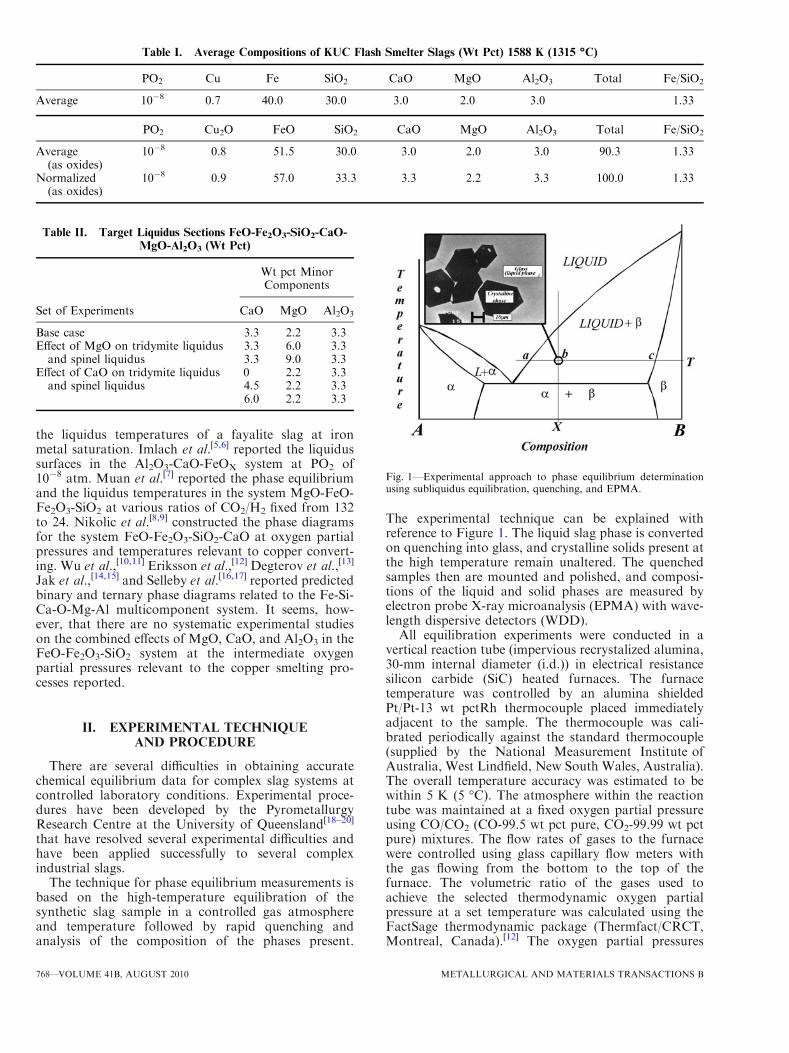
The experimental technique can be explained withreference to Figure 1. The liquid slag phase is convertedon quenching into glass, and crystalline solids present atthe high temperature remain unaltered. The quenchedsamples then are mounted and polished, and composi-tions of the liquid and solid phases are measured byelectron probe X-ray microanalysis (EPMA) with wave-length dispersive detectors (WDD).All equilibration experiments were conducted in a
vertical reaction tube (impervious recrystalized alumina,30-mm internal diameter (i.d.)) in electrical resistancesilicon carbide (SiC) heated furnaces. The furnacetemperature was controlled by an alumina shieldedPt/Pt-13 wt pctRh thermocouple placed immediatelyadjacent to the sample. The thermocouple was cali-brated periodically against the standard thermocouple(supplied by the National Measurement Institute ofAustralia, West Lindfield, New South Wales, Australia).The overall temperature accuracy was estimated to bewithin 5 K (5 �C). The atmosphere within the reactiontube was maintained at a fixed oxygen partial pressureusing CO/CO2 (CO-99.5 wt pct pure, CO2-99.99 wt pctpure) mixtures. The flow rates of gases to the furnacewere controlled using glass capillary flow meters withthe gas flowing from the bottom to the top of thefurnace. The volumetric ratio of the gases used toachieve the selected thermodynamic oxygen partialpressure at a set temperature was calculated using theFactSage thermodynamic package (Thermfact/CRCT,Montreal, Canada).[12] The oxygen partial pressures
Table II. Target Liquidus Sections FeO-Fe2O3-SiO2-CaO-
MgO-Al2O3 (Wt Pct)
Set of Experiments
Wt pct MinorComponents
CaO MgO Al2O3
Base case 3.3 2.2 3.3Effect of MgO on tridymite liquidusand spinel liquidus
3.3 6.0 3.33.3 9.0 3.3
Effect of CaO on tridymite liquidusand spinel liquidus
0 2.2 3.34.5 2.2 3.36.0 2.2 3.3
Fig. 1—Experimental approach to phase equilibrium determinationusing subliquidus equilibration, quenching, and EPMA.
Table I. Average Compositions of KUC Flash Smelter Slags (Wt Pct) 1588 K (1315 �C)
PO2 Cu Fe SiO2 CaO MgO Al2O3 Total Fe/SiO2
Average 10�8 0.7 40.0 30.0 3.0 2.0 3.0 1.33
PO2 Cu2O FeO SiO2 CaO MgO Al2O3 Total Fe/SiO2
Average(as oxides)
10�8 0.8 51.5 30.0 3.0 2.0 3.0 90.3 1.33
Normalized(as oxides)
10�8 0.9 57.0 33.3 3.3 2.2 3.3 100.0 1.33
768—VOLUME 41B, AUGUST 2010 METALLURGICAL AND MATERIALS TRANSACTIONS B
were checked periodically with a partially stabilizedzirconium oxygen probe (SIRO2�, DS-type oxygenprobe; Australian Oxygen Fabricators (AOF),Melbourne, Australia). It was confirmed that the resultsof the measurements in the present study are within theaccuracy of the DS-type oxygen probe (i.e., close to logPO2 of ± 0.1 units [PO2 in atm]).
The starting mixtures were made from CaO, SiO2,Fe2O3, MgO, and Al2O3 powders (99.9 wt pct purity).The powders for each sample were weighed and mixedwith an agate mortar and pestle and then pelletized. Thepellets (0.3 g) were placed inside open platinum cruci-bles. All crucibles were suspended by platinum wirewithin the reaction tube in the furnace.
Particular attention was paid to assure equilibrium.First, to approach the equilibrium from two differentdirections, metallic Fe powder was used to make thestarting mixture. Achievement of equilibria also wasensured by checking the homogeneity of phases usingEPMA. Equilibrium was confirmed by carrying out anexperiment for different equilibration times. One exper-iment was carried out at the standard equilibration timeof 12 hours, whereas another experiument was carriedout at a prolonged time. The result indicated that even12-hours holding time of slag is sufficient to achieveequilibrium between phases.
A holding time of 24 hours was used for experiments.Premelt at a higher temperature for a shorter time (5 to30 minutes) always was used before the temperature waslowered to the final equilibration temperature. Thisensured the homogenization of the liquid phase, theprecipitation of new crystals from the liquid phase, andavoids uncertainty of some solids remaining undis-solved. After the holding time, the base of the reactiontube was immersed in water and ice, and the lowerrubber stopper sealing the tube was removed. Then, thesample was allowed to fall directly into the iced water.The samples then were dried and mounted in an epoxyresin and polished for metallographic observation andmicroanalysis.
Measurement of the compositions of the variousphases within the sample was undertaken using a JEOLJXA 8200L (Japan Electron Optics Ltd., Tokyo, Japan)EPMA with WDD. An acceleration voltage of 15 kVand a probe current of 15 nA were used. The Duncumb–Philibert atomic number absorption X-R fluorescencecorrection model (ZAF) correction procedure suppliedwith the JEOL JXA 8200 L probe was applied. Thestandards (Charles M. Taylor, Stanford, CA) that wereused in the EPMA measurements were as follows:wollastonite (CaSiO3) for Si and Ca, hematite, (Fe2O3)for Fe, MgO for Mg, and Al2O3 for Al. The composi-tions were measured to an accuracy within 1 wt pct.
Iron oxide is present in both 2+and 3+states; only theFe cation concentration was measured with EPMA. Alliron was recalculated to the ferrous state 2+ (FeO) forpresentation purposes to ensure that the projected pointsare defined unambiguously. In addition, the experimentswere planned and conducted with the aim of representingthe information in the form of ternary phase diagrams.Thus, all compositions are projected onto the ‘‘FeO’’-SiO2-MgO or the ‘‘FeO’’-SiO2-CaO sections.
III. RESULTS OF PHASE EQUILIBRIAEXPERIMENTS
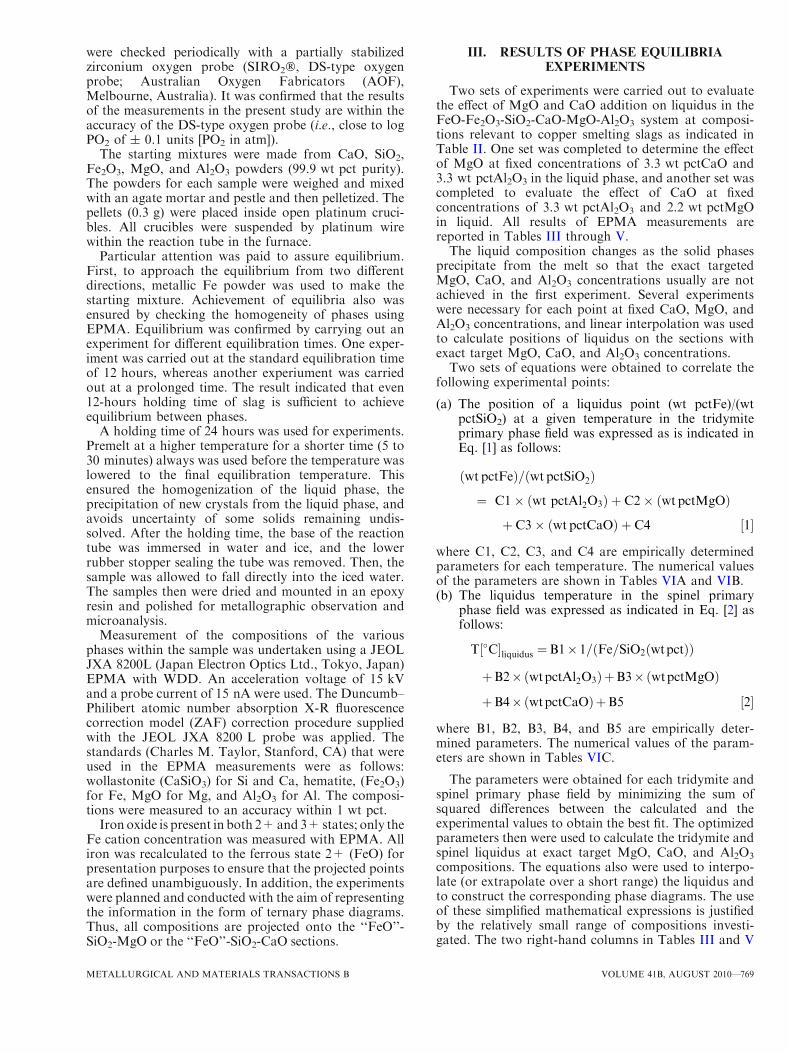
Two sets of experiments were carried out to evaluatethe effect of MgO and CaO addition on liquidus in theFeO-Fe2O3-SiO2-CaO-MgO-Al2O3 system at composi-tions relevant to copper smelting slags as indicated inTable II. One set was completed to determine the effectof MgO at fixed concentrations of 3.3 wt pctCaO and3.3 wt pctAl2O3 in the liquid phase, and another set wascompleted to evaluate the effect of CaO at fixedconcentrations of 3.3 wt pctAl2O3 and 2.2 wt pctMgOin liquid. All results of EPMA measurements arereported in Tables III through V.The liquid composition changes as the solid phases
precipitate from the melt so that the exact targetedMgO, CaO, and Al2O3 concentrations usually are notachieved in the first experiment. Several experimentswere necessary for each point at fixed CaO, MgO, andAl2O3 concentrations, and linear interpolation was usedto calculate positions of liquidus on the sections withexact target MgO, CaO, and Al2O3 concentrations.Two sets of equations were obtained to correlate the
following experimental points:
(a) The position of a liquidus point (wt pctFe)/(wtpctSiO2) at a given temperature in the tridymiteprimary phase field was expressed as is indicated inEq. [1] as follows:
wt pctFeð Þ= wt pctSiO2ð Þ
¼ C1� wt pctAl2O3ð Þ þ C2� wt pctMgOð Þ
þ C3� wt pctCaOð Þ þ C4 ½1�
where C1, C2, C3, and C4 are empirically determinedparameters for each temperature. The numerical valuesof the parameters are shown in Tables VIA and VIB.(b) The liquidus temperature in the spinel primary
phase field was expressed as indicated in Eq. [2] asfollows:
T �C½ �liquidus ¼B1� 1= Fe=SiO2 wtpctð Þð Þ
þB2� wtpctAl2O3ð ÞþB3� wtpctMgOð Þ
þB4� wtpctCaOð ÞþB5 ½2�
where B1, B2, B3, B4, and B5 are empirically deter-mined parameters. The numerical values of the param-eters are shown in Tables VIC.
The parameters were obtained for each tridymite andspinel primary phase field by minimizing the sum ofsquared differences between the calculated and theexperimental values to obtain the best fit. The optimizedparameters then were used to calculate the tridymite andspinel liquidus at exact target MgO, CaO, and Al2O3
compositions. The equations also were used to interpo-late (or extrapolate over a short range) the liquidus andto construct the corresponding phase diagrams. The useof these simplified mathematical expressions is justifiedby the relatively small range of compositions investi-gated. The two right-hand columns in Tables III and V
METALLURGICAL AND MATERIALS TRANSACTIONS B VOLUME 41B, AUGUST 2010—769
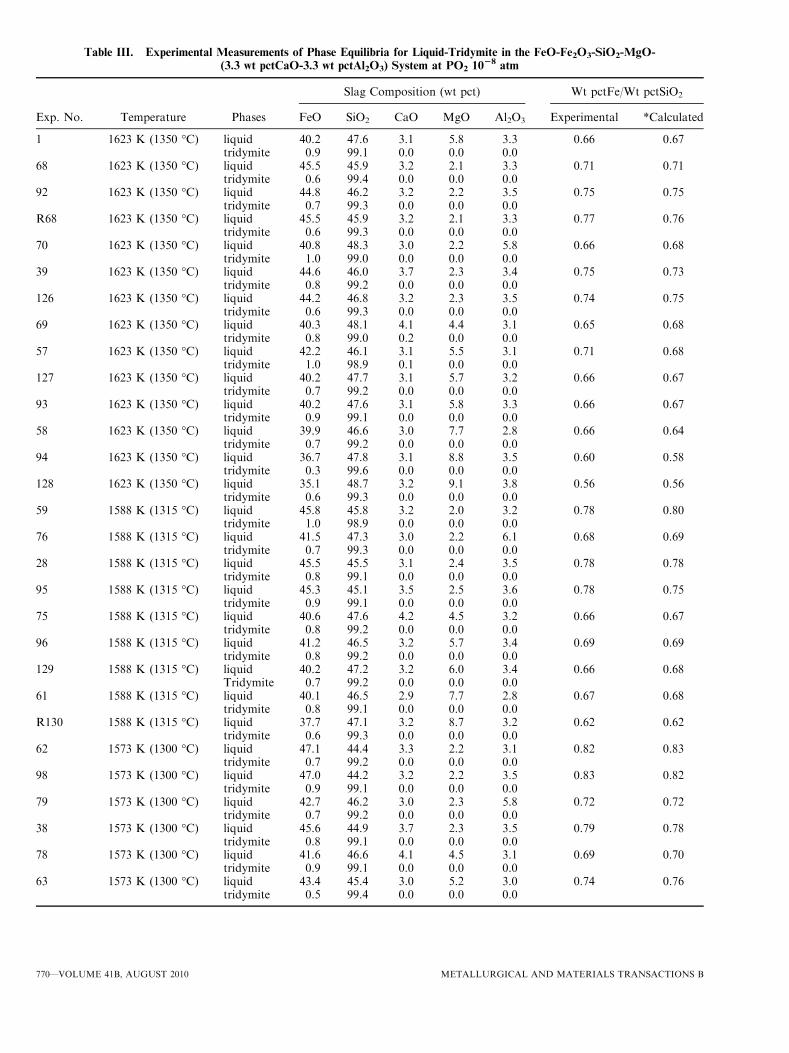
Table III. Experimental Measurements of Phase Equilibria for Liquid-Tridymite in the FeO-Fe2O3-SiO2-MgO-
(3.3 wt pctCaO-3.3 wt pctAl2O3) System at PO2 1028 atm
Exp. No. Temperature Phases
Slag Composition (wt pct) Wt pctFe/Wt pctSiO2
FeO SiO2 CaO MgO Al2O3 Experimental *Calculated
1 1623 K (1350 �C) liquid 40.2 47.6 3.1 5.8 3.3 0.66 0.67tridymite 0.9 99.1 0.0 0.0 0.0
68 1623 K (1350 �C) liquid 45.5 45.9 3.2 2.1 3.3 0.71 0.71tridymite 0.6 99.4 0.0 0.0 0.0
92 1623 K (1350 �C) liquid 44.8 46.2 3.2 2.2 3.5 0.75 0.75tridymite 0.7 99.3 0.0 0.0 0.0
R68 1623 K (1350 �C) liquid 45.5 45.9 3.2 2.1 3.3 0.77 0.76tridymite 0.6 99.3 0.0 0.0 0.0
70 1623 K (1350 �C) liquid 40.8 48.3 3.0 2.2 5.8 0.66 0.68tridymite 1.0 99.0 0.0 0.0 0.0
39 1623 K (1350 �C) liquid 44.6 46.0 3.7 2.3 3.4 0.75 0.73tridymite 0.8 99.2 0.0 0.0 0.0
126 1623 K (1350 �C) liquid 44.2 46.8 3.2 2.3 3.5 0.74 0.75tridymite 0.6 99.3 0.0 0.0 0.0
69 1623 K (1350 �C) liquid 40.3 48.1 4.1 4.4 3.1 0.65 0.68tridymite 0.8 99.0 0.2 0.0 0.0
57 1623 K (1350 �C) liquid 42.2 46.1 3.1 5.5 3.1 0.71 0.68tridymite 1.0 98.9 0.1 0.0 0.0
127 1623 K (1350 �C) liquid 40.2 47.7 3.1 5.7 3.2 0.66 0.67tridymite 0.7 99.2 0.0 0.0 0.0
93 1623 K (1350 �C) liquid 40.2 47.6 3.1 5.8 3.3 0.66 0.67tridymite 0.9 99.1 0.0 0.0 0.0
58 1623 K (1350 �C) liquid 39.9 46.6 3.0 7.7 2.8 0.66 0.64tridymite 0.7 99.2 0.0 0.0 0.0
94 1623 K (1350 �C) liquid 36.7 47.8 3.1 8.8 3.5 0.60 0.58tridymite 0.3 99.6 0.0 0.0 0.0
128 1623 K (1350 �C) liquid 35.1 48.7 3.2 9.1 3.8 0.56 0.56tridymite 0.6 99.3 0.0 0.0 0.0
59 1588 K (1315 �C) liquid 45.8 45.8 3.2 2.0 3.2 0.78 0.80tridymite 1.0 98.9 0.0 0.0 0.0
76 1588 K (1315 �C) liquid 41.5 47.3 3.0 2.2 6.1 0.68 0.69tridymite 0.7 99.3 0.0 0.0 0.0
28 1588 K (1315 �C) liquid 45.5 45.5 3.1 2.4 3.5 0.78 0.78tridymite 0.8 99.1 0.0 0.0 0.0
95 1588 K (1315 �C) liquid 45.3 45.1 3.5 2.5 3.6 0.78 0.75tridymite 0.9 99.1 0.0 0.0 0.0
75 1588 K (1315 �C) liquid 40.6 47.6 4.2 4.5 3.2 0.66 0.67tridymite 0.8 99.2 0.0 0.0 0.0
96 1588 K (1315 �C) liquid 41.2 46.5 3.2 5.7 3.4 0.69 0.69tridymite 0.8 99.2 0.0 0.0 0.0
129 1588 K (1315 �C) liquid 40.2 47.2 3.2 6.0 3.4 0.66 0.68Tridymite 0.7 99.2 0.0 0.0 0.0
61 1588 K (1315 �C) liquid 40.1 46.5 2.9 7.7 2.8 0.67 0.68tridymite 0.8 99.1 0.0 0.0 0.0
R130 1588 K (1315 �C) liquid 37.7 47.1 3.2 8.7 3.2 0.62 0.62tridymite 0.6 99.3 0.0 0.0 0.0
62 1573 K (1300 �C) liquid 47.1 44.4 3.3 2.2 3.1 0.82 0.83tridymite 0.7 99.2 0.0 0.0 0.0
98 1573 K (1300 �C) liquid 47.0 44.2 3.2 2.2 3.5 0.83 0.82tridymite 0.9 99.1 0.0 0.0 0.0
79 1573 K (1300 �C) liquid 42.7 46.2 3.0 2.3 5.8 0.72 0.72tridymite 0.7 99.2 0.0 0.0 0.0
38 1573 K (1300 �C) liquid 45.6 44.9 3.7 2.3 3.5 0.79 0.78tridymite 0.8 99.1 0.0 0.0 0.0
78 1573 K (1300 �C) liquid 41.6 46.6 4.1 4.5 3.1 0.69 0.70tridymite 0.9 99.1 0.0 0.0 0.0
63 1573 K (1300 �C) liquid 43.4 45.4 3.0 5.2 3.0 0.74 0.76tridymite 0.5 99.4 0.0 0.0 0.0
770—VOLUME 41B, AUGUST 2010 METALLURGICAL AND MATERIALS TRANSACTIONS B
give the calculated values of Fe/SiO2 wt pct ratios, andthe right column in Table IV gives the calculatedliquidus temperatures for each experimental point.Comparison of experimental and calculated valuesindicates a good agreement between the experimentaland the calculated data as well as consistency within theexperimental dataset.
A. Effect of MgO Addition in Slag at Fixed CaOand Al2O3 Concentrations in the FeO-Fe2O3-SiO2-CaO-MgO-Al2O3 System at PO2 of 10
�8 atm
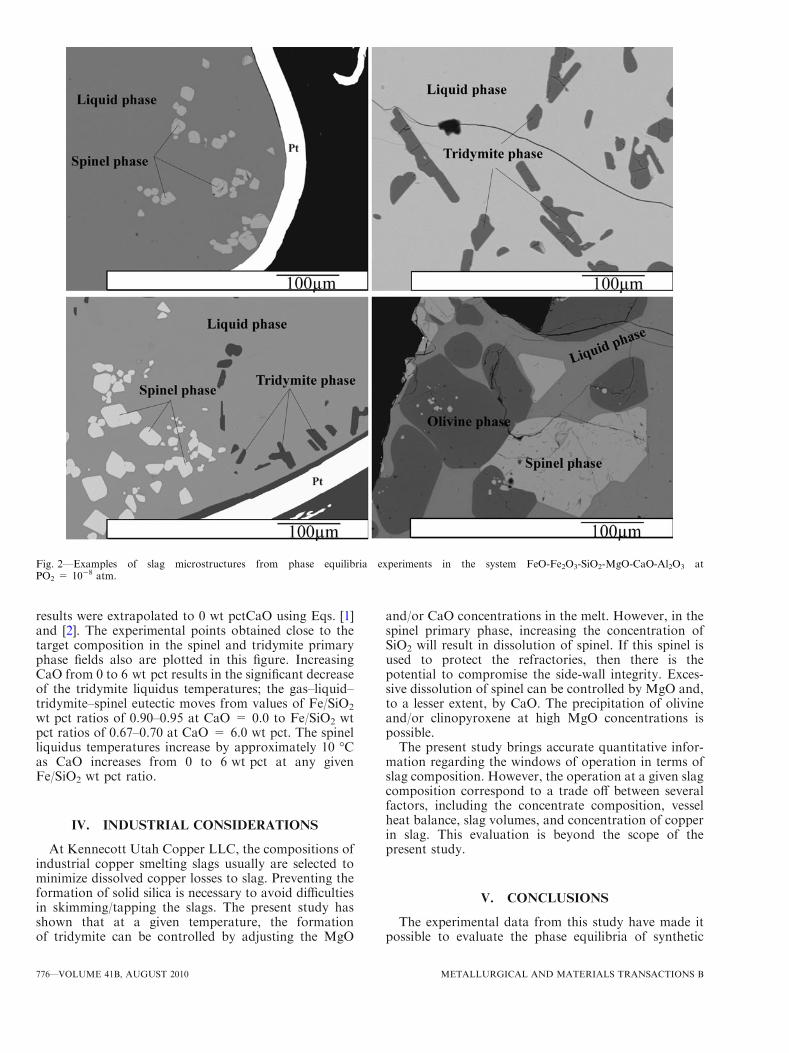
The experiments were carried out to target the gas–liquid–tridymite or gas–liquid–spinel equilibria. Exper-imental results at temperatures lower than 1250 �C wereobtained for the gas–liquid–tridymite–spinel equilibria.At high concentrations of MgO, the gas–liquid–tridymite–clinopyroxene or gas–liquid–spinel–olivinephase assemblages were observed. Examples of typicalmicrostructures of equilibrated slags are given in Figure 2.The crystal structure of solid phases in the samples werenot analyzed by XRD. Thus, the tridymite, spinel,
olivine, and clinopyroxene solid phases identificationswere derived from the chemical composition measuredby EPMA and the reported temperatures of stabil-ity.[21,22] For the investigated range of conditions,clinopyroxene is the stable phase, according to theFactSage[21,22] predictions.
1. Phase Diagram FeO-Fe2O3-SiO2-MgO-(3.3 wt pctCaO-3.3 wt pctAl2O3) at PO2 of 10
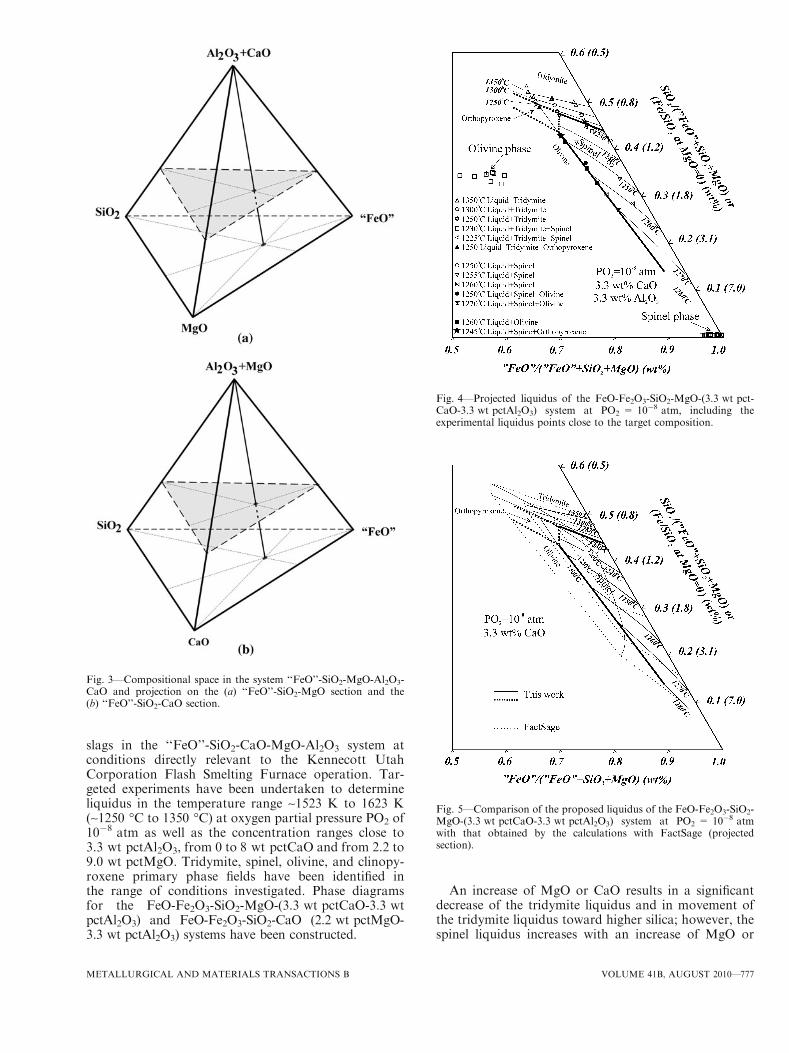
�8 atmThe projection of the multicomponent slag onto the
‘‘FeO’’-SiO2-MgO plane is illustrated schematically inFigure 3(a). Each of the recalculated liquid composi-tions was determined by normalizing the compositionsconsidering only relative ‘‘FeO’’, SiO2, and MgOconcentrations. The constructed pseudoternary sectionshowing primary phase fields, liquidus isotherms, andthe experimental points close to the target compositionis given in Figure 4. The tridymite, spinel, olivine, andclinopyroxene primary phase fields were identified in therange of bulk compositions and conditions studied. Theliquidus isotherms in the tridymite and spinel primaryphase fields at exact Al2O3 and CaO concentrations of
Table III. Continued
Exp. No. Temperature Phases
Slag Composition (wt pct) Wt pctFe/Wt pctSiO2
FeO SiO2 CaO MgO Al2O3 Experimental *Calculated
99 1573 K (1300 �C) liquid 41.3 46.4 3.2 5.9 3.3 0.69 0.71tridymite 1.0 99.0 0.0 0.0 0.0
64 1573 K (1300 �C) liquid 41.2 45.2 2.9 7.6 3.0 0.69 0.69tridymite 0.8 99.1 0.0 0.0 0.0
100 1573 K (1300 �C) liquid 37.6 47.0 3.2 8.9 3.2 0.62 0.62tridymite 0.8 99.1 0.0 0.0 0.0
R45 1523 K (1250 �C) liquid 49.1 42.7 3.1 1.9 3.2 0.89 0.90tridymite 0.8 99.1 0.0 0.0 0.0
54 1523 K (1250 �C) liquid 51.7 40.6 2.8 1.9 2.9 1.0 0.93tridymite 0.7 99.2 0.0 0.0 0.0
31 1523 K (1250 �C) liquid 48.9 42.4 2.9 2.2 3.5 0.90 0.89tridymite 1.1 98.8 0.0 0.0 0.0
65 1523 K (1250 �C) liquid 48.4 42.9 3.2 2.2 3.3 0.88 0.88tridymite 1.0 98.9 0.0 0.0 0.0
101 1523 K (1250 �C) liquid 48.4 42.9 3.3 2.2 3.2 0.88 0.88tridymite 1.0 98.9 0.1 0.0 0.0
73 1523 K (1250 �C) liquid 44.7 44.4 2.9 2.2 5.7 0.78 0.79tridymite 1.0 98.8 0.2 0.0 0.0
131 1523 K (1250 �C) liquid 48.0 43.1 3.4 2.3 3.3 0.87 0.87tridymite 0.9 99.1 0.0 0.0 0.0
72 1523 K (1250 �C) liquid 43.3 45.0 4.1 4.5 3.1 0.75 0.76tridymite 1.0 98.9 0.0 0.0 0.0
66 1523 K (1250 �C) liquid 44.9 44.1 2.8 5.3 2.9 0.79 0.82tridymite 1.0 98.9 0.0 0.0 0.0
102 1523 K (1250 �C) liquid 43.1 44.2 3.3 6.1 3.3 0.76 0.74tridymite 0.6 99.3 0.0 0.0 0.0
132 1523 K (1250 �C) liquid 42.4 45.0 3.3 6.1 3.2 0.73 0.74tridymite 0.7 99.2 0.0 0.0 0.0
67 1523 K (1250 �C) liquid 41.3 45.6 2.7 7.7 2.7 0.70 0.75tridymite 0.6 99.3 0.0 0.0 0.0
103 1523 K (1250 �C) liquid 40.3 44.5 3.2 8.7 3.3 0.70 0.66tridymite 1.0 98.9 0.1 0.0 0.0
133 1523 K (1250 �C) liquid 38.8 45.9 3.3 8.7 3.3 0.66 0.65tridymite 0.6 99.4 0.0 0.0 0.0Orthopyroxene 23.1 53.0 23.2 0.4 0.3
*Fe/SiO2 was calculated using interpolation parameters from Table VIA.
METALLURGICAL AND MATERIALS TRANSACTIONS B VOLUME 41B, AUGUST 2010—771
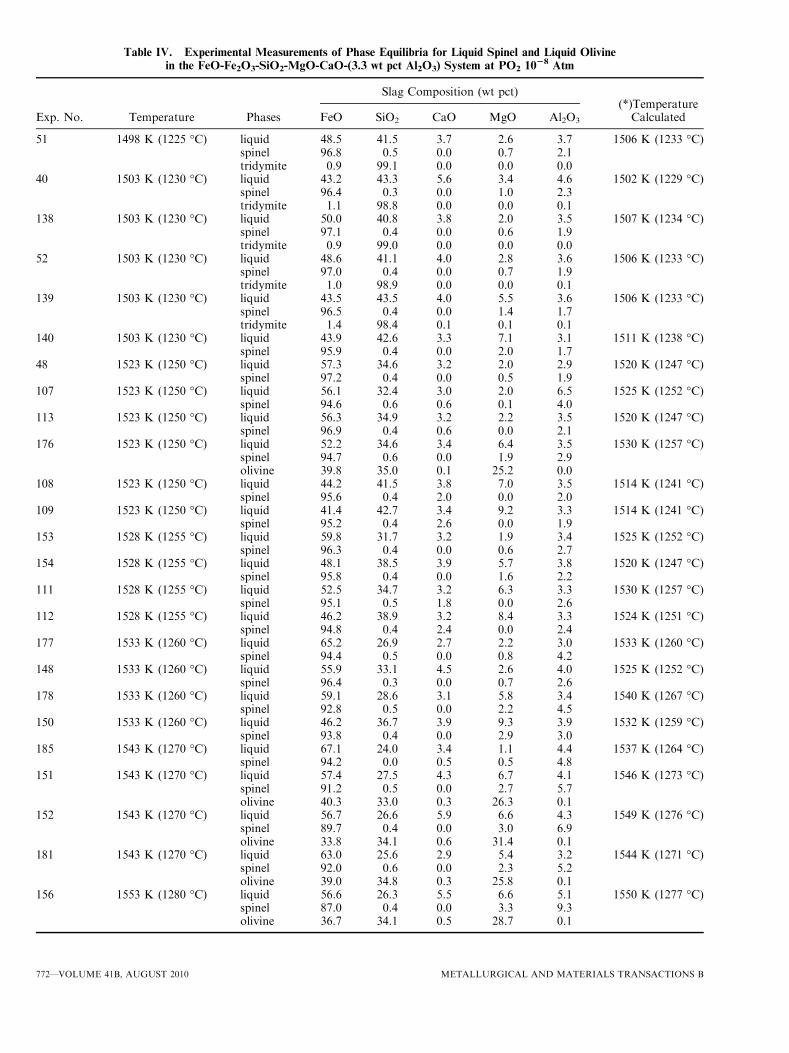
Table IV. Experimental Measurements of Phase Equilibria for Liquid Spinel and Liquid Olivine
in the FeO-Fe2O3-SiO2-MgO-CaO-(3.3 wt pct Al2O3) System at PO2 1028 Atm
Exp. No. Temperature Phases
Slag Composition (wt pct)(*)Temperature
CalculatedFeO SiO2 CaO MgO Al2O3
51 1498 K (1225 �C) liquid 48.5 41.5 3.7 2.6 3.7 1506 K (1233 �C)spinel 96.8 0.5 0.0 0.7 2.1tridymite 0.9 99.1 0.0 0.0 0.0
40 1503 K (1230 �C) liquid 43.2 43.3 5.6 3.4 4.6 1502 K (1229 �C)spinel 96.4 0.3 0.0 1.0 2.3tridymite 1.1 98.8 0.0 0.0 0.1
138 1503 K (1230 �C) liquid 50.0 40.8 3.8 2.0 3.5 1507 K (1234 �C)spinel 97.1 0.4 0.0 0.6 1.9tridymite 0.9 99.0 0.0 0.0 0.0
52 1503 K (1230 �C) liquid 48.6 41.1 4.0 2.8 3.6 1506 K (1233 �C)spinel 97.0 0.4 0.0 0.7 1.9tridymite 1.0 98.9 0.0 0.0 0.1
139 1503 K (1230 �C) liquid 43.5 43.5 4.0 5.5 3.6 1506 K (1233 �C)spinel 96.5 0.4 0.0 1.4 1.7tridymite 1.4 98.4 0.1 0.1 0.1
140 1503 K (1230 �C) liquid 43.9 42.6 3.3 7.1 3.1 1511 K (1238 �C)spinel 95.9 0.4 0.0 2.0 1.7
48 1523 K (1250 �C) liquid 57.3 34.6 3.2 2.0 2.9 1520 K (1247 �C)spinel 97.2 0.4 0.0 0.5 1.9
107 1523 K (1250 �C) liquid 56.1 32.4 3.0 2.0 6.5 1525 K (1252 �C)spinel 94.6 0.6 0.6 0.1 4.0
113 1523 K (1250 �C) liquid 56.3 34.9 3.2 2.2 3.5 1520 K (1247 �C)spinel 96.9 0.4 0.6 0.0 2.1
176 1523 K (1250 �C) liquid 52.2 34.6 3.4 6.4 3.5 1530 K (1257 �C)spinel 94.7 0.6 0.0 1.9 2.9olivine 39.8 35.0 0.1 25.2 0.0
108 1523 K (1250 �C) liquid 44.2 41.5 3.8 7.0 3.5 1514 K (1241 �C)spinel 95.6 0.4 2.0 0.0 2.0
109 1523 K (1250 �C) liquid 41.4 42.7 3.4 9.2 3.3 1514 K (1241 �C)spinel 95.2 0.4 2.6 0.0 1.9
153 1528 K (1255 �C) liquid 59.8 31.7 3.2 1.9 3.4 1525 K (1252 �C)spinel 96.3 0.4 0.0 0.6 2.7
154 1528 K (1255 �C) liquid 48.1 38.5 3.9 5.7 3.8 1520 K (1247 �C)spinel 95.8 0.4 0.0 1.6 2.2
111 1528 K (1255 �C) liquid 52.5 34.7 3.2 6.3 3.3 1530 K (1257 �C)spinel 95.1 0.5 1.8 0.0 2.6
112 1528 K (1255 �C) liquid 46.2 38.9 3.2 8.4 3.3 1524 K (1251 �C)spinel 94.8 0.4 2.4 0.0 2.4
177 1533 K (1260 �C) liquid 65.2 26.9 2.7 2.2 3.0 1533 K (1260 �C)spinel 94.4 0.5 0.0 0.8 4.2
148 1533 K (1260 �C) liquid 55.9 33.1 4.5 2.6 4.0 1525 K (1252 �C)spinel 96.4 0.3 0.0 0.7 2.6
178 1533 K (1260 �C) liquid 59.1 28.6 3.1 5.8 3.4 1540 K (1267 �C)spinel 92.8 0.5 0.0 2.2 4.5
150 1533 K (1260 �C) liquid 46.2 36.7 3.9 9.3 3.9 1532 K (1259 �C)spinel 93.8 0.4 0.0 2.9 3.0
185 1543 K (1270 �C) liquid 67.1 24.0 3.4 1.1 4.4 1537 K (1264 �C)spinel 94.2 0.0 0.5 0.5 4.8
151 1543 K (1270 �C) liquid 57.4 27.5 4.3 6.7 4.1 1546 K (1273 �C)spinel 91.2 0.5 0.0 2.7 5.7olivine 40.3 33.0 0.3 26.3 0.1
152 1543 K (1270 �C) liquid 56.7 26.6 5.9 6.6 4.3 1549 K (1276 �C)spinel 89.7 0.4 0.0 3.0 6.9olivine 33.8 34.1 0.6 31.4 0.1
181 1543 K (1270 �C) liquid 63.0 25.6 2.9 5.4 3.2 1544 K (1271 �C)spinel 92.0 0.6 0.0 2.3 5.2olivine 39.0 34.8 0.3 25.8 0.1
156 1553 K (1280 �C) liquid 56.6 26.3 5.5 6.6 5.1 1550 K (1277 �C)spinel 87.0 0.4 0.0 3.3 9.3olivine 36.7 34.1 0.5 28.7 0.1
772—VOLUME 41B, AUGUST 2010 METALLURGICAL AND MATERIALS TRANSACTIONS B
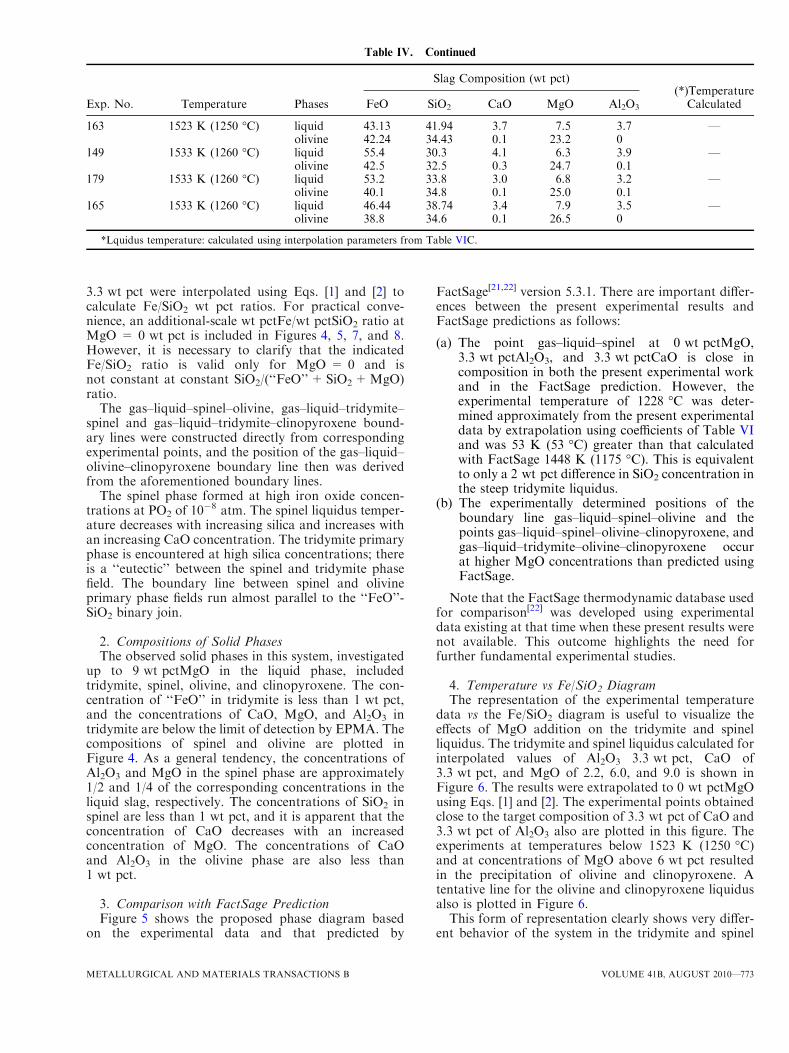
3.3 wt pct were interpolated using Eqs. [1] and [2] tocalculate Fe/SiO2 wt pct ratios. For practical conve-nience, an additional-scale wt pctFe/wt pctSiO2 ratio atMgO = 0 wt pct is included in Figures 4, 5, 7, and 8.However, it is necessary to clarify that the indicatedFe/SiO2 ratio is valid only for MgO = 0 and isnot constant at constant SiO2/(‘‘FeO’’+SiO2+MgO)ratio.
The gas–liquid–spinel–olivine, gas–liquid–tridymite–spinel and gas–liquid–tridymite–clinopyroxene bound-ary lines were constructed directly from correspondingexperimental points, and the position of the gas–liquid–olivine–clinopyroxene boundary line then was derivedfrom the aforementioned boundary lines.
The spinel phase formed at high iron oxide concen-trations at PO2 of 10
�8 atm. The spinel liquidus temper-ature decreases with increasing silica and increases withan increasing CaO concentration. The tridymite primaryphase is encountered at high silica concentrations; thereis a ‘‘eutectic’’ between the spinel and tridymite phasefield. The boundary line between spinel and olivineprimary phase fields run almost parallel to the ‘‘FeO’’-SiO2 binary join.
2. Compositions of Solid PhasesThe observed solid phases in this system, investigated
up to 9 wt pctMgO in the liquid phase, includedtridymite, spinel, olivine, and clinopyroxene. The con-centration of ‘‘FeO’’ in tridymite is less than 1 wt pct,and the concentrations of CaO, MgO, and Al2O3 intridymite are below the limit of detection by EPMA. Thecompositions of spinel and olivine are plotted inFigure 4. As a general tendency, the concentrations ofAl2O3 and MgO in the spinel phase are approximately1/2 and 1/4 of the corresponding concentrations in theliquid slag, respectively. The concentrations of SiO2 inspinel are less than 1 wt pct, and it is apparent that theconcentration of CaO decreases with an increasedconcentration of MgO. The concentrations of CaOand Al2O3 in the olivine phase are also less than1 wt pct.
3. Comparison with FactSage PredictionFigure 5 shows the proposed phase diagram based
on the experimental data and that predicted by
FactSage[21,22] version 5.3.1. There are important differ-ences between the present experimental results andFactSage predictions as follows:
(a) The point gas–liquid–spinel at 0 wt pctMgO,3.3 wt pctAl2O3, and 3.3 wt pctCaO is close incomposition in both the present experimental workand in the FactSage prediction. However, theexperimental temperature of 1228 �C was deter-mined approximately from the present experimentaldata by extrapolation using coefficients of Table VIand was 53 K (53 �C) greater than that calculatedwith FactSage 1448 K (1175 �C). This is equivalentto only a 2 wt pct difference in SiO2 concentration inthe steep tridymite liquidus.
(b) The experimentally determined positions of theboundary line gas–liquid–spinel–olivine and thepoints gas–liquid–spinel–olivine–clinopyroxene, andgas–liquid–tridymite–olivine–clinopyroxene occurat higher MgO concentrations than predicted usingFactSage.
Note that the FactSage thermodynamic database usedfor comparison[22] was developed using experimentaldata existing at that time when these present results werenot available. This outcome highlights the need forfurther fundamental experimental studies.
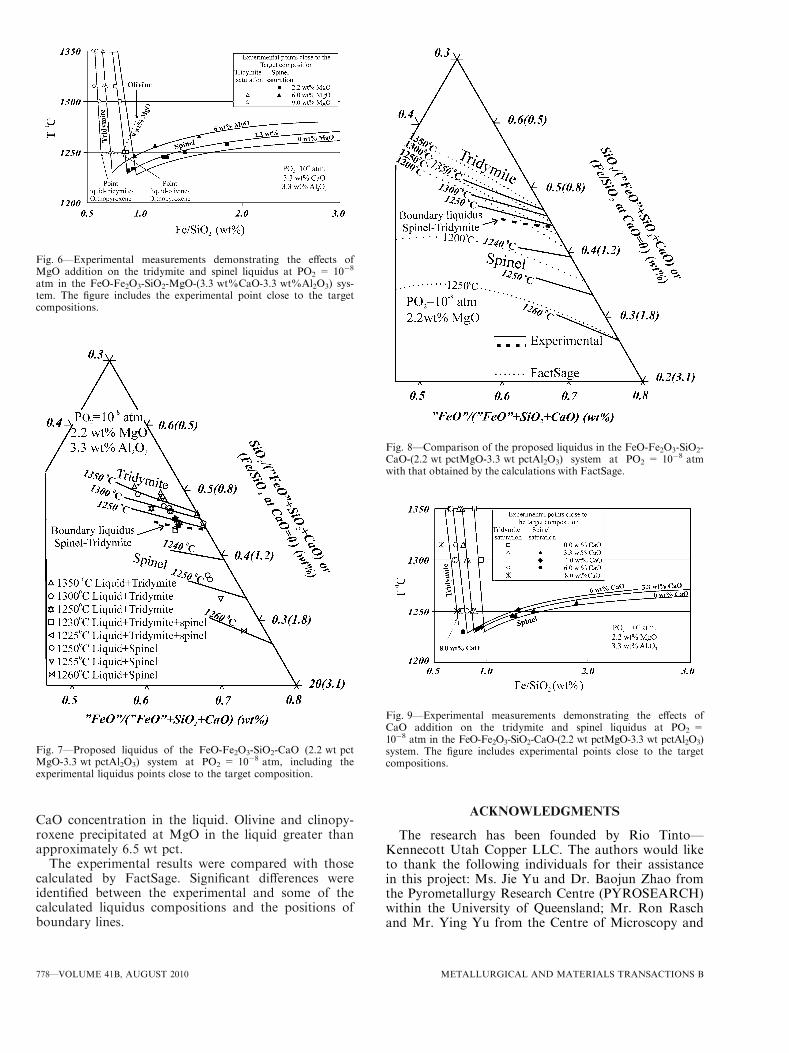
4. Temperature vs Fe/SiO2 DiagramThe representation of the experimental temperature
data vs the Fe/SiO2 diagram is useful to visualize theeffects of MgO addition on the tridymite and spinelliquidus. The tridymite and spinel liquidus calculated forinterpolated values of Al2O3 3.3 wt pct, CaO of3.3 wt pct, and MgO of 2.2, 6.0, and 9.0 is shown inFigure 6. The results were extrapolated to 0 wt pctMgOusing Eqs. [1] and [2]. The experimental points obtainedclose to the target composition of 3.3 wt pct of CaO and3.3 wt pct of Al2O3 also are plotted in this figure. Theexperiments at temperatures below 1523 K (1250 �C)and at concentrations of MgO above 6 wt pct resultedin the precipitation of olivine and clinopyroxene. Atentative line for the olivine and clinopyroxene liquidusalso is plotted in Figure 6.This form of representation clearly shows very differ-
ent behavior of the system in the tridymite and spinel
Table IV. Continued
Exp. No. Temperature Phases
Slag Composition (wt pct)(*)Temperature
CalculatedFeO SiO2 CaO MgO Al2O3
163 1523 K (1250 �C) liquid 43.13 41.94 3.7 7.5 3.7 —olivine 42.24 34.43 0.1 23.2 0
149 1533 K (1260 �C) liquid 55.4 30.3 4.1 6.3 3.9 —olivine 42.5 32.5 0.3 24.7 0.1
179 1533 K (1260 �C) liquid 53.2 33.8 3.0 6.8 3.2 —olivine 40.1 34.8 0.1 25.0 0.1
165 1533 K (1260 �C) liquid 46.44 38.74 3.4 7.9 3.5 —olivine 38.8 34.6 0.1 26.5 0
*Lquidus temperature: calculated using interpolation parameters from Table VIC.
METALLURGICAL AND MATERIALS TRANSACTIONS B VOLUME 41B, AUGUST 2010—773
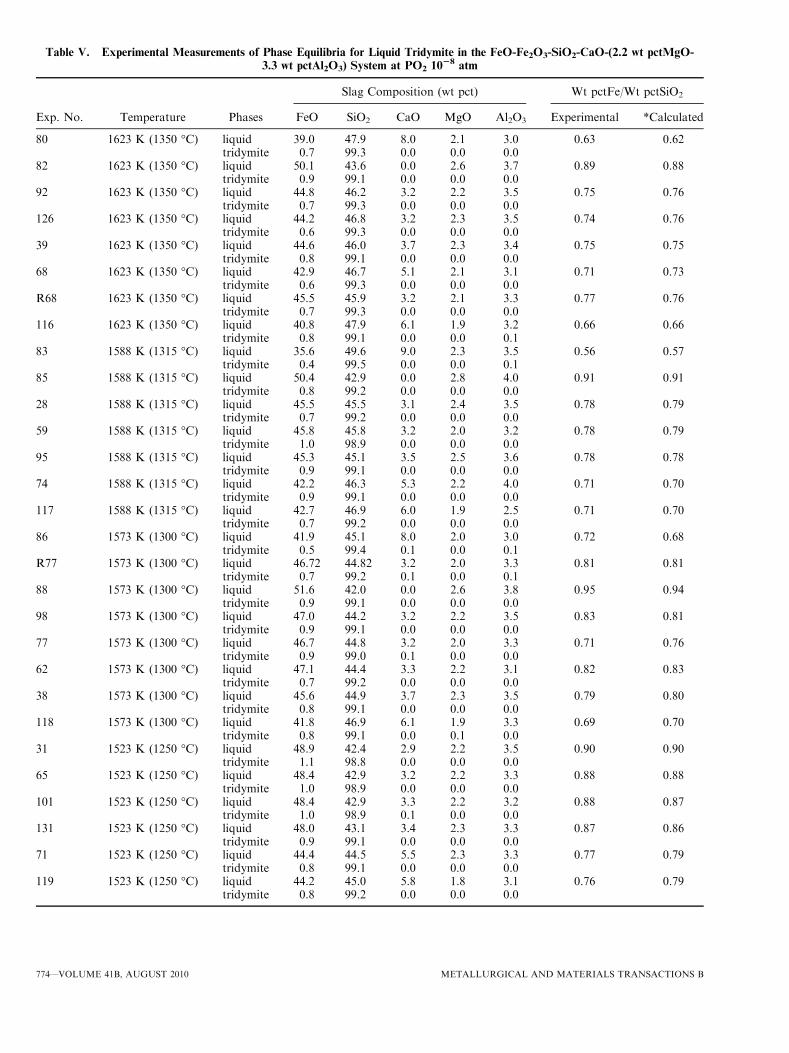
Table V. Experimental Measurements of Phase Equilibria for Liquid Tridymite in the FeO-Fe2O3-SiO2-CaO-(2.2 wt pctMgO-
3.3 wt pctAl2O3) System at PO2 1028 atm
Exp. No. Temperature Phases
Slag Composition (wt pct) Wt pctFe/Wt pctSiO2
FeO SiO2 CaO MgO Al2O3 Experimental *Calculated
80 1623 K (1350 �C) liquid 39.0 47.9 8.0 2.1 3.0 0.63 0.62tridymite 0.7 99.3 0.0 0.0 0.0
82 1623 K (1350 �C) liquid 50.1 43.6 0.0 2.6 3.7 0.89 0.88tridymite 0.9 99.1 0.0 0.0 0.0
92 1623 K (1350 �C) liquid 44.8 46.2 3.2 2.2 3.5 0.75 0.76tridymite 0.7 99.3 0.0 0.0 0.0
126 1623 K (1350 �C) liquid 44.2 46.8 3.2 2.3 3.5 0.74 0.76tridymite 0.6 99.3 0.0 0.0 0.0
39 1623 K (1350 �C) liquid 44.6 46.0 3.7 2.3 3.4 0.75 0.75tridymite 0.8 99.1 0.0 0.0 0.0
68 1623 K (1350 �C) liquid 42.9 46.7 5.1 2.1 3.1 0.71 0.73tridymite 0.6 99.3 0.0 0.0 0.0
R68 1623 K (1350 �C) liquid 45.5 45.9 3.2 2.1 3.3 0.77 0.76tridymite 0.7 99.3 0.0 0.0 0.0
116 1623 K (1350 �C) liquid 40.8 47.9 6.1 1.9 3.2 0.66 0.66tridymite 0.8 99.1 0.0 0.0 0.1
83 1588 K (1315 �C) liquid 35.6 49.6 9.0 2.3 3.5 0.56 0.57tridymite 0.4 99.5 0.0 0.0 0.1
85 1588 K (1315 �C) liquid 50.4 42.9 0.0 2.8 4.0 0.91 0.91tridymite 0.8 99.2 0.0 0.0 0.0
28 1588 K (1315 �C) liquid 45.5 45.5 3.1 2.4 3.5 0.78 0.79tridymite 0.7 99.2 0.0 0.0 0.0
59 1588 K (1315 �C) liquid 45.8 45.8 3.2 2.0 3.2 0.78 0.79tridymite 1.0 98.9 0.0 0.0 0.0
95 1588 K (1315 �C) liquid 45.3 45.1 3.5 2.5 3.6 0.78 0.78tridymite 0.9 99.1 0.0 0.0 0.0
74 1588 K (1315 �C) liquid 42.2 46.3 5.3 2.2 4.0 0.71 0.70tridymite 0.9 99.1 0.0 0.0 0.0
117 1588 K (1315 �C) liquid 42.7 46.9 6.0 1.9 2.5 0.71 0.70tridymite 0.7 99.2 0.0 0.0 0.0
86 1573 K (1300 �C) liquid 41.9 45.1 8.0 2.0 3.0 0.72 0.68tridymite 0.5 99.4 0.1 0.0 0.1
R77 1573 K (1300 �C) liquid 46.72 44.82 3.2 2.0 3.3 0.81 0.81tridymite 0.7 99.2 0.1 0.0 0.1
88 1573 K (1300 �C) liquid 51.6 42.0 0.0 2.6 3.8 0.95 0.94tridymite 0.9 99.1 0.0 0.0 0.0
98 1573 K (1300 �C) liquid 47.0 44.2 3.2 2.2 3.5 0.83 0.81tridymite 0.9 99.1 0.0 0.0 0.0
77 1573 K (1300 �C) liquid 46.7 44.8 3.2 2.0 3.3 0.71 0.76tridymite 0.9 99.0 0.1 0.0 0.0
62 1573 K (1300 �C) liquid 47.1 44.4 3.3 2.2 3.1 0.82 0.83tridymite 0.7 99.2 0.0 0.0 0.0
38 1573 K (1300 �C) liquid 45.6 44.9 3.7 2.3 3.5 0.79 0.80tridymite 0.8 99.1 0.0 0.0 0.0
118 1573 K (1300 �C) liquid 41.8 46.9 6.1 1.9 3.3 0.69 0.70tridymite 0.8 99.1 0.0 0.1 0.0
31 1523 K (1250 �C) liquid 48.9 42.4 2.9 2.2 3.5 0.90 0.90tridymite 1.1 98.8 0.0 0.0 0.0
65 1523 K (1250 �C) liquid 48.4 42.9 3.2 2.2 3.3 0.88 0.88tridymite 1.0 98.9 0.0 0.0 0.0
101 1523 K (1250 �C) liquid 48.4 42.9 3.3 2.2 3.2 0.88 0.87tridymite 1.0 98.9 0.1 0.0 0.0
131 1523 K (1250 �C) liquid 48.0 43.1 3.4 2.3 3.3 0.87 0.86tridymite 0.9 99.1 0.0 0.0 0.0
71 1523 K (1250 �C) liquid 44.4 44.5 5.5 2.3 3.3 0.77 0.79tridymite 0.8 99.1 0.0 0.0 0.0
119 1523 K (1250 �C) liquid 44.2 45.0 5.8 1.8 3.1 0.76 0.79tridymite 0.8 99.2 0.0 0.0 0.0
774—VOLUME 41B, AUGUST 2010 METALLURGICAL AND MATERIALS TRANSACTIONS B
primary phase fields. The tridymite temperatures liqui-dus decrease rapidly with an increasing Fe/SiO2 wt pctratio. The results presented in Figure 6 indicate thatincreasing MgO from 2.2 to 9 wt pct results in asignificant decrease of the tridymite liquidus tempera-tures; alternatively, this can be described as a movementof the gas–liquid–tridymite–spinel eutectic from valuesof Fe/SiO2 wt pct ratios of 0.8 to 0.9 when MgO = 2.2to 0.6 to 0.65 when MgO = 6.0 wt pct. The spinelliquidus temperatures, by contrast, increase by approx-imately 20 K (20 �C) as MgO increases from 0 to6 wt pct at any given Fe/SiO2 wt pct ratio.
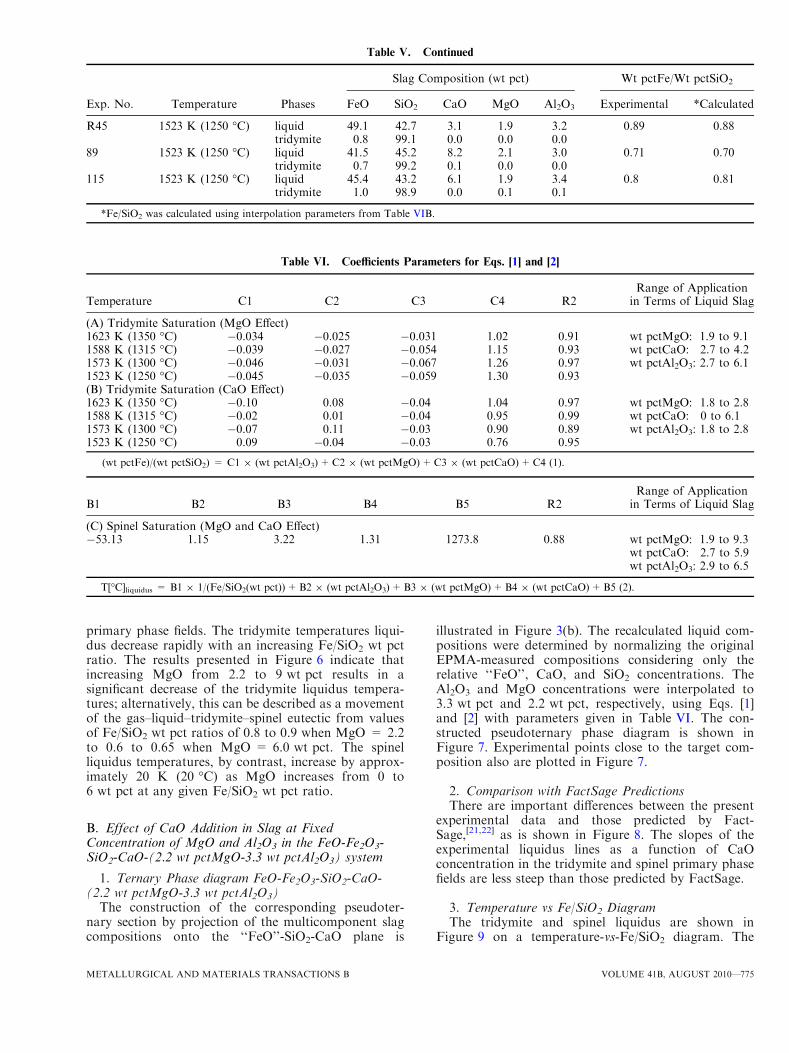
B. Effect of CaO Addition in Slag at FixedConcentration of MgO and Al2O3 in the FeO-Fe2O3-SiO2-CaO-(2.2 wt pctMgO-3.3 wt pctAl2O3) system
1. Ternary Phase diagram FeO-Fe2O3-SiO2-CaO-(2.2 wt pctMgO-3.3 wt pctAl2O3)
The construction of the corresponding pseudoter-nary section by projection of the multicomponent slagcompositions onto the ‘‘FeO’’-SiO2-CaO plane is
illustrated in Figure 3(b). The recalculated liquid com-positions were determined by normalizing the originalEPMA-measured compositions considering only therelative ‘‘FeO’’, CaO, and SiO2 concentrations. TheAl2O3 and MgO concentrations were interpolated to3.3 wt pct and 2.2 wt pct, respectively, using Eqs. [1]and [2] with parameters given in Table VI. The con-structed pseudoternary phase diagram is shown inFigure 7. Experimental points close to the target com-position also are plotted in Figure 7.
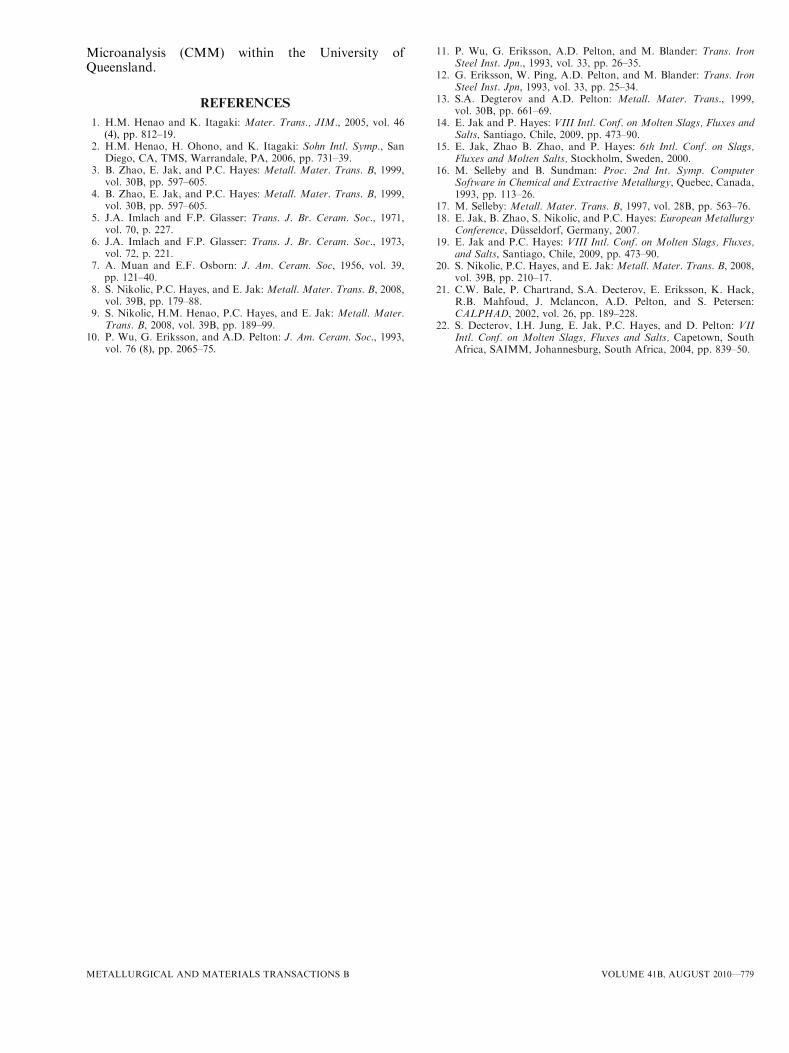
2. Comparison with FactSage PredictionsThere are important differences between the present
experimental data and those predicted by Fact-Sage,[21,22] as is shown in Figure 8. The slopes of theexperimental liquidus lines as a function of CaOconcentration in the tridymite and spinel primary phasefields are less steep than those predicted by FactSage.
3. Temperature vs Fe/SiO2 DiagramThe tridymite and spinel liquidus are shown in
Figure 9 on a temperature-vs-Fe/SiO2 diagram. The
Table VI. Coefficients Parameters for Eqs. [1] and [2]
Temperature C1 C2 C3 C4 R2Range of Application
in Terms of Liquid Slag
(A) Tridymite Saturation (MgO Effect)1623 K (1350 �C) �0.034 �0.025 �0.031 1.02 0.91 wt pctMgO: 1.9 to 9.1
wt pctCaO: 2.7 to 4.2wt pctAl2O3: 2.7 to 6.1
1588 K (1315 �C) �0.039 �0.027 �0.054 1.15 0.931573 K (1300 �C) �0.046 �0.031 �0.067 1.26 0.971523 K (1250 �C) �0.045 �0.035 �0.059 1.30 0.93(B) Tridymite Saturation (CaO Effect)1623 K (1350 �C) �0.10 0.08 �0.04 1.04 0.97 wt pctMgO: 1.8 to 2.8
wt pctCaO: 0 to 6.1wt pctAl2O3: 1.8 to 2.8
1588 K (1315 �C) �0.02 0.01 �0.04 0.95 0.991573 K (1300 �C) �0.07 0.11 �0.03 0.90 0.891523 K (1250 �C) 0.09 �0.04 �0.03 0.76 0.95
(wt pctFe)/(wt pctSiO2) = C1 9 (wt pctAl2O3)+C2 9 (wt pctMgO)+C3 9 (wt pctCaO)+C4 (1).
B1 B2 B3 B4 B5 R2Range of Application
in Terms of Liquid Slag
(C) Spinel Saturation (MgO and CaO Effect)�53.13 1.15 3.22 1.31 1273.8 0.88 wt pctMgO: 1.9 to 9.3
wt pctCaO: 2.7 to 5.9wt pctAl2O3: 2.9 to 6.5
T[�C]liquidus = B1 9 1/(Fe/SiO2(wt pct))+B2 9 (wt pctAl2O3)+B3 9 (wt pctMgO)+B4 9 (wt pctCaO)+B5 (2).
Table V. Continued
Exp. No. Temperature Phases
Slag Composition (wt pct) Wt pctFe/Wt pctSiO2
FeO SiO2 CaO MgO Al2O3 Experimental *Calculated
R45 1523 K (1250 �C) liquid 49.1 42.7 3.1 1.9 3.2 0.89 0.88tridymite 0.8 99.1 0.0 0.0 0.0
89 1523 K (1250 �C) liquid 41.5 45.2 8.2 2.1 3.0 0.71 0.70tridymite 0.7 99.2 0.1 0.0 0.0
115 1523 K (1250 �C) liquid 45.4 43.2 6.1 1.9 3.4 0.8 0.81tridymite 1.0 98.9 0.0 0.1 0.1
*Fe/SiO2 was calculated using interpolation parameters from Table VIB.
METALLURGICAL AND MATERIALS TRANSACTIONS B VOLUME 41B, AUGUST 2010—775
results were extrapolated to 0 wt pctCaO using Eqs. [1]and [2]. The experimental points obtained close to thetarget composition in the spinel and tridymite primaryphase fields also are plotted in this figure. IncreasingCaO from 0 to 6 wt pct results in the significant decreaseof the tridymite liquidus temperatures; the gas–liquid–tridymite–spinel eutectic moves from values of Fe/SiO2
wt pct ratios of 0.90–0.95 at CaO = 0.0 to Fe/SiO2 wtpct ratios of 0.67–0.70 at CaO = 6.0 wt pct. The spinelliquidus temperatures increase by approximately 10 �Cas CaO increases from 0 to 6 wt pct at any givenFe/SiO2 wt pct ratio.
IV. INDUSTRIAL CONSIDERATIONS
At Kennecott Utah Copper LLC, the compositions ofindustrial copper smelting slags usually are selected tominimize dissolved copper losses to slag. Preventing theformation of solid silica is necessary to avoid difficultiesin skimming/tapping the slags. The present study hasshown that at a given temperature, the formationof tridymite can be controlled by adjusting the MgO
and/or CaO concentrations in the melt. However, in thespinel primary phase, increasing the concentration ofSiO2 will result in dissolution of spinel. If this spinel isused to protect the refractories, then there is thepotential to compromise the side-wall integrity. Exces-sive dissolution of spinel can be controlled by MgO and,to a lesser extent, by CaO. The precipitation of olivineand/or clinopyroxene at high MgO concentrations ispossible.The present study brings accurate quantitative infor-
mation regarding the windows of operation in terms ofslag composition. However, the operation at a given slagcomposition correspond to a trade off between severalfactors, including the concentrate composition, vesselheat balance, slag volumes, and concentration of copperin slag. This evaluation is beyond the scope of thepresent study.
V. CONCLUSIONS
The experimental data from this study have made itpossible to evaluate the phase equilibria of synthetic
Fig. 2—Examples of slag microstructures from phase equilibria experiments in the system FeO-Fe2O3-SiO2-MgO-CaO-Al2O3 atPO2 = 10�8 atm.
776—VOLUME 41B, AUGUST 2010 METALLURGICAL AND MATERIALS TRANSACTIONS B
slags in the ‘‘FeO’’-SiO2-CaO-MgO-Al2O3 system atconditions directly relevant to the Kennecott UtahCorporation Flash Smelting Furnace operation. Tar-geted experiments have been undertaken to determineliquidus in the temperature range ~1523 K to 1623 K(~1250 �C to 1350 �C) at oxygen partial pressure PO2 of10�8 atm as well as the concentration ranges close to3.3 wt pctAl2O3, from 0 to 8 wt pctCaO and from 2.2 to9.0 wt pctMgO. Tridymite, spinel, olivine, and clinopy-roxene primary phase fields have been identified inthe range of conditions investigated. Phase diagramsfor the FeO-Fe2O3-SiO2-MgO-(3.3 wt pctCaO-3.3 wtpctAl2O3) and FeO-Fe2O3-SiO2-CaO (2.2 wt pctMgO-3.3 wt pctAl2O3) systems have been constructed.
An increase of MgO or CaO results in a significantdecrease of the tridymite liquidus and in movement ofthe tridymite liquidus toward higher silica; however, thespinel liquidus increases with an increase of MgO or
Fig. 3—Compositional space in the system ‘‘FeO’’-SiO2-MgO-Al2O3-CaO and projection on the (a) ‘‘FeO’’-SiO2-MgO section and the(b) ‘‘FeO’’-SiO2-CaO section.
Fig. 4—Projected liquidus of the FeO-Fe2O3-SiO2-MgO-(3.3 wt pct-CaO-3.3 wt pctAl2O3) system at PO2 = 10�8 atm, including theexperimental liquidus points close to the target composition.
Fig. 5—Comparison of the proposed liquidus of the FeO-Fe2O3-SiO2-MgO-(3.3 wt pctCaO-3.3 wt pctAl2O3) system at PO2 = 10�8 atmwith that obtained by the calculations with FactSage (projectedsection).
METALLURGICAL AND MATERIALS TRANSACTIONS B VOLUME 41B, AUGUST 2010—777
CaO concentration in the liquid. Olivine and clinopy-roxene precipitated at MgO in the liquid greater thanapproximately 6.5 wt pct.
The experimental results were compared with thosecalculated by FactSage. Significant differences wereidentified between the experimental and some of thecalculated liquidus compositions and the positions ofboundary lines.
ACKNOWLEDGMENTS
The research has been founded by Rio Tinto—Kennecott Utah Copper LLC. The authors would liketo thank the following individuals for their assistancein this project: Ms. Jie Yu and Dr. Baojun Zhao fromthe Pyrometallurgy Research Centre (PYROSEARCH)within the University of Queensland; Mr. Ron Raschand Mr. Ying Yu from the Centre of Microscopy and
Fig. 6—Experimental measurements demonstrating the effects ofMgO addition on the tridymite and spinel liquidus at PO2 = 10�8
atm in the FeO-Fe2O3-SiO2-MgO-(3.3 wt%CaO-3.3 wt%Al2O3) sys-tem. The figure includes the experimental point close to the targetcompositions.
Fig. 7—Proposed liquidus of the FeO-Fe2O3-SiO2-CaO (2.2 wt pctMgO-3.3 wt pctAl2O3) system at PO2 = 10�8 atm, including theexperimental liquidus points close to the target composition.
Fig. 8—Comparison of the proposed liquidus in the FeO-Fe2O3-SiO2-CaO-(2.2 wt pctMgO-3.3 wt pctAl2O3) system at PO2 = 10�8 atmwith that obtained by the calculations with FactSage.
Fig. 9—Experimental measurements demonstrating the effects ofCaO addition on the tridymite and spinel liquidus at PO2 =10�8 atm in the FeO-Fe2O3-SiO2-CaO-(2.2 wt pctMgO-3.3 wt pctAl2O3)system. The figure includes experimental points close to the targetcompositions.
778—VOLUME 41B, AUGUST 2010 METALLURGICAL AND MATERIALS TRANSACTIONS B
Microanalysis (CMM) within the University ofQueensland.
REFERENCES1. H.M. Henao and K. Itagaki: Mater. Trans., JIM., 2005, vol. 46
(4), pp. 812–19.2. H.M. Henao, H. Ohono, and K. Itagaki: Sohn Intl. Symp., San
Diego, CA, TMS, Warrandale, PA, 2006, pp. 731–39.3. B. Zhao, E. Jak, and P.C. Hayes: Metall. Mater. Trans. B, 1999,
vol. 30B, pp. 597–605.4. B. Zhao, E. Jak, and P.C. Hayes: Metall. Mater. Trans. B, 1999,
vol. 30B, pp. 597–605.5. J.A. Imlach and F.P. Glasser: Trans. J. Br. Ceram. Soc., 1971,
vol. 70, p. 227.6. J.A. Imlach and F.P. Glasser: Trans. J. Br. Ceram. Soc., 1973,
vol. 72, p. 221.7. A. Muan and E.F. Osborn: J. Am. Ceram. Soc, 1956, vol. 39,
pp. 121–40.8. S. Nikolic, P.C. Hayes, and E. Jak: Metall. Mater. Trans. B, 2008,
vol. 39B, pp. 179–88.9. S. Nikolic, H.M. Henao, P.C. Hayes, and E. Jak: Metall. Mater.
Trans. B, 2008, vol. 39B, pp. 189–99.10. P. Wu, G. Eriksson, and A.D. Pelton: J. Am. Ceram. Soc., 1993,
vol. 76 (8), pp. 2065–75.
11. P. Wu, G. Eriksson, A.D. Pelton, and M. Blander: Trans. IronSteel Inst. Jpn., 1993, vol. 33, pp. 26–35.
12. G. Eriksson, W. Ping, A.D. Pelton, and M. Blander: Trans. IronSteel Inst. Jpn, 1993, vol. 33, pp. 25–34.
13. S.A. Degterov and A.D. Pelton: Metall. Mater. Trans., 1999,vol. 30B, pp. 661–69.
14. E. Jak and P. Hayes: VIII Intl. Conf. on Molten Slags, Fluxes andSalts, Santiago, Chile, 2009, pp. 473–90.
15. E. Jak, Zhao B. Zhao, and P. Hayes: 6th Intl. Conf. on Slags,Fluxes and Molten Salts, Stockholm, Sweden, 2000.
16. M. Selleby and B. Sundman: Proc. 2nd Int. Symp. ComputerSoftware in Chemical and Extractive Metallurgy, Quebec, Canada,1993, pp. 113–26.
17. M. Selleby: Metall. Mater. Trans. B, 1997, vol. 28B, pp. 563–76.18. E. Jak, B. Zhao, S. Nikolic, and P.C. Hayes: European Metallurgy
Conference, Dusseldorf, Germany, 2007.19. E. Jak and P.C. Hayes: VIII Intl. Conf. on Molten Slags, Fluxes,
and Salts, Santiago, Chile, 2009, pp. 473–90.20. S. Nikolic, P.C. Hayes, and E. Jak: Metall. Mater. Trans. B, 2008,
vol. 39B, pp. 210–17.21. C.W. Bale, P. Chartrand, S.A. Decterov, E. Eriksson, K. Hack,
R.B. Mahfoud, J. Mclancon, A.D. Pelton, and S. Petersen:CALPHAD, 2002, vol. 26, pp. 189–228.
22. S. Decterov, I.H. Jung, E. Jak, P.C. Hayes, and D. Pelton: VIIIntl. Conf. on Molten Slags, Fluxes and Salts, Capetown, SouthAfrica, SAIMM, Johannesburg, South Africa, 2004, pp. 839–50.
METALLURGICAL AND MATERIALS TRANSACTIONS B VOLUME 41B, AUGUST 2010—779
Top Related
Copyright © 2022 FDOKUMEN

