


Bahasa
Halaman
Hukum

Intra-individual variability in Big Five traits
1
RUNNING HEAD: Intra-individual variability in Big Five traits
A Coordinated Analysis of Big-Five Trait Change Across 14 Longitudinal Studies
Draft 12/19/17. This paper has not been peer reviewed. Please do not copy or cite without author's permission
Eileen K. Graham1, Denis Gerstorf2,3 , Tomiko B. Yoneda4, Andrea M. Piccinin4, Tom Booth5,
Christopher R. Beam6, Andrew J. Petkus6, Joshua P. Rutsohn1, Ryne Estabrook1, Mindy J. Katz7,
Nicholas A. Turiano8, Ulman Lindenberger9, Jacqui Smith10, Johanna Drewelies2, Gert G.
Wagner3,9,11, Nancy L. Pedersen12, Mathias Allemand13, Avron Spiro III14,15,16, Dorly, J.H.
Deeg17, Boo Johansson18, Martin Sliwinski19, Richard B. Lipton6,20,21, K. Warner Schaie22,
Sherry Willis22, Ian J. Deary23, Scott M. Hofer3, & Daniel K. Mroczek1,24
1 Department of Medical Social Sciences, Feinberg School of Medicine, Northwestern
University, Chicago, Illinois
2Department of Psychology, Humboldt University, Berlin, Germany
3German Institute for Economic Research (DIW Berlin), Berlin, Germany
4Department of Psychology, University of Victoria, Victoria, British Columbia, Canada
5Department of Psychology, University of Edinburgh, Edinburgh, Scotland
6Department of Psychology, University of Southern California, Los Angeles, CA
7The Saul R. Korey Department of Neurology, Albert Einstein College of Medicine, Bronx, New
York.
8Department of Psychology, Eberly College of Arts and Sciences, West Virginia
Intra-individual variability in Big Five traits
2
University, Morgantown, West Virginia
9Max Planck Institute for Human Development, Berlin, Germany
10University of Michigan, Ann Arbor, Michigan
11Berlin University of Technology (TUB), Berlin, Germany
12Department of Medical Epidemiology and Biostatistics, Karolinska Institute,
Stockholm, Sweden
13Department of Psychology and University Research Priority Program “Dynamics of Healthy
Aging”, University of Zurich, Zurich, Switzerland.
14Massachusetts Veterans Epidemiology Research & Information Center, VA Boston Healthcare
System, Boston, Massachusetts
15Department of Epidemiology, Boston University School of Public Health, Boston,
Massachusetts
16Department of Psychiatry, Boston University School of Medicine, Boston, Massachusetts
17Department of Epidemiology and Biostatistics, VU University Medical Centre, Amsterdam,
The Netherlands
18University of Gothenburg, Göteborg, 40530, Sweden
19Department of Human Development and Family Studies and Center for Healthy Aging,
Pennsylvania State University, Pennsylvania, USA
20Department of Psychiatry and Behavioral Sciences, Albert Einstein College of
Medicine, Bronx, New York
21Department of Epidemiology & Population Health, Albert Einstein College of
Medicine, Bronx, New York
22Department of Psychiatry and Behavioral Sciences, University of Washington, Seattle,
Intra-individual variability in Big Five traits
3
Washington
23Centre for Cognitive Ageing and Cognitive Epidemiology, Department of Psychology,
University of Edinburgh, Edinburgh
24Department of Psychology, Weinberg College of Arts & Sciences, Northwestern
University, Evanston, Illinois
Address Correspondence To:
Eileen K. Graham, Ph.D
Northwestern University
633 N. Saint Clair, 19th Floor
Chicago, IL 60611
Intra-individual variability in Big Five traits
4
Abstract
This study assessed change in the Big Five personality traits. We conducted a coordinated
integrative data analysis (IDA) using data from 14 studies including 47,190 respondents to
examine trajectories of change in the traits of neuroticism, extraversion, openness,
conscientiousness, and agreeableness. Coordinating models across multiple study sites, we fit
nearly identical multi-level linear growth curve models to assess and compare the extent of trait
change over time. Quadratic change was assessed in 8 studies with four or more measurement
occasions. Across studies, the linear trajectory models revealed stability for agreeableness and
decreases for the other four five traits. The non-linear trajectories suggest a U-shaped curve for
neuroticism, and an inverted-U for extraversion. Meta-analytic summaries indicate that the fixed
effects are heterogeneous, and that the variability in traits is partially explained by baseline age
and country of origin. We conclude from our study that neuroticism, extraversion,
conscientiousness, and openness go down over time, while agreeableness remains relatively
stable.
Keywords: personality traits; intraindividual variability; personality change; replicability;
integrative data analysis
Intra-individual variability in Big Five traits
5
1. Introduction
1.1 Overview
Questions regarding personality changes in adulthood remain, despite many studies over
many decades. Recent work has embraced a more nuanced perspective than earlier approaches,
which whipsawed from “personality is unstable for nearly everyone” in the 1970s (Mischel,
1969, 1977), to “personality is stable for nearly everyone in the 1980s and 1990s (Costa &
McCrae, 1986; Costa & McCrae, 1980). Over the last 10-15 years, a less extreme perspective has
emerged, recognizing that personality does change, but likely in systematic ways, and that in any
population or sample there will almost certainly be individual differences in change in which
both changing and stable individuals may be identified. Most of the newest work has also
focused on antecedents to (Bleidorn et al., 2013; Mroczek & Spiro, 2003b; Muhlig-Versen,
Bowen, & Staudinger, 2012), or consequences of (Graham & Lachman, 2012; Human et al.,
2013; Mroczek & Spiro, 2007; Steiger, Allemand, Robins, & Fend, 2014; Turiano et al., 2012)
personality change. However it is useful to step back from efforts at predicting and explaining
personality change in adulthood and carry out confirmatory work that circles back to some
fundamental questions. The current study did so, asking three basic questions. First, using
individual trajectory models, what are the basic patterns of overall change for each of the big five
traits? Second, what is the extent of individual differences in trajectories around those overall
trajectories? In the parlance of multi-level models, the former is a question of fixed effects, and
the latter is one of random effects, especially with respect to slopes, or individual differences in
rate of change. Our emphasis on trajectories required a focus on studies that had 3 or more
measurement occasions.
Intra-individual variability in Big Five traits
6
We posed a third question as well, one that addressed issues of reproducibility and
replicability. Utilizing a novel methodological approach designed to enhance replicability, and
drawing upon the data sharing network of the Integrative Analysis of Longitudinal Studies of
Aging (IALSA) (Hofer & Piccinin, 2009), we identified 14 samples with long-term longitudinal
personality data, with at least 3 occasions of measurement. Using those, we estimated personality
trait trajectories within each study using the multi-level model for change (Singer & Willett,
2003), and then summarized the average trajectories with meta-analytic techniques. This form of
separate, but coordinated, modeling within each study is known as Coordinated Analysis, and is
a type of Integrative Data Analysis (IDA) (Hofer & Piccinin, 2009). This approach produces a
group of replications that otherwise would be very difficult to obtain due to the non-convenience
nature of long-term longitudinal samples (one cannot simply reel off a replication study in a few
weeks or months, as is possible with experimental or non-longitudinal data). Additionally, a
Coordinated Analysis preserves the separate findings across samples, thus permitting assessment
of heterogeneity in effect sizes that may be due to substantive sample differences (e.g. country of
origin).
Thus, in addition to our two substantive questions regarding the functional forms of the
overall trajectories of Big Five traits (fixed effects), and individual differences in trajectories
(random effects), we had a third question that was more methodological: could we identify
between-sample variation in either overall patterns or individual differences in slopes?
1.2 Overall Trajectories, and the Maturity and Dolce Vita Effects
Overall or general patterns of personality change are nomothetic, or variable-centered. It
captures how a given trait changes over time, in contrast to how different persons change with
time. They may be termed “meta-trajectories” when they refer to population level estimates of
Intra-individual variability in Big Five traits
7
change. One of the more prominent theories of nomothetic, or population-level trajectories is the
Maturity Principle (Roberts & Mroczek, 2008; Roberts, Walton, & Viechtbauer, 2006; Roberts,
Wood, & Caspi, 2008; Roberts, Wood, & Smith, 2005). It hypothesizes that trait changes in
adulthood tend to reflect an increase in socially acceptable characteristics (i.e., maturity) and a
successful transition into adult roles that require additional responsibility (i.e., social investment
theory: parenthood, work promotions; (Caspi, Roberts, & Shiner, 2005; Roberts et al., 2006;
Roberts et al., 2005). Marsh and colleagues (2013) further developed the Maturity Principle,
describing the “Dolce Vita” effect, which suggests that certain traits are higher during midlife
out of necessity, and are lower during later adulthood due to changes in those social roles (e.g.
older adults may not need higher conscientiousness or extraversion to accomplish their goals).
Consistent with the Maturity Principle, several studies that either plotted means over different
ages, or estimated overall trajectories (using either MLM or latent trajectory models) found that
during the emerging adult and midlife years, agreeableness, conscientiousness, openness, and
extraversion tend to increase, and neuroticism tends to decrease (Lucas & Donnellan, 2011;
March et al., 2013; Roberts & Mroczek, 2008; Roberts et al., 2006). After midlife, these overall
trajectories shift somewhat, with various studies showing decreases in all of the Big Five traits
(Berg & Johannsson, 2014; Kander et al., 2015; Lucas & Donnellan, 2011; Mottus et al., 2012;
Roberts Mroczek, 2008). These findings are consistent with both the Maturity Principle and the
Dolce Vita effect, and also align with the most comprehensive meta-analysis of mean-level
change in traits (Roberts et al., 2006), which indicated that certain traits (e.g. conscientiousness,
emotional stability) increase in younger adulthood, while others (e.g. agreeableness) only change
in older adulthood. Interestingly, when combined, the Maturity and Dolce Vita theories imply
curvilinearity. Some traits may increase in the earlier part of adulthood, but then decrease in
Intra-individual variability in Big Five traits
8
older adulthood. Typically, testing of quadratic trajectory models requires 4 or more
measurement occasions. Several of the studies we utilized had 4 or more occasions, allowing
testing of both the maturity and Dolce Vita perspectives.
1.3 Individual Differences in Trajectories, and Lifespan Developmental Theory
Discovery of overall patterns of change (meta-trajectories), along with theories that
explain them (Maturity Principle, Dolce Vita Effect) are important. However, just as important
are the individual differences that surround these overall trajectories. Can we identify individual
variation in trajectories around those population trajectory estimates? Even when overall patterns
are well-replicated (e.g. decreasing neuroticism in adulthood) to what extent do individuals vary
around that population level trajectory, especially with respect to individual differences in rate of
change, or slope? Estimates of individual variation in rate of change tell us that the overall
sample-or population-level trajectory describes only a fraction of people and that many deviate
from the average. Historically, it was assumed that everyone shows the same pattern of stability
or change over time. For example, many had argued that personality is set in stone and unlikely
to change once adulthood is reached, commonly citing the popular William James quote that
personality is “set like plaster” after age 30 (Costa & McCrae, 1986; Costa & McCrae, 1980;
McCrae & Costa, 1994). In general, meta-trajectories were assumed to have a slope of zero,
indicating stability. Consideration of individual variation around such trajectories forms a key
tenet of lifespan developmental theory (LDT) (Baltes, Reese, & Nesselroade, 1977). LDT holds
that development (including personality development) is a lifelong process, and that both general
patterns and individual differences around these patterns are critical for understanding
development of any particular variable over the lifespan (Baltes, 1987; Baltes, Lindenberger, &
Sataudinger, 2006). As such, theories that focus on meta-trajectories, such as the Maturity
Intra-individual variability in Big Five traits
9
Principle, are not mutually exclusive with LDT. The Maturity Principle (and Dolce Vita) can
specify the shape of the population level meta-trajectories, with LDT specifying that around
those overall patterns, there will be individual differences in person-level trajectories.
Recent studies of adult personality change have typically reported these estimates of
individual variation (random effects), in almost all cases finding evidence for the LDT principle
of individual differences in person-level change (Berg & Johansson, 2014; Bleidorn, Kandler,
Riemann, Spinath, & Angleitner, 2009; Helson, Jones, & Kwan, 2002; Mroczek, Almeida, Spiro,
& Pafford, 2006; Mroczek & Spiro, 2003b, 2007; Pedersen & Reynolds, 1998; Roberts et al.,
2006; Terracciano, McCrae, Brant, & Costa, 2005; Vaidya, Gray, Haig, Mroczek, & Watson,
2008; Vecchione, Alessandri, Barbaranelli, & Caprara, 2012). However, it would be useful to
compare estimates of individual variation in trajectories in a multi-study format, allowing us to
determine if some studies or sample contain greater variation than others. The current study did
so.
1.4 The Current Study
The goals of the current study were to 1) examine overall trajectories of personality traits,
2) evaluate the extent of individual differences in trajectories (slopes), and 3) do so in a multi-
study, Coordinated Analysis framework that allowed assessment of variation in 1 and 2 across
various samples. As described above, there are compelling theoretical arguments for change in
personality traits over the adult portion of the lifespan (e.g. the Maturity Principle, dolce via
effect), and various patterns of change have been identified in prior studies that are consistent
with both theories (e.g., decreases in neuroticism and extraversion; and curvilinear changes in
conscientiousness, neuroticism, and extraversion (Mroczek & Spiro, 2003a; Wagner, Ram,
Smith, & Gerstorf, 2016)). Further, as predicted by LDT, there is evidence for individual
Intra-individual variability in Big Five traits
10
differences in change, usually estimated with random effects for slopes (some people change
more, some less, some not at all). In the current study, we estimated both overall patterns of
change, along with estimates of individual differences in change. However, given concerns about
replicability, we further addressed the two above issues in a multi-study format, not relying on
findings based on a single study (Graham et al., 2017; Open Science Collaboration, 2015). Thus,
the current study set out to assess personality change across a range of longitudinal studies. We
identified 14 independent longitudinal studies that assessed at least a subset of the Big Five traits
at three or more measurement occasions, and using coordinated analysis, addressed the following
questions: 1) Do personality traits change over time, 2) are there individual differences in
change, and 3) are trajectories of personality change consistent across studies?
2. Methods
2.1 Samples
We used the framework of IALSA to identify participating longitudinal studies of aging
that had three or more measurement occasions of at least one of the Big Five traits. IALSA is a
platform for facilitating replication of analyses in multiple studies using longitudinal data (Hofer
& Piccinin, 2009). Longitudinal research requires years of data collection and substantial
financial resources, thereby creating substantial barriers to replication. IALSA has created a
platform for researchers to test longitudinal models in a multi-study framework, allowing some
semblance of replication (although usually not “exact” replication). The current study used a
Coordinated Analysis approach (in contrast to a Pooled Analysis), which preserves measurement
and sample heterogeneity, while allowing examination of the strengths and similarities in
associations across studies (Hofer & Piccinin, 2009).
Intra-individual variability in Big Five traits
11
We identified 14 studies that measured at least a subset of the Big Five on at least three
measurement occasions (which allows analysis using multi-level growth curve models). See
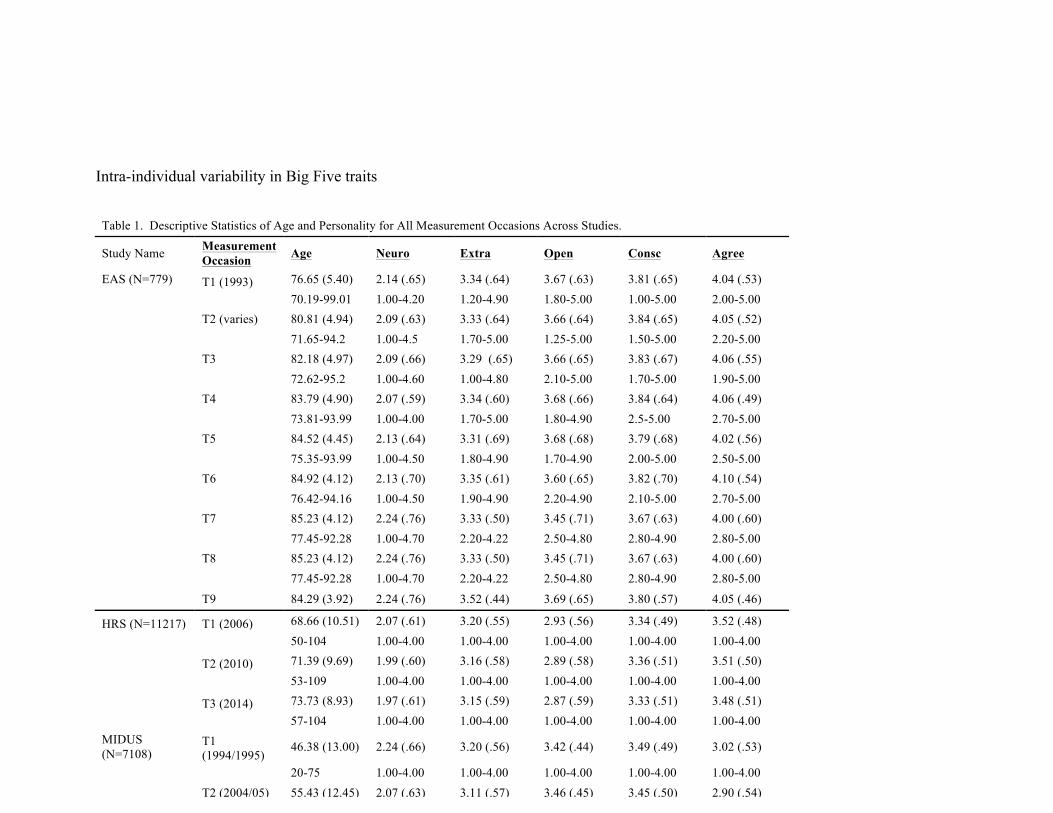
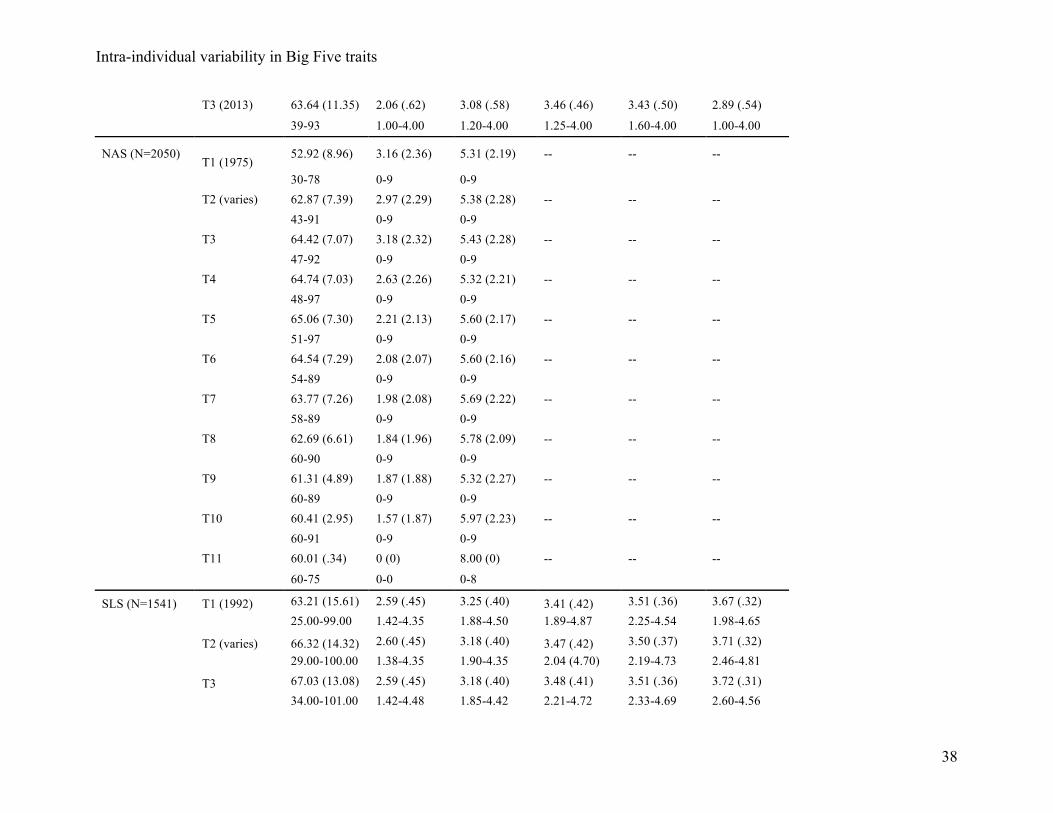
Table 1 for descriptive statistics and personality characteristics across measurement occasions
for all studies. Studies are alphabetized within region (U.S. samples and non-U.S. samples).
2.1.1 The Einstein Aging Study (EAS) is a sample of older, ethnically diverse,
community residing individuals from the Bronx. Data collection began in 1993, with rolling
enrollment. At study entry, participant age ranged from 70-99 years, with follow up occasions
every 18 months (Goldberg, 1992; Katz et al., 2012). Although some participants have as many
as 16 measurements occasions of personality, most have 3 to 5. A total of 779 participants had at
least one measurement of personality, and 297 participants had 3 or more.
2.1.2 The Health and Retirement Study (HRS) is a nationally representative longitudinal
panel study of over 20,000 adults who were surveyed every two years since 1992 (Juster &
Suzman, 1995; Sonnega et al., 2014). At personality baseline (2006), participant age ranged from
50-104 years and 59% of the sample was female. The full Big Five was assessed adjectives using
the Midlife Development Inventory, MIDI; (Lachman & Weaver, 1997) items on a subset (N =
11,217) of the full sample in 2006, 2010, and 2014.
2.1.3. The Midlife in the United States (MIDUS) study is a national sample of 7,108
adults, with a baseline age range of 28-74 years. The initial wave of measurement began in 1994-
1995, and two additional waves of data collection took place in 2004-2005 (N = 4,963), and in
2013 (N = 3,294) (Brim, Ryff, & Kessler, 2004; Lachman & Weaver, 1997). The MIDI
personality inventory (adjectives) was used to assess the full Big Five traits (Lachman &
Weaver, 1997). A total of 2,487 individuals had complete data for all three measurements
occasions of personality.
Intra-individual variability in Big Five traits
12
2.1.4. The Normative Aging Study (NAS) is a U.S. Department of Veterans Affairs
study, focused on the medical and psychosocial aspects of aging among male veterans. The
original sample consists of 2,280 men living in Boston, and upon the first measurement occasion
of personality had an age range of 30-78 years, and follow up visits occur every 3-5 years. A
total of 2,050 participants have data for the current analysis, and 1,422 have at least three
measurements of personality (Bosse, Ekerdt, & Silbert, 1984).
2.1.5 The Seattle Longitudinal Study (SLS) began in 1956 to study psychological
development in adulthood (Schaie, Willis, & Caskie, 2004). The full big five personality traits
were assessed at four measurement occasions, beginning in 2001, using the NEO-PI-R
Personality Inventory (Costa & McCrae, 1992). A total of 1,541 participants aged 25-99 at
baseline completed the initial assessment, and 639 participants completed all four.
2.1.6/7. The Wisconsin Longitudinal study contains two samples used in the current
project. The first is a sample (WLS-G) of Wisconsin residents who graduated from high school
in 1957. Data collection was started in 1957, and participants were reassessed periodically over
the following decades. Personality assessment was added to the study protocol in the early
1990’s, providing personality data for participants in 1992 (N=8,491), 2003, and 2011. Age at
baseline ranged from 51-56. A total of 4,157 participants have all three measurements of
personality. The second sample (WLS-S) is composed of a sample of siblings of these graduates.
Data collection for the sibling sample began in 1975, and personality data for these participants
(N = 4,804) were collected in 1993, 2004, and 2011 (Herd, Carr, & Roan, 2014; Sewell, Hauser,
Springer, & Hauser, 2003). Age at baseline ranged from 29-79 years. A total of 2,111
participants had all three measurements of personality.
Intra-individual variability in Big Five traits
13
2.1.8. The Berlin Aging Study (BASE) began in 1990 in Berlin (West), Germany and is
comprised of 516 adults aged 70-103 years. Neuroticism, extraversion, and openness were
assessed using six items each, selected from the NEO Personality Inventory (Costa & McCrae,
1992) at baseline, with reassessment at four additional occasions (5 total measurements) over the
following 13 years (Wagner et al., 2016). There were 132 individuals who completed three or
more measurements, and 83 participants who completed four or more measurements.
2.1.9. The Berlin Aging Study-II (BASE-II) data used in the current report came from
older adults (age range 60-84 at T1) residing in the greater Berlin (East and West), Germany
metropolitan area (Bertram et al., 2014; Gerstorf et al., 2016; Mueller et al., 2016). Starting in
2009, a total of 1,276 older participants completed up to four measurements of the full Big Five
personality traits using a short version of the Big Five Inventory (BFI; (John & Srivastava, 1999;
Lang, 2011)). 78% of these (N=1,002) contributed two or more waves of data, and 725 of these
(923) contributed three or four waves of data.
2.1.10. The Interdisciplinary Longitudinal Study of Adult Development (ILSE) has a
primary goal of understanding the individual, social, and economic predictors of healthy aging. It
is a representative sample of 1,390 individuals of two age cohort (1950-1952: middle aged adults
in their early 40s at study inception; 1930-1932: older adults in their early 60s when ILSE was
launched) in East and West Germany (Sattler et al., in press). Three measurements of the full Big
Five (NEO) were collected in 1994, 1998, and 2006. The current analysis includes 500
individuals from the older cohort (age 60-64 years at the initial personality assessment with at
least complete T1 and T3 personality data (Allemand, Zimprich, & Martin, 2008).
2.1.11. The Longitudinal Aging Study of Amsterdam (LASA) is a nationally
representative cohort sample of 5,132 older adults (age 55-85 years at baseline) in the
Intra-individual variability in Big Five traits
14
Netherlands. Of the Big Five traits, neuroticism was the sole trait collected in this sample,
assessed using The Neuroticism Scale from the Dutch Personality Questionnaire (DPQ) (Luteijn,
Starren, & Van Dijk, 2000). Four measurements of neuroticism were taken in 1992, 1995, 1998,
and 2001 (Huisman et al., 2011). A total of 1,233 participants had at least 3 measurements of
neuroticism.
2.1.12. The Lothian Birth Cohort 1936 consists of surviving members’ cohorts of the
1947, Scottish Mental Health Survey. The 1936 cohort was recruited between 2004 and 2007 by
identifying individuals from the original 1947 cohort who were residing in Edinburgh and the
surrounding areas. In total, 1,091 participants entered the studied. The current study used data
from participants who completed multiple waves of personality assessment. Personality traits
were measured using 50 items from the IPIP when participants were 67-71 years old in 2006 (N
= 1,032), and then twice more in 2008 and 2012 for a total of 3 measurement occasions (Deary,
Gow, Pattie, & Starr, 2012).
2.1.13. The OCTO-Twin study includes 351 Swedish twin pairs (702 individuals) aged
80 years and older (80-97). Original response rate, apart from individuals who did not respond
due to death, was 65%. Baseline interviews occurred between 1991 and 1993 (McClearn et al.,
1997). Four additional waves of data were collected at two-year intervals. Extraversion and
neuroticism were assessed at the first four occasions using a shortened, 19-item, version of The
Eysenck Personality Inventory (EPI; Eysenck & Eysenck, 1964). The current study includes data
from 656 individuals.
2.1.14. The Swedish Adoption/Twin Study of Aging (SATSA) began in 1984 with the
objective of studying the genetic and environmental factors associated with aging (Pedersen et
al., 1991). Personality traits (neuroticism, extraversion, and openness) were assessed 7 times
Intra-individual variability in Big Five traits
15
between 1984 and 2010 (N = 2,208), using the NEO inventory for openness, and EPI for
neuroticism and extraversion. The sample at the baseline personality measurement had an age
range of 26-93 years.
2.2 Measures.
2.2.1. Personality. All studies contained at least a subset of the Big Five, assessed via different
but reliable and validated measures of the Big Five. The International Personality Item Pool
(IPIP (Goldberg, 1981; Lachman & Weaver, 1997) was used to develop the measures for all five
traits (neuroticism, extraversion, conscientiousness, openness, agreeableness) in the LBC and
EAS. Goldberg’s adjectives were also used to create the MIDI personality inventory, which was
used in the MIDUS and HRS (Lachman & Weaver, 1997). The Eysenck Personality Inventory
(Eysenck & Eysenck, 1968) was used to measure neuroticism and extraversion in Octo-Twin,
NAS, and SATSA. The NEO (McCrae & Costa, 1987) was used to assess the Big Five in ILSE
and SLS, BASE (N-E-O only), and SATSA (Openness-only), while LASA measured
neuroticism using the neuroticism scale from the Dutch Personality Questionnaire (DPQ)
(Huisman et al., 2011). The short version of the BFI (John & Srivastava, 1999; Lang, 2011) was
used to assess the full Big Five in BASE-II and the WLS samples. Each of the scales is measured
in different units, with most on a 1-5 scale, but some used a 1-30 scale (sum scores). Models
were fit using the metric of a given sample’s measure. Subsequent to modeling, to ease
interpretation and comparability, harmonization techniques were applied. Intercepts were
converted into c-scores (Griffith et al., 2012) and slope estimates were converted into percentage
of change for plotting purposes, and comparability across studies. Both of these harmonization
techniques are “post-standardization” methods and are considered best practice when conducting
Coordinated Analysis, or even meta-analysis (Griffith et al., 2012; Hofer et al., 2013).
Intra-individual variability in Big Five traits
16
2.2.2. Age. The time metric in our trajectory models was chronological age, centered at
60 and divided by 10 (to convert to change per decade), with the exception of Octo-Twin, BASE,
BASE-II, and EAS, all of which had older samples, so these were centered at 80 (also converted
to decades). Centered age was squared for use in models estimating quadratic change.
2.3. Data Analysis.
We used the multi-level model for change, also known as individual growth or individual
trajectory modeling (Raudenbush & Bryk, 2002; Singer & Willett, 2003) to estimate trajectories
of each personality trait in each sample. We sent SAS code to each study’s analyst, to ensure that
models for each study as identical were as possible (with some variations based on study-level
characteristics; see below). The multi-level model utilizes as much information as possible, so all
time points were used in the models even if a person did not have three measurement occasions
(Raudenbush & Bryk, 2002). The models specified treated measurement occasions as nested
within person (2-level models), and were fit using maximum likelihood (ML) estimation.
We began by estimating intercept-only models, with one fixed effect for intercept (level)
and one random effect (intercept variance), plus residual, to allow computation of intra-class
correlations (rho) for each trait. The second model added the fixed and random effects of linear
slope, using (within-person) age as the time metric. We also ran models that included baseline
age (between-person) age, thus controlling for age at which people entered a given study, with
the exception of WLS-G, LBC, and ILSE, which were cohort studies and thus had a constant
between-person age (everyone had same age at entry). The results of these models were very
similar to those without baseline age, so below we report the simpler (non-adjusted) models.
Summaries of the models adjusting for baseline age can be found in the supplemental materials.
Intra-individual variability in Big Five traits
17
For the 8 studies with four or more measurement occasions of personality (NAS, EAS, LASA,
Octo-Twin, SATSA, BASE, BASE-II, and SLS), quadratic models were also estimated, with
fixed and random quadratic parameters. These linear and quadratic models, paired with meta-
analytic synthesis of trajectories, allowed us to address our first research question regarding the
shape of overall trajectories.
To address our second research question (evaluation of individual differences in
trajectories), we considered the change in model fit (likelihood ratio test) between successive
models. Many prior studies using either MLM or SEM approaches to modeling change have
used standard significance tests to test if a slope variance is non-zero, thereby implying
individual differences in rate of change. Many statistical software programs provide such a
significance test for intercept and slope variances. However, this practice has been called into
question because variances are bounded at zero (negative variances are impossible), violating the
symmetry assumption of significance test distributions (Bates, 2005). Thus, as an alternative,
model fit comparisons using likelihood ratio tests are recommended. We report those. Residual
and log likelihood comparisons from baseline models were used to determine whether there were
non-zero slope variances, hence indicating individual differences in slopes. See Table 2 for the
fitted values, change in fit indices, and random slope variance across all studies and traits.
The last step in the analysis was to model the heterogeneity of effects between studies.
This addressed our third research question. We used the R package "metafor" to evaluate the
variability in effects of each of the five traits across the 14 studies. We used a random-effects
meta-analysis, which allows variability between studies. This model calculates both tau-squared
(estimated total heterogeneity) and I2 (total heterogeneity, in percentage) to quantify
heterogeneity. Analyses were completed for each trait, and then meta-regression models were
Intra-individual variability in Big Five traits
18
estimated with moderators to assess whether study-level characteristics were associated with
heterogeneity. We focused on continent (U.S. vs. European studies) and minimum baseline age
(older[>/=60] vs. younger[<60]) as potential moderators of heterogeneity. Age was chosen as a
median, as it roughly divided the 14 studies into two equal groups.
3. Results
3.1 Intra-individual Personality Trajectories
To provide a baseline for comparing subsequent models, we first tested intercept-only
(unconditional means) models, expressed as:
Yti = π0i + εti
Where Y is personality at a given measurement occasion t for person i. This is a function of a
person-level intercept (level of trait), or π0i, plus the within-person residual, εti. The variance of
π0i, or tau, is used in conjunction with the residual to calculate the intra-class correlation (ICC),
or rho. This is the ratio of between-person variance to total variation (between-person variation +
within-person variation) in each trait. See Table 3 for the ICCs of each trait across each study.
For all five traits and across studies, the ICC ranged from 66-73%, indicating that 2/3 to 3/4 of
the total variation across persons and measurement occasions was between-person variation
(individual differences in level of trait). Thus, about one-third to a quarter is within-person
variation (the extent to which people vary from themselves). Variation in personality traits across
individuals and occasions is not simply due to differences in level among persons, but also
includes variation over measurement occasions (across time) within persons, suggesting within
person trait change.
3.2 Linear Random and Fixed Slopes
Intra-individual variability in Big Five traits
19
Our time metric, chronological age, was centered at 60 or 80 depending on the sample,
and converted to decades. It was then used in each of the 14 samples as a predictor in a linear
growth model, formally expressed as:
Yti = π0i + π1i ((Ageti -60 [or 80])/10) + εti
The two sections below describe results from these models, with the first focusing on the random
effects, and the second focusing on the fixed effects.
3.2.1 Random Effects for Intercept and Slope. Each model contained random effects for
both intercept and slope (see Tables 4-8). We focused on the random effects for slope (the slope
variances) because it was directly relevant to our second research question regarding individual
differences in change (individual variation in rate of change). As noted earlier, to determine
whether each slope variance was large enough to add a time varying covariate, we utilized a
model comparison approach (Bates, 2005; Longford, 1999). We compared the model fit between
intercept-only models and basic linear growth models (fixed effects for intercept and slope, with
corresponding random effects for each). See Table 2 for the random slope variances, residuals
and -2 Log Likelihood, along with our model comparisons: percent changes in residual and -2LL
for all traits across all studies. Some argue (Hoffman, 2015; Raudenbush & Bryk, 2002) that
adding slope parameters individually is the more statistically appropriate approach to model
comparison, however in practice, there is a negligible difference between adding the fixed effects
alone, the random effects alone, or both together. Thus, for parsimony and simplicity across
many studies, we opted to add them all at once. The likelihood ratio test between model 1
(intercept only) and model 2 (linear growth) was significant across most traits and studies. The
exceptions were LBC and Octo-Twin, which did not show substantial improvements to the
models for any trait between intercept-only and linear growth models, and BASE-II, which did
not showed improved for only for agreeableness. Additionally, residuals were reduced across
Intra-individual variability in Big Five traits
20
nearly all traits in all 14 samples, between 4-8% on average. All told, this indicates that adding
slope parameters (fixed + random) improves the fit of the models, over and above the intercept
only model. It also provides an answer to our second research question. Across traits and
samples, in most cases the improved model fit provides support for the LDT principle of
individual differences in change. The slope variances, indicating individual variation in rate of
change, were large enough across traits and samples to conclude there were individual
differences in trait change.
3.2.2 Fixed Effects for Slopes. The fixed effects for slope indicate the average rate of
change over time for a given trait in a given sample. Along with the fixed effect for intercepts,
these slopes define the general trajectory for a give sample. Across the 14 samples, these can be
aggregated to show the overall trajectory across sample, a “meta-trajectory.” This allows us to
answer our first research question.
Tables 4-8 summarize the final linear models across for each trait. Figures 1,3,5,7, and 9
illustrate the individual linear change trajectories for each trait, by study. Each figure also
includes the average trajectory across all studies, weighted by study sample size. For each trait
this single, overall “meta-trajectory” is an estimate of the population trajectory. It addresses our
first research question: what is the pattern or shape of the general trajectory for a given trait in
the nomothetic (variable-centered) sense? In order to make the individual studies more
comparable in the Figures, the axes of the figures were transformed. Because studies
administered different personality measures (e.g., NEO, IPIP, MIDI, Eysenck, BFI, DPQ) with
different scales (most are on a 1-4 scale, but some are 1-9 or 1-30), we harmonized by
transforming the intercepts of each model into c-scores. This involves subtracting the fixed effect
for intercept and dividing by the standard deviation of the trait at age 70 (selected arbitrarily as
Intra-individual variability in Big Five traits
21
an age that most samples had in common) within a given sample (Griffith et al., 2012). We
transformed estimates by the raw intercept, so the rate of change displayed in the linear Figures
represents the percent change per decade change in age. C-scoring and the resulting harmonizing
effect on slope, is a recommended method for rendering longitudinal trajectories comparable
across different samples and measures (Griffith et al., 2012; Hofer et al., 2013).
Four or more measurement occasions of personality were available in 8 studies allowing
us to fit quadratic models, which is relevant for assessing both the Maturity Principle and the
Dolce Vita effect. Note that the quadratic extraversion model for Octo-Twin did not converge,
thus these results are not reported. See Table 9 for a summary of the fixed quadratic effects and
weighted averages. Figures 2,4,6,8, and 10 display the curvilinear trends across available studies
(in raw units).
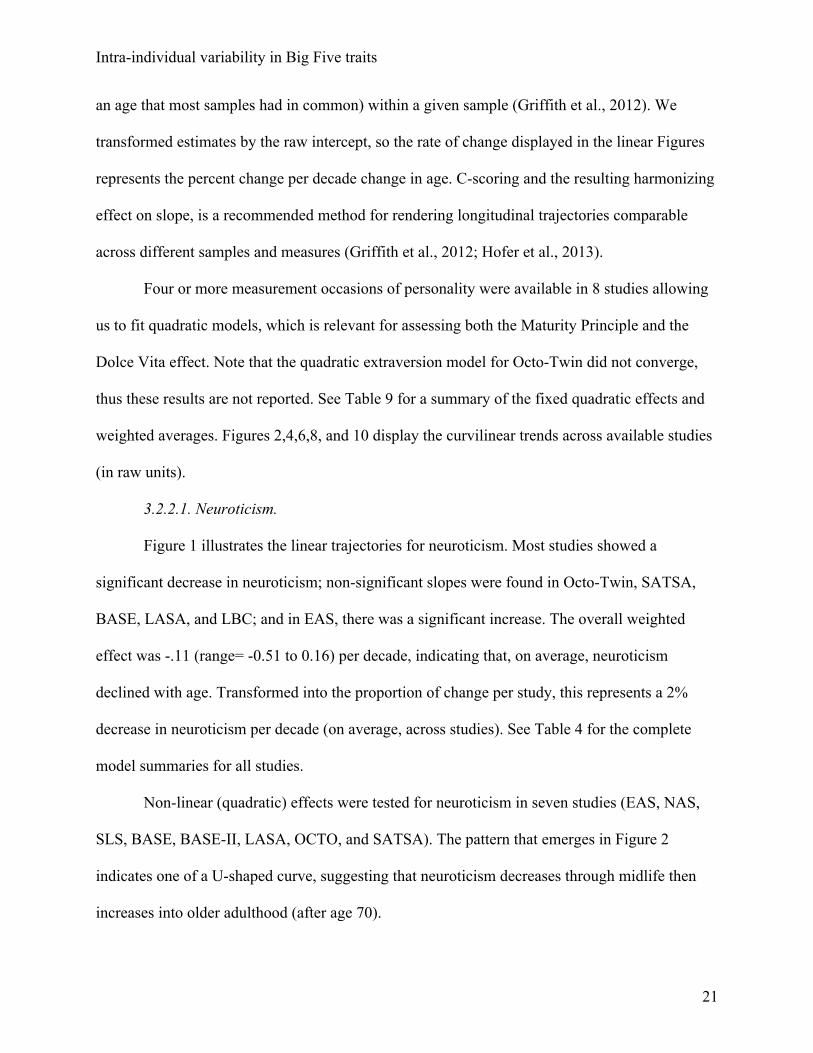
3.2.2.1. Neuroticism.
Figure 1 illustrates the linear trajectories for neuroticism. Most studies showed a
significant decrease in neuroticism; non-significant slopes were found in Octo-Twin, SATSA,
BASE, LASA, and LBC; and in EAS, there was a significant increase. The overall weighted
effect was -.11 (range= -0.51 to 0.16) per decade, indicating that, on average, neuroticism
declined with age. Transformed into the proportion of change per study, this represents a 2%
decrease in neuroticism per decade (on average, across studies). See Table 4 for the complete
model summaries for all studies.
Non-linear (quadratic) effects were tested for neuroticism in seven studies (EAS, NAS,
SLS, BASE, BASE-II, LASA, OCTO, and SATSA). The pattern that emerges in Figure 2
indicates one of a U-shaped curve, suggesting that neuroticism decreases through midlife then
increases into older adulthood (after age 70).
Intra-individual variability in Big Five traits
22
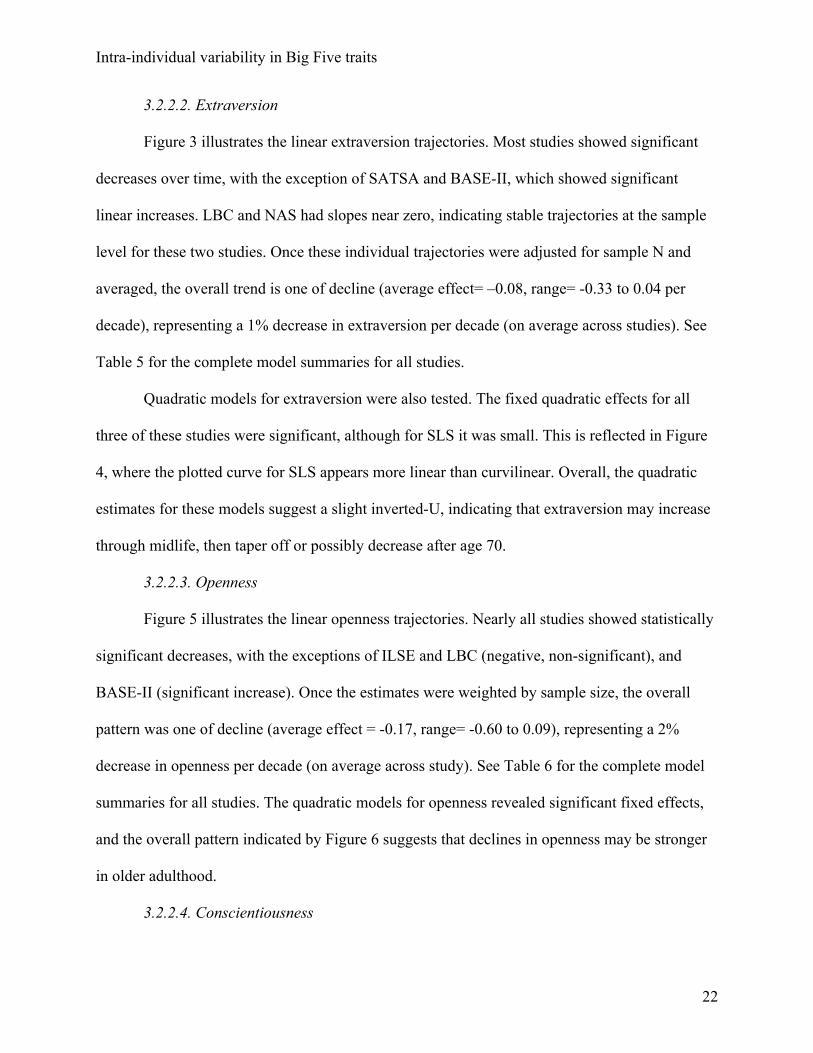
3.2.2.2. Extraversion
Figure 3 illustrates the linear extraversion trajectories. Most studies showed significant
decreases over time, with the exception of SATSA and BASE-II, which showed significant
linear increases. LBC and NAS had slopes near zero, indicating stable trajectories at the sample
level for these two studies. Once these individual trajectories were adjusted for sample N and
averaged, the overall trend is one of decline (average effect= –0.08, range= -0.33 to 0.04 per
decade), representing a 1% decrease in extraversion per decade (on average across studies). See
Table 5 for the complete model summaries for all studies.
Quadratic models for extraversion were also tested. The fixed quadratic effects for all
three of these studies were significant, although for SLS it was small. This is reflected in Figure
4, where the plotted curve for SLS appears more linear than curvilinear. Overall, the quadratic
estimates for these models suggest a slight inverted-U, indicating that extraversion may increase
through midlife, then taper off or possibly decrease after age 70.
3.2.2.3. Openness
Figure 5 illustrates the linear openness trajectories. Nearly all studies showed statistically
significant decreases, with the exceptions of ILSE and LBC (negative, non-significant), and
BASE-II (significant increase). Once the estimates were weighted by sample size, the overall
pattern was one of decline (average effect = -0.17, range= -0.60 to 0.09), representing a 2%
decrease in openness per decade (on average across study). See Table 6 for the complete model
summaries for all studies. The quadratic models for openness revealed significant fixed effects,
and the overall pattern indicated by Figure 6 suggests that declines in openness may be stronger
in older adulthood.
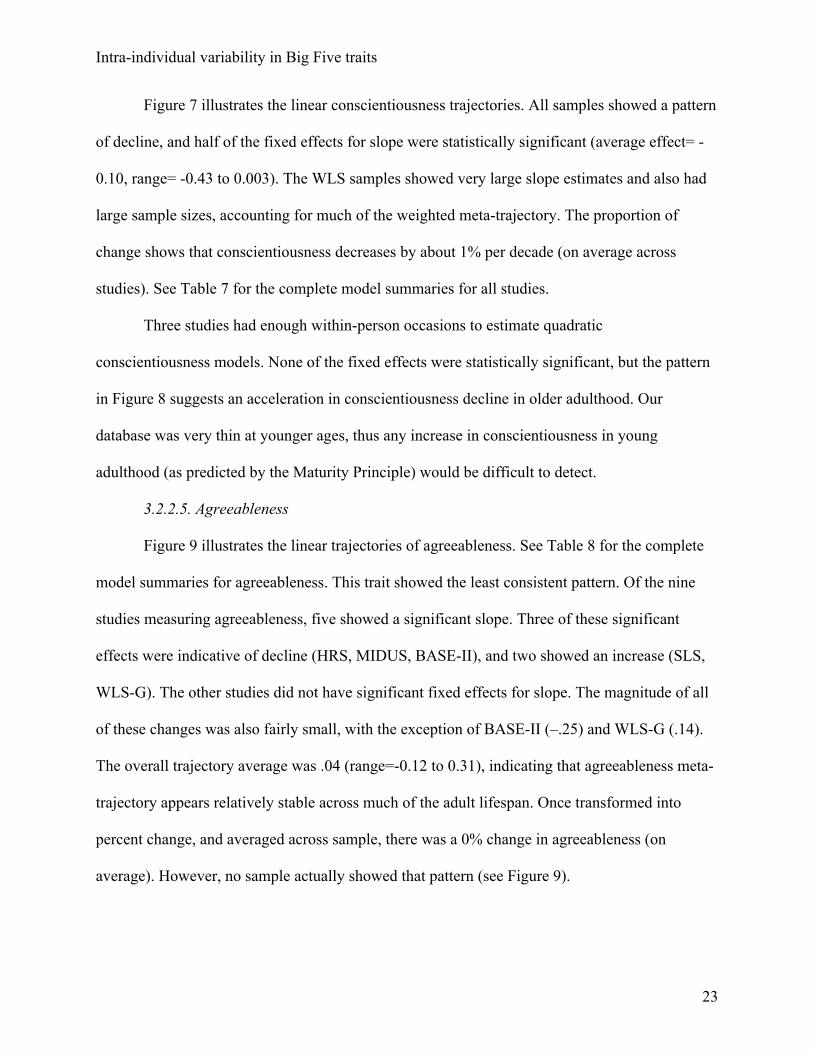
3.2.2.4. Conscientiousness
Intra-individual variability in Big Five traits
23
Figure 7 illustrates the linear conscientiousness trajectories. All samples showed a pattern
of decline, and half of the fixed effects for slope were statistically significant (average effect= -
0.10, range= -0.43 to 0.003). The WLS samples showed very large slope estimates and also had
large sample sizes, accounting for much of the weighted meta-trajectory. The proportion of
change shows that conscientiousness decreases by about 1% per decade (on average across
studies). See Table 7 for the complete model summaries for all studies.
Three studies had enough within-person occasions to estimate quadratic
conscientiousness models. None of the fixed effects were statistically significant, but the pattern
in Figure 8 suggests an acceleration in conscientiousness decline in older adulthood. Our
database was very thin at younger ages, thus any increase in conscientiousness in young
adulthood (as predicted by the Maturity Principle) would be difficult to detect.
3.2.2.5. Agreeableness
Figure 9 illustrates the linear trajectories of agreeableness. See Table 8 for the complete
model summaries for agreeableness. This trait showed the least consistent pattern. Of the nine
studies measuring agreeableness, five showed a significant slope. Three of these significant
effects were indicative of decline (HRS, MIDUS, BASE-II), and two showed an increase (SLS,
WLS-G). The other studies did not have significant fixed effects for slope. The magnitude of all
of these changes was also fairly small, with the exception of BASE-II (–.25) and WLS-G (.14).
The overall trajectory average was .04 (range=-0.12 to 0.31), indicating that agreeableness meta-
trajectory appears relatively stable across much of the adult lifespan. Once transformed into
percent change, and averaged across sample, there was a 0% change in agreeableness (on
average). However, no sample actually showed that pattern (see Figure 9).
Intra-individual variability in Big Five traits
24
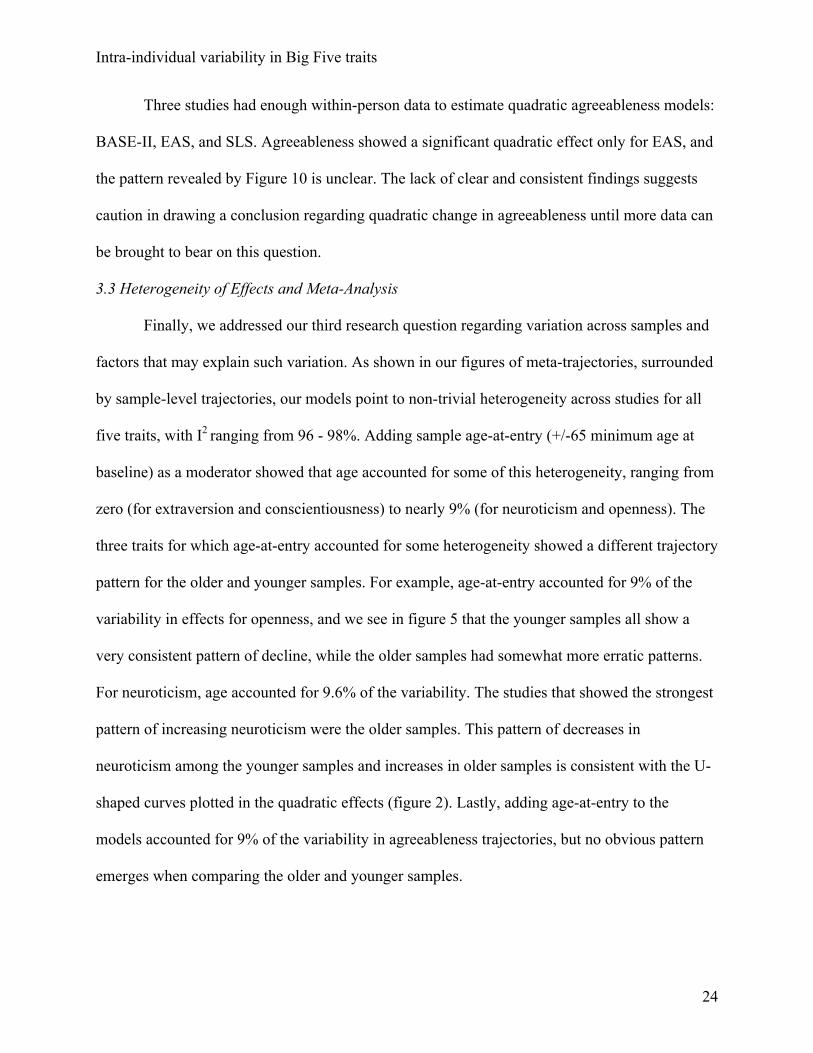
Three studies had enough within-person data to estimate quadratic agreeableness models:
BASE-II, EAS, and SLS. Agreeableness showed a significant quadratic effect only for EAS, and
the pattern revealed by Figure 10 is unclear. The lack of clear and consistent findings suggests
caution in drawing a conclusion regarding quadratic change in agreeableness until more data can
be brought to bear on this question.
3.3 Heterogeneity of Effects and Meta-Analysis
Finally, we addressed our third research question regarding variation across samples and
factors that may explain such variation. As shown in our figures of meta-trajectories, surrounded
by sample-level trajectories, our models point to non-trivial heterogeneity across studies for all
five traits, with I2 ranging from 96 - 98%. Adding sample age-at-entry (+/-65 minimum age at
baseline) as a moderator showed that age accounted for some of this heterogeneity, ranging from
zero (for extraversion and conscientiousness) to nearly 9% (for neuroticism and openness). The
three traits for which age-at-entry accounted for some heterogeneity showed a different trajectory
pattern for the older and younger samples. For example, age-at-entry accounted for 9% of the
variability in effects for openness, and we see in figure 5 that the younger samples all show a
very consistent pattern of decline, while the older samples had somewhat more erratic patterns.
For neuroticism, age accounted for 9.6% of the variability. The studies that showed the strongest
pattern of increasing neuroticism were the older samples. This pattern of decreases in
neuroticism among the younger samples and increases in older samples is consistent with the U-
shaped curves plotted in the quadratic effects (figure 2). Lastly, adding age-at-entry to the
models accounted for 9% of the variability in agreeableness trajectories, but no obvious pattern
emerges when comparing the older and younger samples.
Intra-individual variability in Big Five traits
25
Sorting the effects by continent also revealed an interesting pattern across samples. The
variation in heterogeneity, sorted by continent, ranged from 0% (neuroticism) to 14%
(agreeableness). For extraversion, the U.S. studies have a more consistent pattern of decline,
while the European studies tended to be more inconsistent. For openness and conscientiousness,
less than 3% of heterogeneity was attributable to continent. European-based samples deviated the
most from the overall openness meta-trajectory.
Another factor that potentially impacted heterogeneity was the scaling of personality
measures in a given sample. Many of the studies scored their personality scales from 1-4 or 1-5,
but several were on a 1-9 or 1-30 scale. We added scale length as a potential moderator of
heterogeneity (contrasting studies whose scale maximum was</=5 vs. >5), but this did not
account for substantial variation in the effects.
When looking at strictly the proportion of change, as plotted in the figures, and seen in
the far right column of the model tables, the percent ranged from -.10 to .05. For neuroticism,
nearly all studies showed a decrease, and the majority of studies were clustered in the 3-5%
range. For extraversion, openness, and conscientiousness, the majority of studies were clustered
in the 1-3% decline range. Agreeableness showed the greatest mix of increasing and decreasing
slopes, but two-thirds of the studies showed a 0-1% increase.
4. Discussion
The three primary aims of this Coordinated Analysis were to: 1) estimate overall change
in Big Five personality traits through fixed effects that define sample-level trajectories, and via
meta-trajectories that synthesized the various sample trajectories, 2) assess individual differences
in change through random effects that define the variation around the fixed effects, and 3) to
compare these trajectories across the samples and evaluate sample-based characteristics (e.g.
Intra-individual variability in Big Five traits
26
country of origin, age-at-entry) that may explain heterogeneity in trajectories. Using the
infrastructure of the IALSA, and a Coordinated Analysis approach (Hofer & Piccinin, 2009), we
identified 14 longitudinal samples in which Big Five personality traits were measured three or
more times, providing an opportunity to estimate a set of 14 replications (although not exact
replications). Using the multi-level model for change (Singer & Willett, 2003), we identified
patterns in overall change and in individual variation in change for Big Five personality traits
across a wide expanse of adulthood, although mostly older adulthood.
4.1 Meta-trajectories of Personality Change
Our consideration of overall trajectories (sample-level and meta-trajectories) showed
nomothetic, or variable-centered, personality change over time for each of the Big Five traits,
except agreeableness. The meta-trajectory for agreeableness indicated stability, yet all of the
sample-level trajectories showed increases or decreases, and in some cases very substantial
changes. For the other traits, we observed more congruence between the meta-trajectory and the
specific sample trajectories, with neuroticism, conscientiousness, extraversion and openness all
showing decline over the lifespan (decreasing by about 1-2% per decade). Many of these
findings are consistent with the Dolce Vita theory (Marsh et al., 2013), and the lifespan decline
in neuroticism is consistent with the Maturity Principle (Roberts et al., 2006). More appropriate
testing of the Maturity Principle was enabled by our quadratic models, which were only possible
in a subset of the 14 samples. There was very slight evidence of young adulthood increases in
extraversion and conscientiousness, along with young adult and midlife declines in neuroticism.
However, we must again point out that our databases were skewed toward older adulthood and
were thin with respect to young adult data. It would be premature to discard the Maturity
Principle theory based on the samples used here.
Intra-individual variability in Big Five traits
27
4.2 Individual Differences in Personality Change
With respect to our second aim, we identified individual differences in personality
change in nearly all 14 samples. The exceptions to this are limited almost entirely to two studies:
Octo-Twin and LBC. There were also single traits within single samples that did not show
evidence of individual variation in change (e.g., openness in EAS or ILSE; agreeableness in
MIDUS). Yet for the vast majority of traits and samples, there was support (from model fit
comparisons) for the lifespan development theoretical principle of individual differences in intra-
individual change (Baltes, 1987). Not everyone changes at the same rate, or in the same
direction. This idea forms the basis of ongoing efforts to identify predictors of personality
change (Bleidorn et al., 2009).
4.3 Variation in Trajectories Over Samples
We observed statistical heterogeneity, as assessed by I2, across samples and attempted to
account for this variability using country of origin and age-at-entry as moderators in a meta-
regression. These findings indicated that sample age-at-entry explains part of the variability in
neuroticism, openness, and agreeableness trajectories. For neuroticism trajectories, studies with a
younger mean entry age showed a pattern of decline, whereas studies with older mean entry
tended to show increases. This is consistent with the quadratic results which suggest decline on
neuroticism through most of the adult lifespan, with an uptick in the final years of life. For
openness trajectories, we found that most of the heterogeneity across samples was concentrated
among older samples, while younger samples showed more consistent decline. Country (or more
accurately, continent) was a factor in accounting for variability in extraversion trajectories.
Studies based in the United States had a more consistent pattern of decline in extraversion, while
the European studies displayed more variability in trajectories. This could be due to the fact that
Intra-individual variability in Big Five traits
28
U.S. culture tends to place great value on high extraversion, so younger adults may be more
likely to increase on extraversion or may simply be more inclined to endorse extraversion items.
However, as people grow older and pull back from societal expectations, declines in extraversion
may become more likely. In European-based samples, these societal expectations may have less
force, having the effect of producing greater variation in sample-level trajectories. It is also
possible that part of the heterogeneity among samples reflect historical changes in how
personality manifests and develops. We note that some data collection in some studies took place
in historically different time periods, with personality assessments having started in the 1970s in
some samples (such as the NAS) and the 1980s in others (such as the SATSA), whereas other
studies did not launch until 2009 (e.g., BASE-II).
Our quadratic models also provide a more nuanced picture. Looking across the studies for
a given trait, we see a pattern suggesting that extraversion may increase through middle age
before declining in older adulthood. A similar pattern may hold for conscientiousness, although
conclusions are tentative due to having only three studies with four or measurement occasions on
conscientiousness. However, the patterns for extraversion and conscientiousness support both
theoretical frameworks discussed earlier, namely the maturation principle (Caspi et al., 2005;
Roberts et al., 2006), and the Dolce Vita effect (Marsh et al., 2013). One posits increases in
certain traits in youth when the demands of a person’s life require optimal conscientiousness and
extraversion, the other argues for declines in older adulthood as these demands wane. Roberts et
al., (2006) and Roberts and Mroczek (2008) showed plots of means across adult ages that
indicated lifelong increases in extraversion and conscientiousness. These databases were thin
with respect to older adulthood, whereas our database were thinner with respect to younger
Intra-individual variability in Big Five traits
29
adulthood. Putting the two together paints a portrait of curvilinear effects with peaks at midlife
for both of these traits.
4.4 The Value of Coordinated Analysis
Lastly, these findings demonstrate the value of Coordinated Analysis as a technique for
replicating long-term longitudinal findings that otherwise would be very difficult to replicate in a
reasonable time frame (some have even called this technique “Coordinated Replication”). It
establishes a moderately-sized group of replications, along with synthesized products such as
meta-trajectories, both of which enhance the reproducibility and robustness of future work.
Coordinated Analysis has the additional advantage of preserving the heterogeneity in trajectories,
as well as permitting analyses (meta-regressions) that identify factors that explain differences
across samples. Pooling of data is an alternative technique and can be quite valuable (Jokela,
Pulkki-Raback, Elovainio, & Kivimaki, 2014) but has the limitation of not preserving
heterogeneity. Pooling data from large numbers of studies (such as the 14 used here) presents
unique challenges with respect to data harmonization, and therefore tend to use smaller number
of studies. By contrast, single-study analysis has its own challenges. Any one of the 14 samples
used here could have comprised a publication on its own, with some claiming a given trait
increases, other claiming a decrease, and still others arguing that a trait does not change at all.
This has the potential to sow great confusion. For example, if LBC or ILSE published their
results as a single study paper, they would conclude that personality remains stable. However,
when considered as a group with other samples, a fuller picture emerges.
4.5 Limitations
We attempted to make our models as comparable as possible, yet shortcomings remained.
In interpreting the models, we faced two major challenges. First, the intercepts (and thus the
Intra-individual variability in Big Five traits
30
plots of the trajectories) were different depending on the way personality was scaled for each
study. Pre-standardizing key trajectory variables (outcomes and time metrics) is considered less
desirable than post-standardizing (Griffith et al., 2012). Thus we post-standardized intercepts and
converted the slope estimates to percentages. This allowed us to plot and interpret the similarities
in change across the studies. The second challenge we faced was comparing the slope variances
across studies. The slope variance component from each model can be affected by sample size
and by scaling differences, so we could not compare the random slope variances in terms of
absolute differences (Bates, 2005). We reported the slope variances for each trait across studies,
but ultimately used a model-comparison of the likelihood ratio tests to determine whether there
was substantive individual variance in random slopes (Graham et al., 2017; Hofer & Piccinin,
2009).
4.6 Conclusion
Across 14 diverse longitudinal studies, we observed change in the Big Five personality
traits. Linear models suggested that neuroticism, conscientiousness, extraversion, and openness
all declined on average, while agreeableness remained stable. Quadratic models, albeit based on
a subset of samples, pointed to midlife peaks for extraversion and conscientiousness and
potential increases in neuroticism late in life. Nearly all samples showed individual differences in
change for all five traits. Age of samples (cohort) and country or continent of origin accounted
for some of the variation in sample trajectories. Lastly, we believe our Coordinated Analysis (a
“meta-study” essentially) makes three primary contributions. The first is empirical. We brought
to bear a great deal of data to address continuing issues regarding personality development over
the lifespan. The second centers on replication and current concern regarding reproducibility and
robustness. We used a multi-study framework that by its very nature was designed to promote
Intra-individual variability in Big Five traits
31
replicability. This is particularly important at this point in the history of our science, given the
lack of replicability in many areas of psychology and other fields. Third, our analyses advance
current theory in lifespan personality development. Our findings were consistent with the Dolce
Vita effect (Marsh et al., 2013). There was more limited support for the Maturity Principle, but
this may have been due to the heavy skew of our samples toward older adulthood. Theoretically,
it may be the case that different theories of personality development are needed for different
segments of the lifespan. However, what would be most desirable is a unified theory that
explicitly addresses curvilinearity and can account for the ups and downs in personality traits
over the course of life. No such theory exists, yet the empirical, replication-enhanced findings
reported here call out for it.
Intra-individual variability in Big Five traits
32
References
Allemand, M., Zimprich, D., & Martin, M. . (2008). Long-term correlated change in personality traits in old age. Psychol Aging, 23(3), 545.
Baltes, P.B. (1987). Theoretical propositions of life-span developmental psychology: On the dynamics between growth and decline. Dev Psychol, 23(5), 611-626.
Baltes, P.B., Lindenberger, U., & Sataudinger, U. (2006). Life span theory in developmental psychology. In W. Damon & R. Lerner (Eds.), Handbook of Child Psychology: Theoretical Models of Human Development (pp. 569-595). New Jersey: John Wiley & Sons, Inc.
Baltes, P.B., Reese, H.W., & Nesselroade, J.R. (1977). Life-span developmental psychology: Introduction to research methods.
Bates, D. (2005). Fitting linear mixed models in R. Internationalization Features of R 2.1. 0, 27. Berg, A. I., & Johansson, B. (2014). Personality Change in the Oldest-Old: Is It a Matter of
Compromised Health and Functioning? J Pers, 82(1), 25-31. doi:10.1111/jopy.12030 Bertram, L., Böckenhoff, A., Demuth, I., Düzel, S., Eckardt, R. , Li, S.C., . . . Steinhagen-
Thiessen, E. (2014). Cohort Profile: The Berlin Aging Study II (BASE-II). International Journal of Epidemiology, 43(3), 703-712. doi:https://doi.org/10.1093/ije/dyt018
Bleidorn, W., Kandler, C., Riemann, R., Spinath, F. M., & Angleitner, A. (2009). Patterns and sources of adult personality development: growth curve analyses of the NEO PI-R scales in a longitudinal twin study. J Pers Soc Psychol, 97(1), 142-155. doi:10.1037/a0015434
Bleidorn, W., Klimstra, T. A., Denissen, J. J., Rentfrow, P. J., Potter, J., & Gosling, S. D. (2013). Personality maturation around the world: a cross-cultural examination of social-investment theory. Psychol Sci, 24(12), 2530-2540. doi:10.1177/0956797613498396
Bosse, R., Ekerdt, D., & Silbert, J. (1984). The Veterans Administration Normative Aging Study. In S.A. Mednick, M. Harway, & K.M. Finello (Eds.), Handbook of Longitudinal Research: Vol. 2. Teenage and Adult Cohorts (pp. 273-289). New York: Praeger.
Brim, O.G., Ryff, C. D., & Kessler, R. C. (2004). How Healthy Are We? A National Study of Well-Being at Midlife. Chicago: University of Chicago Press.
Caspi, A., Roberts, B. W., & Shiner, R. L. (2005). Personality development: stability and change. Annu Rev Psychol, 56, 453-484. doi:10.1146/annurev.psych.55.090902.141913
Costa, P.T., & McCrae, R. R. (1986). Personality stability and its implications for clinical psychology. Clinical Psychology review, 6(5), 407-423.
Costa, P.T., & McCrae, R.R. (1992). Normal personality assessment in clinical practice: The NEO Personality Inventory. Psychol Assess, 4(1), 5-13.
Costa, P.T., & McCrae, R.R. . (1980). Still stable after all these years: Personality as a key to some issues in adulthood and old age. . Life-span development and behavior.
Deary, I. J., Gow, A. J., Pattie, A., & Starr, J. M. (2012). Cohort profile: the Lothian Birth Cohorts of 1921 and 1936. Int J Epidemiol, 41(6), 1576-1584. doi:10.1093/ije/dyr197
Eysenck, H.J., & Eysenck, S.B.G. (1968). Manual for the Eysenck Personality Inventory. San Diego, CA: Educational and Industrial Testing Service.
Gerstorf, D., Bertram, L., Lindenberger, U., Pawelec, G., Demuth, I., Steinhagen-Thiessen, E., & Wagner, G. G. (2016). Editorial. Gerontology, 62, 311-315. doi:doi:10.1159/000441495
Goldberg, L.R. (1981). Language and individual differences: The search for universal in personality lexicons. . In L. Wheeler (Ed.), Review of Personality and Social Psychology (pp. 141-165). Beverly Hills, CA: Sage.
Intra-individual variability in Big Five traits
33
Goldberg, L.R. (1992). The development of markers for the Big Five factor structure. Psychol Assess, 4, 26-42.
Graham, E.K., & Lachman, M.E. (2012). Personality stability is associated with better cognitive performance in adulthood: Are the stable more able? Journals of Gerontology: Series B: Psychological Sciences and Social Sciences, 67B(5), 545-554. doi:10.1093/geronb/gbr149
Graham, E.K., Rutsohn, J. P., Turiano, N. A., Bendayan, R., Batterham, P. J., Gerstorf, D., . . . Mroczek, D. (2017). Personality predicts mortality risk: An integrative data analysis of 15 international longitudinal studies. J Res Pers, 70, 174-186.
Griffith, L., van den Heuvel, E., Fortier, I., Hofer, S. M., Raina, P., Sohel, N., . . . Belleville, S. (2012). Harmonization of Cognitive Measures in Individual Participant Data and Aggregate Data Meta-Analysis: Methods Research Report. Retrieved from McMaster University Evidence-based Practice Center, Hamilton, Ontario, Canada:
Helson, R., Jones, C., & Kwan, V.S.Y. (2002). Personality change over 40 years of adulthood: Hierarchical linear modeling analyses of two longitudinal samples. . Journal of Personality and Social Psychology, 83(3), 752-766.
Herd, P., Carr, D., & Roan, C. (2014). Cohort profile: Wisconsin longitudinal study (WLS). Int J Epidemiol, 43(1), 34-41. doi:10.1093/ije/dys194
Hofer, S. M., & Piccinin, A. M. (2009). Integrative data analysis through coordination of measurement and analysis protocol across independent longitudinal studies. Psychol Methods, 14(2), 150-164. doi:10.1037/a0015566
Hoffman, L. (2015). Longitudinal analysis: Modeling within-person fluctuation and change: Routledge.
Huisman, M., Poppelaars, J., van der Horst, M., Beekman, A. T., Brug, J., van Tilburg, T. G., & Deeg, D. J. (2011). Cohort profile: the Longitudinal Aging Study Amsterdam. Int J Epidemiol, 40(4), 868-876. doi:10.1093/ije/dyq219
Human, L. J., Biesanz, J. C., Miller, G. E., Chen, E., Lachman, M. E., & Seeman, T. E. (2013). Is change bad? Personality change is associated with poorer psychological health and greater metabolic syndrome in midlife. J Pers, 81(3), 249-260. doi:10.1111/jopy.12002
John, O. P., & Srivastava, S. . (1999). The Big Five trait taxonomy: History, measurement, and theoretical perspectives. Handbook of personality: Theory and research, 2, 102-138.
Jokela, M., Pulkki-Raback, L., Elovainio, M., & Kivimaki, M. (2014). Personality traits as risk factors for stroke and coronary heart disease mortality: pooled analysis of three cohort studies. J Behav Med, 37(5), 881-889. doi:10.1007/s10865-013-9548-z
Juster, F.T. , & Suzman, R. (1995). An overview of the Health and Retirement Study. The Journal of Human Resources: Special Issue on the Health and Retirement Study: Data Quality and Early Results, 30.
Katz, M.J., Lipton, R.B., Hall, C.B., Zimmerman, M.E., Sanders, A.E., Verghese, J., . . . Derby, C.A. (2012). Age-specific and sex-specific prevalence and incidence of mild cognitive impairments, dementia, and Alzehimer dementia in blacks and whites: A report from the Einstein Aging Study. Alzheimer Disease Association Disorders, 26(4), 335-343. doi:10.1097/WAS.0b013e31823dbcfc.
Lachman, M. E., & Weaver, S.L. (1997). The Midlife Development Inventory (MIDI) personality scale: Scale construction and scoring Retrieved from Waltham, MA:
Lang, F. R., John, D., Lüdtke, O., Schupp, J., & Wagner, G. G. (2011). Short assessment of the Big Five: Robust across survey methods except telephone interviewing. Behavior
Intra-individual variability in Big Five traits
34
research methods, 43(2), 548-567. (2011). Short assessment of the Big Five: Robust across survey methods except telephone interviewing. Behavior research methods, 43(2), 548-567.
Longford, N.T. (1999). Standard errors in multi-level analysis. multilevel Modeling Newsletter, 11(1), 10-13.
Luteijn, F., Starren, J. C. M. G., & Van Dijk, H. (2000). Handleiding Nederlandse Persoonlijkheids Vragenlijst, NPV (herziene uitgave).[Manual Dutch Personality Questionnaire, NPV (revised ed.)].
Marsh, H. W., Nagengast, B., & Morin, A. J. (2013). Measurement invariance of big-five factors over the life span: ESEM tests of gender, age, plasticity, maturity, and la dolce vita effects. Dev Psychol, 49(6), 1194-1218. doi:10.1037/a0026913
McClearn, G.E., Johansson, B., Berg, S., Pedersen, N.L., Ahern, F., Petrill, S.A., & Plomin, R. (1997). Substantial genetic influence on cognitive abilities in twins 80 or more years old Science, 276, 1560-1563.
McCrae, R.R., & Costa, P. T. (1994). The stability of personality: Observations and evaluations. Current Directions in Psychological Science, 3(6), 173-175.
McCrae, R.R., & Costa, P. T., Jr. (1987). Validation of the Five Factor Model of Personality Across Instruments and Observers. Journal of Personality and Social Psychology, 52(1), 81-90.
Mischel, W. (1969). Continuity and Change in Personality. American Psychologist. Mischel, W. (1977). On the future of personality measurement. American Psychologist, 32(4),
246. Mroczek, D. K., Almeida, D. M., Spiro, A., & Pafford, C. (2006). Modeling intraindividual
stability and change in personality. In D. K. Mroczek & T.D. Little (Eds.), Handbook of personality development (pp. 163-180). Mahwah, NJ: Lawrence Erlbaum Associates.
Mroczek, D. K., & Spiro, A. (2003a). Modeling intraindividual change in personality traits: Findings from the Normative Aging Study. Journals of Gerontology: Psychological Sciences, 58, 153-165.
Mroczek, D. K., & Spiro, A. (2003b). Modeling intraindividual change in personality traits: Findings from the normative aging study. Journal of Gerontology: Psychological Sciences, 58B(3), P153-P165.
Mroczek, D. K., & Spiro, A. (2007). Personality change influences mortality in older men. Psychological Science, 18(5), 371-376.
Mueller, Swantje, Wagner, Jenny, Drewelies, Johanna, Duezel, Sandra, Eibich, Peter, Specht, Jule, . . . Gerstorf, Denis. (2016). Personality development in old age relates to physical health and cognitive performance: Evidence from the Berlin Aging Study II. J Res Pers, 65, 94-108. doi:10.1016/j.jrp.2016.08.007
Muhlig-Versen, A., Bowen, C. E., & Staudinger, U. M. (2012). Personality plasticity in later adulthood: contextual and personal resources are needed to increase openness to new experiences. Psychol Aging, 27(4), 855-866. doi:10.1037/a0029357
Open Science Collaboration, OSC. (2015). PSYCHOLOGY. Estimating the reproducibility of psychological science. Science, 349(6251), aac4716. doi:10.1126/science.aac4716
Pedersen, N. L., McClearn, G. E., Plomin, R., Nesselroade, J. R., Berg, S., & deFaire, U. (1991). The Swedish Adoption Twin Study of Aging: An Update. Acta Genetica Medicae et Gemmellologiae, 40, 7-20.
Intra-individual variability in Big Five traits
35
Pedersen, N. L., & Reynolds, C. A. (1998). Stability and Change in Adult Personality: Genetic and Environmental Components. European Journal of Personality, 12, 365-386.
Raudenbush, S.W., & Bryk, A.S. (2002). Hierarchical linear models: Applications and data analysis methods (2 ed.). Thousand Oaks, CA: Sage.
Roberts, B.W., & Mroczek, D. (2008). Personality Trait Change in Adulthood. Curr Dir Psychol Sci, 17(1), 31-35. doi:10.1111/j.1467-8721.2008.00543.x
Roberts, B.W., Walton, K.E., & Viechtbauer, W. (2006). Patterns of mean-level change in personality traits across the life course: a meta-analysis of longitudinal studies. Psychol Bull, 132(1), 1-25. doi:10.1037/0033-2909.132.1.1
Roberts, B.W., Wood, D., & Caspi, A. (2008). The development of personality traits in adulthood Handbook of personality: Theory and research (Vol. 3, pp. 375-398).
Roberts, B.W., Wood, D., & Smith, J.L. (2005). Evaluating Five Factor Theory and social investment perspectives on personality trait development. J Res Pers, 39(1), 166-184. doi:10.1016/j.jrp.2004.08.002
Sattler, C., Wahl, H.-W., Schröder, J., Kruse, A., Schönknecht, P., Kunzmann, U., . . . Zenthöfer, A. . (in press). Interdisciplinary Longitudinal Study on Adult Development and Aging (ILSE). In N. Pachana (Ed.), Encyclopedia of Geropsychology. New York: Springer.
Schaie, K.W., Willis, S.L., & Caskie, G.I.L. (2004). The Seattle Longitudinal Study: Relationship between personality and cognition. Aging Neuropsychology and Cognition, 11(2-3), 304-424. doi:10.1080/13825580490511134
Sewell, W.H., Hauser, R.M., Springer, K.W., & Hauser, T.S. (2003). As We Age: A Review of the Wisconsin Longitudinal Study. Research in Social Stratification and mobility, 20, 3-111.
Singer, J. D., & Willett, J. B. (2003). Applied longitudinal data analysis: Modeling change and event occurrence: Oxford university press.
Sonnega, A., Faul, J. D., Ofstedal, M. B., Langa, K. M., Phillips, J. W., & Weir, D. R. (2014). Cohort profile: the Health and Retirement Study (HRS). International Journal of Epidemiology, 43(2), 576-585.
Steiger, A. E., Allemand, M., Robins, R. W., & Fend, H. A. (2014). Low and decreasing self-esteem during adolescence predict adult depression two decades later. J Pers Soc Psychol, 106(2), 325-338. doi:10.1037/a0035133
Terracciano, A., McCrae, R. R., Brant, L. J., & Costa, P. T., Jr. (2005). Hierarchical linear modeling analyses of the NEO-PI-R scales in the Baltimore Longitudinal Study of Aging. Psychol Aging, 20(3), 493-506. doi:10.1037/0882-7974.20.3.493
Turiano, N. A., Pitzer, L., Armour, C., Karlamangla, A., Ryff, C. D., & Mroczek, D. K. (2012). Personality trait level and change as predictors of health outcomes: findings from a national study of Americans (MIDUS). Journal of Gerontology: Series B: Psychological Sciences and Social Sciences, 67(1), 4-12. doi:10.1093/geronb/gbr072
Vaidya, J. G., Gray, E. K., Haig, J. R., Mroczek, D. K., & Watson, D. (2008). Differential stability and individual growth trajectories of big five and affective traits during young adulthood. J Pers, 76(2), 267-304. doi:10.1111/j.1467-6494.2007.00486.x
Vecchione, Michele, Alessandri, Guido, Barbaranelli, Claudio, & Caprara, Gianvittorio. (2012). Gender differences in the Big Five personality development: A longitudinal investigation from late adolescence to emerging adulthood. Personality and Individual Differences, 53(6), 740-746. doi:10.1016/j.paid.2012.05.033

Intra-individual variability in Big Five traits
36
Wagner, J., Ram, N., Smith, J., & Gerstorf, D. (2016). Personality trait development at the end of life: Antecedents and correlates of mean-level trajectories. J Pers Soc Psychol, 111(3), 411-429. doi:10.1037/pspp0000071
Intra-individual variability in Big Five traits
37
Table 1. Descriptive Statistics of Age and Personality for All Measurement Occasions Across Studies.
Study Name Measurement Occasion Age Neuro Extra Open Consc Agree
EAS (N=779) T1 (1993) 76.65 (5.40) 2.14 (.65) 3.34 (.64) 3.67 (.63) 3.81 (.65) 4.04 (.53)
70.19-99.01 1.00-4.20 1.20-4.90 1.80-5.00 1.00-5.00 2.00-5.00
T2 (varies) 80.81 (4.94) 2.09 (.63) 3.33 (.64) 3.66 (.64) 3.84 (.65) 4.05 (.52)
71.65-94.2 1.00-4.5 1.70-5.00 1.25-5.00 1.50-5.00 2.20-5.00
T3 82.18 (4.97) 2.09 (.66) 3.29 (.65) 3.66 (.65) 3.83 (.67) 4.06 (.55)
72.62-95.2 1.00-4.60 1.00-4.80 2.10-5.00 1.70-5.00 1.90-5.00
T4 83.79 (4.90) 2.07 (.59) 3.34 (.60) 3.68 (.66) 3.84 (.64) 4.06 (.49)
73.81-93.99 1.00-4.00 1.70-5.00 1.80-4.90 2.5-5.00 2.70-5.00
T5 84.52 (4.45) 2.13 (.64) 3.31 (.69) 3.68 (.68) 3.79 (.68) 4.02 (.56)
75.35-93.99 1.00-4.50 1.80-4.90 1.70-4.90 2.00-5.00 2.50-5.00
T6 84.92 (4.12) 2.13 (.70) 3.35 (.61) 3.60 (.65) 3.82 (.70) 4.10 (.54)
76.42-94.16 1.00-4.50 1.90-4.90 2.20-4.90 2.10-5.00 2.70-5.00
T7 85.23 (4.12) 2.24 (.76) 3.33 (.50) 3.45 (.71) 3.67 (.63) 4.00 (.60)
77.45-92.28 1.00-4.70 2.20-4.22 2.50-4.80 2.80-4.90 2.80-5.00
T8 85.23 (4.12) 2.24 (.76) 3.33 (.50) 3.45 (.71) 3.67 (.63) 4.00 (.60)
77.45-92.28 1.00-4.70 2.20-4.22 2.50-4.80 2.80-4.90 2.80-5.00 T9 84.29 (3.92) 2.24 (.76) 3.52 (.44) 3.69 (.65) 3.80 (.57) 4.05 (.46)
HRS (N=11217) T1 (2006) 68.66 (10.51) 2.07 (.61) 3.20 (.55) 2.93 (.56) 3.34 (.49) 3.52 (.48)
50-104 1.00-4.00 1.00-4.00 1.00-4.00 1.00-4.00 1.00-4.00
T2 (2010) 71.39 (9.69) 1.99 (.60) 3.16 (.58) 2.89 (.58) 3.36 (.51) 3.51 (.50)
53-109 1.00-4.00 1.00-4.00 1.00-4.00 1.00-4.00 1.00-4.00
T3 (2014) 73.73 (8.93) 1.97 (.61) 3.15 (.59) 2.87 (.59) 3.33 (.51) 3.48 (.51)
57-104 1.00-4.00 1.00-4.00 1.00-4.00 1.00-4.00 1.00-4.00
MIDUS (N=7108)
T1 (1994/1995)
46.38 (13.00) 2.24 (.66) 3.20 (.56) 3.42 (.44) 3.49 (.49) 3.02 (.53)
20-75 1.00-4.00 1.00-4.00 1.00-4.00 1.00-4.00 1.00-4.00
T2 (2004/05) 55.43 (12.45) 2.07 (.63) 3.11 (.57) 3.46 (.45) 3.45 (.50) 2.90 (.54)
28-84 1.00-4.00 1.00-4.00 1.00-4.00 1.00-4.00 1.00-4.00
Intra-individual variability in Big Five traits
38
T3 (2013) 63.64 (11.35) 2.06 (.62) 3.08 (.58) 3.46 (.46) 3.43 (.50) 2.89 (.54)
39-93 1.00-4.00 1.20-4.00 1.25-4.00 1.60-4.00 1.00-4.00
NAS (N=2050) T1 (1975)
52.92 (8.96) 3.16 (2.36) 5.31 (2.19) -- -- --
30-78 0-9 0-9 T2 (varies) 62.87 (7.39) 2.97 (2.29) 5.38 (2.28) -- -- --
43-91 0-9 0-9 T3 64.42 (7.07) 3.18 (2.32) 5.43 (2.28) -- -- --
47-92 0-9 0-9 T4 64.74 (7.03) 2.63 (2.26) 5.32 (2.21) -- -- --
48-97 0-9 0-9 T5 65.06 (7.30) 2.21 (2.13) 5.60 (2.17) -- -- --
51-97 0-9 0-9 T6 64.54 (7.29) 2.08 (2.07) 5.60 (2.16) -- -- --
54-89 0-9 0-9 T7 63.77 (7.26) 1.98 (2.08) 5.69 (2.22) -- -- --
58-89 0-9 0-9 T8 62.69 (6.61) 1.84 (1.96) 5.78 (2.09) -- -- --
60-90 0-9 0-9 T9 61.31 (4.89) 1.87 (1.88) 5.32 (2.27) -- -- --
60-89 0-9 0-9 T10 60.41 (2.95) 1.57 (1.87) 5.97 (2.23) -- -- --
60-91 0-9 0-9 T11 60.01 (.34) 0 (0) 8.00 (0) -- -- --
60-75 0-0 0-8
SLS (N=1541) T1 (1992) 63.21 (15.61) 2.59 (.45) 3.25 (.40) 3.41 (.42) 3.51 (.36) 3.67 (.32)
25.00-99.00 1.42-4.35 1.88-4.50 1.89-4.87 2.25-4.54 1.98-4.65
T2 (varies) 66.32 (14.32) 2.60 (.45) 3.18 (.40) 3.47 (.42) 3.50 (.37) 3.71 (.32)
29.00-100.00 1.38-4.35 1.90-4.35 2.04 (4.70) 2.19-4.73 2.46-4.81
T3 67.03 (13.08) 2.59 (.45) 3.18 (.40) 3.48 (.41) 3.51 (.36) 3.72 (.31)
34.00-101.00 1.42-4.48 1.85-4.42 2.21-4.72 2.33-4.69 2.60-4.56
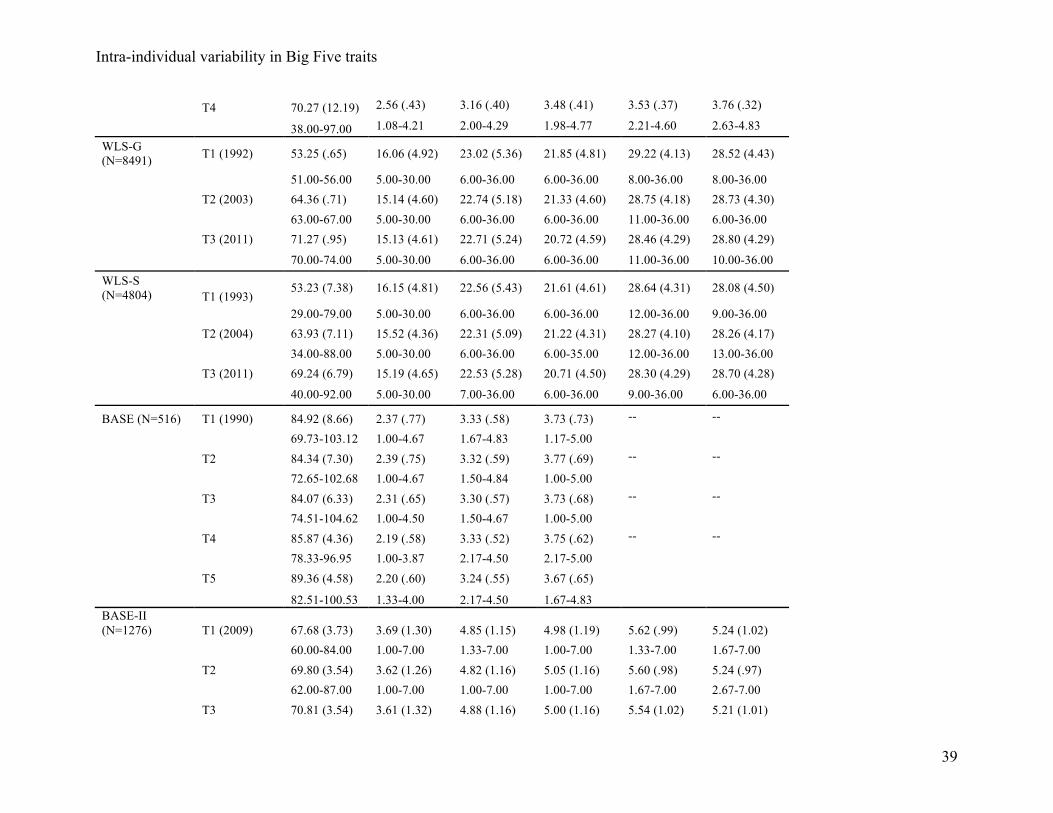
Intra-individual variability in Big Five traits
39
T4 70.27 (12.19) 2.56 (.43) 3.16 (.40) 3.48 (.41) 3.53 (.37) 3.76 (.32)
38.00-97.00 1.08-4.21 2.00-4.29 1.98-4.77 2.21-4.60 2.63-4.83
WLS-G (N=8491) T1 (1992) 53.25 (.65) 16.06 (4.92) 23.02 (5.36) 21.85 (4.81) 29.22 (4.13) 28.52 (4.43)
51.00-56.00 5.00-30.00 6.00-36.00 6.00-36.00 8.00-36.00 8.00-36.00
T2 (2003) 64.36 (.71) 15.14 (4.60) 22.74 (5.18) 21.33 (4.60) 28.75 (4.18) 28.73 (4.30)
63.00-67.00 5.00-30.00 6.00-36.00 6.00-36.00 11.00-36.00 6.00-36.00
T3 (2011) 71.27 (.95) 15.13 (4.61) 22.71 (5.24) 20.72 (4.59) 28.46 (4.29) 28.80 (4.29)
70.00-74.00 5.00-30.00 6.00-36.00 6.00-36.00 11.00-36.00 10.00-36.00
WLS-S (N=4804) T1 (1993)
53.23 (7.38) 16.15 (4.81) 22.56 (5.43) 21.61 (4.61) 28.64 (4.31) 28.08 (4.50)
29.00-79.00 5.00-30.00 6.00-36.00 6.00-36.00 12.00-36.00 9.00-36.00
T2 (2004) 63.93 (7.11) 15.52 (4.36) 22.31 (5.09) 21.22 (4.31) 28.27 (4.10) 28.26 (4.17)
34.00-88.00 5.00-30.00 6.00-36.00 6.00-35.00 12.00-36.00 13.00-36.00
T3 (2011) 69.24 (6.79) 15.19 (4.65) 22.53 (5.28) 20.71 (4.50) 28.30 (4.29) 28.70 (4.28)
40.00-92.00 5.00-30.00 7.00-36.00 6.00-36.00 9.00-36.00 6.00-36.00
BASE (N=516) T1 (1990) 84.92 (8.66) 2.37 (.77) 3.33 (.58) 3.73 (.73) -- --
69.73-103.12 1.00-4.67 1.67-4.83 1.17-5.00
T2 84.34 (7.30) 2.39 (.75) 3.32 (.59) 3.77 (.69) -- --
72.65-102.68 1.00-4.67 1.50-4.84 1.00-5.00
T3 84.07 (6.33) 2.31 (.65) 3.30 (.57) 3.73 (.68) -- --
74.51-104.62 1.00-4.50 1.50-4.67 1.00-5.00
T4 85.87 (4.36) 2.19 (.58) 3.33 (.52) 3.75 (.62) -- --
78.33-96.95 1.00-3.87 2.17-4.50 2.17-5.00
T5 89.36 (4.58) 2.20 (.60) 3.24 (.55) 3.67 (.65)
82.51-100.53 1.33-4.00 2.17-4.50 1.67-4.83 BASE-II (N=1276) T1 (2009) 67.68 (3.73) 3.69 (1.30) 4.85 (1.15) 4.98 (1.19) 5.62 (.99) 5.24 (1.02)
60.00-84.00 1.00-7.00 1.33-7.00 1.00-7.00 1.33-7.00 1.67-7.00
T2 69.80 (3.54) 3.62 (1.26) 4.82 (1.16) 5.05 (1.16) 5.60 (.98) 5.24 (.97)
62.00-87.00 1.00-7.00 1.00-7.00 1.00-7.00 1.67-7.00 2.67-7.00
T3 70.81 (3.54) 3.61 (1.32) 4.88 (1.16) 5.00 (1.16) 5.54 (1.02) 5.21 (1.01)
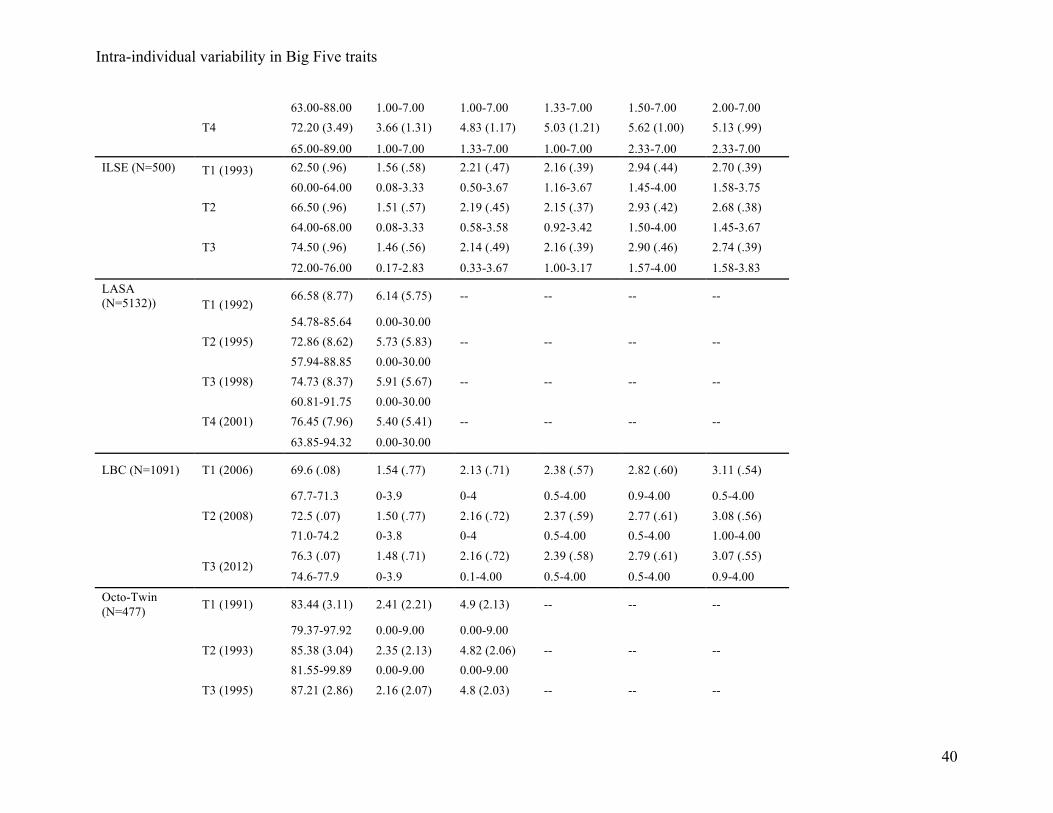
Intra-individual variability in Big Five traits
40
63.00-88.00 1.00-7.00 1.00-7.00 1.33-7.00 1.50-7.00 2.00-7.00
T4 72.20 (3.49) 3.66 (1.31) 4.83 (1.17) 5.03 (1.21) 5.62 (1.00) 5.13 (.99)
65.00-89.00 1.00-7.00 1.33-7.00 1.00-7.00 2.33-7.00 2.33-7.00 ILSE (N=500) T1 (1993) 62.50 (.96) 1.56 (.58) 2.21 (.47) 2.16 (.39) 2.94 (.44) 2.70 (.39)
60.00-64.00 0.08-3.33 0.50-3.67 1.16-3.67 1.45-4.00 1.58-3.75
T2 66.50 (.96) 1.51 (.57) 2.19 (.45) 2.15 (.37) 2.93 (.42) 2.68 (.38)
64.00-68.00 0.08-3.33 0.58-3.58 0.92-3.42 1.50-4.00 1.45-3.67
T3 74.50 (.96) 1.46 (.56) 2.14 (.49) 2.16 (.39) 2.90 (.46) 2.74 (.39)
72.00-76.00 0.17-2.83 0.33-3.67 1.00-3.17 1.57-4.00 1.58-3.83
LASA (N=5132)) T1 (1992)
66.58 (8.77) 6.14 (5.75) -- -- -- --
54.78-85.64 0.00-30.00 T2 (1995) 72.86 (8.62) 5.73 (5.83) -- -- -- --
57.94-88.85 0.00-30.00 T3 (1998) 74.73 (8.37) 5.91 (5.67) -- -- -- --
60.81-91.75 0.00-30.00 T4 (2001) 76.45 (7.96) 5.40 (5.41) -- -- -- --
63.85-94.32 0.00-30.00 LBC (N=1091) T1 (2006) 69.6 (.08) 1.54 (.77) 2.13 (.71) 2.38 (.57) 2.82 (.60) 3.11 (.54)
67.7-71.3 0-3.9 0-4 0.5-4.00 0.9-4.00 0.5-4.00
T2 (2008) 72.5 (.07) 1.50 (.77) 2.16 (.72) 2.37 (.59) 2.77 (.61) 3.08 (.56)
71.0-74.2 0-3.8 0-4 0.5-4.00 0.5-4.00 1.00-4.00
T3 (2012) 76.3 (.07) 1.48 (.71) 2.16 (.72) 2.39 (.58) 2.79 (.61) 3.07 (.55)
74.6-77.9 0-3.9 0.1-4.00 0.5-4.00 0.5-4.00 0.9-4.00 Octo-Twin (N=477) T1 (1991) 83.44 (3.11) 2.41 (2.21) 4.9 (2.13) -- -- --
79.37-97.92 0.00-9.00 0.00-9.00 T2 (1993) 85.38 (3.04) 2.35 (2.13) 4.82 (2.06) -- -- --
81.55-99.89 0.00-9.00 0.00-9.00 T3 (1995) 87.21 (2.86) 2.16 (2.07) 4.8 (2.03) -- -- --
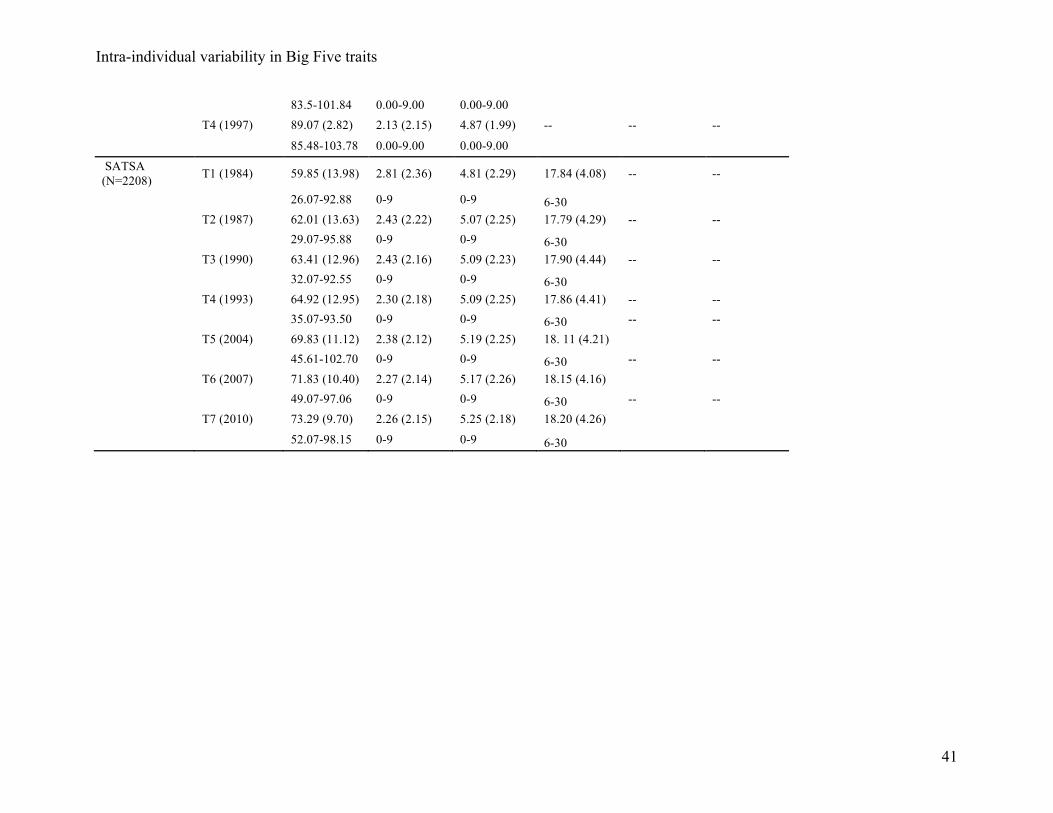
Intra-individual variability in Big Five traits
41
83.5-101.84 0.00-9.00 0.00-9.00 T4 (1997) 89.07 (2.82) 2.13 (2.15) 4.87 (1.99) -- -- --
85.48-103.78 0.00-9.00 0.00-9.00 SATSA (N=2208) T1 (1984) 59.85 (13.98) 2.81 (2.36) 4.81 (2.29) 17.84 (4.08) -- --
26.07-92.88 0-9 0-9 6-30 T2 (1987) 62.01 (13.63) 2.43 (2.22) 5.07 (2.25) 17.79 (4.29) -- --
29.07-95.88 0-9 0-9 6-30 T3 (1990) 63.41 (12.96) 2.43 (2.16) 5.09 (2.23) 17.90 (4.44) -- --
32.07-92.55 0-9 0-9 6-30 T4 (1993) 64.92 (12.95) 2.30 (2.18) 5.09 (2.25) 17.86 (4.41) -- --
35.07-93.50 0-9 0-9 6-30 -- --
T5 (2004) 69.83 (11.12) 2.38 (2.12) 5.19 (2.25) 18. 11 (4.21) 45.61-102.70 0-9 0-9 6-30 -- --
T6 (2007) 71.83 (10.40) 2.27 (2.14) 5.17 (2.26) 18.15 (4.16) 49.07-97.06 0-9 0-9 6-30 -- --
T7 (2010) 73.29 (9.70) 2.26 (2.15) 5.25 (2.18) 18.20 (4.26) 52.07-98.15 0-9 0-9 6-30
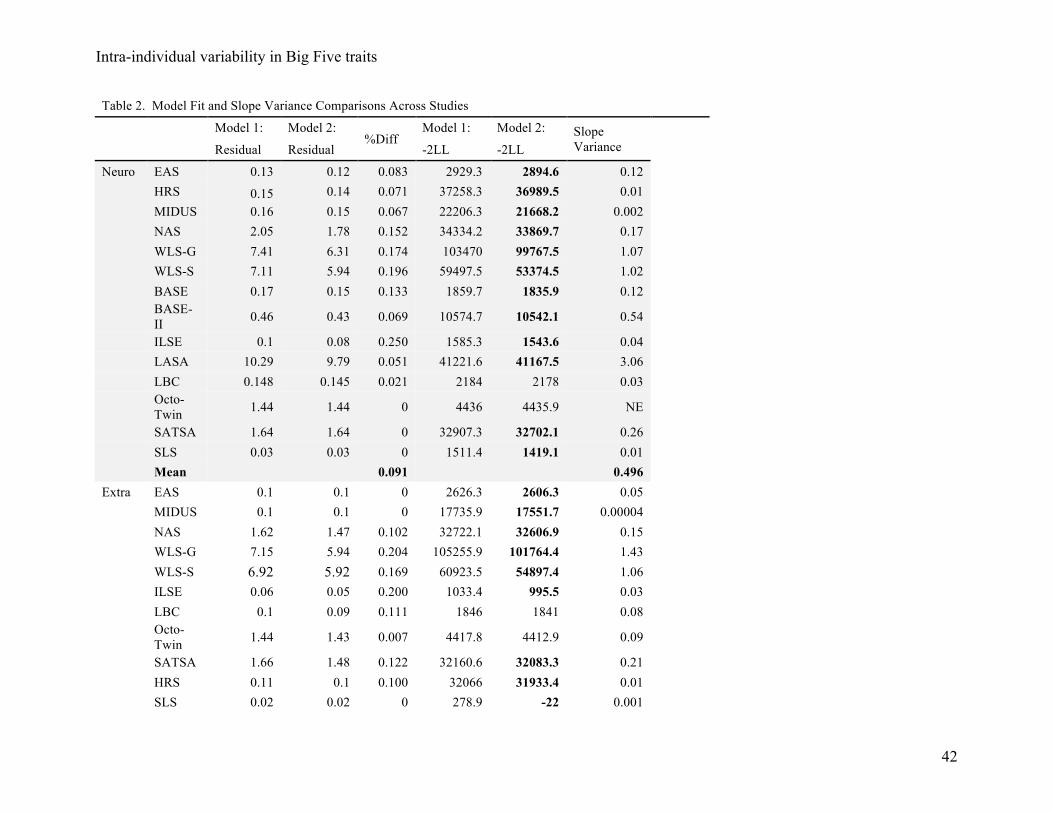
Intra-individual variability in Big Five traits
42
Table 2. Model Fit and Slope Variance Comparisons Across Studies
Model 1: Model 2:
%Diff Model 1: Model 2: Slope
Variance Residual Residual -2LL -2LL
Neuro EAS 0.13 0.12 0.083 2929.3 2894.6 0.12 HRS 0.15 0.14 0.071 37258.3 36989.5 0.01 MIDUS 0.16 0.15 0.067 22206.3 21668.2 0.002 NAS 2.05 1.78 0.152 34334.2 33869.7 0.17 WLS-G 7.41 6.31 0.174 103470 99767.5 1.07 WLS-S 7.11 5.94 0.196 59497.5 53374.5 1.02 BASE 0.17 0.15 0.133 1859.7 1835.9 0.12
BASE-II 0.46 0.43 0.069 10574.7 10542.1 0.54
ILSE 0.1 0.08 0.250 1585.3 1543.6 0.04 LASA 10.29 9.79 0.051 41221.6 41167.5 3.06 LBC 0.148 0.145 0.021 2184 2178 0.03
Octo-Twin 1.44 1.44 0 4436 4435.9 NE
SATSA 1.64 1.64 0 32907.3 32702.1 0.26 SLS 0.03 0.03 0 1511.4 1419.1 0.01 Mean 0.091 0.496 Extra EAS 0.1 0.1 0 2626.3 2606.3 0.05
MIDUS 0.1 0.1 0 17735.9 17551.7 0.00004
NAS 1.62 1.47 0.102 32722.1 32606.9 0.15
WLS-G 7.15 5.94 0.204 105255.9 101764.4 1.43
WLS-S 6.92 5.92 0.169 60923.5 54897.4 1.06
ILSE 0.06 0.05 0.200 1033.4 995.5 0.03
LBC 0.1 0.09 0.111 1846 1841 0.08
Octo-Twin 1.44 1.43 0.007 4417.8 4412.9 0.09
SATSA 1.66 1.48 0.122 32160.6 32083.3 0.21
HRS 0.11 0.1 0.100 32066 31933.4 0.01
SLS 0.02 0.02 0 278.9 -22 0.001
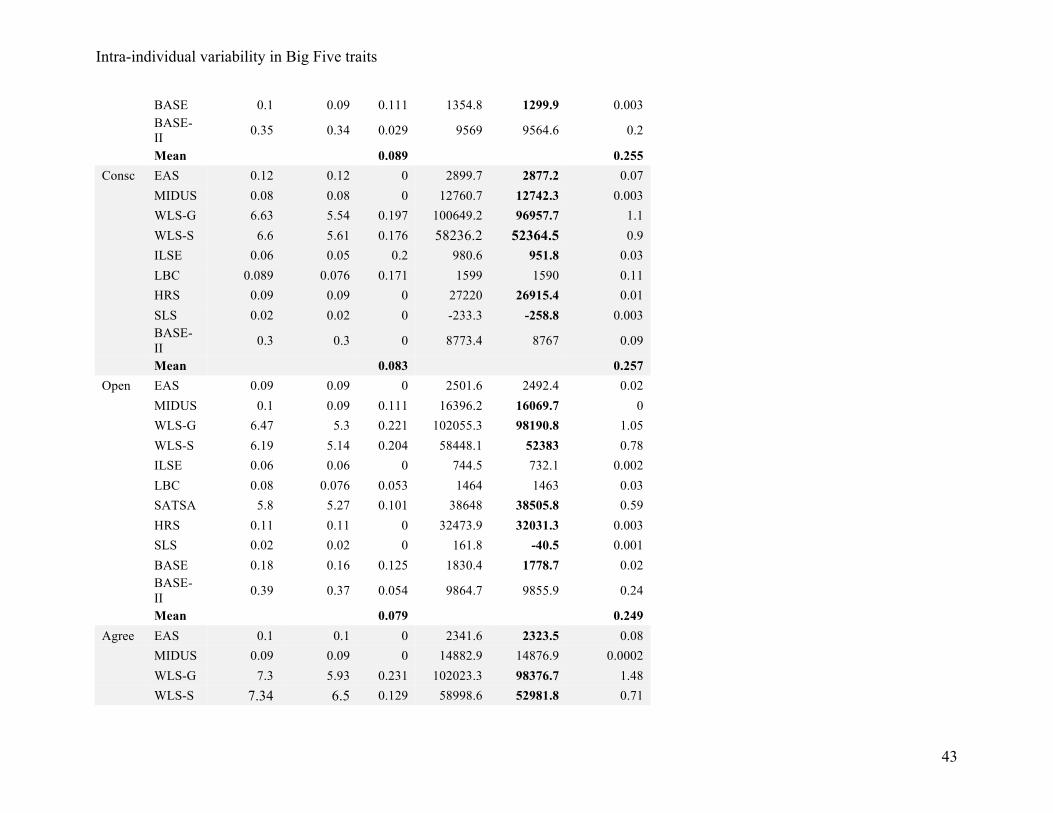
Intra-individual variability in Big Five traits
43
BASE 0.1 0.09 0.111 1354.8 1299.9 0.003
BASE-II 0.35 0.34 0.029 9569 9564.6 0.2
Mean 0.089 0.255 Consc EAS 0.12 0.12 0 2899.7 2877.2 0.07 MIDUS 0.08 0.08 0 12760.7 12742.3 0.003 WLS-G 6.63 5.54 0.197 100649.2 96957.7 1.1 WLS-S 6.6 5.61 0.176 58236.2 52364.5 0.9 ILSE 0.06 0.05 0.2 980.6 951.8 0.03 LBC 0.089 0.076 0.171 1599 1590 0.11 HRS 0.09 0.09 0 27220 26915.4 0.01 SLS 0.02 0.02 0 -233.3 -258.8 0.003
BASE-II 0.3 0.3 0 8773.4 8767 0.09
Mean 0.083 0.257 Open EAS 0.09 0.09 0 2501.6 2492.4 0.02
MIDUS 0.1 0.09 0.111 16396.2 16069.7 0
WLS-G 6.47 5.3 0.221 102055.3 98190.8 1.05
WLS-S 6.19 5.14 0.204 58448.1 52383 0.78
ILSE 0.06 0.06 0 744.5 732.1 0.002
LBC 0.08 0.076 0.053 1464 1463 0.03
SATSA 5.8 5.27 0.101 38648 38505.8 0.59
HRS 0.11 0.11 0 32473.9 32031.3 0.003
SLS 0.02 0.02 0 161.8 -40.5 0.001
BASE 0.18 0.16 0.125 1830.4 1778.7 0.02
BASE-II 0.39 0.37 0.054 9864.7 9855.9 0.24
Mean 0.079 0.249 Agree EAS 0.1 0.1 0 2341.6 2323.5 0.08 MIDUS 0.09 0.09 0 14882.9 14876.9 0.0002 WLS-G 7.3 5.93 0.231 102023.3 98376.7 1.48 WLS-S 7.34 6.5 0.129 58998.6 52981.8 0.71
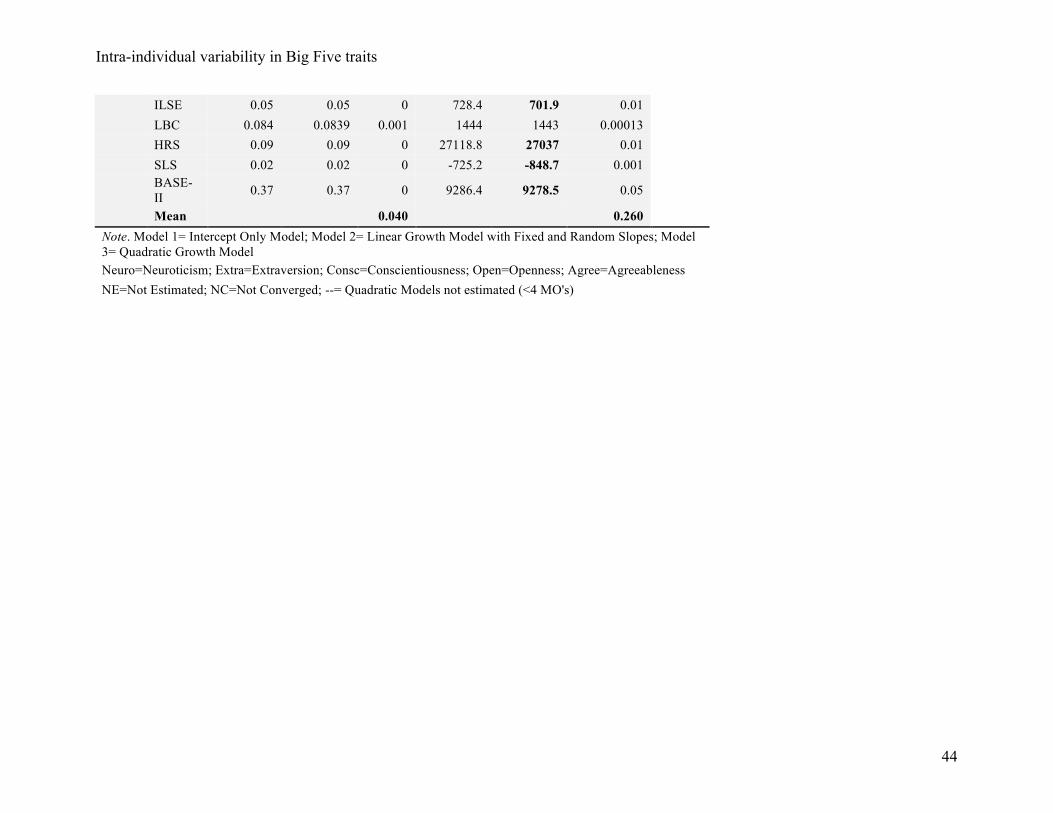
Intra-individual variability in Big Five traits
44
ILSE 0.05 0.05 0 728.4 701.9 0.01 LBC 0.084 0.0839 0.001 1444 1443 0.00013 HRS 0.09 0.09 0 27118.8 27037 0.01 SLS 0.02 0.02 0 -725.2 -848.7 0.001
BASE-II 0.37 0.37 0 9286.4 9278.5 0.05
Mean 0.040 0.260 Note. Model 1= Intercept Only Model; Model 2= Linear Growth Model with Fixed and Random Slopes; Model 3= Quadratic Growth Model Neuro=Neuroticism; Extra=Extraversion; Consc=Conscientiousness; Open=Openness; Agree=Agreeableness NE=Not Estimated; NC=Not Converged; --= Quadratic Models not estimated (<4 MO's)
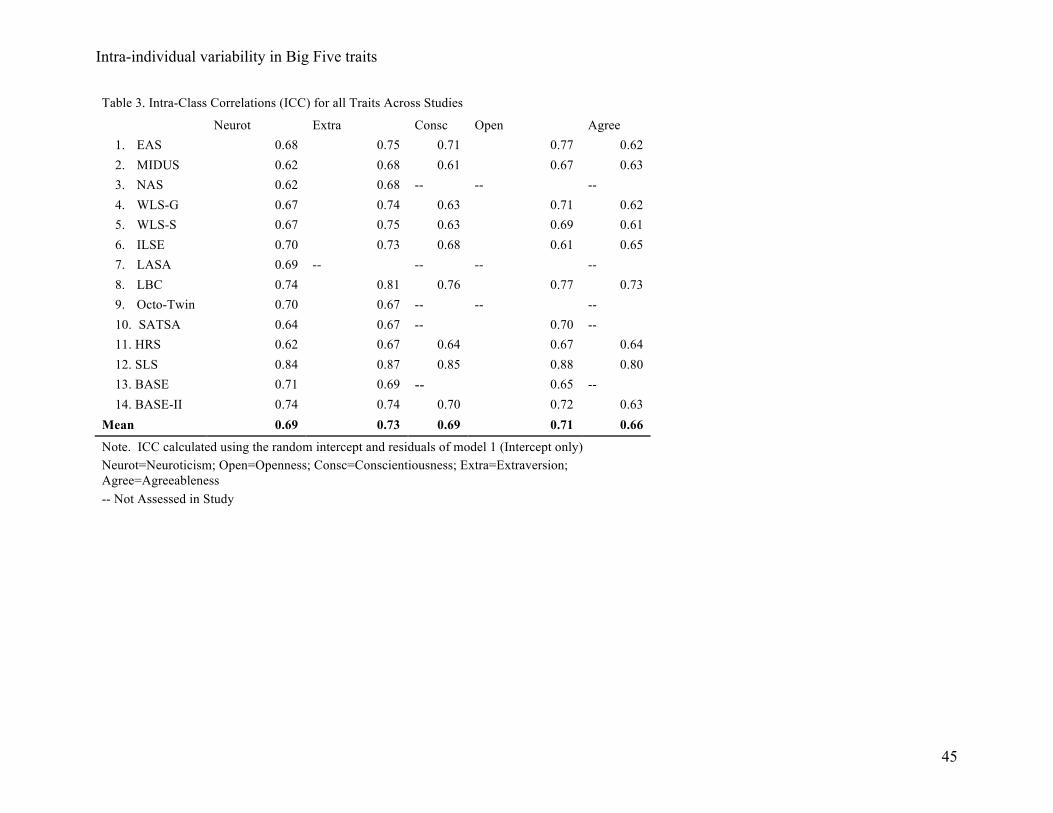
Intra-individual variability in Big Five traits
45
Table 3. Intra-Class Correlations (ICC) for all Traits Across Studies
Neurot Extra Consc Open Agree 1. EAS 0.68 0.75 0.71 0.77 0.62 2. MIDUS 0.62 0.68 0.61 0.67 0.63 3. NAS 0.62 0.68 -- -- -- 4. WLS-G 0.67 0.74 0.63 0.71 0.62 5. WLS-S 0.67 0.75 0.63 0.69 0.61 6. ILSE 0.70 0.73 0.68 0.61 0.65 7. LASA 0.69 -- -- -- -- 8. LBC 0.74 0.81 0.76 0.77 0.73 9. Octo-Twin 0.70 0.67 -- -- -- 10. SATSA 0.64 0.67 -- 0.70 -- 11. HRS 0.62 0.67 0.64 0.67 0.64 12. SLS 0.84 0.87 0.85 0.88 0.80 13. BASE 0.71 0.69 -- 0.65 -- 14. BASE-II 0.74 0.74 0.70 0.72 0.63
Mean 0.69 0.73 0.69 0.71 0.66
Note. ICC calculated using the random intercept and residuals of model 1 (Intercept only) Neurot=Neuroticism; Open=Openness; Consc=Conscientiousness; Extra=Extraversion; Agree=Agreeableness -- Not Assessed in Study
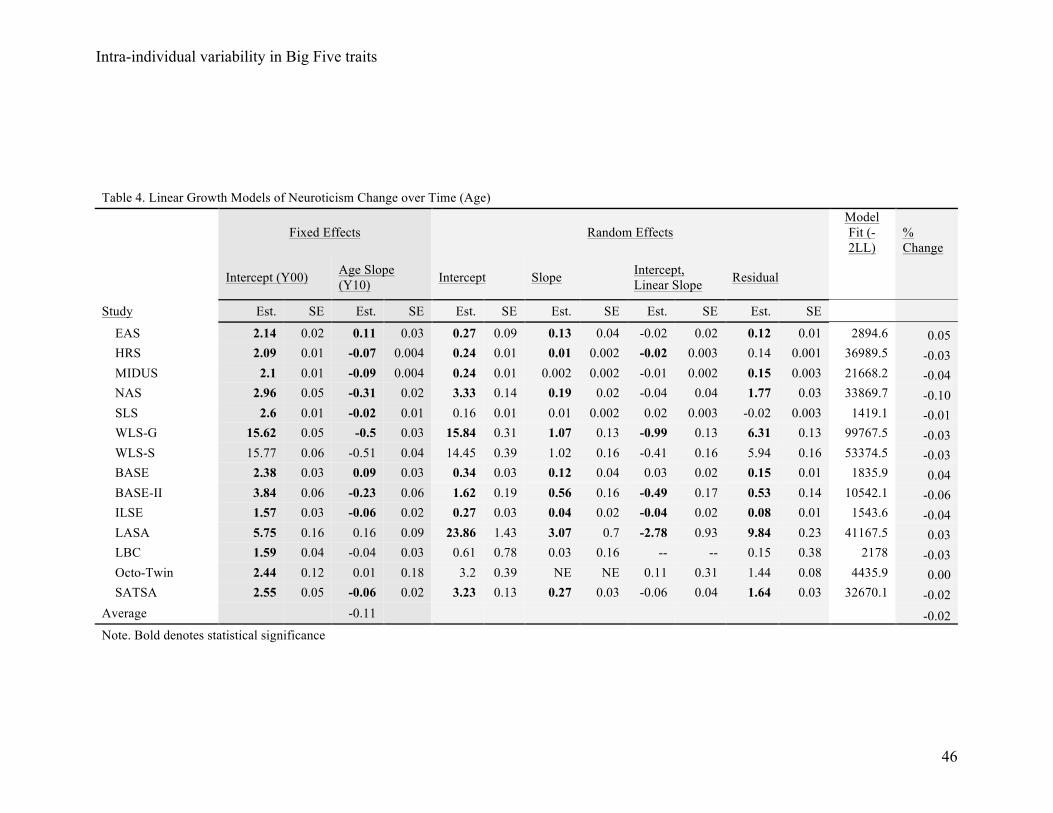
Intra-individual variability in Big Five traits
46
Table 4. Linear Growth Models of Neuroticism Change over Time (Age)
Fixed Effects Random Effects
Model Fit (-2LL)
% Change
Intercept (Y00) Age Slope (Y10) Intercept Slope Intercept,
Linear Slope Residual
Study Est. SE Est. SE Est. SE Est. SE Est. SE Est. SE EAS 2.14 0.02 0.11 0.03 0.27 0.09 0.13 0.04 -0.02 0.02 0.12 0.01 2894.6 0.05 HRS 2.09 0.01 -0.07 0.004 0.24 0.01 0.01 0.002 -0.02 0.003 0.14 0.001 36989.5 -0.03 MIDUS 2.1 0.01 -0.09 0.004 0.24 0.01 0.002 0.002 -0.01 0.002 0.15 0.003 21668.2 -0.04 NAS 2.96 0.05 -0.31 0.02 3.33 0.14 0.19 0.02 -0.04 0.04 1.77 0.03 33869.7 -0.10 SLS 2.6 0.01 -0.02 0.01 0.16 0.01 0.01 0.002 0.02 0.003 -0.02 0.003 1419.1 -0.01 WLS-G 15.62 0.05 -0.5 0.03 15.84 0.31 1.07 0.13 -0.99 0.13 6.31 0.13 99767.5 -0.03 WLS-S 15.77 0.06 -0.51 0.04 14.45 0.39 1.02 0.16 -0.41 0.16 5.94 0.16 53374.5 -0.03 BASE 2.38 0.03 0.09 0.03 0.34 0.03 0.12 0.04 0.03 0.02 0.15 0.01 1835.9 0.04 BASE-II 3.84 0.06 -0.23 0.06 1.62 0.19 0.56 0.16 -0.49 0.17 0.53 0.14 10542.1 -0.06 ILSE 1.57 0.03 -0.06 0.02 0.27 0.03 0.04 0.02 -0.04 0.02 0.08 0.01 1543.6 -0.04 LASA 5.75 0.16 0.16 0.09 23.86 1.43 3.07 0.7 -2.78 0.93 9.84 0.23 41167.5 0.03 LBC 1.59 0.04 -0.04 0.03 0.61 0.78 0.03 0.16 -- -- 0.15 0.38 2178 -0.03 Octo-Twin 2.44 0.12 0.01 0.18 3.2 0.39 NE NE 0.11 0.31 1.44 0.08 4435.9 0.00 SATSA 2.55 0.05 -0.06 0.02 3.23 0.13 0.27 0.03 -0.06 0.04 1.64 0.03 32670.1 -0.02
Average -0.11 -0.02 Note. Bold denotes statistical significance
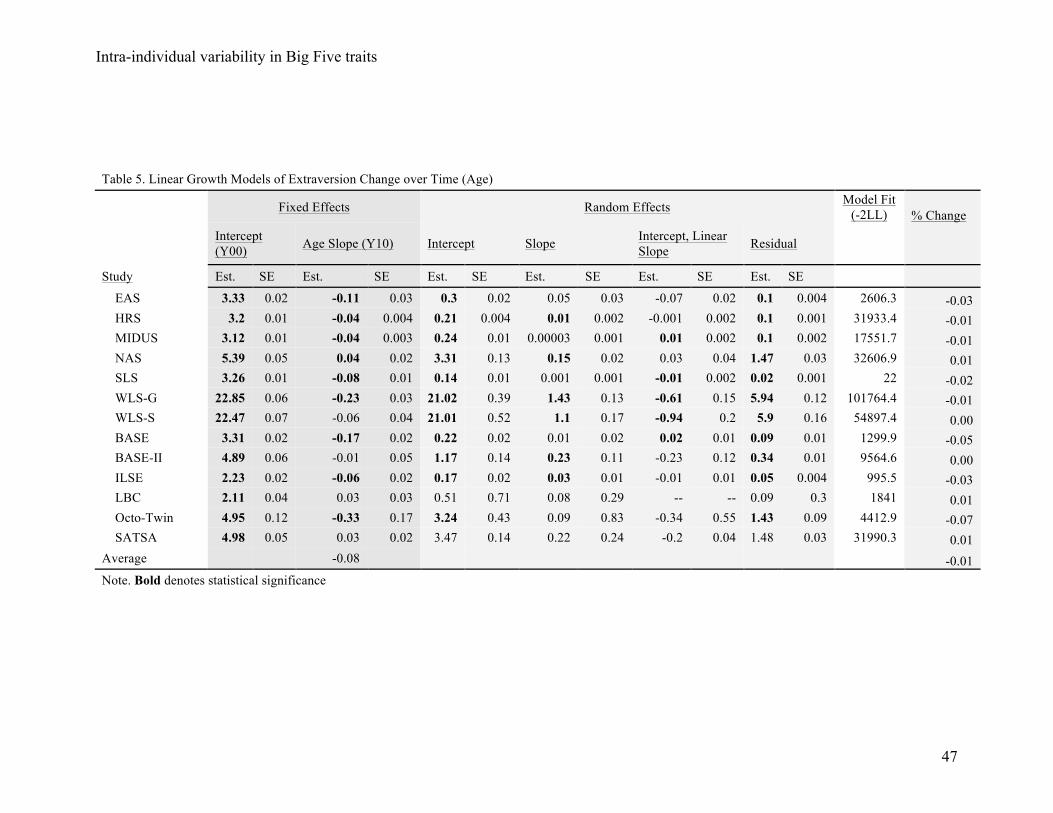
Intra-individual variability in Big Five traits
47
Table 5. Linear Growth Models of Extraversion Change over Time (Age)
Fixed Effects Random Effects Model Fit
(-2LL) % Change
Intercept (Y00) Age Slope (Y10) Intercept Slope Intercept, Linear
Slope Residual
Study Est. SE Est. SE Est. SE Est. SE Est. SE Est. SE EAS 3.33 0.02 -0.11 0.03 0.3 0.02 0.05 0.03 -0.07 0.02 0.1 0.004 2606.3 -0.03 HRS 3.2 0.01 -0.04 0.004 0.21 0.004 0.01 0.002 -0.001 0.002 0.1 0.001 31933.4 -0.01 MIDUS 3.12 0.01 -0.04 0.003 0.24 0.01 0.00003 0.001 0.01 0.002 0.1 0.002 17551.7 -0.01 NAS 5.39 0.05 0.04 0.02 3.31 0.13 0.15 0.02 0.03 0.04 1.47 0.03 32606.9 0.01 SLS 3.26 0.01 -0.08 0.01 0.14 0.01 0.001 0.001 -0.01 0.002 0.02 0.001 22 -0.02 WLS-G 22.85 0.06 -0.23 0.03 21.02 0.39 1.43 0.13 -0.61 0.15 5.94 0.12 101764.4 -0.01 WLS-S 22.47 0.07 -0.06 0.04 21.01 0.52 1.1 0.17 -0.94 0.2 5.9 0.16 54897.4 0.00 BASE 3.31 0.02 -0.17 0.02 0.22 0.02 0.01 0.02 0.02 0.01 0.09 0.01 1299.9 -0.05 BASE-II 4.89 0.06 -0.01 0.05 1.17 0.14 0.23 0.11 -0.23 0.12 0.34 0.01 9564.6 0.00 ILSE 2.23 0.02 -0.06 0.02 0.17 0.02 0.03 0.01 -0.01 0.01 0.05 0.004 995.5 -0.03 LBC 2.11 0.04 0.03 0.03 0.51 0.71 0.08 0.29 -- -- 0.09 0.3 1841 0.01 Octo-Twin 4.95 0.12 -0.33 0.17 3.24 0.43 0.09 0.83 -0.34 0.55 1.43 0.09 4412.9 -0.07 SATSA 4.98 0.05 0.03 0.02 3.47 0.14 0.22 0.24 -0.2 0.04 1.48 0.03 31990.3 0.01
Average -0.08 -0.01 Note. Bold denotes statistical significance
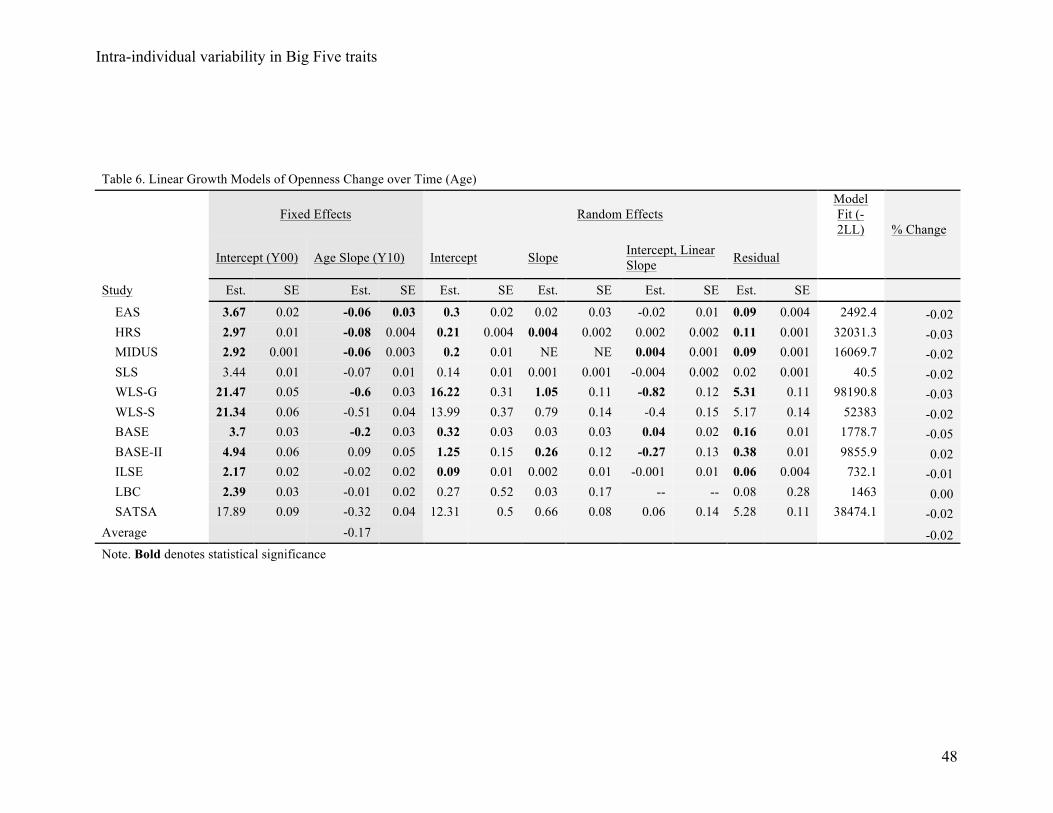
Intra-individual variability in Big Five traits
48
Table 6. Linear Growth Models of Openness Change over Time (Age)
Fixed Effects Random Effects Model Fit (-2LL) % Change
Intercept (Y00) Age Slope (Y10) Intercept Slope Intercept, Linear Slope Residual
Study Est. SE Est. SE Est. SE Est. SE Est. SE Est. SE
EAS 3.67 0.02 -0.06 0.03 0.3 0.02 0.02 0.03 -0.02 0.01 0.09 0.004 2492.4 -0.02 HRS 2.97 0.01 -0.08 0.004 0.21 0.004 0.004 0.002 0.002 0.002 0.11 0.001 32031.3 -0.03 MIDUS 2.92 0.001 -0.06 0.003 0.2 0.01 NE NE 0.004 0.001 0.09 0.001 16069.7 -0.02 SLS 3.44 0.01 -0.07 0.01 0.14 0.01 0.001 0.001 -0.004 0.002 0.02 0.001 40.5 -0.02 WLS-G 21.47 0.05 -0.6 0.03 16.22 0.31 1.05 0.11 -0.82 0.12 5.31 0.11 98190.8 -0.03 WLS-S 21.34 0.06 -0.51 0.04 13.99 0.37 0.79 0.14 -0.4 0.15 5.17 0.14 52383 -0.02 BASE 3.7 0.03 -0.2 0.03 0.32 0.03 0.03 0.03 0.04 0.02 0.16 0.01 1778.7 -0.05 BASE-II 4.94 0.06 0.09 0.05 1.25 0.15 0.26 0.12 -0.27 0.13 0.38 0.01 9855.9 0.02 ILSE 2.17 0.02 -0.02 0.02 0.09 0.01 0.002 0.01 -0.001 0.01 0.06 0.004 732.1 -0.01 LBC 2.39 0.03 -0.01 0.02 0.27 0.52 0.03 0.17 -- -- 0.08 0.28 1463 0.00 SATSA 17.89 0.09 -0.32 0.04 12.31 0.5 0.66 0.08 0.06 0.14 5.28 0.11 38474.1 -0.02
Average -0.17 -0.02 Note. Bold denotes statistical significance
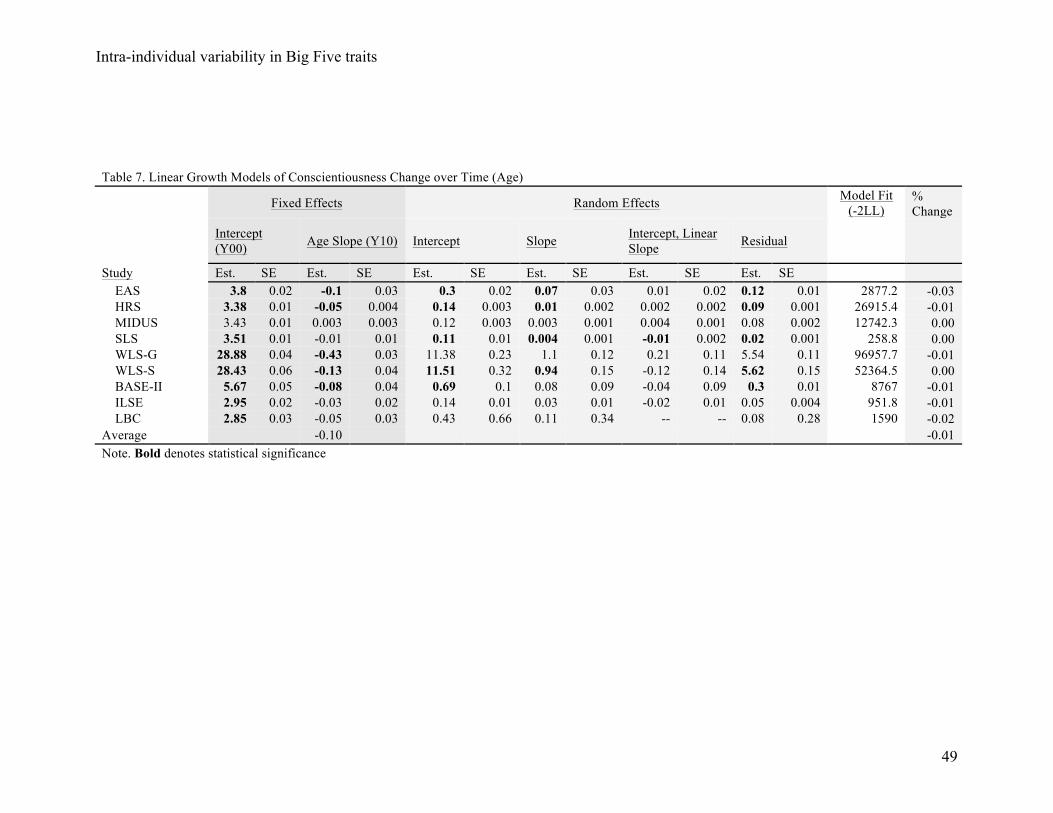
Intra-individual variability in Big Five traits
49
Table 7. Linear Growth Models of Conscientiousness Change over Time (Age)
Fixed Effects Random Effects Model Fit
(-2LL) % Change
Intercept (Y00) Age Slope (Y10) Intercept Slope Intercept, Linear
Slope Residual
Study Est. SE Est. SE Est. SE Est. SE Est. SE Est. SE EAS 3.8 0.02 -0.1 0.03 0.3 0.02 0.07 0.03 0.01 0.02 0.12 0.01 2877.2 -0.03 HRS 3.38 0.01 -0.05 0.004 0.14 0.003 0.01 0.002 0.002 0.002 0.09 0.001 26915.4 -0.01 MIDUS 3.43 0.01 0.003 0.003 0.12 0.003 0.003 0.001 0.004 0.001 0.08 0.002 12742.3 0.00 SLS 3.51 0.01 -0.01 0.01 0.11 0.01 0.004 0.001 -0.01 0.002 0.02 0.001 258.8 0.00 WLS-G 28.88 0.04 -0.43 0.03 11.38 0.23 1.1 0.12 0.21 0.11 5.54 0.11 96957.7 -0.01 WLS-S 28.43 0.06 -0.13 0.04 11.51 0.32 0.94 0.15 -0.12 0.14 5.62 0.15 52364.5 0.00 BASE-II 5.67 0.05 -0.08 0.04 0.69 0.1 0.08 0.09 -0.04 0.09 0.3 0.01 8767 -0.01 ILSE 2.95 0.02 -0.03 0.02 0.14 0.01 0.03 0.01 -0.02 0.01 0.05 0.004 951.8 -0.01 LBC 2.85 0.03 -0.05 0.03 0.43 0.66 0.11 0.34 -- -- 0.08 0.28 1590 -0.02
Average -0.10 -0.01 Note. Bold denotes statistical significance
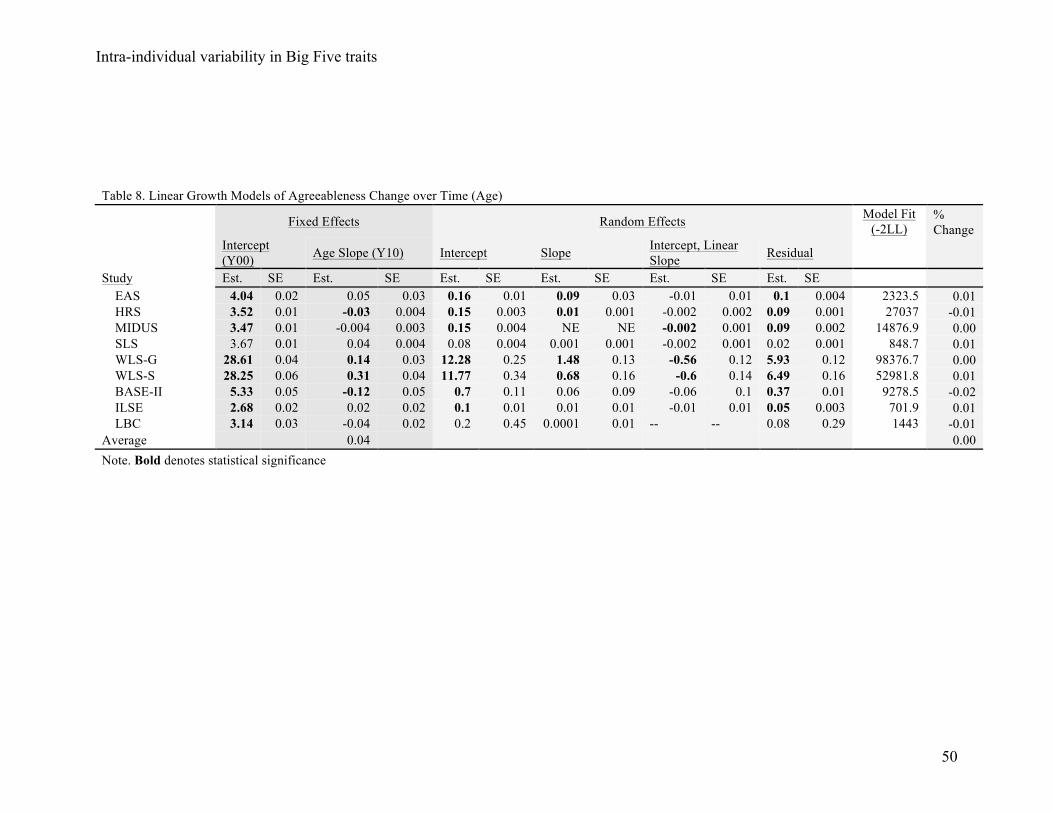
Intra-individual variability in Big Five traits
50
Table 8. Linear Growth Models of Agreeableness Change over Time (Age)
Fixed Effects Random Effects Model Fit
(-2LL) % Change
Intercept (Y00) Age Slope (Y10) Intercept Slope Intercept, Linear
Slope Residual Study Est. SE Est. SE Est. SE Est. SE Est. SE Est. SE
EAS 4.04 0.02 0.05 0.03 0.16 0.01 0.09 0.03 -0.01 0.01 0.1 0.004 2323.5 0.01 HRS 3.52 0.01 -0.03 0.004 0.15 0.003 0.01 0.001 -0.002 0.002 0.09 0.001 27037 -0.01 MIDUS 3.47 0.01 -0.004 0.003 0.15 0.004 NE NE -0.002 0.001 0.09 0.002 14876.9 0.00 SLS 3.67 0.01 0.04 0.004 0.08 0.004 0.001 0.001 -0.002 0.001 0.02 0.001 848.7 0.01 WLS-G 28.61 0.04 0.14 0.03 12.28 0.25 1.48 0.13 -0.56 0.12 5.93 0.12 98376.7 0.00 WLS-S 28.25 0.06 0.31 0.04 11.77 0.34 0.68 0.16 -0.6 0.14 6.49 0.16 52981.8 0.01 BASE-II 5.33 0.05 -0.12 0.05 0.7 0.11 0.06 0.09 -0.06 0.1 0.37 0.01 9278.5 -0.02 ILSE 2.68 0.02 0.02 0.02 0.1 0.01 0.01 0.01 -0.01 0.01 0.05 0.003 701.9 0.01 LBC 3.14 0.03 -0.04 0.02 0.2 0.45 0.0001 0.01 -- -- 0.08 0.29 1443 -0.01
Average 0.04 0.00 Note. Bold denotes statistical significance
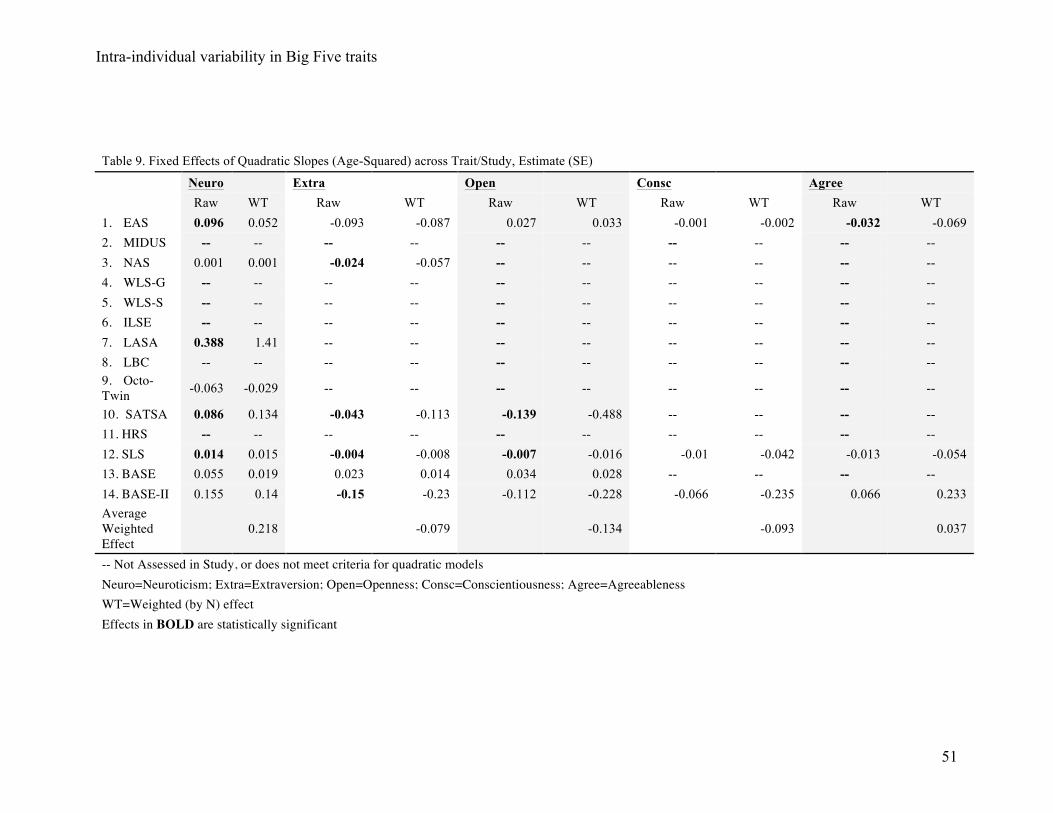
Intra-individual variability in Big Five traits
51
Table 9. Fixed Effects of Quadratic Slopes (Age-Squared) across Trait/Study, Estimate (SE)
Neuro Extra Open Consc Agree Raw WT Raw WT Raw WT Raw WT Raw WT
1. EAS 0.096 0.052 -0.093 -0.087 0.027 0.033 -0.001 -0.002 -0.032 -0.069 2. MIDUS -- -- -- -- -- -- -- -- -- -- 3. NAS 0.001 0.001 -0.024 -0.057 -- -- -- -- -- -- 4. WLS-G -- -- -- -- -- -- -- -- -- -- 5. WLS-S -- -- -- -- -- -- -- -- -- -- 6. ILSE -- -- -- -- -- -- -- -- -- -- 7. LASA 0.388 1.41 -- -- -- -- -- -- -- -- 8. LBC -- -- -- -- -- -- -- -- -- -- 9. Octo-Twin -0.063 -0.029 -- -- -- -- -- -- -- --
10. SATSA 0.086 0.134 -0.043 -0.113 -0.139 -0.488 -- -- -- -- 11. HRS -- -- -- -- -- -- -- -- -- -- 12. SLS 0.014 0.015 -0.004 -0.008 -0.007 -0.016 -0.01 -0.042 -0.013 -0.054 13. BASE 0.055 0.019 0.023 0.014 0.034 0.028 -- -- -- -- 14. BASE-II 0.155 0.14 -0.15 -0.23 -0.112 -0.228 -0.066 -0.235 0.066 0.233 Average Weighted Effect
0.218 -0.079 -0.134 -0.093 0.037
-- Not Assessed in Study, or does not meet criteria for quadratic models Neuro=Neuroticism; Extra=Extraversion; Open=Openness; Consc=Conscientiousness; Agree=Agreeableness WT=Weighted (by N) effect Effects in BOLD are statistically significant
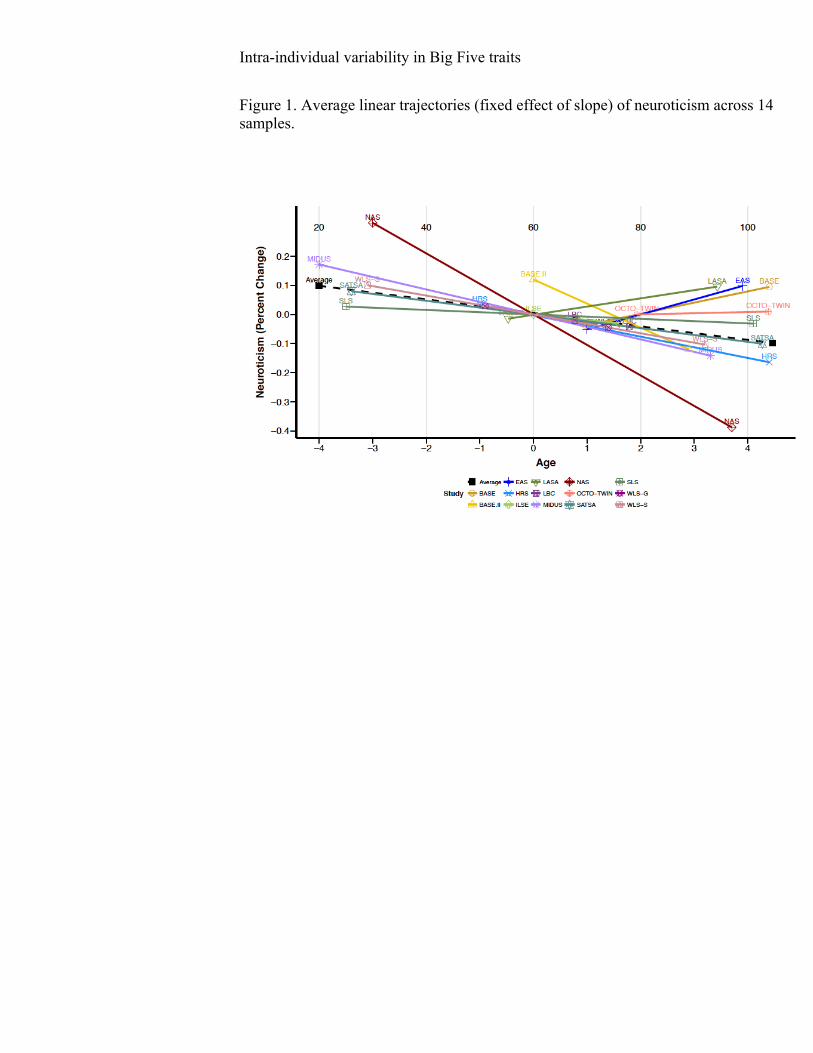
Intra-individual variability in Big Five traits
52
Figure 1. Average linear trajectories (fixed effect of slope) of neuroticism across 14 samples.
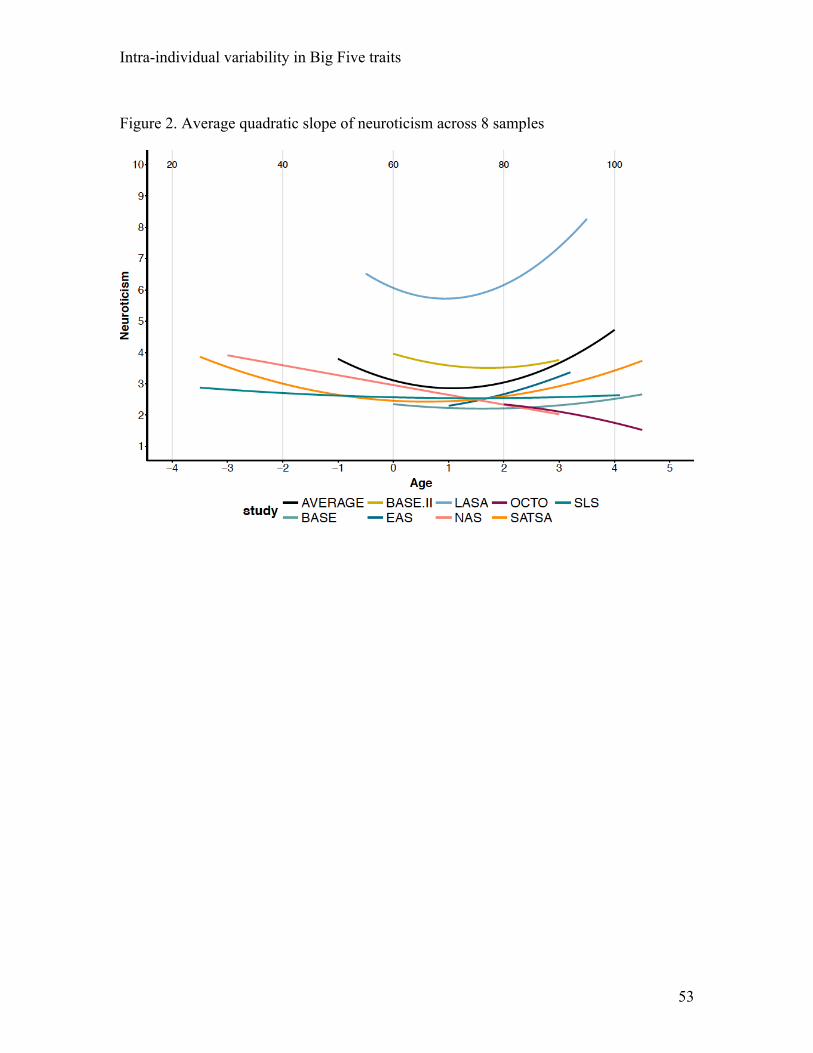
Intra-individual variability in Big Five traits
53
Figure 2. Average quadratic slope of neuroticism across 8 samples
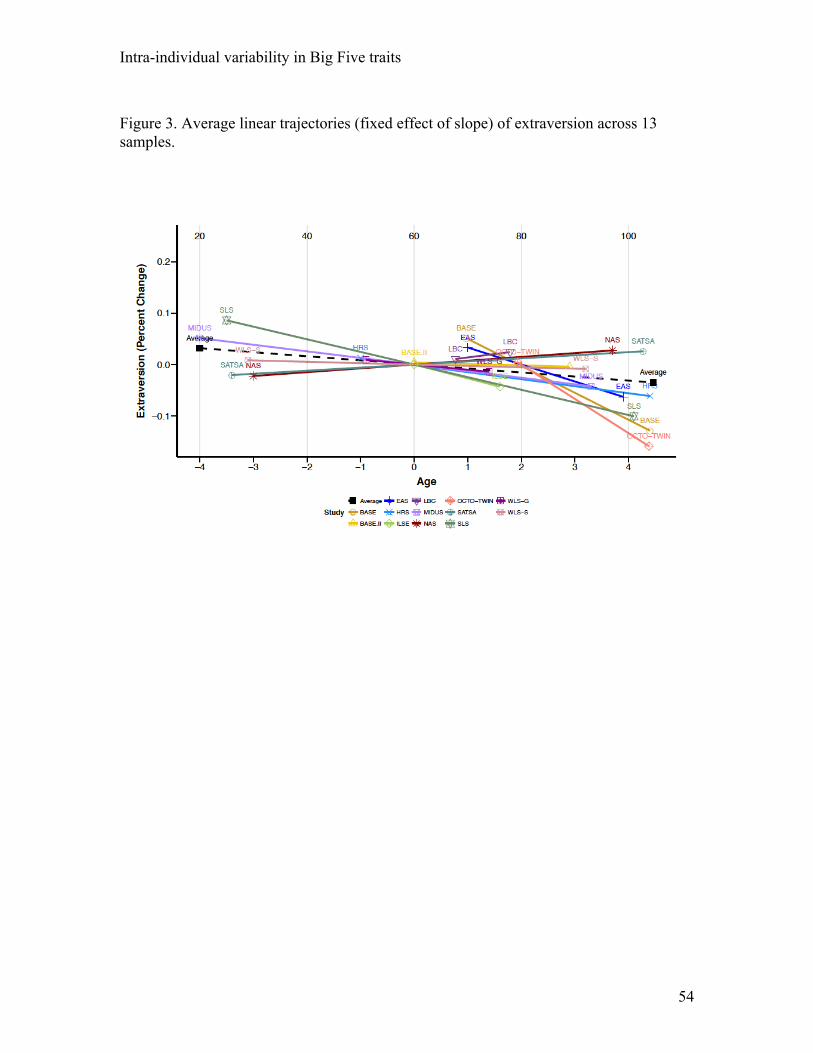
Intra-individual variability in Big Five traits
54
Figure 3. Average linear trajectories (fixed effect of slope) of extraversion across 13 samples.
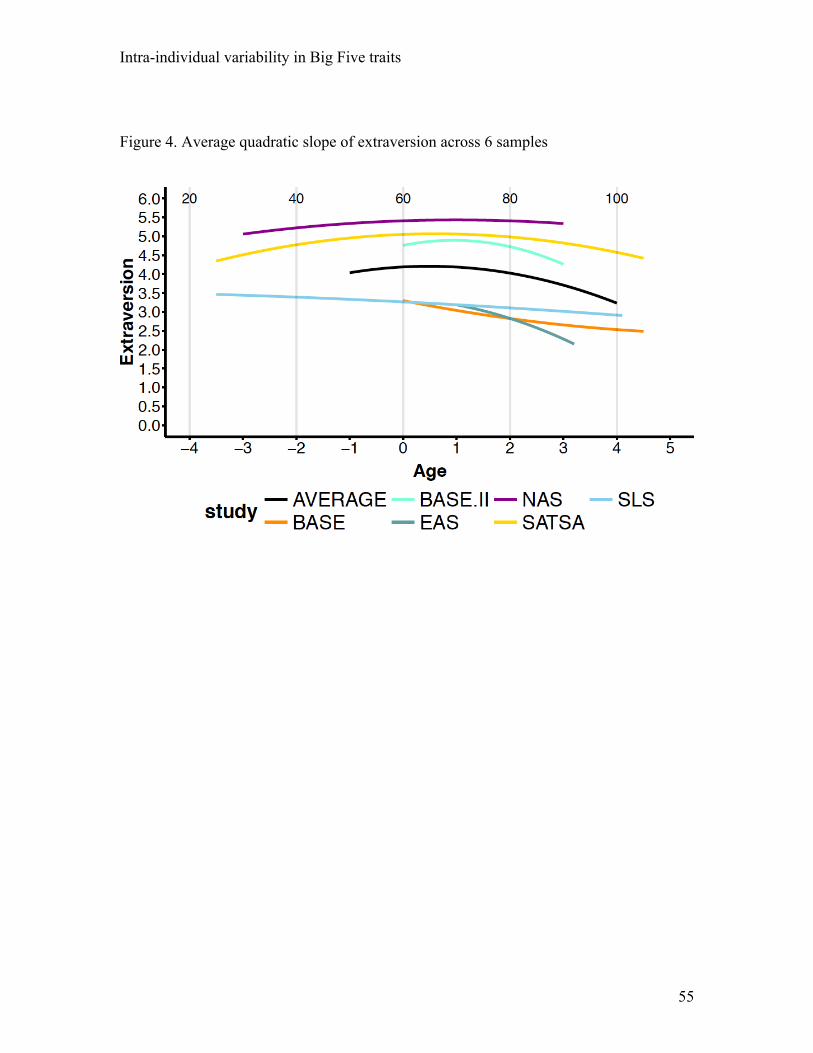
Intra-individual variability in Big Five traits
55
Figure 4. Average quadratic slope of extraversion across 6 samples
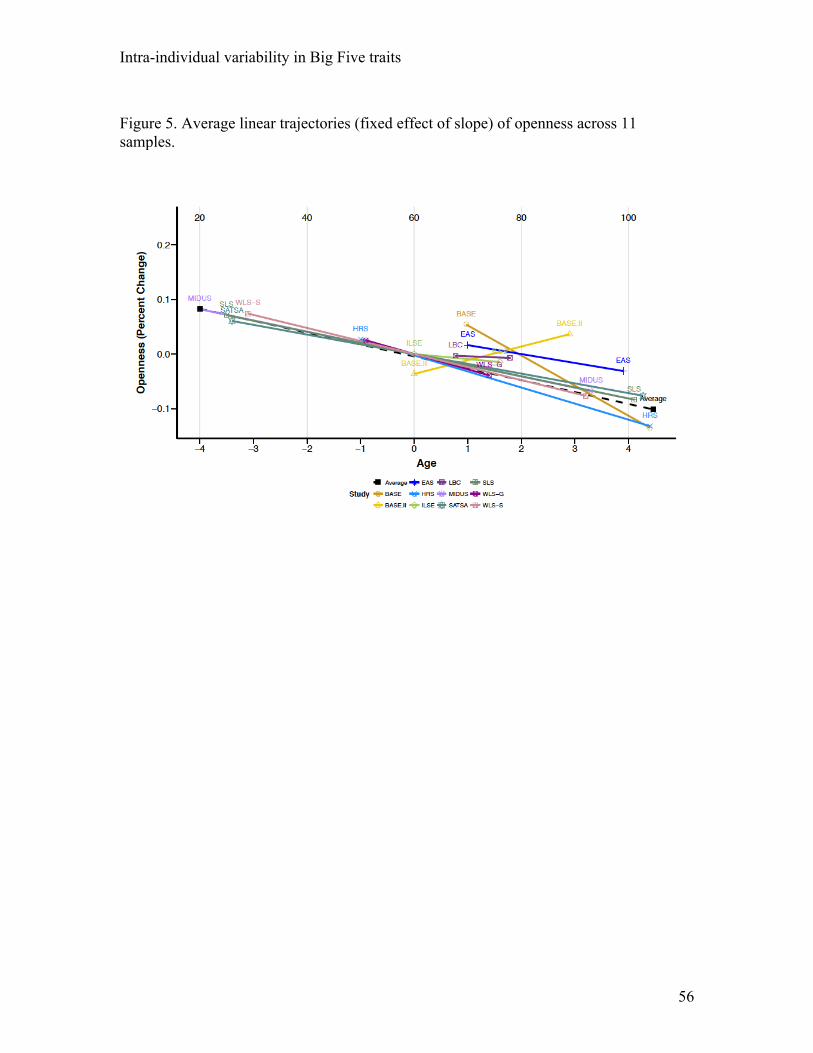
Intra-individual variability in Big Five traits
56
Figure 5. Average linear trajectories (fixed effect of slope) of openness across 11 samples.
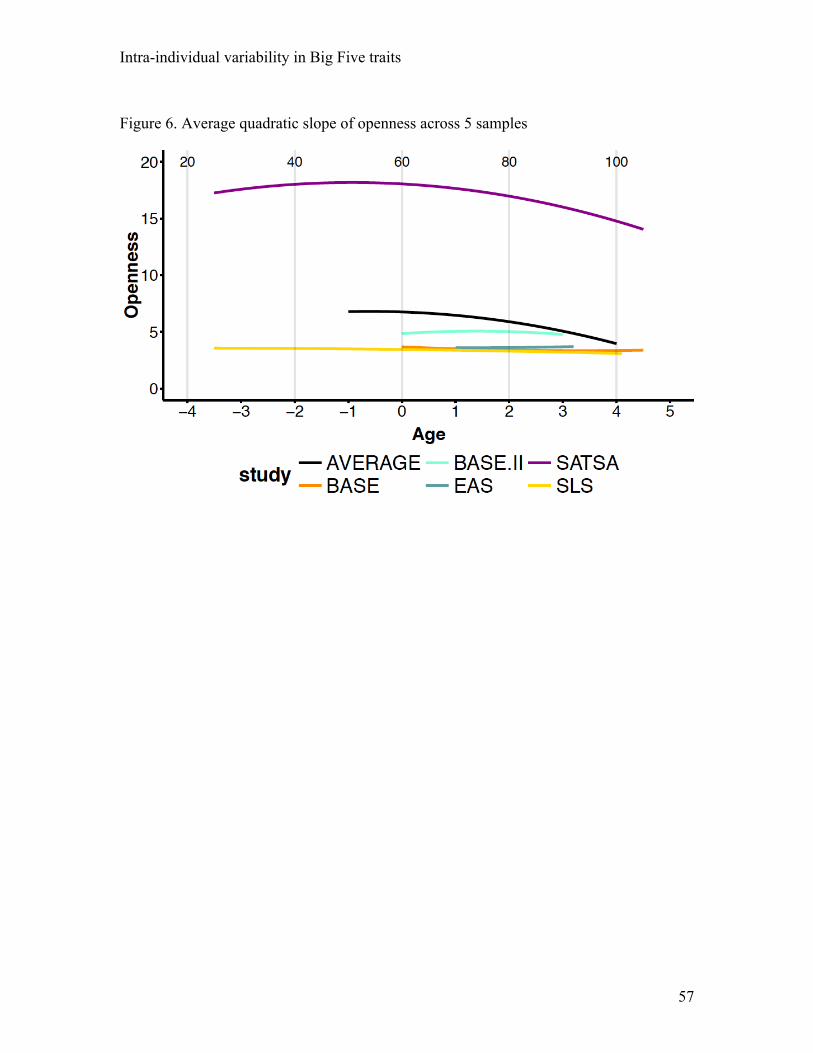
Intra-individual variability in Big Five traits
57
Figure 6. Average quadratic slope of openness across 5 samples
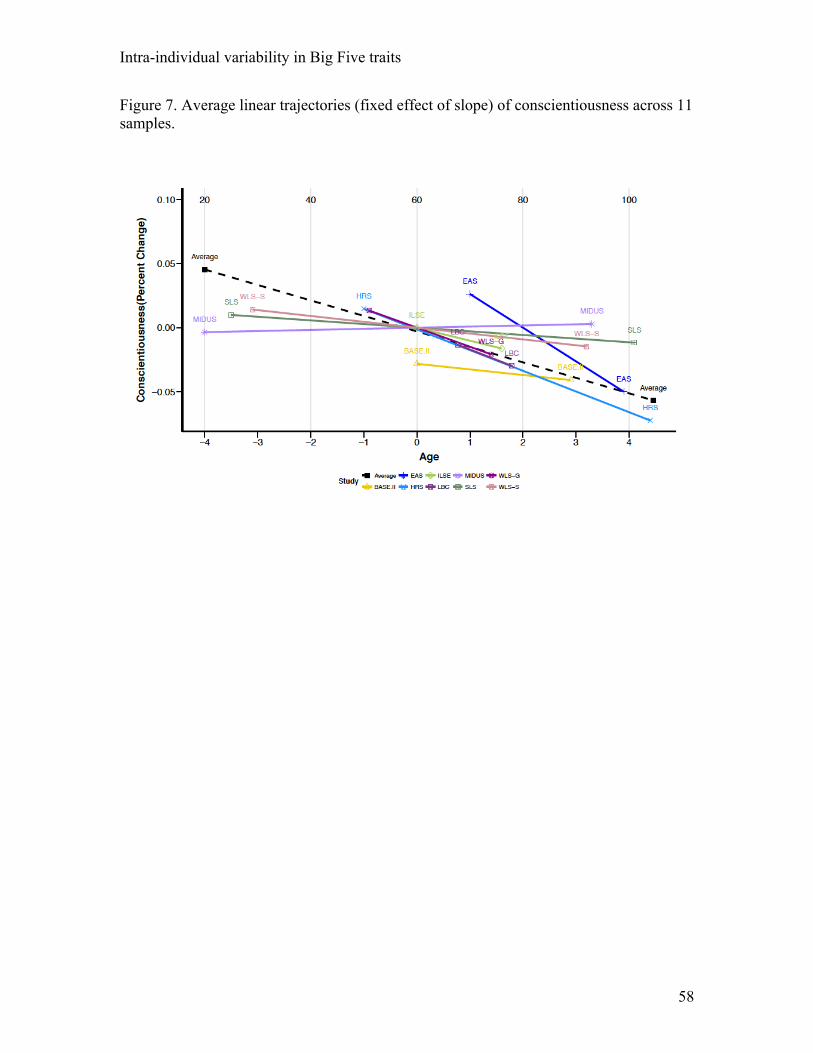
Intra-individual variability in Big Five traits
58
Figure 7. Average linear trajectories (fixed effect of slope) of conscientiousness across 11 samples.
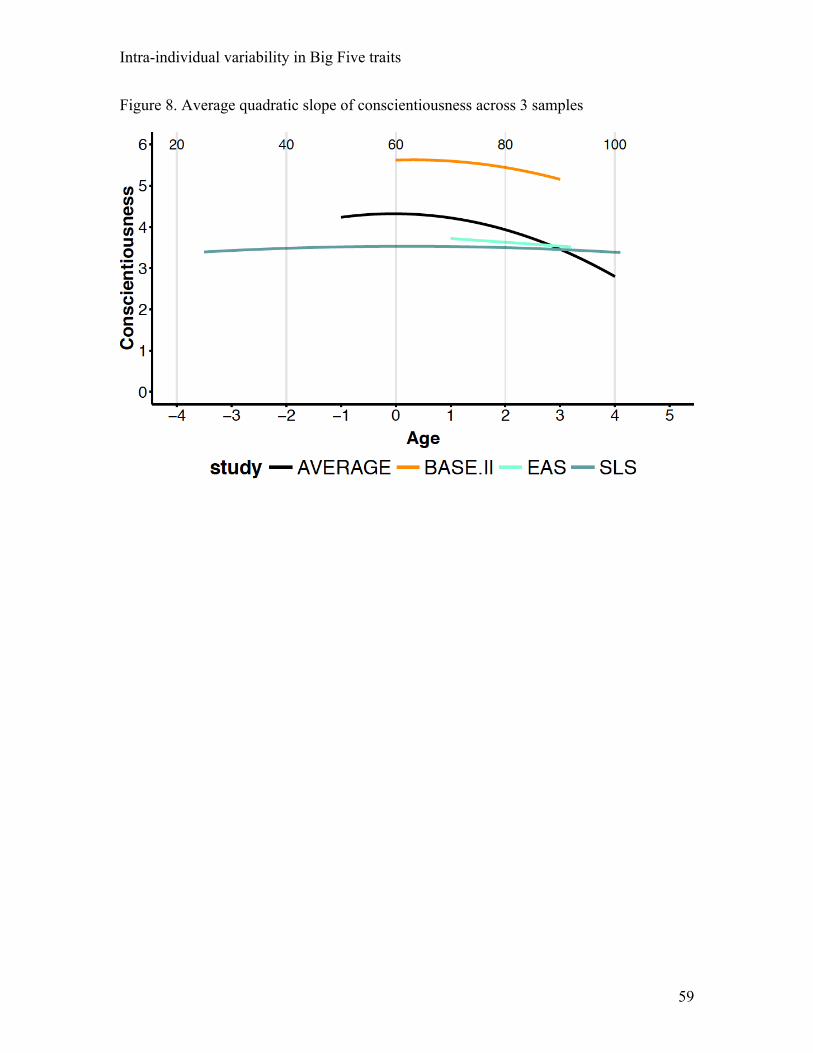
Intra-individual variability in Big Five traits
59
Figure 8. Average quadratic slope of conscientiousness across 3 samples
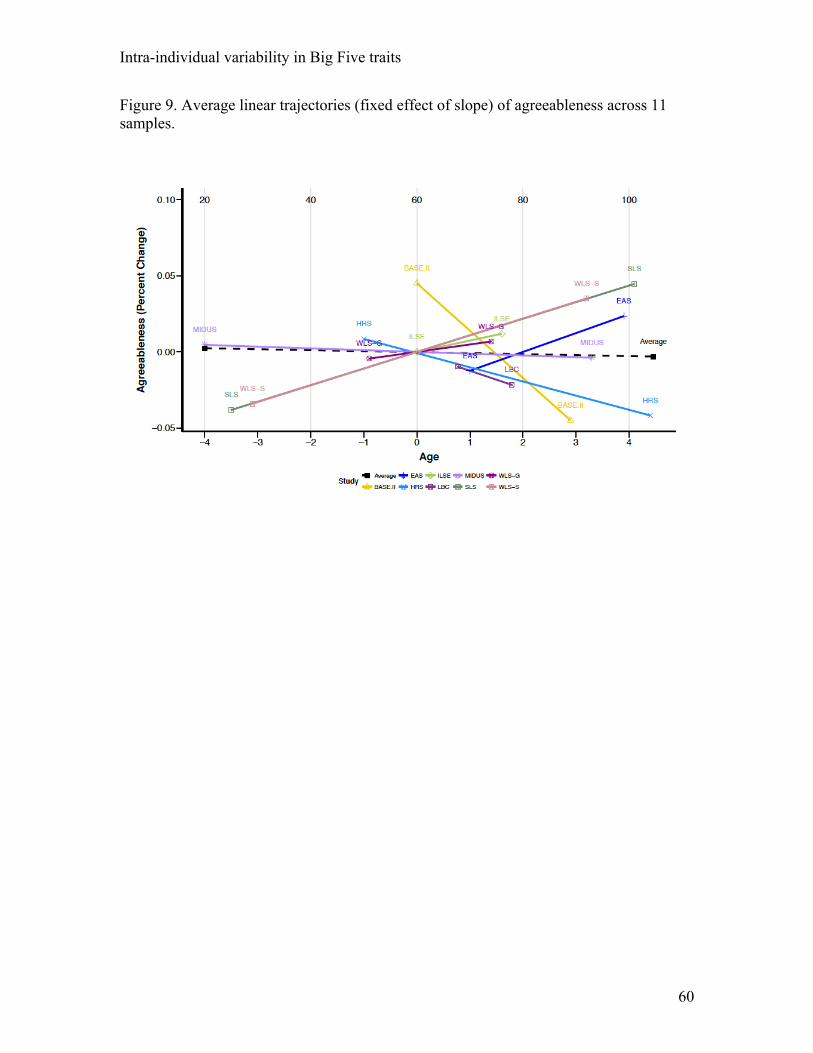
Intra-individual variability in Big Five traits
60
Figure 9. Average linear trajectories (fixed effect of slope) of agreeableness across 11 samples.
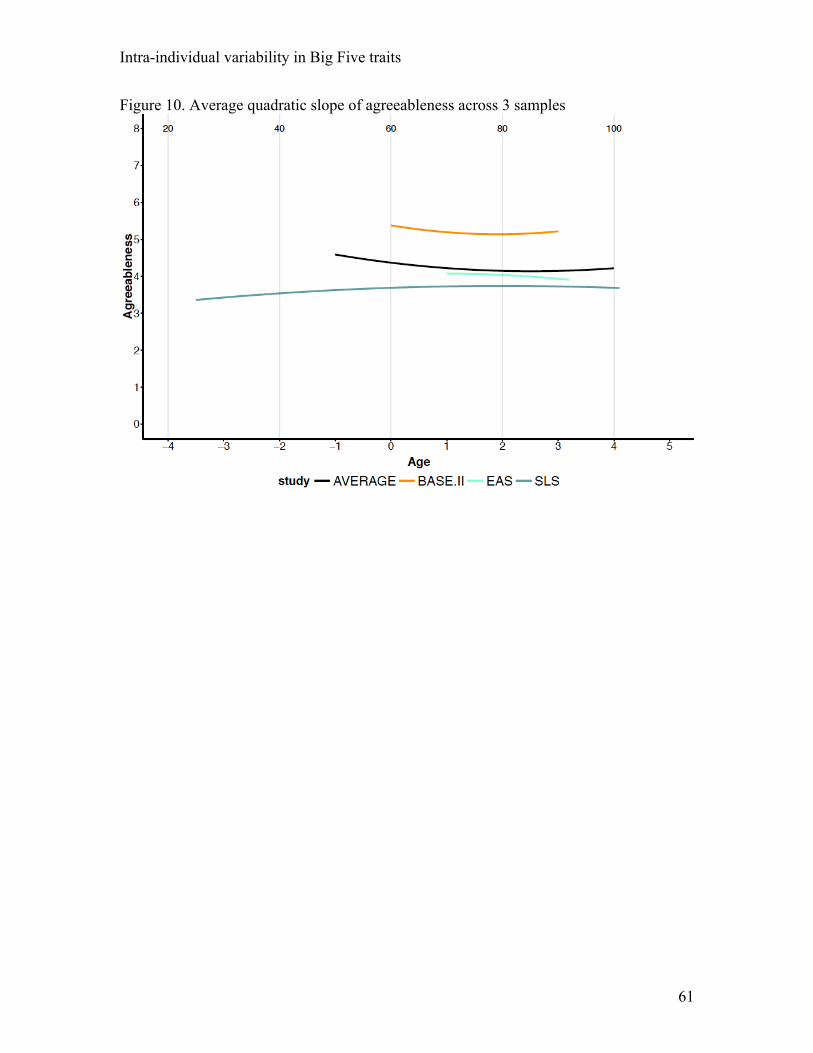
Intra-individual variability in Big Five traits
61
Figure 10. Average quadratic slope of agreeableness across 3 samples
Top Related
Copyright © 2022 FDOKUMEN

