


Bahasa
Halaman
Hukum

RESEARCH ARTICLE
Inputs for optimizing selection platform for
milk production traits of dairy Sahiwal cattle
Destaw WorkuID¤*, Gopal Gowane, Rani Alex, Pooja Joshi, Archana Verma
Animal Genetics and Breeding Division, National Dairy Research Institute, Karnal, Haryana, India
¤ Current address: Department of Animal Science, Salale University, Salale, Ethiopia
Abstract
The premises for the potential success of molecular breeding is the ability to identify major
genes associated with important dairy related traits. The present study was taken up with
the objectives to identify single nucleotide polymorphism (SNP) of bovine MASP2 and
SIRT1 genes and its effect on estimated breeding values (EBVs) and to estimate genetic
parameters for lactation milk yield (LMY), 305-day milk yield (305dMY), 305-day fat yield
(305dFY), 305-day solid not fat yield (305dSNFY) and lactation length (LL) in Sahiwal dairy
cattle to devise a promising improvement strategy. Genetic parameters and breeding values
of milk production traits were estimated from 935 Sahiwal cattle population (1979–2019)
reared at National Dairy Research Institute at Karnal, India. A total of 7 SNPs, where one
SNP (g.499C>T) in exon 2 and four SNPs (g.576G>A, g.609T>C, g.684G>T and
g.845A>G) in exon 3 region of MASP2 gene and 2 SNPs (g.-306T>C and g.-274G>C) in the
promoter region of SIRT1 gene were identified in Sahiwal cattle population. Five of these
identified SNPs were chosen for further genotyping by PCR-RFLP and association analysis.
Association analysis was performed using estimated breeding values (n = 150) to test the
effect of SNPs on LMY, 305dMY, 305dFY, 305dSNFY and LL. Association analysis
revealed that, three SNP markers (g.499C>T, g.609T>C and g.-306T>C) were significantly
associated with all milk yield traits. The estimates for heritability using repeatability model
for LMY, 305dMY, 305dFY, 305dSNFY and LL were low, however the corresponding esti-
mates from first parity were 0.20±0.08, 0.17±0.08, 0.13±0.09, 0.13±0.09 and 0.24, respec-
tively. The repeatability estimates were moderate to high indicating consistency of
performance over the parities and hence reliability of first lactation traits. Genetic correla-
tions among the traits of first parity were high (0.55 to 0.99). From the results we could con-
clude that optimum strategy to improve the Sahiwal cattle further would be selecting the
animals based on their first lactation 305dMY. Option top include the significant SNP in
selection criteria can be explored. Taken together, a 2-stage selection approach, select
Sahiwal animals early for the SNP and then on the basis of first lactation 305dMY will help to
save resources.
PLOS ONE
PLOS ONE | https://doi.org/10.1371/journal.pone.0267800 May 23, 2022 1 / 19
a1111111111
a1111111111
a1111111111
a1111111111
a1111111111
OPEN ACCESS
Citation: Worku D, Gowane G, Alex R, Joshi P,
Verma A (2022) Inputs for optimizing selection
platform for milk production traits of dairy Sahiwal
cattle. PLoS ONE 17(5): e0267800. https://doi.org/
10.1371/journal.pone.0267800
Editor: Md Ashrafuzzaman, Shahjalal University of
Science and Technology, BANGLADESH
Received: September 21, 2021
Accepted: April 14, 2022
Published: May 23, 2022
Peer Review History: PLOS recognizes the
benefits of transparency in the peer review
process; therefore, we enable the publication of
all of the content of peer review and author
responses alongside final, published articles. The
editorial history of this article is available here:
https://doi.org/10.1371/journal.pone.0267800
Copyright: © 2022 Worku et al. This is an open
access article distributed under the terms of the
Creative Commons Attribution License, which
permits unrestricted use, distribution, and
reproduction in any medium, provided the original
author and source are credited.
Data Availability Statement: All relevant data are
within the paper and its Supporting Information
files. However, raw milk production data along with
data of pedigree file of Sahiwal cattle used in this
study cannot be shared publicly. This is due to
Introduction
In dairy cattle breeding program, genetic improvement of milk production traits is the pri-
mary economic activity for profitable dairy business. However, genetic improvement relies on
the amount of additive genetic variance in the population and genetic relationship of traits
involved in economics of dairy farm. Therefore, estimates of genetic parameters are essential
for designing optimum animal breeding program and also for the prediction of selection
response. Numerous studies on heritability and genetic correlations, mainly on the basis of
first lactation 305 days milk yield for Sahiwal cattle have been reported in India. Genetic
parameters on the basis of multiple lactations applying repeatability animal model are more
accurate [1], however, lactation milk yield (LMY), 305- days milk yield (305dMY), 305-days
fat yield (305dFY), 305-days solid not fat yield (305dSNFY) and lactation length (LL) of Sahi-
wal cows, estimates from repeatability model are rare in literature. Sahiwal being an important
dairy breed of cattle in India, needs to have these estimates for designing optimum breeding
program.
There is evidence across several livestock species for genetic control of phenotypic variation
of complex traits [2, 3]. Traditionally, the genetics of complex traits such as milk production
traits in domestic animals has been investigated without exploring the candidate genes
involved, while selection has been based on estimated breeding values obtained from pheno-
typic records and pedigrees, and on knowledge of the heritability of each trait [4]. For the
quantitative trait loci, it is difficult to find a few single nucleotide polymorphisms (SNP) which
could contribute for significant proportion of variance, however, if found they can revolution-
ise the selection process, time required for identification of better breeding pairs and resource
expenditure. The classical forward genetics approaches which are mainly focused on a single
gene effect have been successful in the identification of limited number of causal genes [5]. A
few examples in livestock are the autosomal Booroola fecundity gene (FecB) in sheep [6, 7],
Myostatin gene (MSTN) for double muscling in beef cattle [8]. In dairy cattle, strong func-
tional candidate genes that affect milk production traits such as diacylglycerol acyltransferase 1
(DGAT1), growth hormone receptor (GHR) and ATP binding cassette subfamily G member 2
(ABCG2) [9–11] genes have been reported. Therefore, identification of causative mutations
related to milk production traits is of paramount importance given their future utility.
In this study, we analysed polymorphisms in genes associated with milk production traits
and along with estimation of genetic parameters and prediction of breeding value for milk pro-
duction traits in Indian Sahiwal cattle breed. Candidate genes, MASP2 (Manan binding lectine
serine associated protease 2) and SIRT1 (Silent information regulator 1) were chosen on the
basis of evidence of biochemical processes related to production traits, and also history of sig-
nificant association with various economic traits of cattle in the literature [12–15]. However,
to date, very few studies have reported the genetic association of SNP variation in MASP2 and
SIRT1 genes with milk production traits in dairy cattle. Therefore, this study aimed to identify
SNPs of bovine MASP2 and SIRT1 genes in Sahiwal cattle and their possible effect on the esti-
mated breeding values (EBVs). We also aimed to estimate the genetic parameters for LMY,
305dMY, 305dFY, 305dSNFY and LL in Sahiwal dairy cattle for assessing the breeding
program.
Materials and methods
Experimental animals
All protocols for collection of blood samples for experimental animals and phenotypic obser-
vations were approved by the Animal Care and Use Ethics Committee at ICAR-National
PLOS ONE Inputs for optimizing selection platform for dairy Sahiwal cattle
PLOS ONE | https://doi.org/10.1371/journal.pone.0267800 May 23, 2022 2 / 19
there are legal restrictions for sharing the data as
the data pertains to the animal breeding experiment
and not for open access sharing. This is so
because it contains information regarding the
selection of the animals and other important
information, which is supposed to be not shared in
raw form. The restrictions are imposed by the
Research Advisory Council of the Institute from
where the data is used for analysis (ICAR-National
Dairy Research Institute, Karnal 132001 - India).
Such data is only available upon request (for
validation purposes, if any). In such a case, the
corresponding author (Destaw Worku: email:
[email protected]) should be contacted.
The non-author institutional contact for the inquiry
of the data is the Director ICAR-NDRI Karnal. The
contact details is: [email protected].
Funding: This research was financially supported
by Animal Genetics and Breeding Division of ICAR-
National Dairy Research Institute, Karnal, India. The
corresponding author (Destaw Worku) received the
fund. The funder had no role in study design, data
collection and analysis, decision to publish, or
preparation of the manuscript.
Competing interests: The authors have declared
that no competing interests exist.
Dairy Research Institute, Karnal, India. Moreover, the experiments were conducted in accor-
dance with the guidelines of Committee for the Purpose of Control and Supervision of Experi-
mentation in Animals (CPCSEA), Ministry of Environment, Forest and Climate Change,
Government of India.
Phenotypic data collection
The original data were collected from 935 Sahiwal cows (1979–2019) with all parities main-
tained in ICAR-National Dairy Research institute (ICAR-NDRI), India. All herd information
regarding birth date, Sire ID, Dam ID, calving dates, drying date and lactation performance
were obtained from history-cum-pedigree sheets. The traits used for the study were produc-
tion traits such as total lactation milk yield (LMY), 305-days milk yield (305dMY), 305-days fat
yield (305dFY), 305-days solid not fat yield (305dSNFY) and lactation length (LL). Data prun-
ing was done before analysis. Animals with less than 500 kg 305dMY and less than 100 days LL
were excluded. Reliability and consistency of pedigree information were checked using pedi-
gree viewer software. After imposing the editing criteria, a total of 809 Sahiwal cows sired by
91 sires were used for final data analysis. Lactations were classified into 6 parities, the maxi-
mum parity in the original data set was 12, but due to very few numbers of observation and the
higher correlation between parity 6 and later lactations, all parities above 6 were pooled. Like-
wise, period of birth (or) calving were by 5-year interval.
Genomic DNA isolation and PCR
Genomic DNAs were isolated from whole blood samples of 150 Sahiwal cows by phenol-chlo-
roform extraction method following standard procedures [16]. The quantity and quality of
extracted DNAs were measured by NANODROP 2000 Spectrophotometer (Thermo Scientific,
DE, USA). Primers used to amplify the target regions of bovine MASP2 (Accession number:
ENSBTAG00000012808) and SIRT1 (Accession number: ENSBTAG00000014023) genes were
designed using Primer3Plus (v.0.4.0) online software (http://www.bioinformatics.nl/cgi-bin/
primer3plus/primer3plus.cgi) according to Bos taurus sequence provided in Ensemble geno-
mic browser (http://www.ensembl.org). The sequences of PCR primers used for amplification,
regions, fragment sizes and annealing temperature are shown in Table 1. The PCR reactions
were carried out in a total volume of 25 μl on a Thermo-Cycler (Bio-Rad T100) containing 50
ng genomic DNA; 2.0 μl, 0.5 μM of each primer, 13.0 μl of 2X PCR Master Mix and 9.0 μl of
nuclease free water. The PCR reaction cycling protocol encompassed initial denaturation at
Table 1. List of primer sets, its target region, annealing temperatures and amplicon sizes.
Gene Region Primer sequence Ta (˚C) Product size (bp)
MASP2 Exon 11 F: ATCAGGTTTCTGTAAAGCCTCTAT 61.5 689
R: ACCACTTCTGGGTCTCATTATCTA
Exon 11 F: GTTTGTGGGAGGAATAGTGTC 57 305
R: AGTTAAGTAGTGGAAGAGTGGC
Exon 2 & 3 F: ACAAGTACGCCAACAACCAG 60.5 583
R: GCATTGTGATGATGTCAGACC
SIRT1 Promotor F: GTATAGTCCACGGGGTTACAG 51 273
R: CCAAACTTGTCTTTCAGAGTC
Ta = Annealing temperature, bp = base pair, ˚C = degree centigrade
https://doi.org/10.1371/journal.pone.0267800.t001
PLOS ONE Inputs for optimizing selection platform for dairy Sahiwal cattle
PLOS ONE | https://doi.org/10.1371/journal.pone.0267800 May 23, 2022 3 / 19
95˚C for 3 min, followed by 34 cycles of 94˚C for 30 s, specific annealing temperature for 30 s,
40 s at 72˚C, and a final extension step at 72˚C for 8 minutes.
SNP identification and genotyping
Representative samples of PCR products were purified and sequenced by ABI3730XL DNA
sequencer (Applied Biosystems, Foster City, CA, USA). Two software programs, CodonCode
Aligner (Codon-Code, Dedham, MA) and MEGA11 (Oxford University press), were then
used to discover, analyze the sequences and to find the mutation sites and its location. The
identified SNPs were further genotyped for all the individuals (n = 150) using polymerase
chain reaction-restriction fragment length polymorphism (PCR-RFLP). The amplified PCR
products were then subjected to digestion with respective restriction enzyme following manu-
factures protocol. Subsequently, the digested products were then separated on 2.5 to 2.8% aga-
rose gel and the gel was stained with ethidium bromide. The genotype results of allelic
variation were based on the electrophoretic pattern of the restriction enzyme-treated PCR
products and then assigned to each individual cows.
Statistical analysis
Variance components and genetic parameters. The statistical significance of fixed
effects; season of calving, period of calving and parity, fitted in the model were performed by
general linear model using SAS version 9.2 software [17]. Only significant (P<0.05) fixed
effects were incorporated into the models, which were subsequently used for genetic analysis.
The permanent environmental effect due to the repeated records per animal was taken into
account as additional random effects for the analysis of milk production traits (model I), while
for the analysis of first lactation milk production traits, permanent environmental effect was
not included in the model (model II). Genetic parameters and variance components for the
studied traits with repeated records were estimated using single trait repeatability animal
model. The general description of the models in matrix forms are given below:
Y ¼ Xβþ ZuþWpþ ε ðIÞ
Y ¼ Xβþ Zuþ ε ðIIÞ
Where Y is a vector of observed traits; X, Z and W are incidence matrices related to fixed,
additive genetic, and permanent environmental effects, respectively. While, β, u, p and ε are
vector of fixed effects, vector of additive genetic effect, vector of animal permanent environ-
mental effect; and vector of residual effect, respectively. The data were subjected to genetic
analysis using BLUPF90 family of programs [18]. The data were renumbered and processed
using RENUMF90. The Gibbs sampler was then used to obtain posterior densities of variance
components. The marginal posterior distribution for each parameter was obtained by consid-
ering one long chain with 1000,000 iterations, where the first 100,000 samples were discarded
as burn in and then one out of 50 iterations were stored for further analysis. The convergence
of Gibbs chains was monitored through graphical inspection (trace-plots) related to selected
parameters. After verifying the graphics, we observed that the burn-in period considered was
sufficient to reach convergence in all parameter estimates. Eighteen thousand (18,000) number
of effective samples were generated and used to obtain measures of central tendency and the
highest posterior density (HPD) region for each parameter. The convergence diagnostic of the
chain generated by the Gibbs sampler was then subjected to POSTGIBBSF90 [18], and the
HPD region, which provides the interval that includes 95% of samples as a measure of reliabil-
ity and standard error of parameters were also attained. Computations of variance
PLOS ONE Inputs for optimizing selection platform for dairy Sahiwal cattle
PLOS ONE | https://doi.org/10.1371/journal.pone.0267800 May 23, 2022 4 / 19
components, heritability, repeatability and correlation estimates (genetic, rg; permanent envi-
ronmental) were carried out using the program GIBBS1F90 and POSTGIBBSF90 [18],
respectively.
Estimation of breeding values and genetic trend. Individual breeding values of animals
for milk production traits were computed from the Best Linear Unbiased Predictions (BLUP)
solutions obtained from the repeatability animal model using BLUPF90 [18] software pack-
ages. The average EBV of animals were plotted to envisage genetic trend across the birth year.
Linear regression coefficients of mean EBV for LMY, 305dMY, 305dFY, 305dSNFY and LL on
birth years were computed using REG procedure of SAS to assess the significance of genetic
trends in Sahiwal cattle, respectively.
Association of genotypes with EBVs of milk production traits. Conventional popula-
tion genetics statistical analysis: allele frequency, genotype frequency, exact test of Hardy
Weinberg equilibrium (HWE) and polymorphism information content (PIC) for each poly-
morphism were performed using PoPGen2 software [19]. The EBVs of 150 Sahiwal cows were
used as a phenotype to test the association of MASP2 and SIRT1 gene SNPs with milk produc-
tion traits. Thus, the effect of genotypes on the EBVs of milk production traits were analysed
using the general linear model (GLM) procedure of SAS 9.2 software [17], with the following
model (model III). Moreover, the Tukey-Kramer multiple comparison test was used to analyze
significance of differences between groups. Significant level was set to P� 0.05.
Yij ¼ μþ Gi þ eij ðIIIÞ
Where, Yij = Breeding value of jth animal of ith Genotype, μ is overall mean, Gi is the effect of
ith genotypes and eij is the residual error NID (0, σ2e).
Results and discussion
Identification of SNPs and genotype patterns of different polymorphisms
in MASP2 and SIRT1 genes
Study revealed a total of 5 SNPs in bovine MASP2 gene, of which one (g.499C>T) was located
in exon 2 region and four (g.576G>A, g.609T>C, g.684G>T and g. 845A>G) were in exon 3
region on chromosome 16 (Table 2). With respect to bovine SIRT1 gene, two SNPs (g.-
306T>C and g.-274C>G) were detected in the promoter region of Sahiwal cattle population
(Table 2). Further, we individually genotyped three SNPs (g.499C>T, g.609T>C and
g.684G>T) in MASP2 gene and two SNPs (g.-274C>G and g.-306T>C) in SIRT1 promoter
region while using PCR-RFLP method for 150 Sahiwal cows. Pictorial representation for geno-
types is given in Figs 1 and 2.
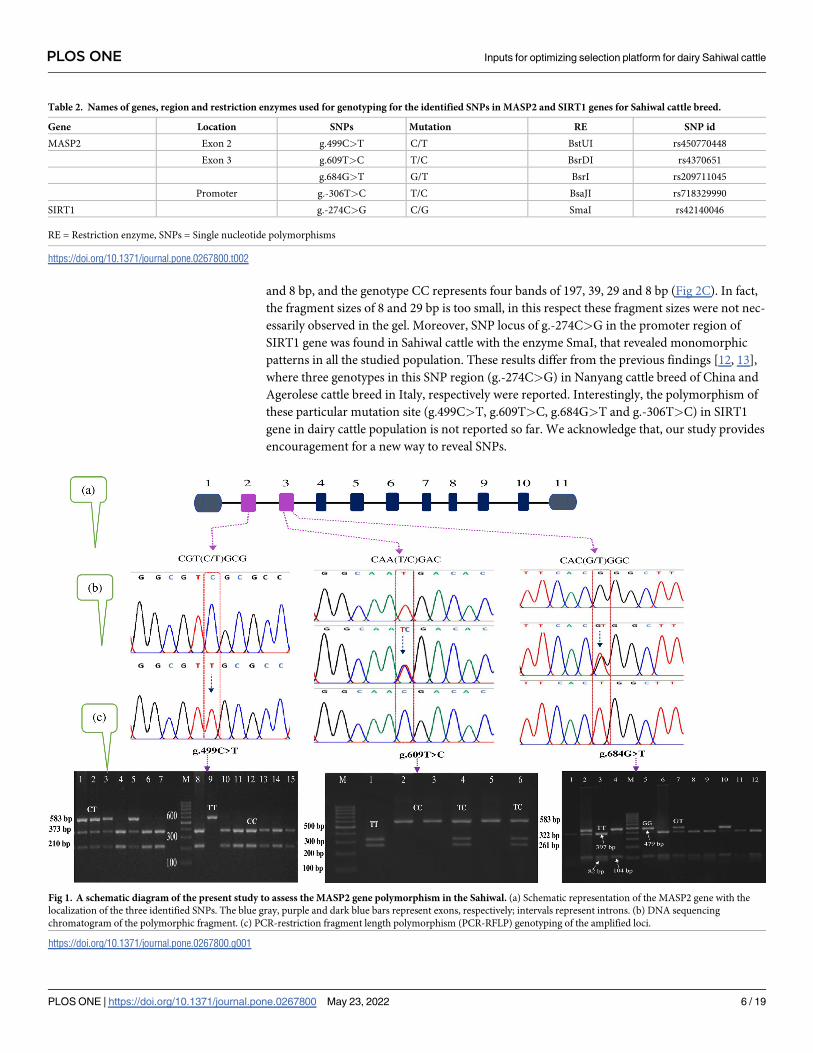
Restriction digestion using BstUI for MASP2 gene at the SNP locus g.499C>T
(rs41255599) produced fragments with lengths of 373 and 210 bp for genotype CC, 583, 373
and 210 bp for genotype CT, and 583 bp for genotype TT (Fig 1C) in Sahiwal cattle population.
The second SNP at locus g.609T>C (rs4370651) was obtained with BsrDI enzyme and
revealed three genotypes with fragment length of 322 and 261 bp for genotype TT, 583, 322
and 261 bp for genotype TC, and 583 bp for genotype CC (Fig 1C), respectively. Likewise, the
third SNP (g.684G>T; rs209711045) in exon 3 of MASP2 gene was obtained with BsrI restric-
tion enzyme and produced three genotypes with three district patterns. These genotypes were
GG (583 bp), GT (583, 397, 104 and 82 bp) and TT (397, 104 and 82 bp), respectively (Fig 1C).
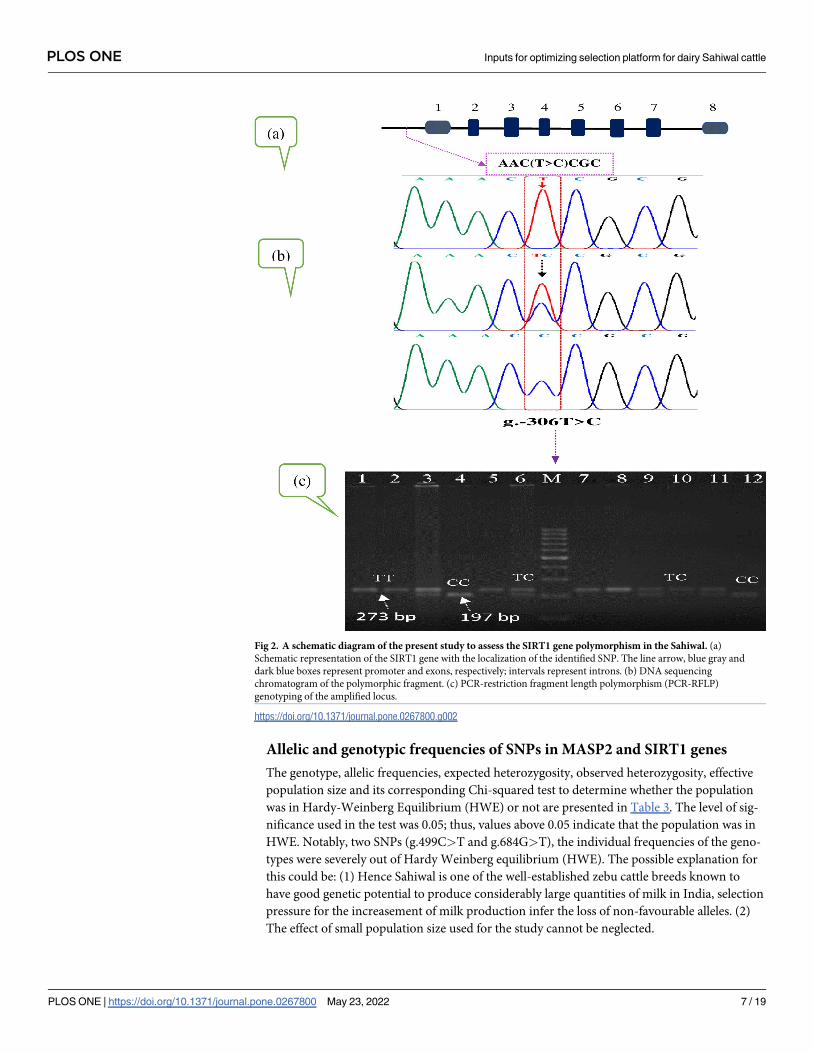
For SIRT1 gene the SNP at nucleotide position g.-306T>C locus in promoter region was
identified with BsaJI enzyme, resolved in to three polymorphic patterns of TT, TC and CC
genotypes in Sahiwal cattle population. The genotype TT represents the occurrence of one
band of 273 bp, the genotype TC represents five restriction fragment bands of 273, 197, 39, 29
PLOS ONE Inputs for optimizing selection platform for dairy Sahiwal cattle
PLOS ONE | https://doi.org/10.1371/journal.pone.0267800 May 23, 2022 5 / 19
and 8 bp, and the genotype CC represents four bands of 197, 39, 29 and 8 bp (Fig 2C). In fact,
the fragment sizes of 8 and 29 bp is too small, in this respect these fragment sizes were not nec-
essarily observed in the gel. Moreover, SNP locus of g.-274C>G in the promoter region of
SIRT1 gene was found in Sahiwal cattle with the enzyme SmaI, that revealed monomorphic
patterns in all the studied population. These results differ from the previous findings [12, 13],
where three genotypes in this SNP region (g.-274C>G) in Nanyang cattle breed of China and
Agerolese cattle breed in Italy, respectively were reported. Interestingly, the polymorphism of
these particular mutation site (g.499C>T, g.609T>C, g.684G>T and g.-306T>C) in SIRT1
gene in dairy cattle population is not reported so far. We acknowledge that, our study provides
encouragement for a new way to reveal SNPs.
Table 2. Names of genes, region and restriction enzymes used for genotyping for the identified SNPs in MASP2 and SIRT1 genes for Sahiwal cattle breed.
Gene Location SNPs Mutation RE SNP id
MASP2 Exon 2 g.499C>T C/T BstUI rs450770448
Exon 3 g.609T>C T/C BsrDI rs4370651
g.684G>T G/T BsrI rs209711045
Promoter g.-306T>C T/C BsaJI rs718329990
SIRT1 g.-274C>G C/G SmaI rs42140046
RE = Restriction enzyme, SNPs = Single nucleotide polymorphisms
https://doi.org/10.1371/journal.pone.0267800.t002
Fig 1. A schematic diagram of the present study to assess the MASP2 gene polymorphism in the Sahiwal. (a) Schematic representation of the MASP2 gene with the
localization of the three identified SNPs. The blue gray, purple and dark blue bars represent exons, respectively; intervals represent introns. (b) DNA sequencing
chromatogram of the polymorphic fragment. (c) PCR-restriction fragment length polymorphism (PCR-RFLP) genotyping of the amplified loci.
https://doi.org/10.1371/journal.pone.0267800.g001
PLOS ONE Inputs for optimizing selection platform for dairy Sahiwal cattle
PLOS ONE | https://doi.org/10.1371/journal.pone.0267800 May 23, 2022 6 / 19
Allelic and genotypic frequencies of SNPs in MASP2 and SIRT1 genes
The genotype, allelic frequencies, expected heterozygosity, observed heterozygosity, effective
population size and its corresponding Chi-squared test to determine whether the population
was in Hardy-Weinberg Equilibrium (HWE) or not are presented in Table 3. The level of sig-
nificance used in the test was 0.05; thus, values above 0.05 indicate that the population was in
HWE. Notably, two SNPs (g.499C>T and g.684G>T), the individual frequencies of the geno-
types were severely out of Hardy Weinberg equilibrium (HWE). The possible explanation for
this could be: (1) Hence Sahiwal is one of the well-established zebu cattle breeds known to
have good genetic potential to produce considerably large quantities of milk in India, selection
pressure for the increasement of milk production infer the loss of non-favourable alleles. (2)
The effect of small population size used for the study cannot be neglected.
Fig 2. A schematic diagram of the present study to assess the SIRT1 gene polymorphism in the Sahiwal. (a)
Schematic representation of the SIRT1 gene with the localization of the identified SNP. The line arrow, blue gray and
dark blue boxes represent promoter and exons, respectively; intervals represent introns. (b) DNA sequencing
chromatogram of the polymorphic fragment. (c) PCR-restriction fragment length polymorphism (PCR-RFLP)
genotyping of the amplified locus.
https://doi.org/10.1371/journal.pone.0267800.g002
PLOS ONE Inputs for optimizing selection platform for dairy Sahiwal cattle
PLOS ONE | https://doi.org/10.1371/journal.pone.0267800 May 23, 2022 7 / 19
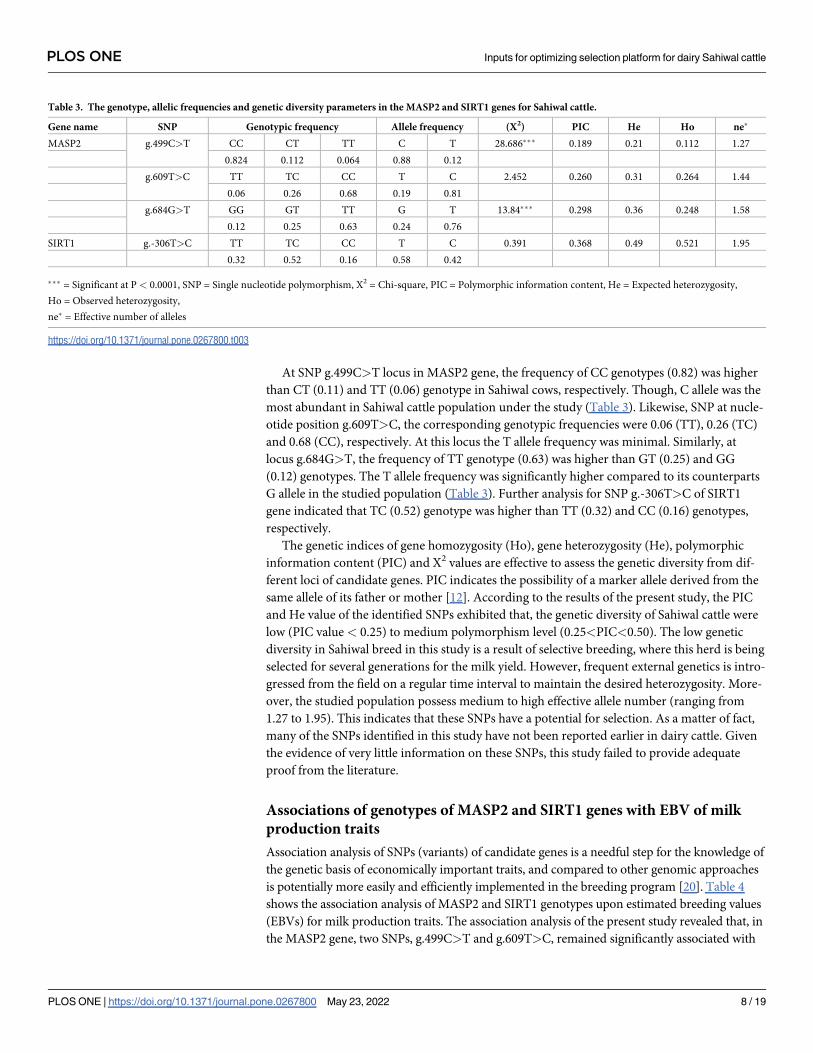
At SNP g.499C>T locus in MASP2 gene, the frequency of CC genotypes (0.82) was higher
than CT (0.11) and TT (0.06) genotype in Sahiwal cows, respectively. Though, C allele was the
most abundant in Sahiwal cattle population under the study (Table 3). Likewise, SNP at nucle-
otide position g.609T>C, the corresponding genotypic frequencies were 0.06 (TT), 0.26 (TC)
and 0.68 (CC), respectively. At this locus the T allele frequency was minimal. Similarly, at
locus g.684G>T, the frequency of TT genotype (0.63) was higher than GT (0.25) and GG
(0.12) genotypes. The T allele frequency was significantly higher compared to its counterparts
G allele in the studied population (Table 3). Further analysis for SNP g.-306T>C of SIRT1
gene indicated that TC (0.52) genotype was higher than TT (0.32) and CC (0.16) genotypes,
respectively.
The genetic indices of gene homozygosity (Ho), gene heterozygosity (He), polymorphic
information content (PIC) and X2 values are effective to assess the genetic diversity from dif-
ferent loci of candidate genes. PIC indicates the possibility of a marker allele derived from the
same allele of its father or mother [12]. According to the results of the present study, the PIC
and He value of the identified SNPs exhibited that, the genetic diversity of Sahiwal cattle were
low (PIC value < 0.25) to medium polymorphism level (0.25<PIC<0.50). The low genetic
diversity in Sahiwal breed in this study is a result of selective breeding, where this herd is being
selected for several generations for the milk yield. However, frequent external genetics is intro-
gressed from the field on a regular time interval to maintain the desired heterozygosity. More-
over, the studied population possess medium to high effective allele number (ranging from
1.27 to 1.95). This indicates that these SNPs have a potential for selection. As a matter of fact,
many of the SNPs identified in this study have not been reported earlier in dairy cattle. Given
the evidence of very little information on these SNPs, this study failed to provide adequate
proof from the literature.
Associations of genotypes of MASP2 and SIRT1 genes with EBV of milk
production traits
Association analysis of SNPs (variants) of candidate genes is a needful step for the knowledge of
the genetic basis of economically important traits, and compared to other genomic approaches
is potentially more easily and efficiently implemented in the breeding program [20]. Table 4
shows the association analysis of MASP2 and SIRT1 genotypes upon estimated breeding values
(EBVs) for milk production traits. The association analysis of the present study revealed that, in
the MASP2 gene, two SNPs, g.499C>T and g.609T>C, remained significantly associated with
Table 3. The genotype, allelic frequencies and genetic diversity parameters in the MASP2 and SIRT1 genes for Sahiwal cattle.
Gene name SNP Genotypic frequency Allele frequency (X2) PIC He Ho ne�
MASP2 g.499C>T CC CT TT C T 28.686��� 0.189 0.21 0.112 1.27
0.824 0.112 0.064 0.88 0.12
g.609T>C TT TC CC T C 2.452 0.260 0.31 0.264 1.44
0.06 0.26 0.68 0.19 0.81
g.684G>T GG GT TT G T 13.84��� 0.298 0.36 0.248 1.58
0.12 0.25 0.63 0.24 0.76
SIRT1 g.-306T>C TT TC CC T C 0.391 0.368 0.49 0.521 1.95
0.32 0.52 0.16 0.58 0.42
��� = Significant at P < 0.0001, SNP = Single nucleotide polymorphism, X2 = Chi-square, PIC = Polymorphic information content, He = Expected heterozygosity,
Ho = Observed heterozygosity,
ne� = Effective number of alleles
https://doi.org/10.1371/journal.pone.0267800.t003
PLOS ONE Inputs for optimizing selection platform for dairy Sahiwal cattle
PLOS ONE | https://doi.org/10.1371/journal.pone.0267800 May 23, 2022 8 / 19
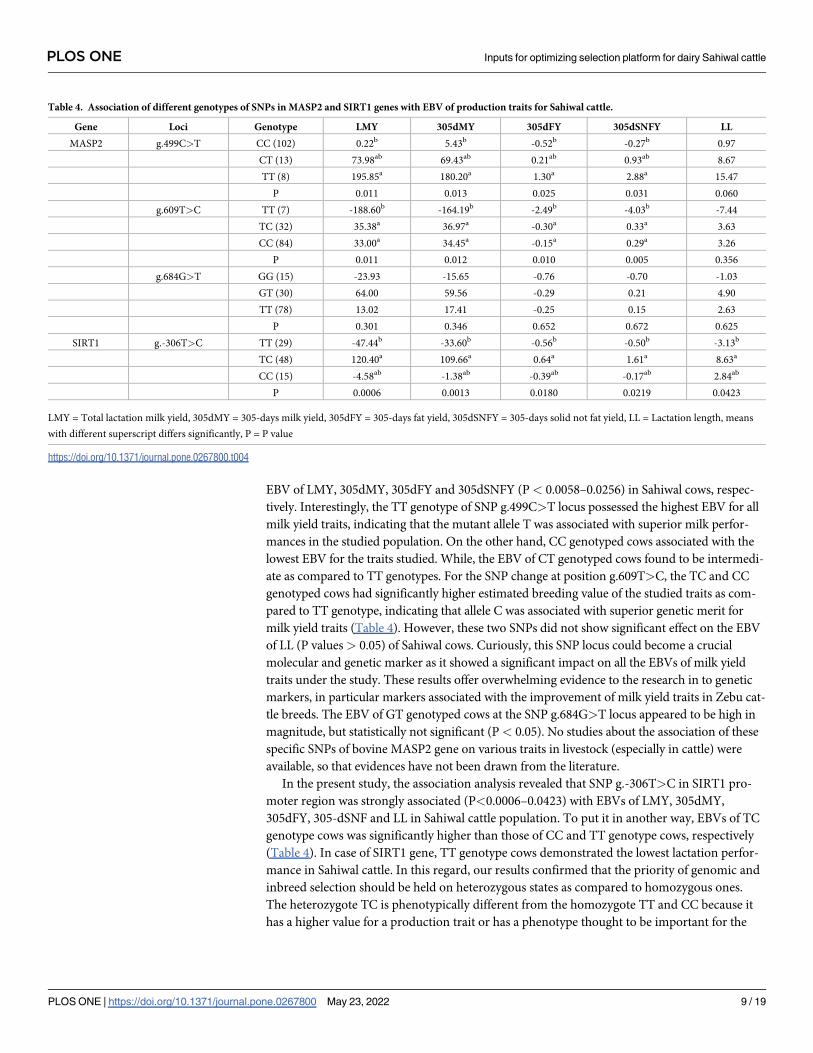
EBV of LMY, 305dMY, 305dFY and 305dSNFY (P< 0.0058–0.0256) in Sahiwal cows, respec-
tively. Interestingly, the TT genotype of SNP g.499C>T locus possessed the highest EBV for all
milk yield traits, indicating that the mutant allele T was associated with superior milk perfor-
mances in the studied population. On the other hand, CC genotyped cows associated with the
lowest EBV for the traits studied. While, the EBV of CT genotyped cows found to be intermedi-
ate as compared to TT genotypes. For the SNP change at position g.609T>C, the TC and CC
genotyped cows had significantly higher estimated breeding value of the studied traits as com-
pared to TT genotype, indicating that allele C was associated with superior genetic merit for
milk yield traits (Table 4). However, these two SNPs did not show significant effect on the EBV
of LL (P values> 0.05) of Sahiwal cows. Curiously, this SNP locus could become a crucial
molecular and genetic marker as it showed a significant impact on all the EBVs of milk yield
traits under the study. These results offer overwhelming evidence to the research in to genetic
markers, in particular markers associated with the improvement of milk yield traits in Zebu cat-
tle breeds. The EBV of GT genotyped cows at the SNP g.684G>T locus appeared to be high in
magnitude, but statistically not significant (P< 0.05). No studies about the association of these
specific SNPs of bovine MASP2 gene on various traits in livestock (especially in cattle) were
available, so that evidences have not been drawn from the literature.
In the present study, the association analysis revealed that SNP g.-306T>C in SIRT1 pro-
moter region was strongly associated (P<0.0006–0.0423) with EBVs of LMY, 305dMY,
305dFY, 305-dSNF and LL in Sahiwal cattle population. To put it in another way, EBVs of TC
genotype cows was significantly higher than those of CC and TT genotype cows, respectively
(Table 4). In case of SIRT1 gene, TT genotype cows demonstrated the lowest lactation perfor-
mance in Sahiwal cattle. In this regard, our results confirmed that the priority of genomic and
inbreed selection should be held on heterozygous states as compared to homozygous ones.
The heterozygote TC is phenotypically different from the homozygote TT and CC because it
has a higher value for a production trait or has a phenotype thought to be important for the
Table 4. Association of different genotypes of SNPs in MASP2 and SIRT1 genes with EBV of production traits for Sahiwal cattle.
Gene Loci Genotype LMY 305dMY 305dFY 305dSNFY LL
MASP2 g.499C>T CC (102) 0.22b 5.43b -0.52b -0.27b 0.97
CT (13) 73.98ab 69.43ab 0.21ab 0.93ab 8.67
TT (8) 195.85a 180.20a 1.30a 2.88a 15.47
P 0.011 0.013 0.025 0.031 0.060
g.609T>C TT (7) -188.60b -164.19b -2.49b -4.03b -7.44
TC (32) 35.38a 36.97a -0.30a 0.33a 3.63
CC (84) 33.00a 34.45a -0.15a 0.29a 3.26
P 0.011 0.012 0.010 0.005 0.356
g.684G>T GG (15) -23.93 -15.65 -0.76 -0.70 -1.03
GT (30) 64.00 59.56 -0.29 0.21 4.90
TT (78) 13.02 17.41 -0.25 0.15 2.63
P 0.301 0.346 0.652 0.672 0.625
SIRT1 g.-306T>C TT (29) -47.44b -33.60b -0.56b -0.50b -3.13b
TC (48) 120.40a 109.66a 0.64a 1.61a 8.63a
CC (15) -4.58ab -1.38ab -0.39ab -0.17ab 2.84ab
P 0.0006 0.0013 0.0180 0.0219 0.0423
LMY = Total lactation milk yield, 305dMY = 305-days milk yield, 305dFY = 305-days fat yield, 305dSNFY = 305-days solid not fat yield, LL = Lactation length, means
with different superscript differs significantly, P = P value
https://doi.org/10.1371/journal.pone.0267800.t004
PLOS ONE Inputs for optimizing selection platform for dairy Sahiwal cattle
PLOS ONE | https://doi.org/10.1371/journal.pone.0267800 May 23, 2022 9 / 19
studied breed, then the heterozygote TC can have a selective advantage due to artificial selec-
tion. To the best of our knowledge, no other studies have found this specific SNP g.-306T>C
and its impact on economically important traits in dairy cattle breeds. In this study, we provide
the first evidence for the significant association of the g.-306T>C variant with milk yield traits
in dairy cattle.
Mannose binding lectin associated serine protease 2 (MASP2) is the central protease in the
complement system. The complement lectin pathway is an important component of the innate
immunity, in which MASP1 is one of the central proteases. Coupled with this, earlier study
[21] reported that the lectin pathway might be activated in subjects with chlorine-esterase-
inhibitor deficiency, which is linked with low MASP-2 and complement 4 levels. Previous
study [14] identified the SNP (G553A) in the third exon (CUB1 domain) of bovine MASP2
gene and investigated the significant association of this SNP and somatic cell score in Chinese
Holstein cattle. Moreover, three other SNPs (g.14047A>C, g.14248T>C and g.14391C>T) in
the eleventh and 3’UTR region of MASP2 gene are also reported [15]. Accordingly, they
reported that the SNPs g.14047A>C and g.14248T>C were significantly associated with pro-
tein percentage and 305-day milk yield, respectively. Specifically, they mentioned that, cows
with genotype TT had higher 305-day milk yield than those with genotype of TC of
g.14248T > C locus. However, here in our study, we did not find these SNPs, but three other
SNPs (g.499C>T and g.609T>C and g.684G>T) in exon 2 and 3 region were explored (Fig 2).
In light of all these, the results from this study suggests that, the SNPs g.499C>T
(rs450770448) and g.609T>C (rs4370651) in MASP2 gene can be a useful candidate gene for
milk production traits and would be applied in marker assisted selection in dairy cattle. How-
ever, the results need to be interpreted with caution, hence the favourable genotypes are based
up on relatively small number of observations, much larger sample sizes are needed to obtain a
reasonable number of TT genotypes for critical comparison.
Mammalian SIRT1gene has evolved to modify the activity of a growing number of tran-
scription factors, including P53, NF-κB, and PGC-1α, suggesting that SIRT1 functions in a
wide range of cellular responses to stress, inflammation, and nutrients. Until now, in bovine
species, only few studies in silent information regulator 1 gene polymorphisms in dairy ani-
mals have been reported in the literature. Earlier study [12] explored the presence of 5 SNPs,
of which g.-382G>A and g.-274C>G located in the promoter region, while g.17324T>C,
g.17379A>G and g.17491G > A located in noncoding regions of the SIRT1 gene. Subse-
quently, some studies [22, 23] also examined many noncoding mutations in the 3’UTR region
of the SIRT1 gene (g.25764G>A, g.25846A>G, g.25868T>C, g.25751A>C). Some of the
above-mentioned SNPs significantly influenced various growth and carcass traits in Nanyang,
Qinchuan and Luxi cattle breeds [12, 22, 24]. Even though the previous studies in SIRT1 gene
relied on various growth and carcass traits, other work [13] reported the significant effect of
g.-274C>G locus for milk production and reproductive performance traits in Agerolese cattle
breed. In this study, we detected two SNPs (g.-306T>C and g.-274C>G) in the promoter
region of the gene, nonetheless, the SNP g.-274C>G found to be monomorphic in the studied
Sahiwal cattle population. In this study, we provide the first evidence for significant association
of the g.-306T>C variant with milk yield traits in dairy cattle.
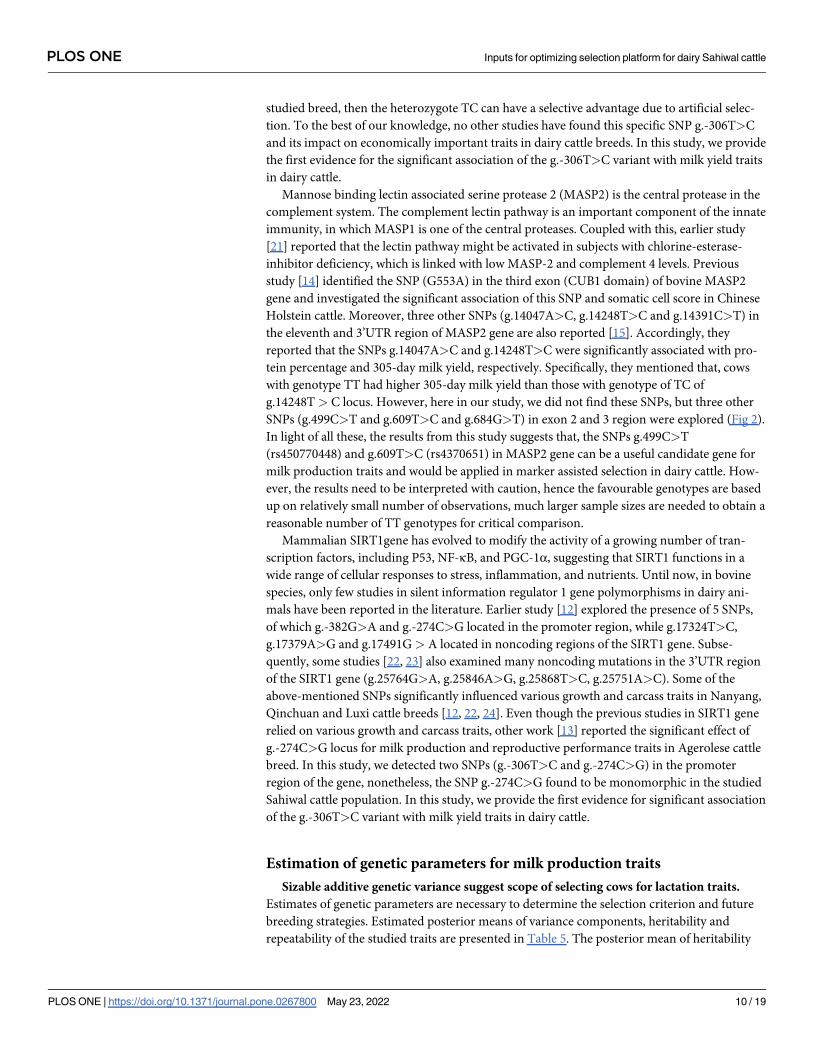
Estimation of genetic parameters for milk production traits
Sizable additive genetic variance suggest scope of selecting cows for lactation traits.
Estimates of genetic parameters are necessary to determine the selection criterion and future
breeding strategies. Estimated posterior means of variance components, heritability and
repeatability of the studied traits are presented in Table 5. The posterior mean of heritability
PLOS ONE Inputs for optimizing selection platform for dairy Sahiwal cattle
PLOS ONE | https://doi.org/10.1371/journal.pone.0267800 May 23, 2022 10 / 19
estimates for milk production traits ranged between 0.13 and 0.24 for first lactation traits and
0.06 and 0.12 for whole lactation traits (repeatability model), respectively (Table 5). The esti-
mates were better for the first parity and relatively less in magnitude for all parities combined
together using repeatability model. Relatively better h2 estimates for first lactation milk pro-
duction traits were observed as the data for first parity is free of selection and culling bias. The
decline of h2 estimates in all of the analyzed traits from whole lactations may also be attributed
to a large increase in permanent environmental variance. The moderate heritability estimates
for first lactation milk production traits (LMY: 0.20±0.08, 305dMY: 0.17±0.08, 305dFY: 0.13
Table 5. Estimates of posterior means of variance components and genetic parameter estimates for milk production traits in Sahiwal cattle.
Traits σ2a σ2
pe σ2e σ2
p h2±PSD r±PSD
Whole lactation (1st parity-6th parity)
LMY 10950 35043 46527 92520 0.12±0.04 0.50±0.02
305dMY 9010 28279 40471 77759 0.115±0.04 0.48±0.02
305dFY 22.9 85.86 303.7 412.56 0.06±0.03 0.26 ± 0.03
305dSNF 78.8 346.64 1001.5 1426 0.06 ± 0.03 0.30±0.03
LL 305.5 372.4 3631.6 4309.5 0.07± 0.02 0.16±0.02
First lactation (1st parity)
LMY 18054 - 72795 90849 0.20±0.08 -
305dMY 8438.4 - 42683 51122 0.17±0.08 -
305dFY 150.63 - 990.81 1141.4 0.13±0.09 -
305dSNFY 511.20 - 3394.9 3906.1 0.13±0.09 -
LL 1861.7 - 5977.2 7838.8 0.24±0.07 -
LMY = Total lactation milk yield, 305dMY = 305-days milk yield, 305dFY = 305-days fat yield, 305dSNFY = 305-days solid not fat yield, LL = Lactation length, σ2a =
Additive genetic variance, σ2pe = Permanent environment variance, σ2
e = Residual variance, σ2p = Phenotypic variance, h2 = Heritability, PSD = Posterior standard
deviation, r = Repeatability
https://doi.org/10.1371/journal.pone.0267800.t005
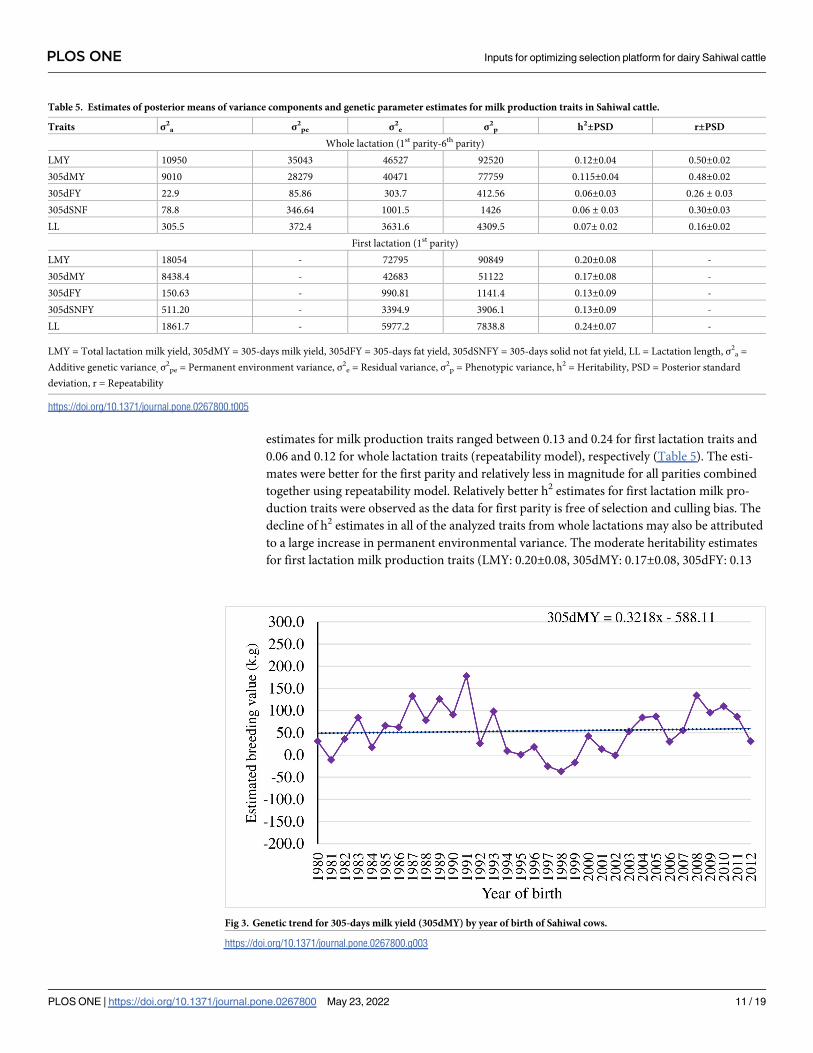
Fig 3. Genetic trend for 305-days milk yield (305dMY) by year of birth of Sahiwal cows.
https://doi.org/10.1371/journal.pone.0267800.g003
PLOS ONE Inputs for optimizing selection platform for dairy Sahiwal cattle
PLOS ONE | https://doi.org/10.1371/journal.pone.0267800 May 23, 2022 11 / 19
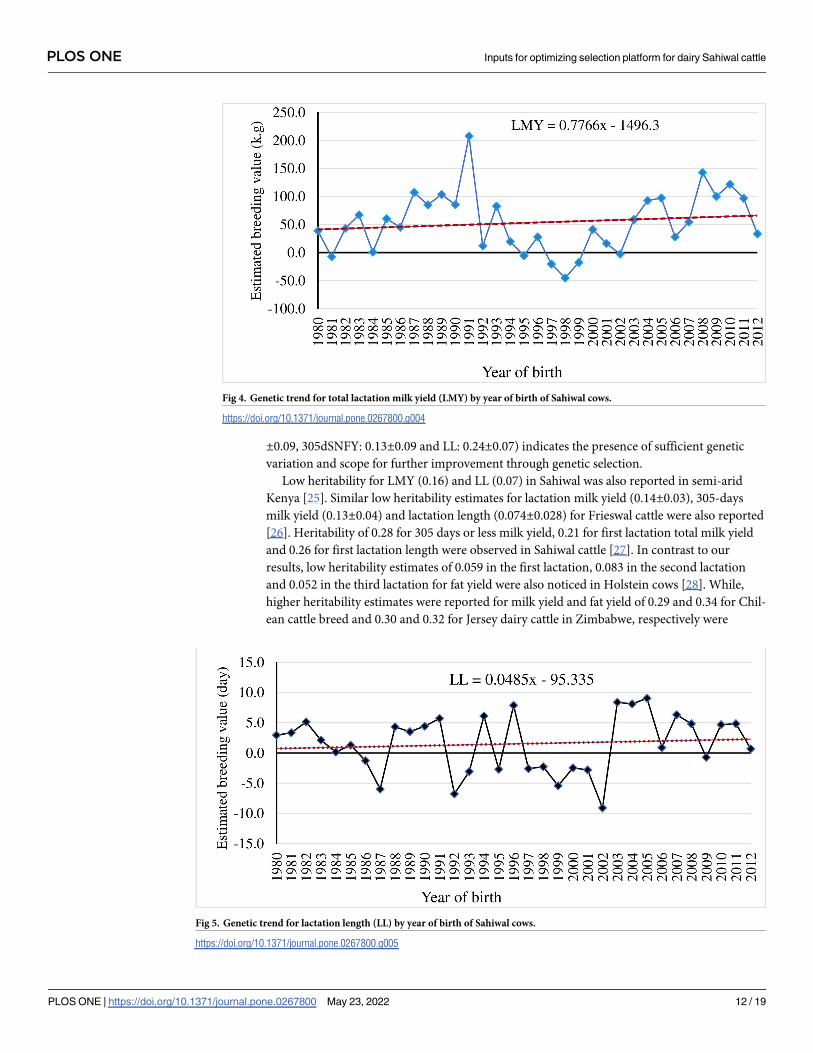
±0.09, 305dSNFY: 0.13±0.09 and LL: 0.24±0.07) indicates the presence of sufficient genetic
variation and scope for further improvement through genetic selection.
Low heritability for LMY (0.16) and LL (0.07) in Sahiwal was also reported in semi-arid
Kenya [25]. Similar low heritability estimates for lactation milk yield (0.14±0.03), 305-days
milk yield (0.13±0.04) and lactation length (0.074±0.028) for Frieswal cattle were also reported
[26]. Heritability of 0.28 for 305 days or less milk yield, 0.21 for first lactation total milk yield
and 0.26 for first lactation length were observed in Sahiwal cattle [27]. In contrast to our
results, low heritability estimates of 0.059 in the first lactation, 0.083 in the second lactation
and 0.052 in the third lactation for fat yield were also noticed in Holstein cows [28]. While,
higher heritability estimates were reported for milk yield and fat yield of 0.29 and 0.34 for Chil-
ean cattle breed and 0.30 and 0.32 for Jersey dairy cattle in Zimbabwe, respectively were
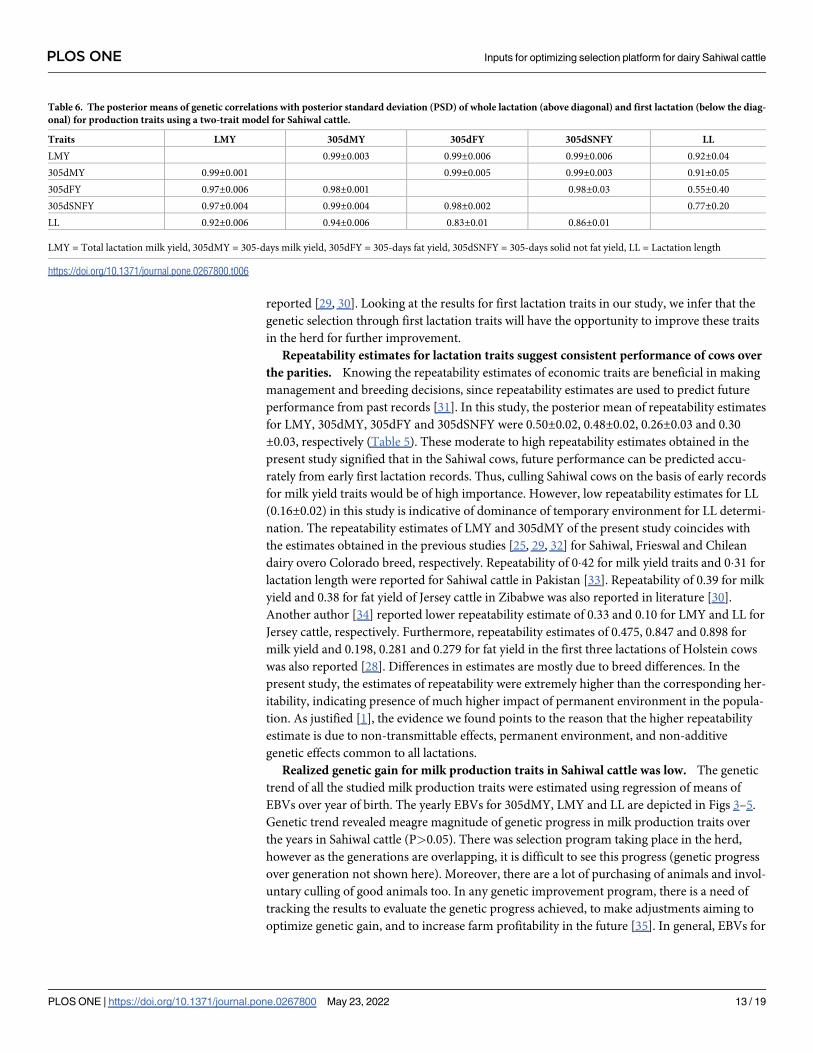
Fig 5. Genetic trend for lactation length (LL) by year of birth of Sahiwal cows.
https://doi.org/10.1371/journal.pone.0267800.g005
Fig 4. Genetic trend for total lactation milk yield (LMY) by year of birth of Sahiwal cows.
https://doi.org/10.1371/journal.pone.0267800.g004
PLOS ONE Inputs for optimizing selection platform for dairy Sahiwal cattle
PLOS ONE | https://doi.org/10.1371/journal.pone.0267800 May 23, 2022 12 / 19
reported [29, 30]. Looking at the results for first lactation traits in our study, we infer that the
genetic selection through first lactation traits will have the opportunity to improve these traits
in the herd for further improvement.
Repeatability estimates for lactation traits suggest consistent performance of cows over
the parities. Knowing the repeatability estimates of economic traits are beneficial in making
management and breeding decisions, since repeatability estimates are used to predict future
performance from past records [31]. In this study, the posterior mean of repeatability estimates
for LMY, 305dMY, 305dFY and 305dSNFY were 0.50±0.02, 0.48±0.02, 0.26±0.03 and 0.30
±0.03, respectively (Table 5). These moderate to high repeatability estimates obtained in the
present study signified that in the Sahiwal cows, future performance can be predicted accu-
rately from early first lactation records. Thus, culling Sahiwal cows on the basis of early records
for milk yield traits would be of high importance. However, low repeatability estimates for LL
(0.16±0.02) in this study is indicative of dominance of temporary environment for LL determi-
nation. The repeatability estimates of LMY and 305dMY of the present study coincides with
the estimates obtained in the previous studies [25, 29, 32] for Sahiwal, Frieswal and Chilean
dairy overo Colorado breed, respectively. Repeatability of 0�42 for milk yield traits and 0�31 for
lactation length were reported for Sahiwal cattle in Pakistan [33]. Repeatability of 0.39 for milk
yield and 0.38 for fat yield of Jersey cattle in Zibabwe was also reported in literature [30].
Another author [34] reported lower repeatability estimate of 0.33 and 0.10 for LMY and LL for
Jersey cattle, respectively. Furthermore, repeatability estimates of 0.475, 0.847 and 0.898 for
milk yield and 0.198, 0.281 and 0.279 for fat yield in the first three lactations of Holstein cows
was also reported [28]. Differences in estimates are mostly due to breed differences. In the
present study, the estimates of repeatability were extremely higher than the corresponding her-
itability, indicating presence of much higher impact of permanent environment in the popula-
tion. As justified [1], the evidence we found points to the reason that the higher repeatability
estimate is due to non-transmittable effects, permanent environment, and non-additive
genetic effects common to all lactations.
Realized genetic gain for milk production traits in Sahiwal cattle was low. The genetic
trend of all the studied milk production traits were estimated using regression of means of
EBVs over year of birth. The yearly EBVs for 305dMY, LMY and LL are depicted in Figs 3–5.
Genetic trend revealed meagre magnitude of genetic progress in milk production traits over
the years in Sahiwal cattle (P>0.05). There was selection program taking place in the herd,
however as the generations are overlapping, it is difficult to see this progress (genetic progress
over generation not shown here). Moreover, there are a lot of purchasing of animals and invol-
untary culling of good animals too. In any genetic improvement program, there is a need of
tracking the results to evaluate the genetic progress achieved, to make adjustments aiming to
optimize genetic gain, and to increase farm profitability in the future [35]. In general, EBVs for
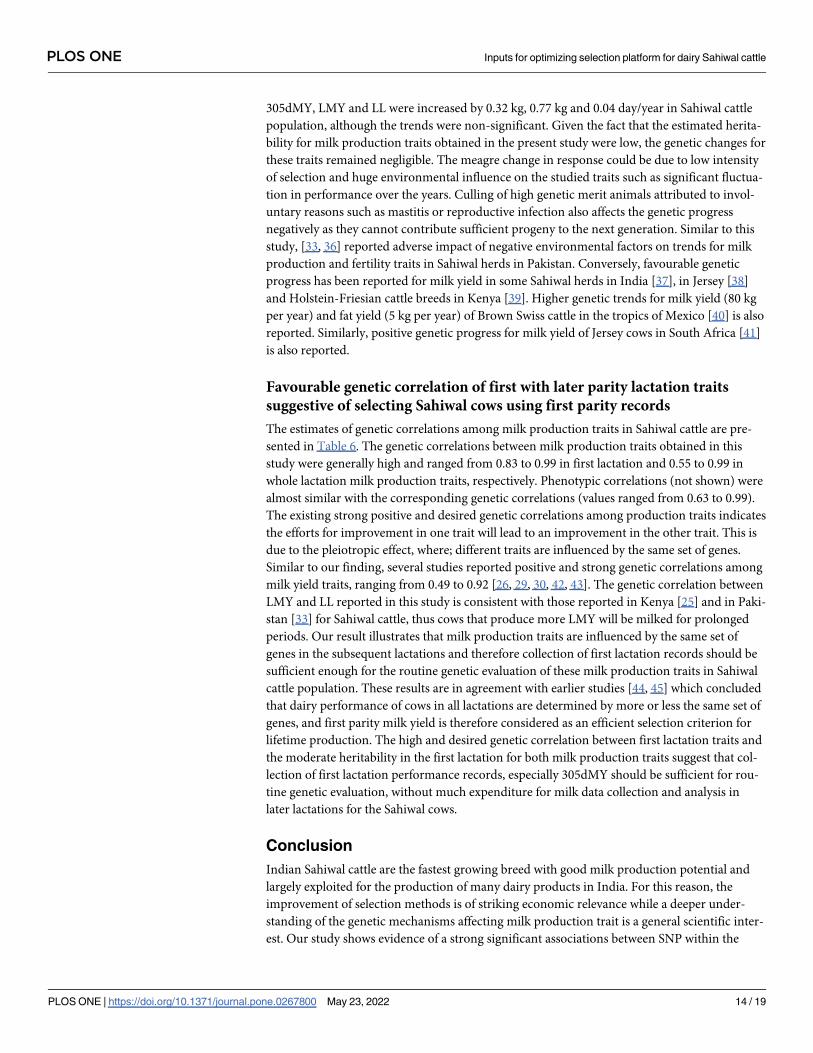
Table 6. The posterior means of genetic correlations with posterior standard deviation (PSD) of whole lactation (above diagonal) and first lactation (below the diag-
onal) for production traits using a two-trait model for Sahiwal cattle.
Traits LMY 305dMY 305dFY 305dSNFY LL
LMY 0.99±0.003 0.99±0.006 0.99±0.006 0.92±0.04
305dMY 0.99±0.001 0.99±0.005 0.99±0.003 0.91±0.05
305dFY 0.97±0.006 0.98±0.001 0.98±0.03 0.55±0.40
305dSNFY 0.97±0.004 0.99±0.004 0.98±0.002 0.77±0.20
LL 0.92±0.006 0.94±0.006 0.83±0.01 0.86±0.01
LMY = Total lactation milk yield, 305dMY = 305-days milk yield, 305dFY = 305-days fat yield, 305dSNFY = 305-days solid not fat yield, LL = Lactation length
https://doi.org/10.1371/journal.pone.0267800.t006
PLOS ONE Inputs for optimizing selection platform for dairy Sahiwal cattle
PLOS ONE | https://doi.org/10.1371/journal.pone.0267800 May 23, 2022 13 / 19
305dMY, LMY and LL were increased by 0.32 kg, 0.77 kg and 0.04 day/year in Sahiwal cattle
population, although the trends were non-significant. Given the fact that the estimated herita-
bility for milk production traits obtained in the present study were low, the genetic changes for
these traits remained negligible. The meagre change in response could be due to low intensity
of selection and huge environmental influence on the studied traits such as significant fluctua-
tion in performance over the years. Culling of high genetic merit animals attributed to invol-
untary reasons such as mastitis or reproductive infection also affects the genetic progress
negatively as they cannot contribute sufficient progeny to the next generation. Similar to this
study, [33, 36] reported adverse impact of negative environmental factors on trends for milk
production and fertility traits in Sahiwal herds in Pakistan. Conversely, favourable genetic
progress has been reported for milk yield in some Sahiwal herds in India [37], in Jersey [38]
and Holstein-Friesian cattle breeds in Kenya [39]. Higher genetic trends for milk yield (80 kg
per year) and fat yield (5 kg per year) of Brown Swiss cattle in the tropics of Mexico [40] is also
reported. Similarly, positive genetic progress for milk yield of Jersey cows in South Africa [41]
is also reported.
Favourable genetic correlation of first with later parity lactation traits
suggestive of selecting Sahiwal cows using first parity records
The estimates of genetic correlations among milk production traits in Sahiwal cattle are pre-
sented in Table 6. The genetic correlations between milk production traits obtained in this
study were generally high and ranged from 0.83 to 0.99 in first lactation and 0.55 to 0.99 in
whole lactation milk production traits, respectively. Phenotypic correlations (not shown) were
almost similar with the corresponding genetic correlations (values ranged from 0.63 to 0.99).
The existing strong positive and desired genetic correlations among production traits indicates
the efforts for improvement in one trait will lead to an improvement in the other trait. This is
due to the pleiotropic effect, where; different traits are influenced by the same set of genes.
Similar to our finding, several studies reported positive and strong genetic correlations among
milk yield traits, ranging from 0.49 to 0.92 [26, 29, 30, 42, 43]. The genetic correlation between
LMY and LL reported in this study is consistent with those reported in Kenya [25] and in Paki-
stan [33] for Sahiwal cattle, thus cows that produce more LMY will be milked for prolonged
periods. Our result illustrates that milk production traits are influenced by the same set of
genes in the subsequent lactations and therefore collection of first lactation records should be
sufficient enough for the routine genetic evaluation of these milk production traits in Sahiwal
cattle population. These results are in agreement with earlier studies [44, 45] which concluded
that dairy performance of cows in all lactations are determined by more or less the same set of
genes, and first parity milk yield is therefore considered as an efficient selection criterion for
lifetime production. The high and desired genetic correlation between first lactation traits and
the moderate heritability in the first lactation for both milk production traits suggest that col-
lection of first lactation performance records, especially 305dMY should be sufficient for rou-
tine genetic evaluation, without much expenditure for milk data collection and analysis in
later lactations for the Sahiwal cows.
Conclusion
Indian Sahiwal cattle are the fastest growing breed with good milk production potential and
largely exploited for the production of many dairy products in India. For this reason, the
improvement of selection methods is of striking economic relevance while a deeper under-
standing of the genetic mechanisms affecting milk production trait is a general scientific inter-
est. Our study shows evidence of a strong significant associations between SNP within the
PLOS ONE Inputs for optimizing selection platform for dairy Sahiwal cattle
PLOS ONE | https://doi.org/10.1371/journal.pone.0267800 May 23, 2022 14 / 19
MASP2 (g.499C>T and g.609T>C) and SIRT1 (g.-306T>C) gene and milk production traits
in Sahiwal cows, indicating the potential role of MASP2 and SIRT1 variants in these traits.
After validation on large sample size population, the identified alleles could be included in the
selection program. In this study, milk production traits had better heritability estimate for the
first lactation traits compared to the estimates from the whole lactations. Therefore, a high
response to selection in first lactation traits would be expected in this population. The repeat-
ability estimates for milk yield traits were medium to high, implying that selection of cows
based on early performance is possible. Strong positive and desired genetic correlation of
305dMY with other lactation traits in first parity indicates that the Sahiwal cows can be further
selected using 305dMY trait only in the first parity, which will bring overall improvement in
the other lactation traits and will reduce cost on resource management. Taken together, a
2-stage selection approach, select Sahiwal animals early for the SNP and then on the basis of
30dMY will help to improve genetic potential and also save resources.
Supporting information
S1 File. Parameter file for genetic parameter estimation of milk production traits in Sahi-
wal cattle using single trait Gibbs sampling repeatability animal model.
(PDF)
S2 File. Parameter file for genetic parameter estimation of first lactation traits in Sahiwal
cattle using single trait Gibbs sampling animal model.
(PDF)
S3 File. Estimated breeding value data of milk production traits for Sahiwal cattle.
(XLSX)
S1 Raw image. Agarose gel electrophoresis (1.5%) of PCR products of Exon 2 & 3 in
MASP2 gene. The original gel image data was captured by a UV trans illuminator gel docu-
mentation system and saved as tiff file. Lane 1–33: PCR product (583 bp). Lane M1, M2: 100
bp DNA marker.
(PDF)
S2 Raw image. Agarose gel electrophoresis (1.7%) of PCR products of promoter region of
SIRT1 gene. The original gel image data was captured by gel documentation system (Gel.
LUMINAX) and saved as tiff file. The lanes marked with “X” are non-specific amplifications
and these experimental samples are not included in further genotyping purpose. Lane 2–17:
PCR product (273 bp). Lane M: 100 bp DNA marker.
(PDF)
S3 Raw image. Raw gel images of PCR-RFLP genotyping of the SNPs g.499C>T,
g.609T>C and g.684G>T within MASP2 gene in Fig 1C. (A) The PCR products of MASP2
gene at the SNP g.499C>T locus in Fig 1C was digested with BstUI enzyme and the digested
products were separated by 2.8% agarose gel electrophoresis stained with ethidium bromide.
The original gel image data was captured by a gel documentation system (Gel.LUMINAX) and
saved as tiff file. The fragment sizes of the identified genotypes are shown in the left (583, 373
and 210 bp). Three genotypes were detected in this experimental population, namely CC
(lanes 4, 6, 7, 8, 10–15), CT (lanes 1, 2, 3, 5) and TT (lane 9). Lane M is the 100 bp marker. The
lanes not included in the final Fig 1C marked with “X” above the lane label on the original gel
image. The final figure panel generated from the original image is shown in Fig 1C (left). (B)
The PCR products of MASP2 gene at the SNP g.609T>C locus in Fig 1C was digested with
BsrDI enzyme and the digested products were separated by 2.8% agarose gel electrophoresis
PLOS ONE Inputs for optimizing selection platform for dairy Sahiwal cattle
PLOS ONE | https://doi.org/10.1371/journal.pone.0267800 May 23, 2022 15 / 19
stained with ethidium bromide. The original gel image data was captured by a gel documenta-
tion system (Gel.LUMINAX) and saved as tiff file. The fragment sizes of the identified geno-
types are shown in the right (583, 322 and 261 bp). Three genotypes were detected in this
experimental population, namely TT (lane 1), TC (lanes 4, 6) and CC (lanes 2, 3, 5). Lane M is
the 100 bp marker. The lanes not included in Fig 1C marked with “X” above the lane label on
the original gel image. The final figure panel generated from the original image is shown in Fig
1C (middle). (C) The PCR products of MASP2 gene at the SNP g.684G>T locus in Fig 1C was
digested with BsrI enzyme and the digested products were separated by 2.8% agarose gel elec-
trophoresis stained with ethidium bromide. The original gel image data was captured by a gel
documentation system (Gel.LUMINAX) and saved as tiff file. Three genotypes, GG (lane 5),
GT (lanes 2, 4, 7, 10) and TT (lanes 1, 3, 6, 8, 9, 11, 12) were detected in this experimental pop-
ulation. Lane M is the 100 bp marker. The lanes not included in Fig 1C marked with “X” above
the lane label on the original gel image. The final figure panel generated from the original
image is shown in Fig 1C (right).
(PDF)
S4 Raw image. Raw gel image of PCR-RFLP genotyping of the SNP g.-306T>C within
SIRT1 gene in Fig 2C. The PCR products of the SIRT1 gene at the SNP g.-306T>C locus in
Fig 2C was digested with BsaJI enzyme and the digested products were separated by 3% aga-
rose gel electrophoresis stained with ethidium bromide. The original gel image data was cap-
tured by a gel documentation system (Gel.LUMINAX) and saved as tiff file. Three genotypes
were detected in this experimental population, namely TT (lanes 1, 2, 5, 7, 8), TC (3, 6, 9–11)
and CC (lanes 4, 12). For TC and CC genotypes, the fragment sizes of 39, 29 and 8 bp are invis-
ible in the figure. Lane M is the 100 bp marker. The lanes not included in the final Fig 2C
marked with “X” above the lane label on the original gel image. The final figure panel gener-
ated from the original image is shown in Fig 2C.
(PDF)
Acknowledgments
Authors would like to acknowledge the Director, ICAR-National Dairy Research Institute,
Head, Dairy Cattle Breeding Division for providing necessary facilities in the lab for carrying
out the above work.
Author Contributions
Conceptualization: Destaw Worku, Gopal Gowane, Archana Verma.
Data curation: Destaw Worku, Gopal Gowane.
Formal analysis: Destaw Worku.
Investigation: Destaw Worku, Gopal Gowane, Archana Verma.
Methodology: Destaw Worku, Gopal Gowane.
Resources: Archana Verma.
Software: Destaw Worku.
Supervision: Gopal Gowane, Archana Verma.
Validation: Destaw Worku, Gopal Gowane, Archana Verma.
Visualization: Destaw Worku, Gopal Gowane, Rani Alex, Pooja Joshi, Archana Verma.
PLOS ONE Inputs for optimizing selection platform for dairy Sahiwal cattle
PLOS ONE | https://doi.org/10.1371/journal.pone.0267800 May 23, 2022 16 / 19

Writing – original draft: Destaw Worku.
Writing – review & editing: Destaw Worku, Gopal Gowane, Rani Alex, Pooja Joshi, Archana
Verma.
References1. Sajjad T. Quantitative genetic application in the selection process for livestock production. In Livestock
production (ed. Javed K), IntechOpen, Rijeka, Croatio. 2012; 3–32.
2. Rempel LA, Nonneman DJ, Wise TH, Erkens T, Peelman LJ, Rohrer GA. Association analyses of can-
didate single nucleotide polymorphisms on reproductive traits in swine. J Anim Sci. 2010; 88: 1–15.
https://doi.org/10.2527/jas.2009-1985 PMID: 19749016
3. Fortes MRS, Reverter A, Nagaraj SH, Zhang Y, Jonsson NN, Barris W, et al. A single nucleotide poly-
morphism-derived regulatory gene network underlying puberty in 2 tropical breeds of beef cattle. J Anim
Sci. 2011; 89:1669–83. https://doi.org/10.2527/jas.2010-3681 PMID: 21357453
4. Goddard M, Hayes B. Mapping genes for complex traits in domestic animals and their use in breeding
programmes. Nat Rev Genet. 2009; 10: 381–391. https://doi.org/10.1038/nrg2575 PMID: 19448663
5. Ogorevc J, Kunej T, Razpet A, et al. Database of cattle candidate genes and genetic markers for milk
production and mastitis. Anim. Genet. 2009; 40: 832–51. https://doi.org/10.1111/j.1365-2052.2009.
01921.x PMID: 19508288
6. Davis GH. Fecundity genes in sheep. Anim. Reprod. Sci. 2004; 82–83: 247–253. https://doi.org/10.
1016/j.anireprosci.2004.04.001 PMID: 15271457
7. Piper LR, Bindon BM, Davis GH. The single gene inheritance of the high litter size of the Booroola
Merino. In: Land R.B., Robinson D.W. (Eds.), Genetics of Reproduction in Sheep. Butterworths, Lon-
don, UK. 1985;115–125.
8. Grobet L, Royo Martin L, Poncelet D, et al. A deletion in the bovine myostatin gene causes the double–
muscled phenotype in cattle. Nat Genet. 1997; 17: 71–74. https://doi.org/10.1038/ng0997-71 PMID:
9288100
9. Grisart B, Farnir F, Karim L, Cambisano N, Kim J, Kvasz A, et al. Genetic and functional confirmation of
the causality of the DGAT1 K232A quantitative trait nucleotide in affecting milk yield and composition.
Proc Natl Acad Sci. 2004; 101: 2398–403. https://doi.org/10.1073/pnas.0308518100 PMID: 14983021
10. Blott S, Kim J, Moisio S, Schmidt-Kuntzel A, Cornet A, Berzi P, et al. Molecular dissection of a quantita-
tive trait locus: a phenylalanine-to-tyrosine substitution in the transmembrane domain of the bovine
growth hormone receptor is associated with a major effect on milk yield and composition. Genetics.
2003; 163: 253–66. https://doi.org/10.1093/genetics/163.1.253 PMID: 12586713
11. Cohen-Zinder M, Seroussi E, Larkin DM, Loor JJ, Wind AE, Lee JH, et al. Identification of a missense
mutation in the bovine ABCG2 gene with a major effect on the QTL on chromosome 6 affecting milk
yield and composition in Holstein cattle. Genome Res. 2005; 15: 936–944. https://doi.org/10.1101/gr.
3806705 PMID: 15998908
12. Li M, Sun X, Zhang L, Wang J, Huang Y, Sun Y, et al. A novel c.-274C >G polymorphism in bovine
SIRT1 gene contributes to diminished promoter activity and is associated with increased body size.
Anim. Genet. 2013a; 44:584–587.
13. Selvaggi M, Claudia C, Francesca C, Sara A, Giulio A, Vincenzo T and Cataldo D. Determination of a
possible relationship between a single nucleotide polymorphism (SNP) in the promoter region of the
SIRT1 gene and production and reproduction traits in the Agerolese cattle breed. Arch. Anim. Breed.
2019; 62: 107–112. https://doi.org/10.5194/aab-62-107-2019 PMID: 31807620
14. Wu J, Bai JY, Li L, Huang S, Li CM, Wang GL. Genetic polymorphisms of the BMAP-28 and MASP-2
genes and their correlation with the somatic cell score in Chinese Holstein cattle. Genet Mol Res. 2015;
14:1–8. https://doi.org/10.4238/2015.January.15.1 PMID: 25729929
15. Zhang H, Wei Y, Zhang F, Liu Y, Li Y, Li G, et al. Polymorphisms of MASP2 gene and its relationship
with mastitis and milk production in Chinese Holstein cattle. Biotechnol. Equip. 2019; 33: 589–96.
16. Sambrook J and Russell DW. Molecular Cloning: A Laboratory Manual. Cold Spring Harbor Laboratory
Press, New York; 2001.
17. SAS Institute Inc. SAS/STAT® 9.2 User’s Guide. Cary, NC: SAS Institute Inc; 2008.
18. Misztal I, Tsuruta S, Lourenco D, Aguilar I, Legarra A, Vitezica Z. Manual for BLUPF90 Family of Pro-
grams. 2015.
19. Yeh FC, Yang R, Boyle TBJ, Ye Z, Mao JX. POPGENE, the user-friendly shareware for population
genetic analysis, vol. 10. Canada: Molecular Biology and Biotechnology Centre, University of Alberta;
1997.
PLOS ONE Inputs for optimizing selection platform for dairy Sahiwal cattle
PLOS ONE | https://doi.org/10.1371/journal.pone.0267800 May 23, 2022 17 / 19
20. Yuan ZR, et al. Single nucleotide polymorphism of CACNA2D1 gene and its association with milk
somatic cell score in cattle. Mol. Biol. Rep. 2011; 38: 5179–5183. https://doi.org/10.1007/s11033-010-
0667-0 PMID: 21225462
21. Varga L, Szeplaki G, Laki J, Kocsis A, Kristof K, Gal P, et al. Depressed activation of the lectin pathway
of complement in hereditary angioedema. Clin Exp Immunol. 2008; 153, 68–74. https://doi.org/10.
1111/j.1365-2249.2008.03671.x PMID: 18460017
22. Gui L, Hao R, Zhang Y, Zhao X and Zan L. Haplotype distribution in the class I sirtuin genes and their
associations with ultrasound carcass traits in Qinchuan cattle (Bos taurus). Molec. Cell. Probes. 2015;
29: 102–107.
23. Gui L, Wang H, Wei S, Zhang Y, Zan L. Molecular characterization, expression profiles, and analysis of
Qinchuan cattle SIRT1 gene association with meat quality and body measurement traits (Bos taurus).
Mol Biol Rep. 2014; 41(8):5237–46. https://doi.org/10.1007/s11033-014-3393-1 PMID: 24828021
24. Liu G, Zhao H, Tan X, Cheng H, You W, Wan F, et al. SIRT1 gene polymorphisms associated with car-
cass traits in Luxi cattle. Arch. Anim. Breed. 2017; 60: 27–32.
25. Ilatsia ED, Muasya TK, Muhuyi WB and Kahi AK. Genetic and phenotypic parameters and annual
trends for milk production and fertility traits of the Sahiwal Cattle in Semi-Arid Kenya. Tropical Animal
Health and Production. 2007; 39: 37–48. https://doi.org/10.1007/s11250-006-4408-2 PMID: 17941486
26. Kumar J, Singh YP, Hitesh S, Satyaveer S, Rajkumar and kansa Anikt. Estimation of Genetic Parame-
ters for Economic Traits in Frieswal Cattle at MF Ambala. Chem Sci Rev Lett. 2017; 6(22), 961–966.
27. Ratwan P, Chakravarty A, & Kumar M. Assessment of relation among production and reproduction
traits in Sahiwal cattle at an organized herd of northern India. Biological Rhythm Research. 2019; 1–9.
28. Erfani-Asl Z, Hashemi A and Farhadian M. Estimates of repeatability and heritability of productive trait
in Holstein Dairy Cattle. Iranian Journal of Applied Animal Science. 2015; 5: 827–832.
29. Montaldo HH, Trejo C, & Lizana C. Genetic parameters for milk yield and reproduction traits in the Chil-
ean Dairy Overo Colorado cattle breed. Cienc. Inv. Agr. 2017; 44:24–34.
30. Missanjo E, Imbayarwo-Chikosi V and Halimani T. Estimation of genetic and phenotypic parameters for
production traits and somatic cell count for Jersey Dairy Cattle in Zimbabwe. Veterinary Science. 2013;
1–5. https://doi.org/10.1155/2013/470585 PMID: 23956868
31. Wilcox CJ. Genetics: basic concepts. In: Large Dairy Herd Management (Van Horn H.H. and Wilcox C.
J., eds.). American Dairy Science Association, Champaign;1992.
32. Lakshmi BS, Ramesh Gupta B, Sudhakar K, Gnana Prakash M and Susheel Sharma Lt. Col. Genetic
analysis of production performance of Holstein Friesian × Sahiwal Cows. Tamilnadu J. Veterinary & Ani-
mal Sciences. 2009; 5:143–148.
33. Dahlin A, Khan UN, Zafar AH, Saleem M, Chaundhry MA and Philipsson J. Population structure of the
Sahiwal breed in Pakistan. Animal Science. 1995; 60:163–168.
34. Kefale G, Million T, Direba H and Tadesse Yosef. Productive performances of crossbred dairy Cattle at
Holetta Agricultural Research Center. Ethiopian Journal of Agricultural Sciences, 2020; 30: 55–65.
35. Canaza-Cayo AW, Cobuci JA, Lopes PS, de Almeida TR, Martins MF, dos Santos DD, et al. Genetic
trend estimates for milk yield production and fertility traits of the Girolando cattle in Brazil. Livestock Sci-
ence. 2016; 190:113–122.
36. Khan UN, Dahlin A, Zafar AH, Saleem M, Chaudhry MA and Philipsson J. Sahiwal cattle in Pakistan:
genetic and environmental causes of variation in body weight and reproduction and their relationship to
milk production. Animal Science. 1999; 68:97–108.
37. Singh SK and Nagarcenkar R. Factors affecting milk yield and lactation length in Sahiwal cows. Indian
Journal of Animal Science. 1997; 67: 989–992.
38. Musani SK and Mayer M. Genetic and environmental trends in a large commercial Jersey herd in the
central Rift Valley, Kenya. Tropical Animal Health Production. 1997; 29: 108–116. https://doi.org/10.
1007/BF02632330 PMID: 9203313
39. Ojango JM, Pollott GE. Genetics of milk yield and fertility traits in Holstein-Friesian cattle on large-scale Ken-
yan farms. J Anim Sci. 2001; 79: 1742–1750. https://doi.org/10.2527/2001.7971742x PMID: 11465361
40. Leon ER, Magaña-Monforte JG and Segura J. Genetic parameters for reproductive traits of Brown
Swiss Cows in the Tropics of Mexico. Journal of Animal and Veterinary Advances. 2008; 7: 124–129.
41. Makgahlela M L, Mostert B E and Banga CB. Genetic relationships between calving interval and linear
type traits in South African Holstein and Jersey cattle. South African Journal of Animal Science. 2009;
90: 4411–4419.
42. Harris BL, Freeman AE, Metzger E. Genetic and Phenotypic Parameters for type and Production in
Guernsey Dairy Cows. Journal of Dairy Science. 1992; 75: 1147–1153. https://doi.org/10.3168/jds.
S0022-0302(92)77860-6 PMID: 1578028
PLOS ONE Inputs for optimizing selection platform for dairy Sahiwal cattle
PLOS ONE | https://doi.org/10.1371/journal.pone.0267800 May 23, 2022 18 / 19
43. Montaldo HH, Castillo-Juarez M H, Valencia Posadas EG, Cienfuegos-Rivas and RuizLopez FJ.
Genetic and environmental parameters for milk production, udder health, and fertility traits in Mexican
Holstein cows. J. Dairy Sci. 2010.; 93:2168–2175. https://doi.org/10.3168/jds.2009-2050 PMID:
20412932
44. Tong AKW, Kennedy BW, Moxley JE. Heritabilities and genetic correlations for the first three lactations
from records subject to culling. J. Dairy Sci. 1979; 62:1784–1790.
45. Meyer K, Bumside EB and Hammond K. Genetic parameters for dairy production in Australian Holstein-
Friesians. Animal Genetics and Breeding Unit, University of New England, Armidale, New South
Wales. 1984.
PLOS ONE Inputs for optimizing selection platform for dairy Sahiwal cattle
PLOS ONE | https://doi.org/10.1371/journal.pone.0267800 May 23, 2022 19 / 19
Top Related
Copyright © 2022 FDOKUMEN

