


Bahasa
Halaman
Hukum

Influence of fire severity on plant regeneration by means of remote sensing imagery
R. DIAZ-DELGADO†* , F. LLORET† and X. PONS†‡ † CREAF, Fac. Ciencias, and ‡ Departament de Geografia, Universitat Auto noma de Barcelona, Bellaterra, 08193, Barcelona, Spain
Abstract. In this paper we analyse the interactions between fire severity ( plant damage) and plant regeneration after fire by means of remote sensing imagery and a field fire severity map. A severity map was constructed over a large fire ( 2692 ha) occurring in July 1994 in the Barcelona province (north-east of Spain). Seven severity classes were assigned to the apparent plant damage as a function of burning intensity. Several Landsat TM and MSS images from dates immediately before and after the fire were employed to monitor plant regeneration processes as well as to evaluate the relationship with fire severity observed in situ. Plant regeneration was monitored using NDVI measurements (average class values standardized with neighbour unburned control plots). Pre-fire NDVI measure- ments were extracted for every plant cover category ( 7 ), field fire severity class ( 7 ), and spatial cross-tabulation of both layers ( 33 ) and compared to post-fire values. NDVI decline due to fire was positively correlated with field fire severity class. Results show different patterns of recovery for each dominant species, severity class and combination of both factors. For all cases a significant negative correlation was found between damage and regeneration ability. This work leads to a better understanding of the influence of severity, a major fire regime parameter on plant regeneration, and may aid to manage restoration on areas burned under different fire severity levels.
1. Introduction Fire effects on plant and soil vary according to fire intensity and time of exposure
(Perez and Moreno 1998 ). Fire intensity is considered to be one of the most significant parameters for recognition of the fire regime of a specific region ( Whelan 1995 ). Fireline intensity is determined by the fuel heat content, the weight of fuel consumed and the fire rate of spread. Exposure time or residence time of fire may change as a consequence of fuel load variability and topographical and meteorological conditions ( Fahnestock and Hare 1964 ). In addition to these two key factors, there are other relevant variables that aid evaluation of the level of damage caused by fire: Net
* Author for correspondence at: Estacio n Biolo gica de Don ana. Avda. Marıa Luisa
s/n. 41013. Sevilla, Spain; e-mail: [email protected] This paper was presented at the 3rd International Workshop of the Special Interest Group
(SIG) on Forest Fires of the European Association of Remote Sensing Laboratories held in Paris in May 2001.

Primary Production ( NPP) and biological potential (i.e. special plant traits that increase regeneration ability such as lignotubers, fire resistant structures, thermal regulation of seed release, etc). Both NPP and biological potential determine regeneration capability after disturbance (Grubb 1977, Christensen 1993 ).
Fire severity is another descriptive term that integrates physical, chemical and biological changes occurring in an area as a consequence of fire ( White et al. 1996 ). Plant damage caused by fire is related to fire intensity. Fire produces immediate effects on aerial vegetation, which become evident by total plant death or by partial destruction. High canopy trees may escape ground fires because the vertical discontinuity of fuel prevents fire reaching the canopies.
Fire also has important and immediate effects on soil. The more affected layers are usually the less deep ones —the deeper the horizon, the lower the temperature ( DeBano et al. 1977 ). This effect may reduce plant regeneration response ( Thomas and Wein 1985 ). Indirectly, i.e. when the fire has finished, other effects can be expected, such as nutrient loss by surface run-off and loss of fine elements from the more superficial horizons.
Plant composition is also affected by fire in an indirect manner. For instance, species substitution has been reported for taxa linked to fire intervals ( Zedler et al. 1983 ), and post-fire vegetation cover can be decreased due to erosion and substrate loss (Alcan iz et al. 1996 ); this may be linked to high fire recurrence ( Franklin et al. 1997 ).
All these effects imply a highly variable vegetation response that also depends on the different plant strategies for regeneration after fire (massive seed production, resprouting, etc). Moreover, topography, aspect or slope in the burned area have a considerable effect ( Dıaz-Delgado et al. 1998 ) either on plant recovery or plant damage. Unfortunately, interactions between fire severity and plant regeneration, as well as those between topoclimatic and vegetation factors, are poorly known, especi- ally at the scale of a whole, large fire. At this scale, remote sensing imagery has proved to be a suitable tool for monitoring plant regeneration after fire ( Dıaz- Delgado and Pons 2001 ) and for spectrally recognizing fire severity (Caetano et al. 1994, 1996, White et al. 1996 ).
In order to examine the role of fire severity in plant response to fire, we analyse in this paper the medium term effects (three years) of fire severity on plant regenera- tion processes after fire. Several remote sensing images were employed by monitoring NDVI variation through time. We studied a burned area of about 2700 ha affected by a fire occurring in July 1994 in the Barcelona province (north-east of Spain). In this area at the beginning of 1995, a fire severity map was constructed in situ, which enables us to monitor individually each of the severity classes defined in the carto- graphy. The role played by dominant plant species before fire in the plant response to fire was also studied. Since high fire intensity may cause irreversible plant damage, limiting plant regrowth, we hypothesize that there is a direct relationship between fire severity and plant ability to regenerate after fire. In other words, high plant damage would imply less ability to regenerate. We also checked the role played by topoclimatic variability on plant regeneration after fire. To date, works on this subject have mostly been carried out at plot level. The use of remote sensing imagery can bring some insights into the overall relationship between fire severity and plant regeneration at a larger scale (i.e. for large fires). In addition to the spatial and spectral potential of satellite images, they can be acquired along a time series enabling

us to monitor land cover changes. Moreover, advances in this subject can aid the definition of new post-fire management criteria in burned areas under different fire severity levels.
2. Materials and methods
The reference fire severity map was established with field measurements over the period January–March 1995. The main severity classes are based on interpretation criteria established in the field. We followed the fire intensity model developed by Moreno and Oechel ( 1989 ). This model considers the number of fine branches on woody plants remaining after fire. The severity classes attempt to return the whole damage variability found in the burned area. Seven possible fire severity classes were visually distinguished and assigned, in addition to unburned area (see also figure 1 ):
1. ground fire 2. canopy partially green (with green leaves) 3. burned trees with remaining burned leaves 4. burned trees with fine branches across the whole trunk 5. burned trees with fine branches only on top of the trunk 6. burned trees without fine branches 7. burned trees that only keep the trunk
Every class was recognized through extensive sampling in the field by delimiting homogeneous patches. Once delimited, each patch was drawn on a 1:5000 topograph- ical map edited by Institut Cartogra fic de Catalunya ( ICC) built from a flight in 1986. A total amount of 12 sheets were used in this phase of fire severity mapping.
Figure 1. Field fire severity map of the area burned in the Bigues i Riells wildfire of July 1994. Whole bar scale represents 5 km. (Source: Busquets. CREAF.)

Post-fire regeneration was monitored by means of eight images from Landsat TM ( Thematic Mapper, spatial resolution 30 m×30 m) covering the 1994–1997 period. The TM images dates are the following:
$ 17 July 1994 ( 13 days after fire) $ 1 May 1995 ( 301 days after fire) $ 24 May 1995 ( 324 days after fire) $ 3 May 1996 ( 669 days after fire) $ 20 June 1996 ( 717 days after fire) $ 23 August 1996 ( 781 days after fire) $ 11 April 1997 ( 1012 days after fire) $ 11 September 1997 ( 1165 days after fire)
To monitor pre-fire NDVI variation, 10 Landsat MSS (Multi Spectral Scanner, spatial resolution 59 m×79 m) images and one scene from Landsat TM were employed, the oldest image being captured on 4 April 1991 ( 1180 days before the fire). These images cover a time span equivalent to the post-fire one. To make comparable TM and MSS images, MSS scenes were resampled to 30 m by bicubic interpolation. Then NDVI ( Normalized Difference Vegetation Index, see Kriegler et al. 1969, Rouse et al. 1973 ) was calculated for the images. Near infrared and red bands ( 3 and 4 for TM: 0.63–0.69 mm and 0.76–0.90 mm, respectively; 5 and 6 for MSS: 0.6–0.7 mm and 0.7–0.8 mm, respectively) were selected to calculate the quotient between the subtraction and sum of both bands, as shown in equation 1:
ri, NIR −ri, R
NDV I= ri, NIR +ri, R
(1)
where r=reflectivity values of pixel i from the near infrared band ( NIR) and from the red band (R). Although for the employed bands every sensor captures non identical spectral intervals, comparison is possible according to results reported by Teillet et al. ( 1997 ).
The pre-processing of the images involved geometric and radiometrically cor- recting by applying the methods of Pala and Pons ( 1995 ) and Pons and Sole- Sugran es ( 1994 ), respectively. The root mean square error (rms) of the polynomial fitting used in the registration process was always below the pixel size. Resampling was applied through the nearest neighbour technique.
Average NDVI values were extracted for the whole burned area. Ten unburned areas also were selected outside the fire perimeter as control plots (figure 2 ). Such zones shared pre-fire dominant species or cover with the areas inside the burned area. To achieve this, a vegetation map was used (Mapa Forestal de Catalunya 1:100 000; DARP 1996 ). Average NDVI values were also calculated for each image in the control plots with a total control area of 845.4 ha. A new variable, quoted QNDVI , was suggested and calculated as shown in equation 2:
Average NDV IFIRE
QNDVI = Average NDV I
CONTROL (2)
This quotient aims to minimize phenological variations among the compared areas ( Dıaz-Delgado and Pons 2001 ). The new variable QNDVI was calculated for all the images and monitored along the pre and post-fire period. QNDVI was only used for comparisons when control plots were available. NDVI was employed for the rest of comparisons (see below).
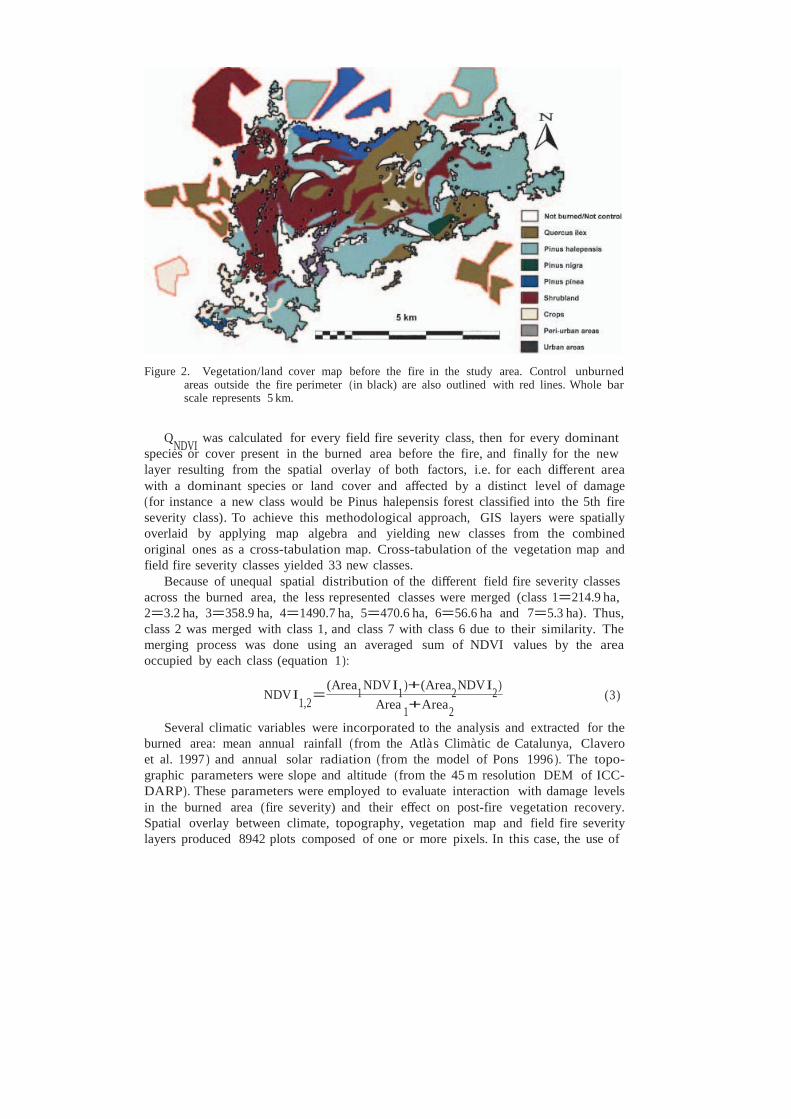
Figure 2. Vegetation/land cover map before the fire in the study area. Control unburned areas outside the fire perimeter (in black) are also outlined with red lines. Whole bar scale represents 5 km.
QNDVI was calculated for every field fire severity class, then for every dominant species or cover present in the burned area before the fire, and finally for the new layer resulting from the spatial overlay of both factors, i.e. for each different area with a dominant species or land cover and affected by a distinct level of damage (for instance a new class would be Pinus halepensis forest classified into the 5th fire severity class). To achieve this methodological approach, GIS layers were spatially overlaid by applying map algebra and yielding new classes from the combined original ones as a cross-tabulation map. Cross-tabulation of the vegetation map and field fire severity classes yielded 33 new classes.
Because of unequal spatial distribution of the different field fire severity classes across the burned area, the less represented classes were merged (class 1=214.9 ha, 2=3.2 ha, 3=358.9 ha, 4=1490.7 ha, 5=470.6 ha, 6=56.6 ha and 7=5.3 ha). Thus, class 2 was merged with class 1, and class 7 with class 6 due to their similarity. The merging process was done using an averaged sum of NDVI values by the area occupied by each class (equation 1 ):
(Area1 NDV I1 )+(Area2 NDV I2 )
NDV I1,2 =
Area +Area (3) 1 2
Several climatic variables were incorporated to the analysis and extracted for the burned area: mean annual rainfall (from the Atla s Clima tic de Catalunya, Clavero et al. 1997 ) and annual solar radiation (from the model of Pons 1996 ). The topo- graphic parameters were slope and altitude (from the 45 m resolution DEM of ICC- DARP). These parameters were employed to evaluate interaction with damage levels in the burned area (fire severity) and their effect on post-fire vegetation recovery. Spatial overlay between climate, topography, vegetation map and field fire severity layers produced 8942 plots composed of one or more pixels. In this case, the use of
control plots was not possible due to the lack of pair correspondences. Therefore, NDVI values were employed instead of QNDVI . For instance, we were not able to find control plots for burned Pinus halepensis forests submitted to a concrete fire severity level with average slope 30°, mean altitude of 650 m and mean annual radiation of 14 000 kJ . m−2 day−1 and so on, due to the specificity of the sites; consequently NDVI was employed.
Images were independently used to characterize fire severity and plant regenera- tion. Since fire events are always displayed by a sudden drop of NDVI values we decided to measure this decrease as a measure of damage. Therefore, subtraction of NDVI and QNDVI values from the immediate pre-fire and post-fire images was calculated for all the fire severity classes and named damage (figure 3 ). High values of damage will imply a high severity level. Relationship between this remote sensing variable and field fire severity classes was tested by a correlation analysis.
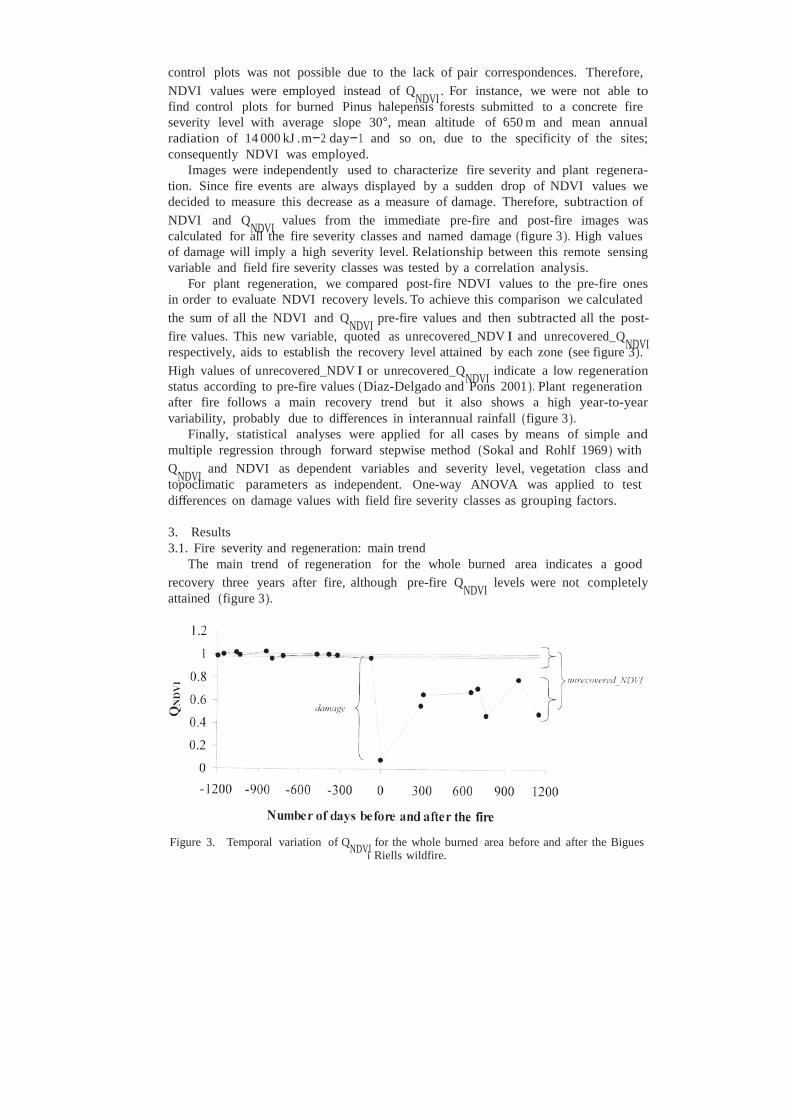
For plant regeneration, we compared post-fire NDVI values to the pre-fire ones in order to evaluate NDVI recovery levels. To achieve this comparison we calculated the sum of all the NDVI and QNDVI pre-fire values and then subtracted all the post- fire values. This new variable, quoted as unrecovered_NDV I and unrecovered_QNDVI respectively, aids to establish the recovery level attained by each zone (see figure 3 ). High values of unrecovered_NDV I or unrecovered_QNDVI indicate a low regeneration status according to pre-fire values ( Dıaz-Delgado and Pons 2001 ). Plant regeneration after fire follows a main recovery trend but it also shows a high year-to-year variability, probably due to differences in interannual rainfall (figure 3 ).
Finally, statistical analyses were applied for all cases by means of simple and multiple regression through forward stepwise method (Sokal and Rohlf 1969 ) with QNDVI and NDVI as dependent variables and severity level, vegetation class and topoclimatic parameters as independent. One-way ANOVA was applied to test differences on damage values with field fire severity classes as grouping factors.
3. Results 3.1. Fire severity and regeneration: main trend
The main trend of regeneration for the whole burned area indicates a good recovery three years after fire, although pre-fire QNDVI levels were not completely attained (figure 3 ).
Figure 3. Temporal variation of QNDVI for the whole burned area before and after the Bigues i Riells wildfire.

Figure 4. Relationship between damage and the field fire severity classes. Categories 1–2 and 6–7 were previously merged through averaged sum according to the area occupied (see text). Bars indicate confidence interval of average values (a=0.01 ).
Table 1. Ordered values of unrecovered NDV I in respect of every field fire severity class.
Fire severity class 6–7 3 1–2 5 4 Unrecovered NDV I 0.36 0.38 0.38 0.44 0.47
A significant correlation was found between field fire severity classes and the new remote sensing variable called damage, which was calculated for all pixels in the burned area (figure 4, r2 =0.94, p<0.002 ). This relationship allows the identification of field fire severity classes by means of damage values in the images, and the monitoring of post-fire NDVI regeneration. We also found significant differences between damage values of the seven field fire severity classes (grouped into five classes, as described above) as grouping factors (one-way ANOVA: F=336.33, p<0.01 ).
However, variability in regenerative response to fire, measured through unrecovered_QNDVI , did not show a clear ordination pattern relating to the field fire severity class (table 1 ), i.e. less damaged areas did not show better NDVI regeneration level. This fact reveals the importance of other factors on the regeneration processes, such as the dominant species (strategies of plant regeneration, seeders vs resprouters) or topoclimatic parameters. For instance, communities dominated by Pinus nigra showed the highest fire severity class and the worst post-fire regeneration (figure 5, table 2 ). On the other hand, the lowest values of unrecovered_QNDVI belong to Pinus pinea for the whole period studied, representing the best regenerative trend (table 2 ).
Therefore, when dominant vegetation is included in the analysis, a positive correlation between regeneration and severity appears. For the new classes ( 33 ) resulting from vegetation map and field fire severity classes combination, we found a significant relationship between unrecovered_QNDVI and damage (figure 6; r2=0.54, p<0.01 ). In other words, sudden drops of QNDVI values after the fire explain the subsequent regenerative response variability.

Figure 5. Average values of damage and unrecovered_QNDVI in respect of the dominant species or land cover considered. (P.h.=Pinus halepensis; Mat.=shrubland; Q.i.=Quercus ilex; Cult.=crops; P.s.=P. sylvestris; P.n.=P. nigra; P.p.=P. pinea).
Table 2. Ordered values of unrecovered NDV I by dominant species or land cover. (P.h.=
Pinus halepensis; Mat=shrubland; Q.i.=Quercus ilex; Cult=crops; P.s.=P. sylvestris; P.n.=P. nigra; P.p.=P. pinea).
Ssp/LC P.p. Cult P.h. P.s. Q.i. Mat. P.n. Unrecovered NDV I 0.21 0.39 0.39 0.42 0.49 0.50 0.54
3.2. Climate and topography
The relationship between topoclimatic variables and damage and unrecovered_NDV I was examined at a pixel group scale resulting from spatial overlay between climate, topography, vegetation map and field fire severity layers ( 8942 plots). Annual mean rainfall and altitude were negatively correlated, and slope was positively related to damage (forward stepwise regression summary: r2 =0.04, p<0.001; rainfall, b=−0.19, p<0.001; altitude, b=−0.03, p<0.002; slope, b=0.02, p<0.006 ). In spite of the low r2 value, signs of single relationships denoted by b contribute to interpret fire severity interactions with topoclimatic variables.
Unrecovered_NDV I was negatively correlated to rainfall and altitude (forward stepwise regression summary: r2 =0.13, p<0.001; rainfall, b=−0.34, p<0.001; alti- tude, b=−0.10, p<0.001 ). The results show again a significant relationship between damage and unrecovered_NDV I (r2 =0.34, p<0.001; figure 7 ). Again, it should be stressed that such correlation is still present when examining separately dominant species or land cover prior to fire.
4. Discussion
The results show a significant positive relationship between damage and ground fire severity classes. This corroborates the usefulness of NDVI in discriminating spectral variability generated by fire severity. So far, many studies have attempted

Figure 6. Relationship between damage and unrecovered_QNDVI by considering fire severity class and dominant species or land cover. Dashed line displays the general model for all the species, black lines correspond to the model fitted for each one of them. (P.h.= Pinus halepensis; Mat.=shrubland; Q.i.=Quercus ilex; Cult.=crops; P.s.=P. sylvestris; P.n.=P. nigra; P.p.=P. pinea).
Figure 7. Relationship between damage and unrecovered_NDV I ( NDVI values ×10 000 ) by plots resulting from spatial overlay of topography, climate and land cover classes. Note that high unrecovered_NDV I values indicate a bad regeneration level (see text).
to discriminate spectrally fire severity classes on Landsat MSS and TM and NOAA- AVHRR data, by means of several approaches ( White et al. 1996, Caetano et al. 1994, 1996 ) with different levels of success. These works have showed the suitability of Landsat images for mapping fire severity. Nevertheless, a large number of fire severity classes and low amount of ground control plots often led to the reduced
feasibility of spectral class discrimination. Although these works have attempted to map fire severity through the use of remote sensing imagery, this is beyond the scope of the present work. In our case, fire severity classes were extensively mapped on the ground, related to damage values and, finally, monitored along time. However, a preliminary work in the study area has shown the ability to discriminate on Landsat TM data the seven fire severity classes of the ground map ( Dıaz-Delgado and Pons 1999 ). On the other hand, NDVI also can aid the monitoring of post-fire recovery processes (Minnich 1983, Malingreau et al. 1985, Viedma et al. 1997 ), especially in the initial stages (Salvador et al. 2000 ). However, it is important to notice that, in most cases, the relationships found in this work are statistically significant, but weak. Although they indicate main tendencies, they are not enough useful for accurate quantitative modelling.
Within the burned area of the Bigues i Riells wildfire, the proposed variables extracted from the remote sensing images (damage, indicator of fire severity and unrecovered_QNDVI/unrecovered_NDV I of the regenerative response) display for all cases ( by field fire severity class, dominant species or land cover, overlay of both and by plots generated from overlay with topoclimatic layers) a significant negative correlation. These relationships point out that damage determines post-fire regenera- tion ability when previous land cover and topoclimatic parameters are taken into account. Nevertheless, this response is not only influenced by fire severity but by other factors. One of these factors, dominant species or land cover, is related to damage and unrecovered_NDV I. The most affected cover was the pine woodlands of P. nigra while, the least damaged were the ones of P. pinea. Obviously, regeneration in these pine forest sites is mostly shown by post-fire growth of understorey cover, which is usually produced by resprouting, unlike pine species, which re-establish by obligate seed germination.
The topoclimatic parameters altitude, rainfall and slope are significantly related to fire severity through damage. In spite of the low coefficient of determination, signs of single relationships may aid the interpretation of main trends on interactions between topoclimatic variables and fire severity. Thus, according to our results, higher altitude and mean rainfall values would imply a lower damage level caused to vegetation by fire. Conversely, steeper slopes would produce higher levels of damage. Extinguishing the fire is more difficult in these areas and the flame height can reach a greater amount of fuel. There is no doubt that the relationship between each of the topoclimatic factors and fire intensity as well as with exposure time may explain to a great extent the observed variability in fire severity. No relationship was found with solar radiation.
Finally, when examining overall regeneration response, the mean rainfall and alti- tude contribute positively to increase regeneration. However, no effect was found of slope or solar radiation on plant recovery. One of the most important factors on fire behaviour and increasing fire front temperature is the terrain slope ( Franklin et al. 1997 ). Some authors have found a relationship between long drought periods and the increase of fire severity (Sampaio et al. 1993 ), which could be also reflected in the mean rainfall differences among the distinct areas affected by the same fire. This pattern agrees with the lower fire severity found in areas with high altitude and rainfall values, and the better regeneration that occurs as a consequence of a better rainfall regime.
5. Conclusions
The methodological approach has enabled us to establish a study protocol to analyse the influence of fire severity on regeneration by means of remote sensing
imagery. This protocol can be implemented easily in other burned areas by calculating the two new indicators of the phenomena analysed in this paper (damage and unrecovered_NDV I ). Both indicators are based on NDVI. The results have led to the following conclusions:
$ The variable damage is well adjusted to field fire severity classes observed in
the field. Moreover, it influences regeneration response by negative correlation with plant recovery in all the cases studied.
$ On the other hand, damage could aid the evaluation of global fire severity of one whole fire and allow comparison between wildfires of different magnitude. Thus, regional fire regime characterization may be enriched by incorporating the fire severity parameter. Also, it may contribute to the forecasting of the expected regenerative trend as a function of the severity level attained by the fire.
$ Variability observed in post-fire regeneration response can be explained by fire severity and by the dominant species or land cover. Main differences among the more abundant land covers (P. halepensis, Q. ilex and shrubland ) indicate an immediate response capacity to fire due to resprouting ability (shrubland and oak-tree woodland ) and to the low and slow recovery capacity of areas dominated by Aleppo pine (including the understorey).
$ For the topoclimatic variables, high values of rainfall and altitude partially determined a low fire severity level, which becomes extreme in steep slopes. However, as for unrecovered_NDV I, only altitude and rainfall are involved in the process, with no effect of slope and solar radiation on regeneration.
$ Finally, it should be stressed that the methodology employed has been shown to be an acceptable approach to study the fire severity/post-fire plant regeneration relationship for one burned area. However, more work has to be done to confirm its predictive value in order to estimate the regenerative trend of different damaged zones by fire.
Acknowledgments Authors are grateful to Ignasi Busquets for the help on field fire severity mapping
and to Javier Retana and Joan Pino. The Institut Cartogra fic de Catalunya aided in the geometric correction process, and the Departament de Medi Ambient (Generalitat de Catalunya) kindly provided geographical information about the Bigues i Riells fire perimeter. Financial support for this work comes from the CICYT- MEC (AMB94-0881 and INCISAR) projects, and a grant to R. Dıaz-Delgado by MEC. The study was also funded by the Lucifer EC project.
References A , J. M., S, I., and V, R., 1996, Efectes dels incendis
forestals sobre el so l. In Ecologia del Foc, edited by J. Terradas ( Barcelona: Proa), pp. 111–130.
C, M. S., M, L. A. K., and P, J. M. C., 1994, Using spectral mixture
analysis for fire severity mapping. In 2nd Conference on Forest Fire Research, edited by L. A. Oliveira, D. X. Viegas, V. Varela and A. M. Raimundo (Coimbra: ADAI ), vol. II, pp. 667–677.
C, M., M, L., C, L., and P, J. M. C., 1996, Assesment of AVHRR data for characterising burned areas and post-fire vegetation recovery. EARSeL Advances in Remote Sensing, 4, 124–134.

C, N. L., 1993, Fire regimes and ecosystem dynamics. In Fire in the environment: the ecological, atmospheric, and climatic importance of vegetation fires, edited by P. J. Crutzen and J. G. Goldammer ( Berlin: John Wiley & Sons Ltd ), pp. 233–244.
C, P., M-V, J., and R, J. M., 1997, Atla s Clima tic de Catalunya 1:500 000 ( Barcelona: DMA-Generalitat de Catalunya).
DARP, 1996, Mapa Forestal de Catalunya 1:100 000 ( Barcelona: DARP-Generalitat de Catalunya).
DB, L. F., S, S. M., and H, D. M., 1977, The transfer of heat and hydrophobic substances during burning. Journal of the Soil Science Society of America, 40, 779–782.
D-D, R., and P, X. 1999. Empleo de ima genes de teledeteccio n para el ana lisis de los niveles de severidad causados por el fuego. Revista de T eledeteccio n, 12, 63–68.
D-D, R., and P, X., 2001, Spatial patterns of forest fires in Catalonia ( NE Spain) along the period 1975–1995. Analysis of vegetation recovery after fire. Forest Ecology and Management, 147, 67–74.
D-D, R., S, R., and P, X., 1998, Monitoring of plant regeneration after fire by remote sensing. In Fire Management and L andscape Ecology, edited by L. Trabaud ( Fairfield: International Association of Wildland Fire), pp. 315–326.
F, G. R., and H, R. C., 1964, Heating of tree trunks in surface fires. Journal of
Forestry, 62, 779–805. F, S. B., R, P. A., and F, J. S., 1997, Small-scale
fire temperature patterns in upland Quercus communities. Journal of Applied Ecology, 34, 613–630.
G, P. J., 1977, The maintenance of species-richness in plant communities: the importance of the regeneration niche. Biological Reviews, 52, 107–145.
K, F. J., M, W. A., N, R. F., and R, W., 1969, Preprocessing transformations and their effects on multispectral recognition. Sixth International Symposium on Remote Sensing of Environment, October 1969 (Ann Arbor: University of Michigan), pp. 97–131.
M, J. P., S, G., and F, L., 1985, Remote sensing of forest fires: Kalimantan and North Borneo in 1982–83. Ambio, 14, 314–321.
M, R. A., 1983, Fire mosaics in Southern California and Northern Baja California.
Science, 219, 1287–1294. M, J. M., and O, W. C., 1989, A simple method for estimating fire
intensity after a burn in California chaparral. Acta Oecologica-Oecologia Plantarum, 10, 57–68.
P , V., and P, X., 1995, Incorporation of relief into a geometric correction based on polynomials. Photogrammetric Engineering and Remote Sensing, 61, 935–944.
P, B., and M, J. M., 1998, Methods for quantifying fire severity in shrubland-fires.
Plant Ecology, 139, 91–101. P, X., 1996, Estimacio n de la radiacio n solar a partir de modelos digitales de
elevaciones: Propuesta metodolo gica. In Modelos y Sistemas de Informacio n en Geografıa, edited by J. Juaristi and I. Moro ( UPV-AGE: Vitoria), pp. 87–97.
P, X., and S-S , L., 1994, A simple radiometric correction model to improve automatic mapping of vegetation from multispectral satellite data. Remote Sensing of Environment, 48, 191–204.
R, J. W., H, R. H., S, J. A., and D, D. W., 1973, Monitoring vegetation systems in the Great Plains with ERTS. T hird Earth Resources T echnology Satellite-1 Symposium, December 1973 ( NASA SP-351: Washington) vol. 1, pp. 309–317.
S, R., V, J., P, X., and D-D, R., 2000, A semiautomatic methodology to detect fire scars in shrubs and evergreen forests with Landsat MSS time series. International Journal of Remote Sensing, 21, 655–673.
S, E. V. S. B., S, I. H., and K, J. B., 1993, Effect of different fire severities on coppicing of Caatinga vegetation in Serra Talhada, PE, Brazil. Biotropica, 25, 452–460.
S, R. R., and R, J. F., 1969, Biometry, 3rd edition ( New York: W. H. Freeman and
Company). T, P. M., S, K., and W, D. J., 1997, Effects of
spectral, spatial, and radiometric characteristics on remote sensing vegetation indices of forested regions. Remote Sensing of Environment, 61, 139–149.

T, P. A., and W, R. W., 1985, The influence of shelter and the hypothetical effect of fire severity on the postfire establishment of conifers from seed. Canadian Journal of Forest Research, 15, 148–155.
V, O., M , J., S, D., and G-H, J., 1997, Modelling rates of ecosystem recovery after fires by using Landsat TM data. Remote Sensing of Environment, 61, 383–398.
W, R. J., 1995, T he ecology of fire (Cambridge: Cambridge University Press). W, J. D., R, K. C., K, C., and R, S. W., 1996, Remote sensing of
forest fire severity and vegetation recovery. International Journal of W ildland Fire, 6, 125–136.
Z, P. H., G, C. R., and MM, G. S. 1983. Vegetation change in response to extreme events: the effect of a short interval between fires in California chaparral and coastal scrub. Ecology, 64, 809–818.
Top Related
Copyright © 2022 FDOKUMEN

