


Bahasa
Halaman
Hukum

EARTHQUAKE ENGINEERING AND STRUCTURAL DYNAMICSEarthquake Engng Struct. Dyn. 0000; 00:1–24Published online in Wiley InterScience (www.interscience.wiley.com). DOI: 10.1002/eqe
Influence of Earthquake Ground-Motion Duration on DamageEstimation: Application to Steel Moment Resisting Frames
Andre R. Barbosa1∗ Filipe L.A. Ribeiro2 and Luis A.C. Neves3
1Assistant Professor, School of Civil and Construction Engineering, Oregon State University, U.S.A.2Ph.D. Student, UNIC, Department of Civil Engineering, Universidade Nova de Lisboa, Portugal. VisitingPh.D. Student, School of Civil and Construction Engineering, Oregon State University, U.S.A.3Lecturer, Nottingham Transport Engineering Centre (NTEC), University of Nottingham, U.K.
SUMMARY
This paper presents an analytical study evaluating the influence of ground motion duration onstructural damage of 3-, 9-, and 20-story SAC steel moment resisting frame (SMRF) buildings designedfor downtown Seattle, Washington, USA, using pre-Northridge codes. Two-dimensional nonlinear finiteelement models of the buildings are used to estimate the damage induced by the ground motions. Aset of 44 ground motions is used to study the combined effect of spectral acceleration and groundmotion significant duration on drift and damage measures. In addition, 10 spectrally equivalent shortduration shallow crustal ground motions and long duration subduction zone records are selected toisolate duration effect and assess its effect on the response. For each ground motion pair, incrementaldynamic analyses are performed at at least twenty intensity levels and response measures such as peakinter-story drift ratio and energy dissipated are tracked. These response measures are combined intotwo damage metrics that account for the ductility and energy dissipation. Results indicate that theduration of the ground influences, above all, the combined damage measures, although some effecton drift-based response measures is also observed for larger levels of drift. These results indicate thatsince the current assessment methodologies do not capture the effects of ground motion duration, bothperformance-based and code-based assessment methodologies should be revised to consider damagemeasures that are sensitive to duration. Copyright c© 0000 John Wiley & Sons, Ltd.
Received . . .
KEY WORDS: Damage, Fatigue, Long-duration ground motions, Steel Moment Frames, SubductionZone Earthquakes
1. INTRODUCTION
The effects of earthquake duration on civil engineering structures has been addressed only inthe last quarter century and consensus within the scientific community is yet to be reached[1]. Longer earthquakes have been shown to increase the risk of failure on liquefaction [2] andslope instability [3] problems. However, early studies on the sensitivity of structural response toground motion duration reported mixed results [4, 5, 6, 7]. These mixed results, together withthe lack of ground motion records for large magnitude subduction events, lead to seismic designcode provisions considering only effects of short duration earthquakes [8]. Among the worksavailable in the literature that address the effects of duration on structural response, the mainobservations can be classified into two groups. First, studies that employ response measures
∗Correspondence to: Andre R. Barbosa, School of Civil and Construction Engineering, Oregon State University,101 Kearney Hall, Corvallis, OR 97331-3212, USA. E-mail: [email protected]. Office Phone: 541-737-7291. Fax: 541-737-3052
Copyright c© 0000 John Wiley & Sons, Ltd.
Prepared using eqeauth.cls [Version: 2010/03/05 v3.00]
brought to you by COREView metadata, citation and similar papers at core.ac.uk
provided by Repository@Nottingham
2 BARBOSA ET AL.
based on peak displacement demands, such as peak drift ratios, generally do not find strongcorrelation between duration and the magnitude of the response (e.g., [9, 10]). Second, studiesthat employ cumulative response measures such as number of inelastic cycles, cumulativeinelastic strains, and hysteretic energy dissipated, find a positive correlation between groundmotion duration and structural response measures (e.g., [11, 12, 13]), showing that longerduration ground motions cause collapse at lower intensities [13]. These conclusions are alsosupported by other authors [9, 14, 15]. Even though the cumulative damage induced by theground motion has been shown to be dependent on the amplitude, source-to-site distance, faulttype, as well as the duration of the ground motion, it is not trivial to decouple the specificinfluence of duration.
Due to the increase in available ground motion data from recent subduction zoneearthquakes, mainly from Japan and Chile, ground motion records from large subductionzone megathrust earthquakes can now be used [16, 17, 18, 13]. To isolate the effects of groundmotion duration, Foschaar et al. [17] and Chandramohan et al. [19], for example, selectedground motions with similar spectral shape and studied the relationship between the responseand different intensity measures of ground motion duration.
The objective of this paper is to better understand differences in structural damage on3-, 9-, and 20-story ductile steel moment resisting frames (SMRF) when subjected to longduration or short duration earthquake ground motions. The SMRFs are part of the SACsteel project and correspond to buildings located in Seattle, Washington, designed using pre-Northridge codes. These three buildings are representative of the design practice in the USfor decades, and the conclusions of this work can be significant in the assessment/retrofit ofthousands of buildings. Two-dimensional nonlinear finite element models of the buildings aredeveloped in OpenSees [20] and are validated against data available in the literature [21]. Adatabase of 44 ground motions is used to assess the combined influence of ground motionduration and spectral acceleration on structural response. To isolate the effects of duration, 10spectrally equivalent ground motion pairs are selected from the initial database of 44 groundmotions following a procedure proposed in Chandramohan et al. [19]. Structural responseis investigated in terms of deformation, energy dissipation, number of inelastic cycles, anddamage state. To track damage, the Park and Ang [22] and Reinhorn and Valles [23] damageindices are used. The results show that buildings with different number of stories displaydifferent deformation and energy dissipation distributions that significantly affect their post-earthquake structural damage and that increases in ground motion duration produce increasesin accumulated damage.
2. DAMAGE INDICES
During an earthquake, damage sustained by a structure is a result of several phenomena,typically described as a function of deformation, ductility, energy dissipated, stiffnessdegradation, and strength degradation among others. To account for the complex combinationof these parameters, different damage indices have been proposed in the literature. Theseindices provide a measure of the accumulated damage sustained by the components of thestructure or by the entire structure. Damage indices are often calibrated based on experimentaldata for each loading condition and for a set of failure modes. The indices associated with theentire structure are usually based on a weighted average of the damage indices for components.
The main damage indices used for seismic damage assessment can be divided into threegroups: (i) indices based on peak drift-based response measures; (ii) indices based on measuresrelated to the inelastic cyclic response; and (iii) indices that combine peak drift-based responsemeasures and inelastic cyclic response measures. For example, in the first group, Veletsos andNewmark [24] proposed a damage index that is based on the peak inelastic deformation. Lybasand Sozen [25] incorporated the concepts of cyclic deterioration and proposed a damage indexthat consists a ratio of the initial stiffness to the secant stiffness corresponding to maximumdeformation. Roufaiel and Meyer [26] defined a local index based on the ratio between the
Copyright c© 0000 John Wiley & Sons, Ltd. Earthquake Engng Struct. Dyn. (0000)Prepared using eqeauth.cls DOI: 10.1002/eqe
INFLUENCE OF EARTHQUAKE GROUND-MOTION DURATION ON DAMAGE ESTIMATION 3
minimum secant stiffness recorded, i.e. the stiffness at the most damaged state attained, andthe secant stiffness at the onset of failure. In the second group, some damage indices considerexplicitly the energy dissipated as the measure of the severity of inelastic response [27, 28],while some others consider the number and amplitude [29, 30], or even the history of theinelastic cyclic response [31]. These indices focus on the effects of cumulative loading andcombine inelastic measures of the response to account for fatigue, namely low-cycle fatigue[32]. In the third and last group, the response parameters considered individually in each ofthe former groups are merged into single indices. For example, Park and Ang [22] defineda damage index that is a linear combination of the ratio of the peak observed to ultimatedeformation and hysteretic energy dissipated. Reinhorn and Valles [23, 33, 34] developed anindex entitled Fatigue Based Damage Model that models the damage due to low plastic cyclesfatigue. The Reinhorn and Valles index, which was calibrated with experimental data, is basedon an initial development by [22].
The damage index proposed by Park and Ang [22] is given by:
DIPA =dmdu
+ β
∫
Eh
du × Fy
(1)
where Fy is the yield strength, dm is the maximum attained deformation, du is the ultimatedeformation under monotonic loading, β is the empirical non-negative strength deterioratingconstant, and
∫
Eh denotes the hysteretic energy dissipated during the cyclic loading. βdepends on the value of shear and axial forces in the section and, for RC components, onthe total amount of longitudinal and confining reinforcement. Available test data for 402 RCcomponents of rectangular cross-sections and 132 steel specimens of H-shaped sections testedin the U.S. and Japan were used to estimate β, resulting in a value of β = 0.05 for concretestructures and β = 0.025 for steel structures [35, 36].
The index proposed by Reinhorn and Valles [23] is based on the product of the ratio of themaximum to ultimate deformations and a low inelastic cyclic fatigue rule calibrated by theauthors using experimental data. This index is given by:
DIRV =
0, (dm − dy) ≤ 0dm−dy
du−dy×
1
1−
∫Eh
4×(du−dy)×Fy
, (dm − dy) > 0 &∫
Eh < 4× (du − dy)× Fy
1,∫
Eh ≥ 4× (du − dy)× Fy
(2)
where 4× (du − dy)× Fy represents the reference hysteretic energy dissipation capacityassociated with the low inelastic cyclic fatigue.
Calibration of damage indices performed by Park et al. [35] are presented in Table I, as wellas the degree of observed damage in the structures. These are the definitions for damage usedin this study.
Table I. Physical Interpretation of the Damage Indices [35]
Degree of Damage Damage Index, DI State
Collapse > 1.0 Loss of buildingSevere 0.4 - 1.0 Beyond repairModerate < 0.4 RepairableMinor/Slight < 0.2
3. GROUND MOTION SELECTION
Subduction earthquake motions were selected from databases that include earthquake recordsfrom the 2011 Great East Japan Earthquake [37], the 2010 Santiago, Chile earthquake [38],
Copyright c© 0000 John Wiley & Sons, Ltd. Earthquake Engng Struct. Dyn. (0000)Prepared using eqeauth.cls DOI: 10.1002/eqe
4 BARBOSA ET AL.
the 1985 Valparaiso, Chile earthquake, the 2010 Southern Peru earthquake, and the 1999Chi-Chi, Taiwan earthquake. It is worth noting that due to the high-frequency site effects,amplifications in the 2011 Great East Japan Earthquake records are expected to be greaterthan those adopted in the U.S. for typical NEHRP site classes [39]. Twenty-two ground motionsobtained from these databases had to be filtered and baseline corrected [40]. For each of theselong duration records, a corresponding short duration record with D5−75 shorter than 25 s,and having a closely matching response spectrum was chosen from the PEER NGA-West2database [41]. The spectral ordinates of each short duration record were then scaled, such thatthe mean spectral ordinates of the scaled record were similar to those of the long durationrecord. Among all candidate short duration records that had not already been selected, theone with the lowest sum of squared errors was chosen.
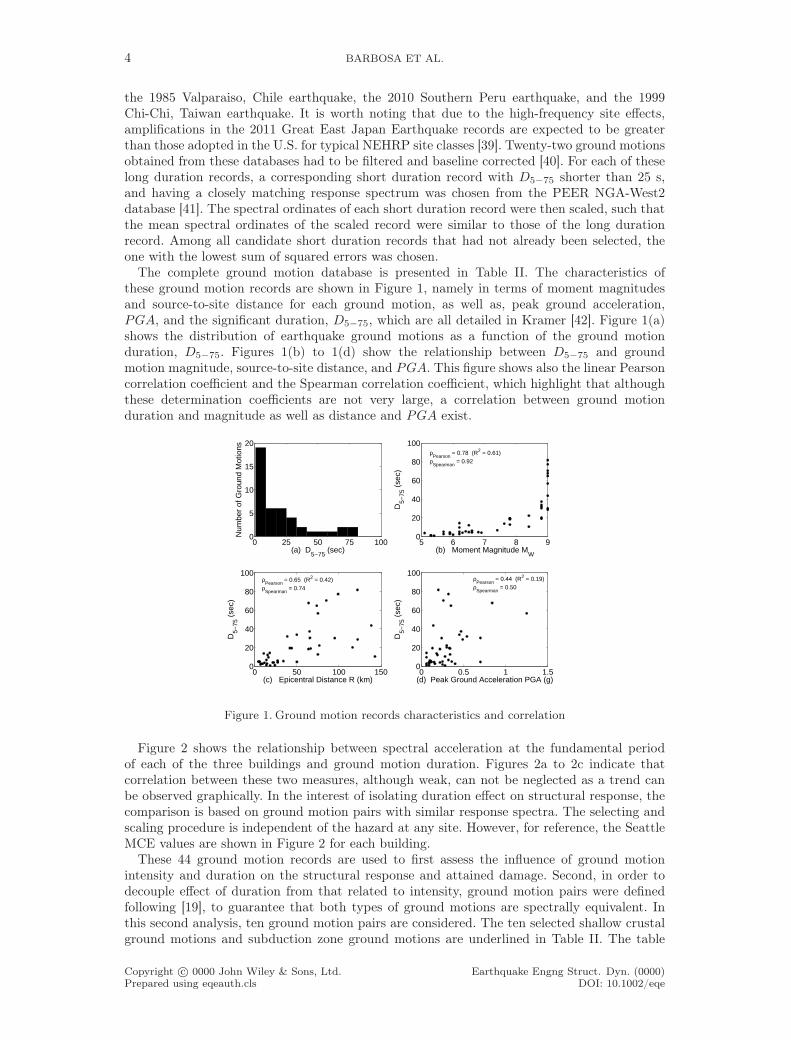
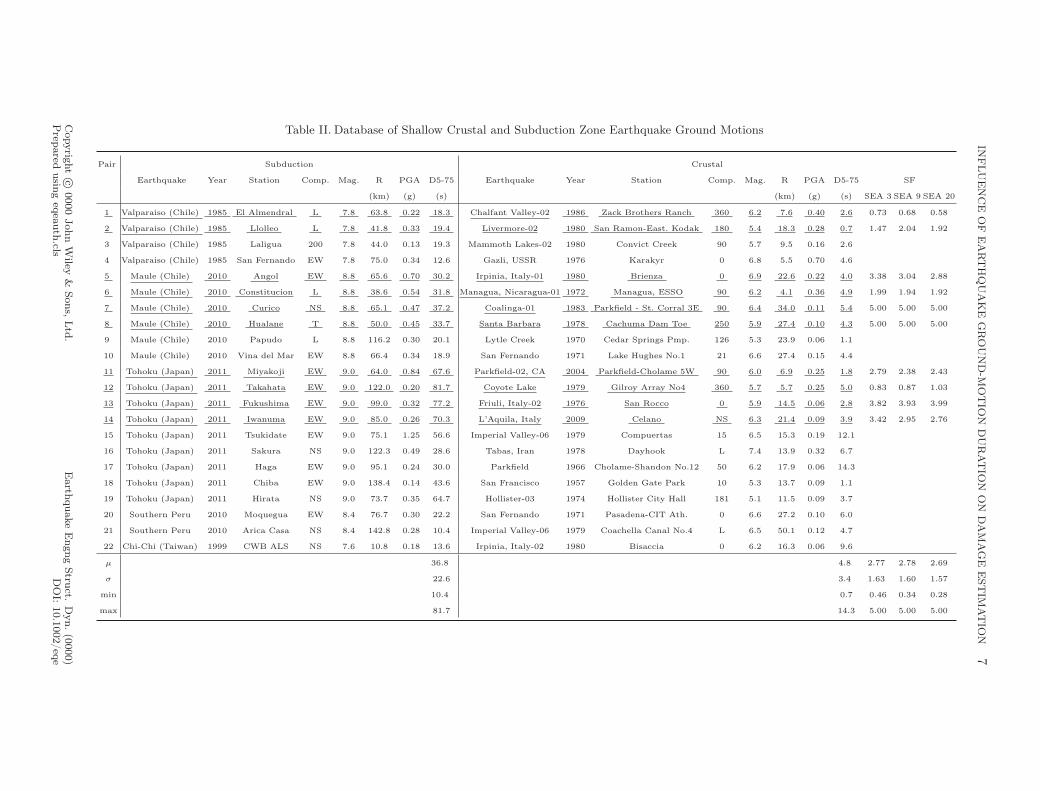
The complete ground motion database is presented in Table II. The characteristics ofthese ground motion records are shown in Figure 1, namely in terms of moment magnitudesand source-to-site distance for each ground motion, as well as, peak ground acceleration,PGA, and the significant duration, D5−75, which are all detailed in Kramer [42]. Figure 1(a)shows the distribution of earthquake ground motions as a function of the ground motionduration, D5−75. Figures 1(b) to 1(d) show the relationship between D5−75 and groundmotion magnitude, source-to-site distance, and PGA. This figure shows also the linear Pearsoncorrelation coefficient and the Spearman correlation coefficient, which highlight that althoughthese determination coefficients are not very large, a correlation between ground motionduration and magnitude as well as distance and PGA exist.
0 0.5 1 1.50
20
40
60
80
100
(d) Peak Ground Acceleration PGA (g)
D5−
75 (
sec)
0 50 100 1500
20
40
60
80
100
(c) Epicentral Distance R (km)
D5−
75 (
sec)
5 6 7 8 90
20
40
60
80
100
(b) Moment Magnitude MW
D5−
75 (
sec)
0 25 50 75 1000
5
10
15
20
(a) D5−75
(sec)
Num
ber
of G
roun
d M
otio
ns
ρPearson
= 0.78 (R2 = 0.61)ρ
Spearman = 0.92
ρPearson
= 0.65 (R2 = 0.42)ρ
Spearman = 0.74
ρPearson
= 0.44 (R2 = 0.19)ρ
Spearman = 0.50
Figure 1. Ground motion records characteristics and correlation
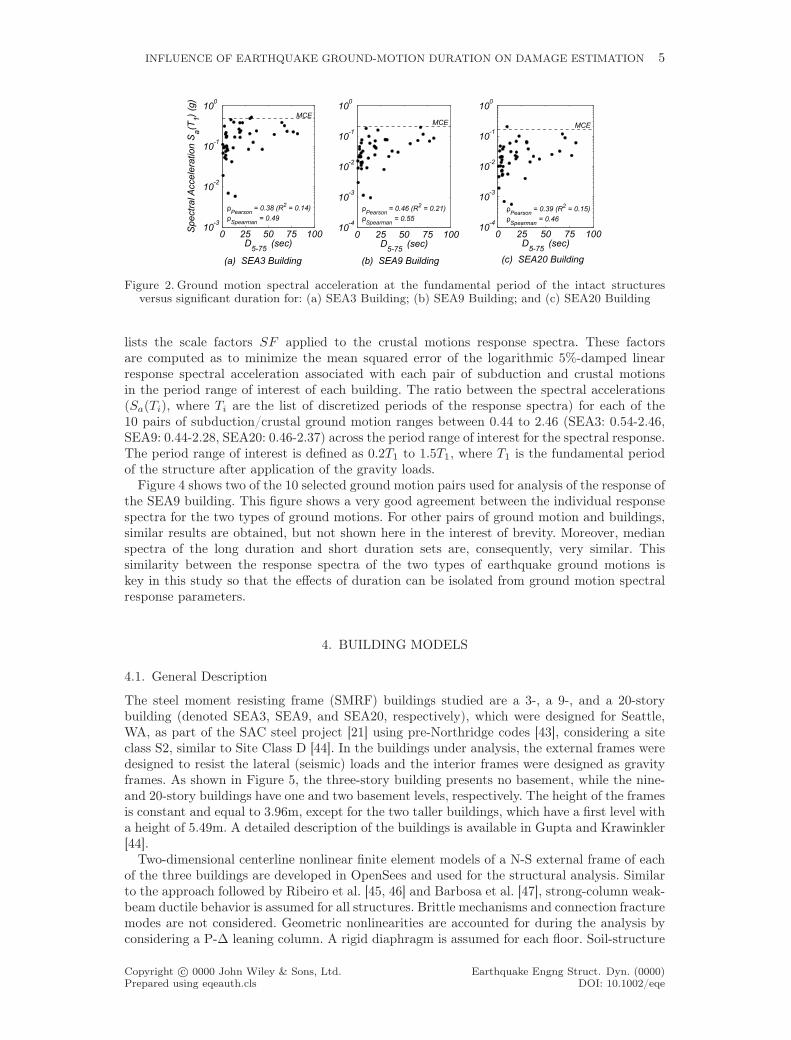
Figure 2 shows the relationship between spectral acceleration at the fundamental periodof each of the three buildings and ground motion duration. Figures 2a to 2c indicate thatcorrelation between these two measures, although weak, can not be neglected as a trend canbe observed graphically. In the interest of isolating duration effect on structural response, thecomparison is based on ground motion pairs with similar response spectra. The selecting andscaling procedure is independent of the hazard at any site. However, for reference, the SeattleMCE values are shown in Figure 2 for each building.
These 44 ground motion records are used to first assess the influence of ground motionintensity and duration on the structural response and attained damage. Second, in order todecouple effect of duration from that related to intensity, ground motion pairs were definedfollowing [19], to guarantee that both types of ground motions are spectrally equivalent. Inthis second analysis, ten ground motion pairs are considered. The ten selected shallow crustalground motions and subduction zone ground motions are underlined in Table II. The table
Copyright c© 0000 John Wiley & Sons, Ltd. Earthquake Engng Struct. Dyn. (0000)Prepared using eqeauth.cls DOI: 10.1002/eqe
INFLUENCE OF EARTHQUAKE GROUND-MOTION DURATION ON DAMAGE ESTIMATION 5
0 25 50 75 10010
-3
10-2
10-1
100
D5-75
(sec)
Sp
ectr
alA
cce
lera
tio
n S
a(T
1)
(g)
(a) SEA3 Building
0 25 50 75 10010
-4
10-3
10-2
10-1
100
D5-75
(sec)
(b) SEA9 Building
0 25 50 75 10010
-4
10-3
10-2
10-1
100
D5-75
(sec)
(c) SEA20 Building.
ρPearson
= 0.46 (R2
= 0.21)
ρSpearman
= 0.55
ρPearson
= 0.39 (R2
= 0.15)
ρSpearman
= 0.46
ρPearson
= 0.38 (R2
= 0.14)
ρSpearman
= 0.49
MCEMCE MCE
Figure 2. Ground motion spectral acceleration at the fundamental period of the intact structuresversus significant duration for: (a) SEA3 Building; (b) SEA9 Building; and (c) SEA20 Building
lists the scale factors SF applied to the crustal motions response spectra. These factorsare computed as to minimize the mean squared error of the logarithmic 5%-damped linearresponse spectral acceleration associated with each pair of subduction and crustal motionsin the period range of interest of each building. The ratio between the spectral accelerations(Sa(Ti), where Ti are the list of discretized periods of the response spectra) for each of the10 pairs of subduction/crustal ground motion ranges between 0.44 to 2.46 (SEA3: 0.54-2.46,SEA9: 0.44-2.28, SEA20: 0.46-2.37) across the period range of interest for the spectral response.The period range of interest is defined as 0.2T1 to 1.5T1, where T1 is the fundamental periodof the structure after application of the gravity loads.
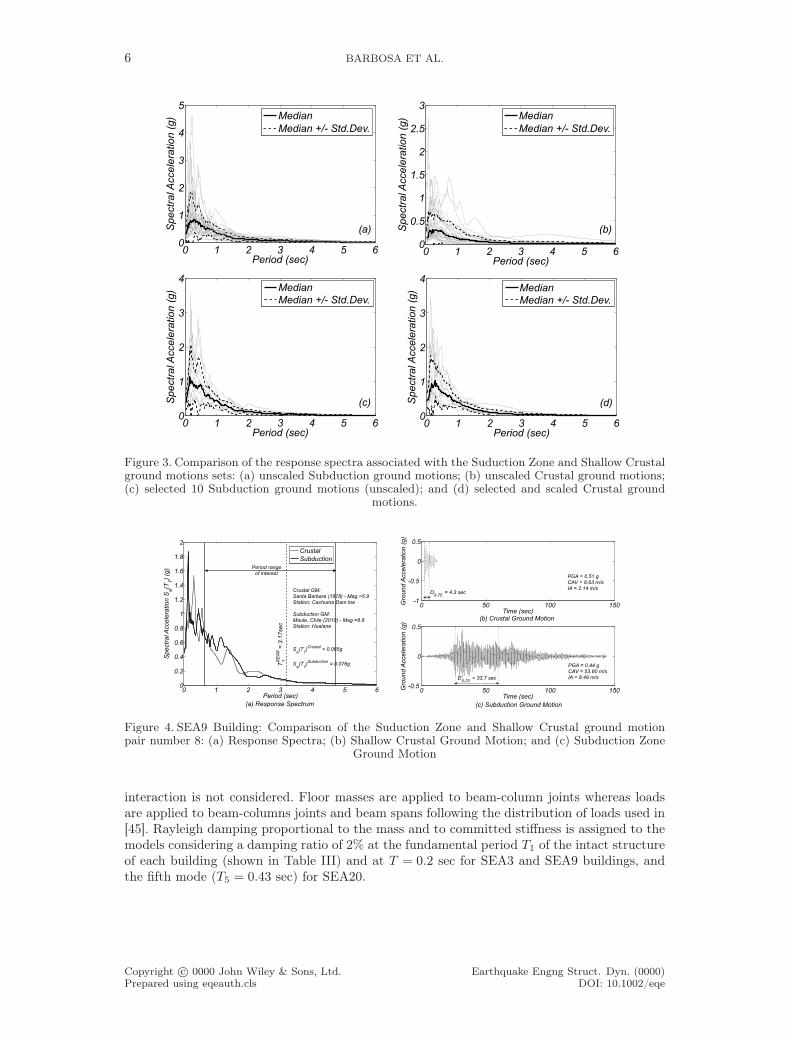
Figure 4 shows two of the 10 selected ground motion pairs used for analysis of the response ofthe SEA9 building. This figure shows a very good agreement between the individual responsespectra for the two types of ground motions. For other pairs of ground motion and buildings,similar results are obtained, but not shown here in the interest of brevity. Moreover, medianspectra of the long duration and short duration sets are, consequently, very similar. Thissimilarity between the response spectra of the two types of earthquake ground motions iskey in this study so that the effects of duration can be isolated from ground motion spectralresponse parameters.
4. BUILDING MODELS
4.1. General Description
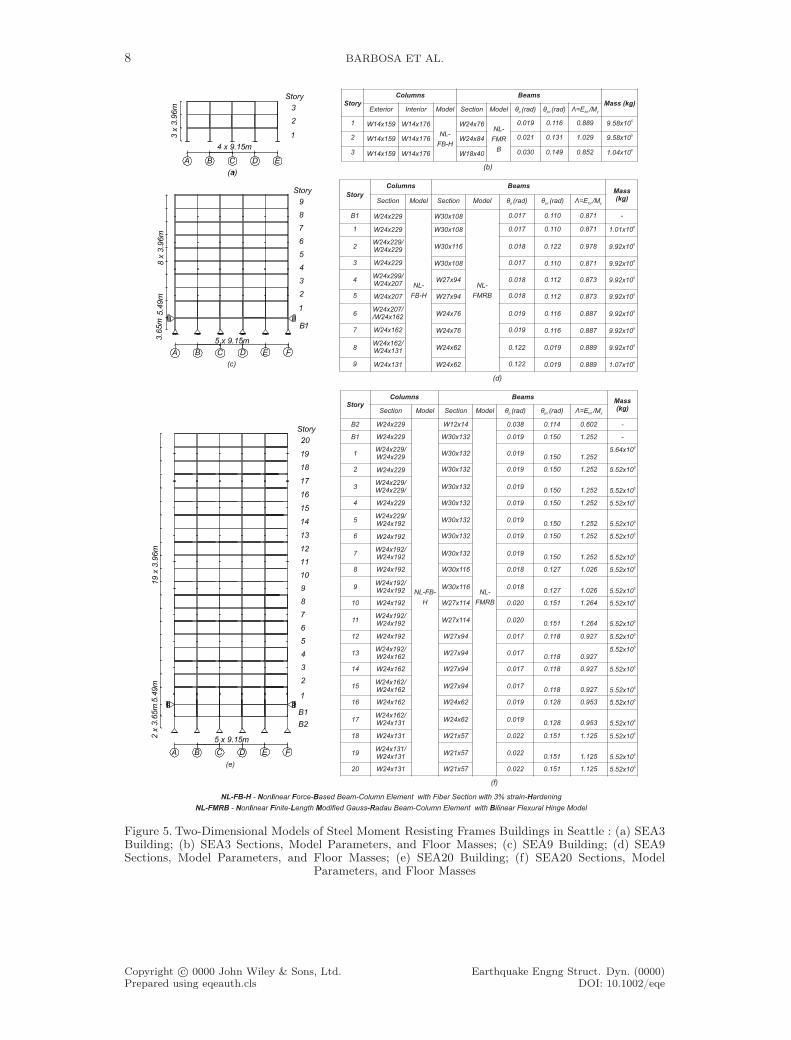
The steel moment resisting frame (SMRF) buildings studied are a 3-, a 9-, and a 20-storybuilding (denoted SEA3, SEA9, and SEA20, respectively), which were designed for Seattle,WA, as part of the SAC steel project [21] using pre-Northridge codes [43], considering a siteclass S2, similar to Site Class D [44]. In the buildings under analysis, the external frames weredesigned to resist the lateral (seismic) loads and the interior frames were designed as gravityframes. As shown in Figure 5, the three-story building presents no basement, while the nine-and 20-story buildings have one and two basement levels, respectively. The height of the framesis constant and equal to 3.96m, except for the two taller buildings, which have a first level witha height of 5.49m. A detailed description of the buildings is available in Gupta and Krawinkler[44].
Two-dimensional centerline nonlinear finite element models of a N-S external frame of eachof the three buildings are developed in OpenSees and used for the structural analysis. Similarto the approach followed by Ribeiro et al. [45, 46] and Barbosa et al. [47], strong-column weak-beam ductile behavior is assumed for all structures. Brittle mechanisms and connection fracturemodes are not considered. Geometric nonlinearities are accounted for during the analysis byconsidering a P-∆ leaning column. A rigid diaphragm is assumed for each floor. Soil-structure
Copyright c© 0000 John Wiley & Sons, Ltd. Earthquake Engng Struct. Dyn. (0000)Prepared using eqeauth.cls DOI: 10.1002/eqe
6 BARBOSA ET AL.
0 1 2 3 4 5 60
1
2
3
4
Period (sec)
Spectr
alA
ccele
ration (
g) Median
Median +/- Std.Dev.
(d)
0 1 2 3 4 5 60
1
2
3
4
Period (sec)
Spectr
alA
ccele
ration (
g) Median
Median +/- Std.Dev.
(c)
0 1 2 3 4 5 60
0.5
1
1.5
2
2.5
3
Period (sec)
Spectr
alA
ccele
ration (
g) Median
Median +/- Std.Dev.
(b)
0 1 2 3 4 5 60
1
2
3
4
5
Period (sec)
Spectr
alA
ccele
ration (
g) Median
Median +/- Std.Dev.
(a)
Figure 3. Comparison of the response spectra associated with the Suduction Zone and Shallow Crustalground motions sets: (a) unscaled Subduction ground motions; (b) unscaled Crustal ground motions;(c) selected 10 Subduction ground motions (unscaled); and (d) selected and scaled Crustal ground
motions.
0 50 100 150-1
-0.5
0
0.5
Time (sec)
Gro
und
Accele
ration (
g)
(b) Crustal Ground Motion
0 50 100 150-0.5
0
0.5
Time (sec)
Gro
und
Accele
ration (
g)
(c) Subduction Ground Motion.
D5-75
= 4.3 sec
PGA = 0.51 gCAV = 8.63 m/sIA = 2.14 m/s
PGA = 0.44 gCAV = 53.60 m/sIA = 8.49 m/sD
5-75= 33.7 sec
0 1 2 3 4 5 60
0.2
0.4
0.6
0.8
1
1.2
1.4
1.6
1.8
2
Period (sec)
Spectr
alA
ccele
ration S
a(T
1)
(g)
(a) Response Spectrum
T1S
EA
9=
3.1
7sec
Crustal
Subduction
Period rangeof interest
Crustal GM:Santa Barbara (1978) - Mag.=5.9Station: Cachuma Dam toe
Subduction GM:Maule, Chile (2010) - Mag.=8.8Station: Hualane
Sa(T
1)Crustal
= 0.065g
Sa(T
1)Subduction
= 0.076g
Figure 4. SEA9 Building: Comparison of the Suduction Zone and Shallow Crustal ground motionpair number 8: (a) Response Spectra; (b) Shallow Crustal Ground Motion; and (c) Subduction Zone
Ground Motion
interaction is not considered. Floor masses are applied to beam-column joints whereas loadsare applied to beam-columns joints and beam spans following the distribution of loads used in[45]. Rayleigh damping proportional to the mass and to committed stiffness is assigned to themodels considering a damping ratio of 2% at the fundamental period T1 of the intact structureof each building (shown in Table III) and at T = 0.2 sec for SEA3 and SEA9 buildings, andthe fifth mode (T5 = 0.43 sec) for SEA20.
Copyright c© 0000 John Wiley & Sons, Ltd. Earthquake Engng Struct. Dyn. (0000)Prepared using eqeauth.cls DOI: 10.1002/eqe
INFLU
EN
CE
OF
EA
RT
HQ
UA
KE
GR
OU
ND
-MO
TIO
ND
UR
AT
ION
ON
DA
MA
GE
EST
IMA
TIO
N7
Table II. Database of Shallow Crustal and Subduction Zone Earthquake Ground Motions
Pair Subduction Crustal
Earthquake Year Station Comp. Mag. R PGA D5-75 Earthquake Year Station Comp. Mag. R PGA D5-75 SF
(km) (g) (s) (km) (g) (s) SEA 3 SEA 9 SEA 20
1 Valparaiso (Chile) 1985 El Almendral L 7.8 63.8 0.22 18.3 Chalfant Valley-02 1986 Zack Brothers Ranch 360 6.2 7.6 0.40 2.6 0.73 0.68 0.58
2 Valparaiso (Chile) 1985 Llolleo L 7.8 41.8 0.33 19.4 Livermore-02 1980 San Ramon-East. Kodak 180 5.4 18.3 0.28 0.7 1.47 2.04 1.92
3 Valparaiso (Chile) 1985 Laligua 200 7.8 44.0 0.13 19.3 Mammoth Lakes-02 1980 Convict Creek 90 5.7 9.5 0.16 2.6
4 Valparaiso (Chile) 1985 San Fernando EW 7.8 75.0 0.34 12.6 Gazli, USSR 1976 Karakyr 0 6.8 5.5 0.70 4.6
5 Maule (Chile) 2010 Angol EW 8.8 65.6 0.70 30.2 Irpinia, Italy-01 1980 Brienza 0 6.9 22.6 0.22 4.0 3.38 3.04 2.88
6 Maule (Chile) 2010 Constitucion L 8.8 38.6 0.54 31.8 Managua, Nicaragua-01 1972 Managua, ESSO 90 6.2 4.1 0.36 4.9 1.99 1.94 1.92
7 Maule (Chile) 2010 Curico NS 8.8 65.1 0.47 37.2 Coalinga-01 1983 Parkfield - St. Corral 3E 90 6.4 34.0 0.11 5.4 5.00 5.00 5.00
8 Maule (Chile) 2010 Hualane T 8.8 50.0 0.45 33.7 Santa Barbara 1978 Cachuma Dam Toe 250 5.9 27.4 0.10 4.3 5.00 5.00 5.00
9 Maule (Chile) 2010 Papudo L 8.8 116.2 0.30 20.1 Lytle Creek 1970 Cedar Springs Pmp. 126 5.3 23.9 0.06 1.1
10 Maule (Chile) 2010 Vina del Mar EW 8.8 66.4 0.34 18.9 San Fernando 1971 Lake Hughes No.1 21 6.6 27.4 0.15 4.4
11 Tohoku (Japan) 2011 Miyakoji EW 9.0 64.0 0.84 67.6 Parkfield-02, CA 2004 Parkfield-Cholame 5W 90 6.0 6.9 0.25 1.8 2.79 2.38 2.43
12 Tohoku (Japan) 2011 Takahata EW 9.0 122.0 0.20 81.7 Coyote Lake 1979 Gilroy Array No4 360 5.7 5.7 0.25 5.0 0.83 0.87 1.03
13 Tohoku (Japan) 2011 Fukushima EW 9.0 99.0 0.32 77.2 Friuli, Italy-02 1976 San Rocco 0 5.9 14.5 0.06 2.8 3.82 3.93 3.99
14 Tohoku (Japan) 2011 Iwanuma EW 9.0 85.0 0.26 70.3 L’Aquila, Italy 2009 Celano NS 6.3 21.4 0.09 3.9 3.42 2.95 2.76
15 Tohoku (Japan) 2011 Tsukidate EW 9.0 75.1 1.25 56.6 Imperial Valley-06 1979 Compuertas 15 6.5 15.3 0.19 12.1
16 Tohoku (Japan) 2011 Sakura NS 9.0 122.3 0.49 28.6 Tabas, Iran 1978 Dayhook L 7.4 13.9 0.32 6.7
17 Tohoku (Japan) 2011 Haga EW 9.0 95.1 0.24 30.0 Parkfield 1966 Cholame-Shandon No.12 50 6.2 17.9 0.06 14.3
18 Tohoku (Japan) 2011 Chiba EW 9.0 138.4 0.14 43.6 San Francisco 1957 Golden Gate Park 10 5.3 13.7 0.09 1.1
19 Tohoku (Japan) 2011 Hirata NS 9.0 73.7 0.35 64.7 Hollister-03 1974 Hollister City Hall 181 5.1 11.5 0.09 3.7
20 Southern Peru 2010 Moquegua EW 8.4 76.7 0.30 22.2 San Fernando 1971 Pasadena-CIT Ath. 0 6.6 27.2 0.10 6.0
21 Southern Peru 2010 Arica Casa NS 8.4 142.8 0.28 10.4 Imperial Valley-06 1979 Coachella Canal No.4 L 6.5 50.1 0.12 4.7
22 Chi-Chi (Taiwan) 1999 CWB ALS NS 7.6 10.8 0.18 13.6 Irpinia, Italy-02 1980 Bisaccia 0 6.2 16.3 0.06 9.6
µ 36.8 4.8 2.77 2.78 2.69
σ 22.6 3.4 1.63 1.60 1.57
min 10.4 0.7 0.46 0.34 0.28
max 81.7 14.3 5.00 5.00 5.00
Copyrig
ht
c©0000
John
Wiley
&Sons,
Ltd
.E
arth
quake
Engng
Stru
ct.D
yn.(0
000)
Prep
ared
usin
geq
eauth
.clsD
OI:
10.1
002/eq
e
8 BARBOSA ET AL.
StoryColumns Beams
Mass(kg)Section Model Section Model θp (rad) θpc (rad) Λ=E /Mtot y
B2 W24x229
NL-FB-
H
W12x14
NL-
FMRB
0.038 0.114 0.602 -
B1 W24x229 W30x132 0.019 0.150 1.252 -
1W24x229/W24x229
W30x132 0.0190.150 1.252
5.64x10⁵
2 W24x229 W30x132 0.019 0.150 1.252 5.52x10⁵
3W24x229/W24x229/
W30x132 0.0190.150 1.252 5.52x10
5
4 W24x229 W30x132 0.019 0.150 1.252 5.52x10⁵
5W24x229/W24x192
W30x132 0.0190.150 1.252 5.52x10
5
6 W24x192 W30x132 0.019 0.150 1.252 5.52x10⁵
7W24x192/W24x192
W30x132 0.0190.150 1.252 5.52x10
5
8 W24x192 W30x116 0.018 0.127 1.026 5.52x10⁵
9W24x192/W24x192
W30x116 0.0180.127 1.026 5.52x10
5
10 W24x192 W27x114 0.020 0.151 1.264 5.52x10⁵
11W24x192/W24x192
W27x114 0.0200.151 1.264 5.52x10
5
12 W24x192 W27x94 0.017 0.118 0.927 5.52x10⁵
13W24x192/W24x162
W27x94 0.0170.118 0.927
5.52x10⁵
14 W24x162 W27x94 0.017 0.118 0.927 5.52x10⁵
15W24x162/W24x162
W27x94 0.0170.118 0.927 5.52x10
5
16 W24x162 W24x62 0.019 0.128 0.953 5.52x10⁵
17W24x162/W24x131
W24x62 0.0190.128 0.953 5.52x10
5
18 W24x131 W21x57 0.022 0.151 1.125 5.52x10⁵
19W24x131/W24x131
W21x57 0.0220.151 1.125 5.52x10
5
20 W24x131 W21x57 0.022 0.151 1.125 5.52x10⁵
(f)
Story
Columns Beams
Mass (kg)Exterior Interior Model Section Model θp (rad) θpc (rad) Λ=E /Mtot y
1 W14x159 W14x176
NL-
FB-H
W24x76NL-
FMR
B
0.019 0.116 0.889 9.58x10⁵
2 W14x159 W14x176 W24x84 0.021 0.131 1.029 9.58x10⁵
3 W14x159 W14x176 W18x40 0.030 0.149 0.852 1.04x10⁶
Story
Columns BeamsMass(kg)Section Model Section Model θp (rad) θpc (rad) Λ=E /Mtot y
B1 W24x229
NL-
FB-H
W30x108
NL-
FMRB
0.017 0.110 0.871 -
1 W24x229 W30x108 0.017 0.110 0.871 1.01x10⁶
2W24x229/W24x229
W30x116 0.018 0.122 0.978 9.92x10⁵
3 W24x229 W30x108 0.017 0.110 0.871 9.92x10⁵
4W24x299/W24x207
W27x94 0.018 0.112 0.873 9.92x10⁵
5 W24x207 W27x94 0.018 0.112 0.873 9.92x10⁵
6W24x207//W24x162
W24x76 0.019 0.116 0.887 9.92x10⁵
7 W24x162 W24x76 0.019 0.116 0.887 9.92x10⁵
8W24x162/W24x131 W24x62 0.122 0.019 0.889 9.92x10
5
9 W24x131 W24x62 0.122 0.019 0.889 1.07x10⁶
(d)
(b)
(c).
(e)
NL-FB-H N l F B H
NL-FMRB N l F L M -R B
- on inear orce- ased Beam-Column Element with Fiber Section with 3% strain- ardening
- on inear inite- ength odified Gauss adau Beam-Column Element with ilinear Flexural Hinge Model
Figure 5. Two-Dimensional Models of Steel Moment Resisting Frames Buildings in Seattle : (a) SEA3Building; (b) SEA3 Sections, Model Parameters, and Floor Masses; (c) SEA9 Building; (d) SEA9Sections, Model Parameters, and Floor Masses; (e) SEA20 Building; (f) SEA20 Sections, Model
Parameters, and Floor Masses
Copyright c© 0000 John Wiley & Sons, Ltd. Earthquake Engng Struct. Dyn. (0000)Prepared using eqeauth.cls DOI: 10.1002/eqe
INFLUENCE OF EARTHQUAKE GROUND-MOTION DURATION ON DAMAGE ESTIMATION 9
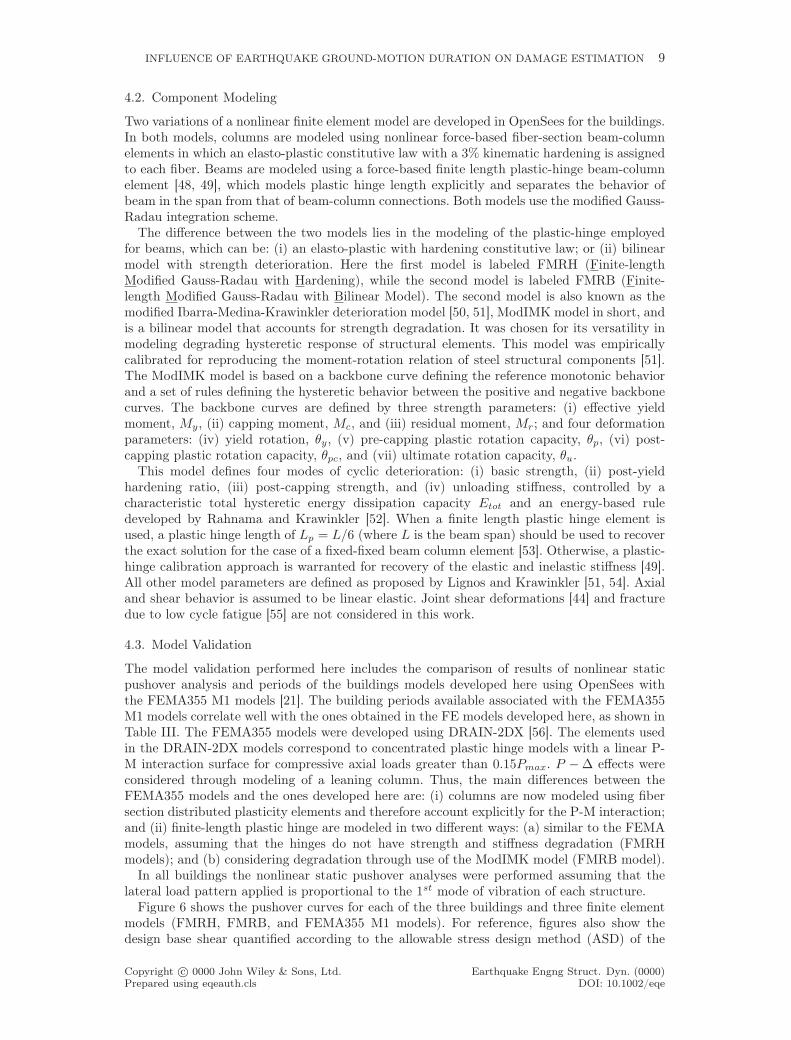
4.2. Component Modeling
Two variations of a nonlinear finite element model are developed in OpenSees for the buildings.In both models, columns are modeled using nonlinear force-based fiber-section beam-columnelements in which an elasto-plastic constitutive law with a 3% kinematic hardening is assignedto each fiber. Beams are modeled using a force-based finite length plastic-hinge beam-columnelement [48, 49], which models plastic hinge length explicitly and separates the behavior ofbeam in the span from that of beam-column connections. Both models use the modified Gauss-Radau integration scheme.
The difference between the two models lies in the modeling of the plastic-hinge employedfor beams, which can be: (i) an elasto-plastic with hardening constitutive law; or (ii) bilinearmodel with strength deterioration. Here the first model is labeled FMRH (Finite-lengthModified Gauss-Radau with Hardening), while the second model is labeled FMRB (Finite-length Modified Gauss-Radau with Bilinear Model). The second model is also known as themodified Ibarra-Medina-Krawinkler deterioration model [50, 51], ModIMK model in short, andis a bilinear model that accounts for strength degradation. It was chosen for its versatility inmodeling degrading hysteretic response of structural elements. This model was empiricallycalibrated for reproducing the moment-rotation relation of steel structural components [51].The ModIMK model is based on a backbone curve defining the reference monotonic behaviorand a set of rules defining the hysteretic behavior between the positive and negative backbonecurves. The backbone curves are defined by three strength parameters: (i) effective yieldmoment, My, (ii) capping moment, Mc, and (iii) residual moment, Mr; and four deformationparameters: (iv) yield rotation, θy, (v) pre-capping plastic rotation capacity, θp, (vi) post-capping plastic rotation capacity, θpc, and (vii) ultimate rotation capacity, θu.
This model defines four modes of cyclic deterioration: (i) basic strength, (ii) post-yieldhardening ratio, (iii) post-capping strength, and (iv) unloading stiffness, controlled by acharacteristic total hysteretic energy dissipation capacity Etot and an energy-based ruledeveloped by Rahnama and Krawinkler [52]. When a finite length plastic hinge element isused, a plastic hinge length of Lp = L/6 (where L is the beam span) should be used to recoverthe exact solution for the case of a fixed-fixed beam column element [53]. Otherwise, a plastic-hinge calibration approach is warranted for recovery of the elastic and inelastic stiffness [49].All other model parameters are defined as proposed by Lignos and Krawinkler [51, 54]. Axialand shear behavior is assumed to be linear elastic. Joint shear deformations [44] and fracturedue to low cycle fatigue [55] are not considered in this work.
4.3. Model Validation
The model validation performed here includes the comparison of results of nonlinear staticpushover analysis and periods of the buildings models developed here using OpenSees withthe FEMA355 M1 models [21]. The building periods available associated with the FEMA355M1 models correlate well with the ones obtained in the FE models developed here, as shown inTable III. The FEMA355 models were developed using DRAIN-2DX [56]. The elements usedin the DRAIN-2DX models correspond to concentrated plastic hinge models with a linear P-M interaction surface for compressive axial loads greater than 0.15Pmax. P −∆ effects wereconsidered through modeling of a leaning column. Thus, the main differences between theFEMA355 models and the ones developed here are: (i) columns are now modeled using fibersection distributed plasticity elements and therefore account explicitly for the P-M interaction;and (ii) finite-length plastic hinge are modeled in two different ways: (a) similar to the FEMAmodels, assuming that the hinges do not have strength and stiffness degradation (FMRHmodels); and (b) considering degradation through use of the ModIMK model (FMRB model).
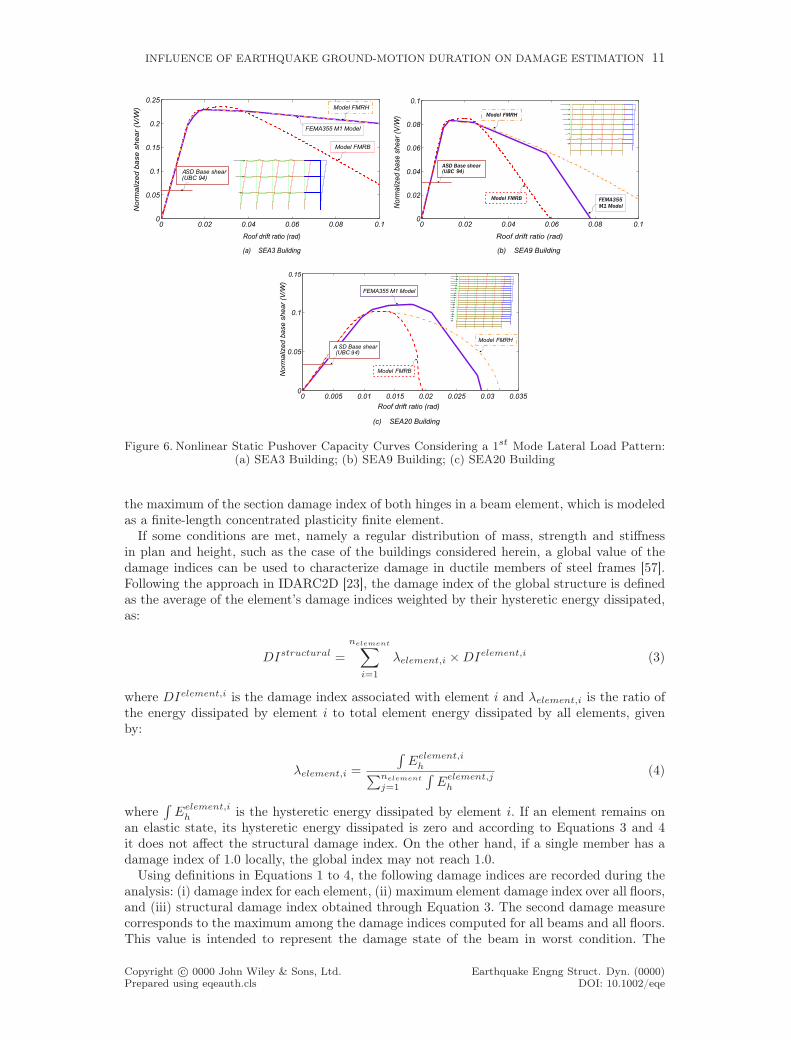
In all buildings the nonlinear static pushover analyses were performed assuming that thelateral load pattern applied is proportional to the 1st mode of vibration of each structure.
Figure 6 shows the pushover curves for each of the three buildings and three finite elementmodels (FMRH, FMRB, and FEMA355 M1 models). For reference, figures also show thedesign base shear quantified according to the allowable stress design method (ASD) of the
Copyright c© 0000 John Wiley & Sons, Ltd. Earthquake Engng Struct. Dyn. (0000)Prepared using eqeauth.cls DOI: 10.1002/eqe
10 BARBOSA ET AL.
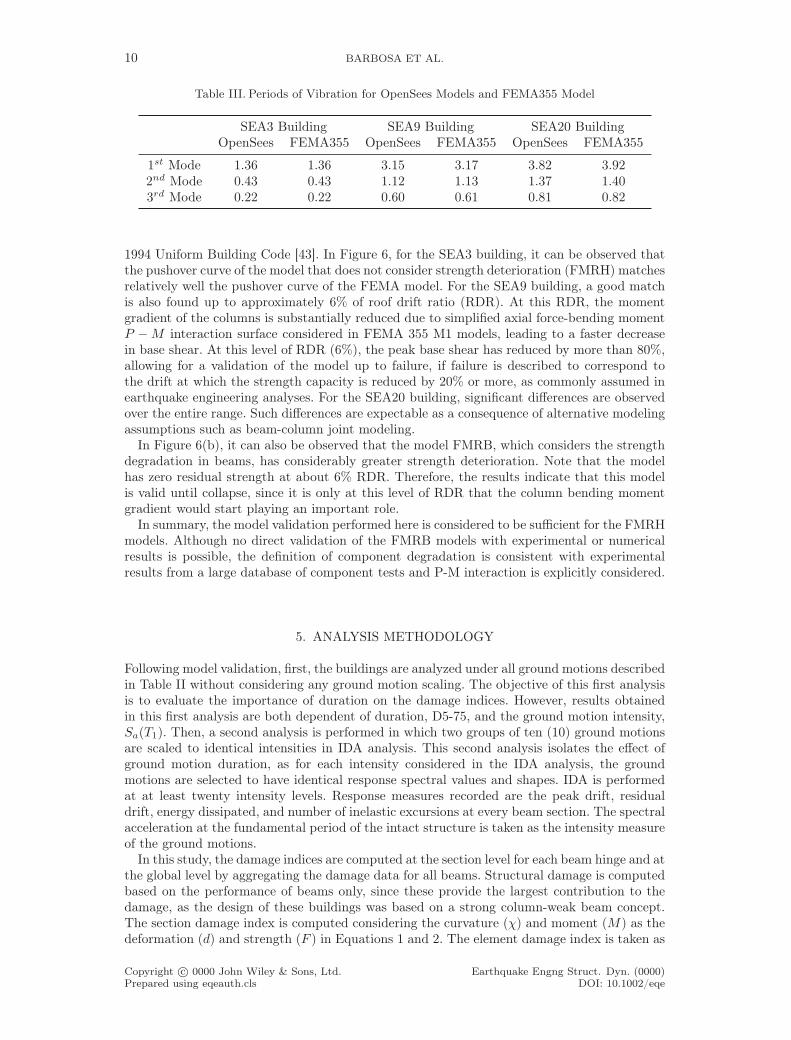
Table III. Periods of Vibration for OpenSees Models and FEMA355 Model
SEA3 Building SEA9 Building SEA20 BuildingOpenSees FEMA355 OpenSees FEMA355 OpenSees FEMA355
1st Mode 1.36 1.36 3.15 3.17 3.82 3.922nd Mode 0.43 0.43 1.12 1.13 1.37 1.403rd Mode 0.22 0.22 0.60 0.61 0.81 0.82
1994 Uniform Building Code [43]. In Figure 6, for the SEA3 building, it can be observed thatthe pushover curve of the model that does not consider strength deterioration (FMRH) matchesrelatively well the pushover curve of the FEMA model. For the SEA9 building, a good matchis also found up to approximately 6% of roof drift ratio (RDR). At this RDR, the momentgradient of the columns is substantially reduced due to simplified axial force-bending momentP −M interaction surface considered in FEMA 355 M1 models, leading to a faster decreasein base shear. At this level of RDR (6%), the peak base shear has reduced by more than 80%,allowing for a validation of the model up to failure, if failure is described to correspond tothe drift at which the strength capacity is reduced by 20% or more, as commonly assumed inearthquake engineering analyses. For the SEA20 building, significant differences are observedover the entire range. Such differences are expectable as a consequence of alternative modelingassumptions such as beam-column joint modeling.
In Figure 6(b), it can also be observed that the model FMRB, which considers the strengthdegradation in beams, has considerably greater strength deterioration. Note that the modelhas zero residual strength at about 6% RDR. Therefore, the results indicate that this modelis valid until collapse, since it is only at this level of RDR that the column bending momentgradient would start playing an important role.
In summary, the model validation performed here is considered to be sufficient for the FMRHmodels. Although no direct validation of the FMRB models with experimental or numericalresults is possible, the definition of component degradation is consistent with experimentalresults from a large database of component tests and P-M interaction is explicitly considered.
5. ANALYSIS METHODOLOGY
Following model validation, first, the buildings are analyzed under all ground motions describedin Table II without considering any ground motion scaling. The objective of this first analysisis to evaluate the importance of duration on the damage indices. However, results obtainedin this first analysis are both dependent of duration, D5-75, and the ground motion intensity,Sa(T1). Then, a second analysis is performed in which two groups of ten (10) ground motionsare scaled to identical intensities in IDA analysis. This second analysis isolates the effect ofground motion duration, as for each intensity considered in the IDA analysis, the groundmotions are selected to have identical response spectral values and shapes. IDA is performedat at least twenty intensity levels. Response measures recorded are the peak drift, residualdrift, energy dissipated, and number of inelastic excursions at every beam section. The spectralacceleration at the fundamental period of the intact structure is taken as the intensity measureof the ground motions.
In this study, the damage indices are computed at the section level for each beam hinge and atthe global level by aggregating the damage data for all beams. Structural damage is computedbased on the performance of beams only, since these provide the largest contribution to thedamage, as the design of these buildings was based on a strong column-weak beam concept.The section damage index is computed considering the curvature (χ) and moment (M) as thedeformation (d) and strength (F ) in Equations 1 and 2. The element damage index is taken as
Copyright c© 0000 John Wiley & Sons, Ltd. Earthquake Engng Struct. Dyn. (0000)Prepared using eqeauth.cls DOI: 10.1002/eqe
INFLUENCE OF EARTHQUAKE GROUND-MOTION DURATION ON DAMAGE ESTIMATION 11
0 0.005 0.01 0.015 0.02 0.025 0.03 0.0350
0.05
0.1
0 0.02 0.04 0.06 0.08 0.10
0.02
0.04
0.06
0.08
0.1
0 0.02 0.04 0.06 0.08 0.10
0.05
0.1
0.15
0.2
0.25
FEMA355 M1 Model
ASD Base shear(UBC 94)
Model FMRH
Model FMRB
Norm
alized b
ase s
hear
(V/W
)
Roof drift ratio (rad) Roof drift ratio (rad)
Norm
aliz
ed
base
shear
(V/W
)
FEMA355
M1 Model
ASD Base shear(UBC 94)
Model FMRH
Model FMRB
Roof drift ratio (rad)
No
rma
lize
d b
ase
sh
ea
r (V
/W)
FEMA355 M1 Model
A SD Base shear(UBC 94)
Model FMRH
Model FMRB
0.15
(a) SEA3 Building (b) SEA9 Building
(c) SEA20 Building.
Figure 6. Nonlinear Static Pushover Capacity Curves Considering a 1st Mode Lateral Load Pattern:(a) SEA3 Building; (b) SEA9 Building; (c) SEA20 Building
the maximum of the section damage index of both hinges in a beam element, which is modeledas a finite-length concentrated plasticity finite element.
If some conditions are met, namely a regular distribution of mass, strength and stiffnessin plan and height, such as the case of the buildings considered herein, a global value of thedamage indices can be used to characterize damage in ductile members of steel frames [57].Following the approach in IDARC2D [23], the damage index of the global structure is definedas the average of the element’s damage indices weighted by their hysteretic energy dissipated,as:
DIstructural =
nelement∑
i=1
λelement,i ×DIelement,i (3)
where DIelement,i is the damage index associated with element i and λelement,i is the ratio ofthe energy dissipated by element i to total element energy dissipated by all elements, givenby:
λelement,i =
∫
Eelement,ih
∑nelement
j=1
∫
Eelement,jh
(4)
where∫
Eelement,ih is the hysteretic energy dissipated by element i. If an element remains on
an elastic state, its hysteretic energy dissipated is zero and according to Equations 3 and 4it does not affect the structural damage index. On the other hand, if a single member has adamage index of 1.0 locally, the global index may not reach 1.0.
Using definitions in Equations 1 to 4, the following damage indices are recorded during theanalysis: (i) damage index for each element, (ii) maximum element damage index over all floors,and (iii) structural damage index obtained through Equation 3. The second damage measurecorresponds to the maximum among the damage indices computed for all beams and all floors.This value is intended to represent the damage state of the beam in worst condition. The
Copyright c© 0000 John Wiley & Sons, Ltd. Earthquake Engng Struct. Dyn. (0000)Prepared using eqeauth.cls DOI: 10.1002/eqe
12 BARBOSA ET AL.
value is saved regardless of the beam/floor where it was attained. The third and last measurecorresponds to a hysteretic energy dissipated weighted average of the observed damage overall beams at all floor levels. For each of the twenty ground motion intensities considered inthis study, median values are computed for each damage measure.
It is worth noting that, when the hysteretic energy dissipated,∫
Eh, exceeded the referencelow inelastic cyclic energy dissipation capacity defined by Reinhorn and Valles [23] (Equation 2)as 4× (du − dy)×My, it is assumed that DIRV = 1.0. Although non-converged analyses canbe incorporated in the collapse risk assessment when a fragility/collapse analysis is performed[58], the scope of this study is to compare the structural damage due to shallow crustal andsubduction zone earthquakes, thus non-converged analyses are ignored.
In all analyses, the Newmark average acceleration method was employed. A maximum timestep of 0.002 sec was used during analysis. This time step was deemed sufficient following aconvergence study where the accuracy of roof acceleration time-history response due to largeintensity shaking was studied using five time steps between 0.01 sec and 0.00005 sec. It wasobserved that a time step of 0.002 sec produces negligible errors (when compared to a timestep of 0.00005 sec) and no significant changes in the response are observed when smaller timesteps are used. The Newton-Raphson method is used to solve the nonlinear system of dynamicequations of equilibrium at each time step. An iterative scheme, which reduces the time-step,changes the solving algorithm, or slightly increases the tolerance criterion when a convergenceissue was found, was implemented in the OpenSees analysis procedure.
6. RESULTS
6.1. Preliminary Results and Damage Assessment Calibration
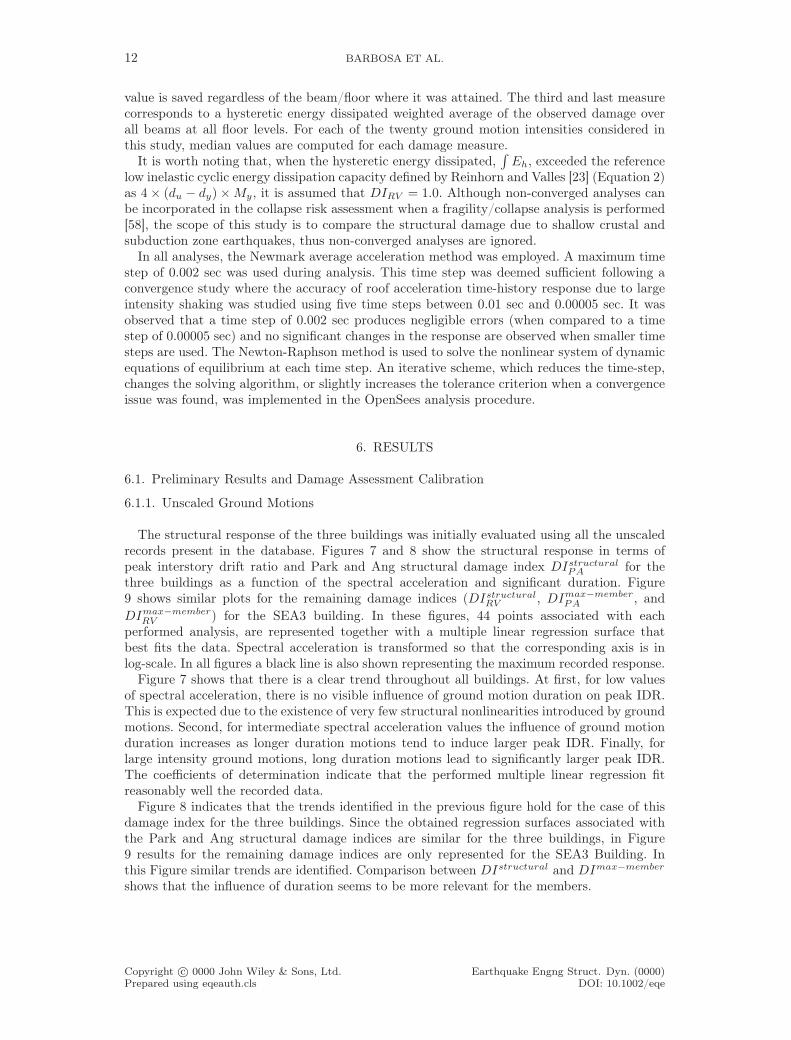
6.1.1. Unscaled Ground Motions
The structural response of the three buildings was initially evaluated using all the unscaledrecords present in the database. Figures 7 and 8 show the structural response in terms ofpeak interstory drift ratio and Park and Ang structural damage index DIstructuralPA for thethree buildings as a function of the spectral acceleration and significant duration. Figure9 shows similar plots for the remaining damage indices (DIstructuralRV , DImax−member
PA , and
DImax−memberRV ) for the SEA3 building. In these figures, 44 points associated with each
performed analysis, are represented together with a multiple linear regression surface thatbest fits the data. Spectral acceleration is transformed so that the corresponding axis is inlog-scale. In all figures a black line is also shown representing the maximum recorded response.
Figure 7 shows that there is a clear trend throughout all buildings. At first, for low valuesof spectral acceleration, there is no visible influence of ground motion duration on peak IDR.This is expected due to the existence of very few structural nonlinearities introduced by groundmotions. Second, for intermediate spectral acceleration values the influence of ground motionduration increases as longer duration motions tend to induce larger peak IDR. Finally, forlarge intensity ground motions, long duration motions lead to significantly larger peak IDR.The coefficients of determination indicate that the performed multiple linear regression fitreasonably well the recorded data.
Figure 8 indicates that the trends identified in the previous figure hold for the case of thisdamage index for the three buildings. Since the obtained regression surfaces associated withthe Park and Ang structural damage indices are similar for the three buildings, in Figure9 results for the remaining damage indices are only represented for the SEA3 Building. Inthis Figure similar trends are identified. Comparison between DIstructural and DImax−member
shows that the influence of duration seems to be more relevant for the members.
Copyright c© 0000 John Wiley & Sons, Ltd. Earthquake Engng Struct. Dyn. (0000)Prepared using eqeauth.cls DOI: 10.1002/eqe
INFLUENCE OF EARTHQUAKE GROUND-MOTION DURATION ON DAMAGE ESTIMATION 13
Figure 7. Peak interstory drift ratio as a function of the significant duration D5−75 and spectralacceleration Sa(T1) for the 44 unscaled ground motions for: (a) SEA3 Building; (b) SEA9 Building;
and (c) SEA20 Building
Figure 8. Park and Ang Structural Damage index DIstructuralPA as a function of the significant durationD5−75 and spectral acceleration Sa(T1) for the 44 unscaled ground motions for: (a) SEA3 Building;
(b) SEA9 Building; and (c) SEA20 Building
Figure 9. SEA3 Building: Damage indices as a function of the significant duration D5−75 and spectralacceleration Sa(T1) for the 44 unscaled ground motions: (a) Park and Ang maximum damage index
DImax,elementPA ; (b) Reinhorn and Valles Structural Damage index DIstructuralRV ; and (c) Reinhorn and
Valles maximum damage index DImax,elementRV
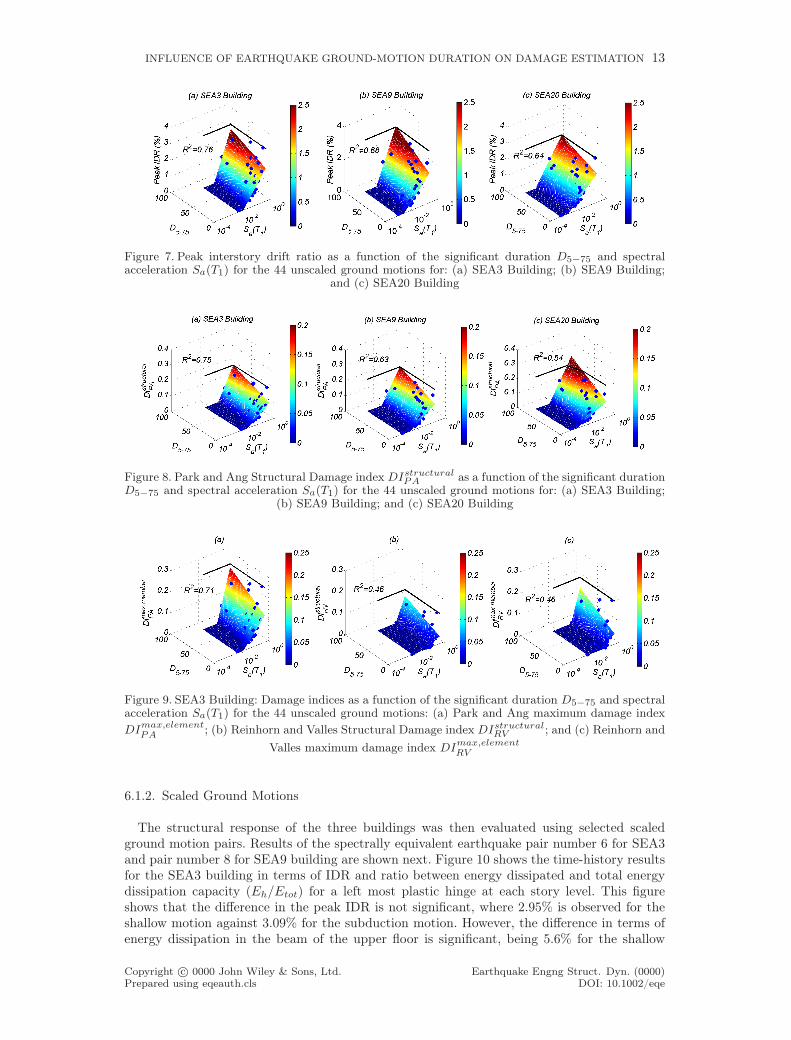
6.1.2. Scaled Ground Motions
The structural response of the three buildings was then evaluated using selected scaledground motion pairs. Results of the spectrally equivalent earthquake pair number 6 for SEA3and pair number 8 for SEA9 building are shown next. Figure 10 shows the time-history resultsfor the SEA3 building in terms of IDR and ratio between energy dissipated and total energydissipation capacity (Eh/Etot) for a left most plastic hinge at each story level. This figureshows that the difference in the peak IDR is not significant, where 2.95% is observed for theshallow motion against 3.09% for the subduction motion. However, the difference in terms ofenergy dissipation in the beam of the upper floor is significant, being 5.6% for the shallow
Copyright c© 0000 John Wiley & Sons, Ltd. Earthquake Engng Struct. Dyn. (0000)Prepared using eqeauth.cls DOI: 10.1002/eqe
14 BARBOSA ET AL.
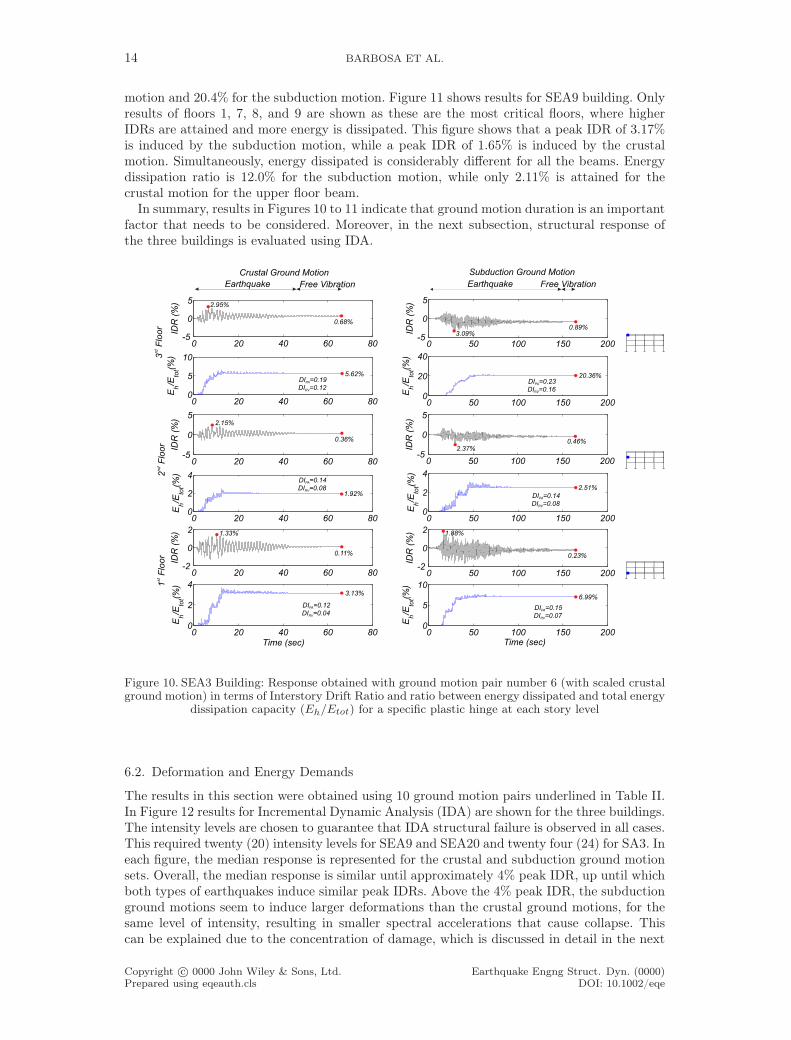
motion and 20.4% for the subduction motion. Figure 11 shows results for SEA9 building. Onlyresults of floors 1, 7, 8, and 9 are shown as these are the most critical floors, where higherIDRs are attained and more energy is dissipated. This figure shows that a peak IDR of 3.17%is induced by the subduction motion, while a peak IDR of 1.65% is induced by the crustalmotion. Simultaneously, energy dissipated is considerably different for all the beams. Energydissipation ratio is 12.0% for the subduction motion, while only 2.11% is attained for thecrustal motion for the upper floor beam.
In summary, results in Figures 10 to 11 indicate that ground motion duration is an importantfactor that needs to be considered. Moreover, in the next subsection, structural response ofthe three buildings is evaluated using IDA.
0 20 40 60 80-5
0
5
IDR
(%
)
0 20 40 60 80-5
0
5
IDR
(%
)
0 20 40 60 80-2
0
2
IDR
(%
)
0 50 100 150 200-5
0
5ID
R (
%)
0 50 100 150 200-2
0
2
IDR
(%
)
0 50 100 150 200-5
0
5
IDR
(%
)0 50 100 150 200
0
20
40
Eh/E
tot(%
)
0 50 100 150 2000
2
4
Eh/E
tot(%
)
0 50 100 150 2000
5
10
Eh/E
tot(%
)0 20 40 60 80
0
5
10
Eh/E
tot(%
)
0 20 40 60 800
2
4
Eh/E
tot(%
)
0 20 40 60 800
2
4
Eh/E
tot(%
)
3F
loor
rd
2F
loor
nd
1F
loor
st
2.95%
0.68%
5.62%
2.15%
0.36%
1.92%
1.33%
0.11%
3.13%
3.09%0.89%
20.36%
2.37%0.46%
2.51%
1.88%
0.23%
6.99%
Earthquake Free Vibration Earthquake Free Vibration
DI =0.23PA
DI =0.16RV
DI =0.14PA
DI =0.08RV
DI =0.15PA
DI =0.07RV
DI =0.12PA
DI =0.04RV
DI =0.14PA
DI =0.08RV
DI =0.19PA
DI =0.12RV
Crustal Ground Motion Subduction Ground Motion
Time (sec) Time (sec)
Figure 10. SEA3 Building: Response obtained with ground motion pair number 6 (with scaled crustalground motion) in terms of Interstory Drift Ratio and ratio between energy dissipated and total energy
dissipation capacity (Eh/Etot) for a specific plastic hinge at each story level
6.2. Deformation and Energy Demands
The results in this section were obtained using 10 ground motion pairs underlined in Table II.In Figure 12 results for Incremental Dynamic Analysis (IDA) are shown for the three buildings.The intensity levels are chosen to guarantee that IDA structural failure is observed in all cases.This required twenty (20) intensity levels for SEA9 and SEA20 and twenty four (24) for SA3. Ineach figure, the median response is represented for the crustal and subduction ground motionsets. Overall, the median response is similar until approximately 4% peak IDR, up until whichboth types of earthquakes induce similar peak IDRs. Above the 4% peak IDR, the subductionground motions seem to induce larger deformations than the crustal ground motions, for thesame level of intensity, resulting in smaller spectral accelerations that cause collapse. Thiscan be explained due to the concentration of damage, which is discussed in detail in the next
Copyright c© 0000 John Wiley & Sons, Ltd. Earthquake Engng Struct. Dyn. (0000)Prepared using eqeauth.cls DOI: 10.1002/eqe
INFLUENCE OF EARTHQUAKE GROUND-MOTION DURATION ON DAMAGE ESTIMATION 15
0 5 10 15 20 25 30 35-2
0
2
IDR
(%
)
0 5 10 15 20 25 30 35-2
0
2
IDR
(%
)
0 5 10 15 20 25 30 35-2
0
2
IDR
(%
)
0 5 10 15 20 25 30 35-1
0
1
IDR
(%
)
0 5 10 15 20 25 30 350
2
4
Eh/E
tot(%
)
0 5 10 15 20 25 30 350
1
2
Eh/E
tot(%
)
0 5 10 15 20 25 30 350
2
4
Eh/E
tot(%
)
0 5 10 15 20 25 30 350
1
2
Time (sec)
Eh/E
tot(%
)
0 50 100 150 200-5
0
5
IDR
(%
)
0 50 100 150 200-5
0
5
IDR
(%
)
0 50 100 150 200-5
0
5
IDR
(%
)
0 50 100 150 200-2
0
2
IDR
(%
)
0 50 100 150 2000
10
20
Eh/E
tot(%
)
0 50 100 150 2000
5
10
Eh/E
tot(%
)
0 50 100 150 2000
2
4
Eh/E
tot(%
)
0 50 100 150 2000
1
2
Time (sec)
Eh/E
tot(%
)
9F
loor
th8
thF
loor
7F
loor
th1
Flo
or
st
DI =0.09PA
DI =0.03RV0.01%
0.09%
0.06%
0.01%
0.41%
0.02%
2.11%
0.02%1.65%
1.55%
1.34%
0.84%
Earthquake Free Vibration
Crustal Ground Motion
Earthquake Free VibrationSubduction Ground Motion
DI =0.06PA
DI =0.00RV
DI =0.18PA
DI =0.12RV
DI =0.08PA
DI =0.01RV
DI =0.20PA
DI =0.14RV
DI =0.10PA
DI =0.04RV
DI =0.26PA
DI =0.22RV
DI =0.12PA
DI =0.05RV
1.10%
0.07%
2.78%
0.80%
6.09%
0.95%
12.00%
1.09%3.17%
3.05%
2.52%
1.12%
Figure 11. SEA9 Building: Response obtained with ground motion pair number 8 (with scaled crustalground motion) in terms of Interstory Drift Ratio and ratio between energy dissipated and total energy
dissipation capacity (Eh/Etot) for a specific plastic hinge at each story level
paragraphs. It is worth noting that a similar trend was obtained by [59] for concentricallybraced steel frames.
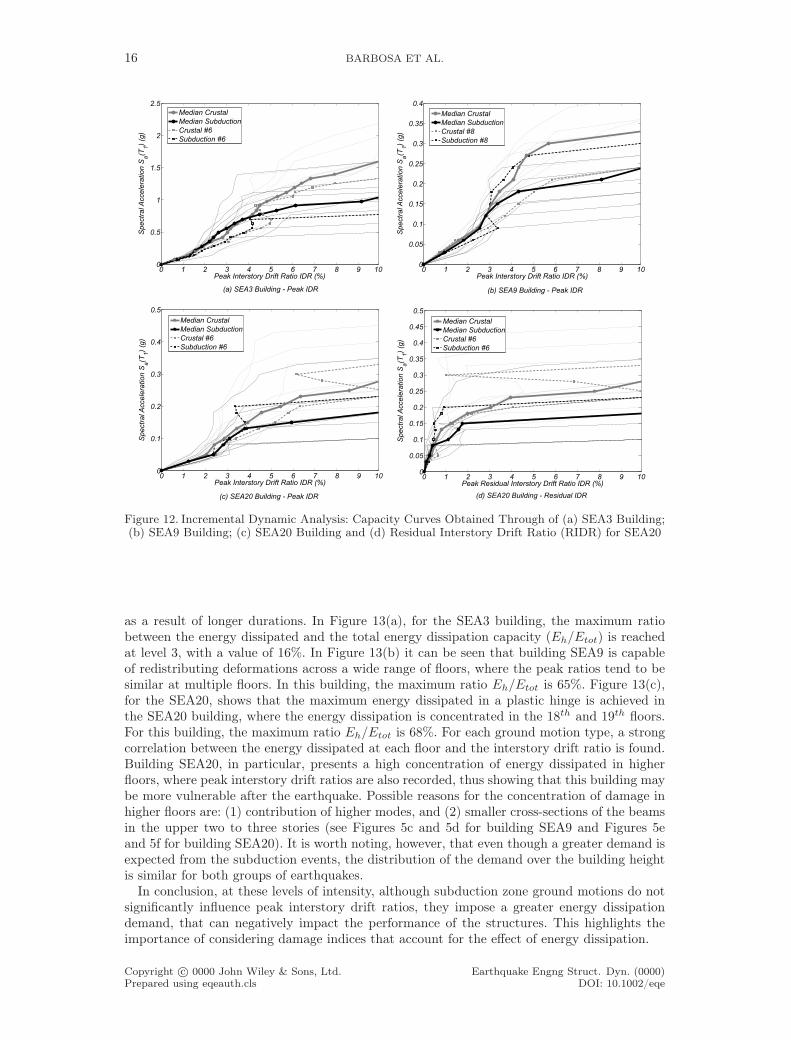
The residual interstory drift ratio (RIDR) has been referred as a good measure of thecumulative damage achieved by the structure and, consequently, a good indicator of the post-earthquake resistant capacity [14]. Figure 12(d) shows the incremental dynamic analysis (IDA)curve for the RIDR for the twenty story building. Obtained results indicate that, for lowintensities of shaking, shallow crustal ground motions tend to induce larger RIDRs than longduration subduction zone ground motions. The tendency of the longer duration motions toreduce the RIDR for lower intensities is related to the self-centering nature of the model, whichhas been discussed in detail by Barbosa et al. [47]. As the earthquake ground motion intensityincreases, subduction ground motions induce larger residual deformations due to the increasein cumulative damage that is sustained by the structural members. Similar tendency, althoughless pronounced, is also observed for the 3-story building (not shown here). It is worth notingthat RIDR is affected by the modeling approach used, especially when modeling structures tocollapse. However, in the interest of the length of this paper, and because damage indices donot account for the RIDR, detailed discussion of the RIDR is left for future works.
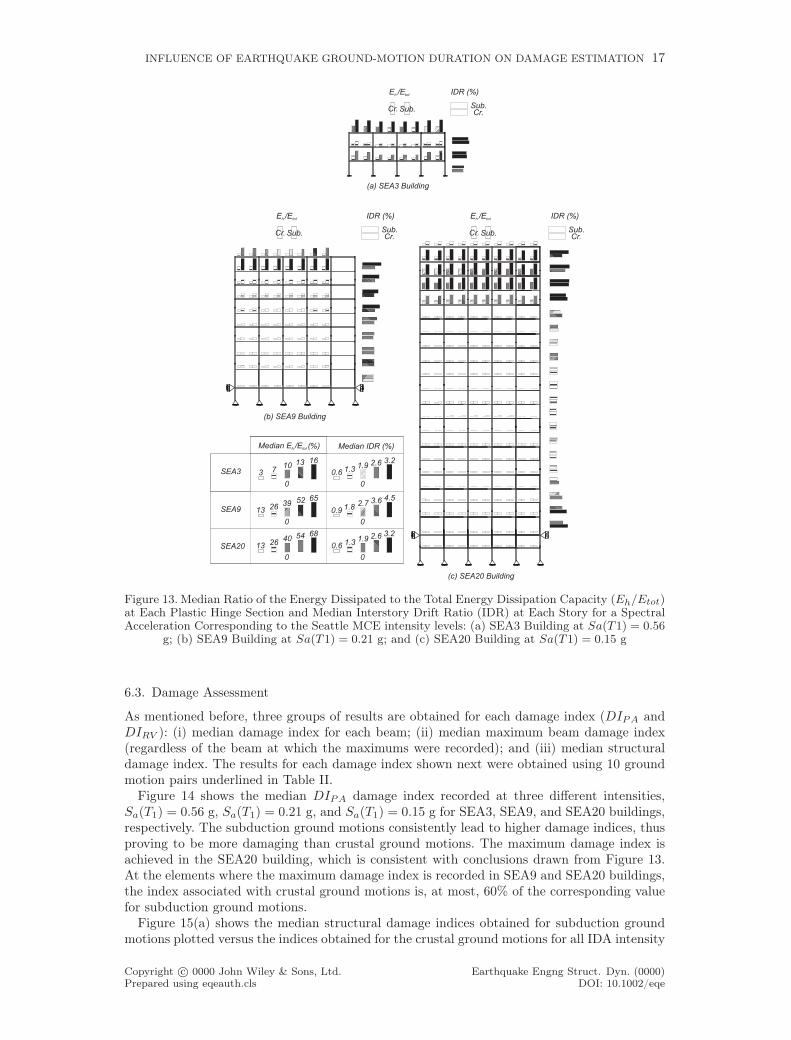
Figure 13 shows the median ratio between the energy dissipated (Eh) and the total energydissipation capacity (Etot) in each plastic hinge at floor levels for each building. Results areshown for Sa(T1) = 0.56g for the SEA3 building, forSa(T1) = 0.21g for the SEA9 building, andSa(T1) = 0.15g for the SEA20 building. These values correspond to the spectral acceleration atthe fundamental period of vibration of the buildings, based on Seattle MCE response spectrum.Note that an increase in the Eh/Etot ratio corresponds to a reduction in the residual structuralresistant capacity of the members. Figure 13 also shows the median interstory drift ratio (IDR)at each story for the same ground motion intensity levels, on the right side of each building.For the three buildings, it can be seen that the energy dissipated during subduction zoneground motions is significantly greater than that dissipated in shallow crustal ground motions,
Copyright c© 0000 John Wiley & Sons, Ltd. Earthquake Engng Struct. Dyn. (0000)Prepared using eqeauth.cls DOI: 10.1002/eqe
16 BARBOSA ET AL.
0 1 20
0 1 2 3 4 5 6 7 8 9 100
0.5
1
1.5
2
2.5
Peak Interstory Drift Ratio IDR (%)
Spectr
alA
ccele
ration S
a(T
1)
(g)
(a) SEA3 Building - Peak IDR
Median Crustal
Median Subduction
Crustal #6
Subduction #6
0 1 2 3 4 5 6 7 8 9 100
0.05
0.1
0.15
0.2
0.25
0.3
0.35
0.4
Peak Interstory Drift Ratio IDR (%)
Spectr
alA
ccele
ration S
a(T
1)
(g)
(b) SEA9 Building - Peak IDR
Median Crustal
Median Subduction
Crustal #8
Subduction #8
0 1 2 3 4 5 6 7 8 9 100
0.1
0.2
0.3
0.4
0.5
Peak Interstory Drift Ratio IDR (%)
Spectr
alA
ccele
ration S
a(T
1)
(g)
(c) SEA20 Building. - Peak IDR
Median Crustal
Median Subduction
Crustal #6
Subduction #6
0 1 2 3 4 5 6 7 8 9 100
0.05
0.1
0.15
0.2
0.25
0.3
0.35
0.4
0.45
0.5
Peak Residual Interstory Drift Ratio IDR (%)
Spectr
alA
ccele
ration S
a(T
1)
(g)
(d) SEA20 Building - Residual IDR
Median Crustal
Median Subduction
Crustal #6
Subduction #6
Figure 12. Incremental Dynamic Analysis: Capacity Curves Obtained Through of (a) SEA3 Building;(b) SEA9 Building; (c) SEA20 Building and (d) Residual Interstory Drift Ratio (RIDR) for SEA20
as a result of longer durations. In Figure 13(a), for the SEA3 building, the maximum ratiobetween the energy dissipated and the total energy dissipation capacity (Eh/Etot) is reachedat level 3, with a value of 16%. In Figure 13(b) it can be seen that building SEA9 is capableof redistributing deformations across a wide range of floors, where the peak ratios tend to besimilar at multiple floors. In this building, the maximum ratio Eh/Etot is 65%. Figure 13(c),for the SEA20, shows that the maximum energy dissipated in a plastic hinge is achieved inthe SEA20 building, where the energy dissipation is concentrated in the 18th and 19th floors.For this building, the maximum ratio Eh/Etot is 68%. For each ground motion type, a strongcorrelation between the energy dissipated at each floor and the interstory drift ratio is found.Building SEA20, in particular, presents a high concentration of energy dissipated in higherfloors, where peak interstory drift ratios are also recorded, thus showing that this building maybe more vulnerable after the earthquake. Possible reasons for the concentration of damage inhigher floors are: (1) contribution of higher modes, and (2) smaller cross-sections of the beamsin the upper two to three stories (see Figures 5c and 5d for building SEA9 and Figures 5eand 5f for building SEA20). It is worth noting, however, that even though a greater demand isexpected from the subduction events, the distribution of the demand over the building heightis similar for both groups of earthquakes.
In conclusion, at these levels of intensity, although subduction zone ground motions do notsignificantly influence peak interstory drift ratios, they impose a greater energy dissipationdemand, that can negatively impact the performance of the structures. This highlights theimportance of considering damage indices that account for the effect of energy dissipation.
Copyright c© 0000 John Wiley & Sons, Ltd. Earthquake Engng Struct. Dyn. (0000)Prepared using eqeauth.cls DOI: 10.1002/eqe
INFLUENCE OF EARTHQUAKE GROUND-MOTION DURATION ON DAMAGE ESTIMATION 17
(a) SEA3 Building
(b) SEA9 Building
(c) SEA20 Building.
Median E /E (%)h tot Median IDR (%)
6854402613
0
3.22.61.91.30.6
0
6552392613
0
4.53.62.71.80.9
0
16131073
0
3.22.61.91.30.6
0
SEA9
SEA20
E /Eh tot IDR (%)
Cr. Sub. Cr.Sub.
E /Eh tot IDR (%)
Cr. Sub. Cr.Sub.
E /Eh tot IDR (%)
Cr. Sub. Cr.Sub.
SEA3
Figure 13. Median Ratio of the Energy Dissipated to the Total Energy Dissipation Capacity (Eh/Etot)at Each Plastic Hinge Section and Median Interstory Drift Ratio (IDR) at Each Story for a SpectralAcceleration Corresponding to the Seattle MCE intensity levels: (a) SEA3 Building at Sa(T1) = 0.56
g; (b) SEA9 Building at Sa(T1) = 0.21 g; and (c) SEA20 Building at Sa(T1) = 0.15 g
6.3. Damage Assessment
As mentioned before, three groups of results are obtained for each damage index (DIPA andDIRV ): (i) median damage index for each beam; (ii) median maximum beam damage index(regardless of the beam at which the maximums were recorded); and (iii) median structuraldamage index. The results for each damage index shown next were obtained using 10 groundmotion pairs underlined in Table II.
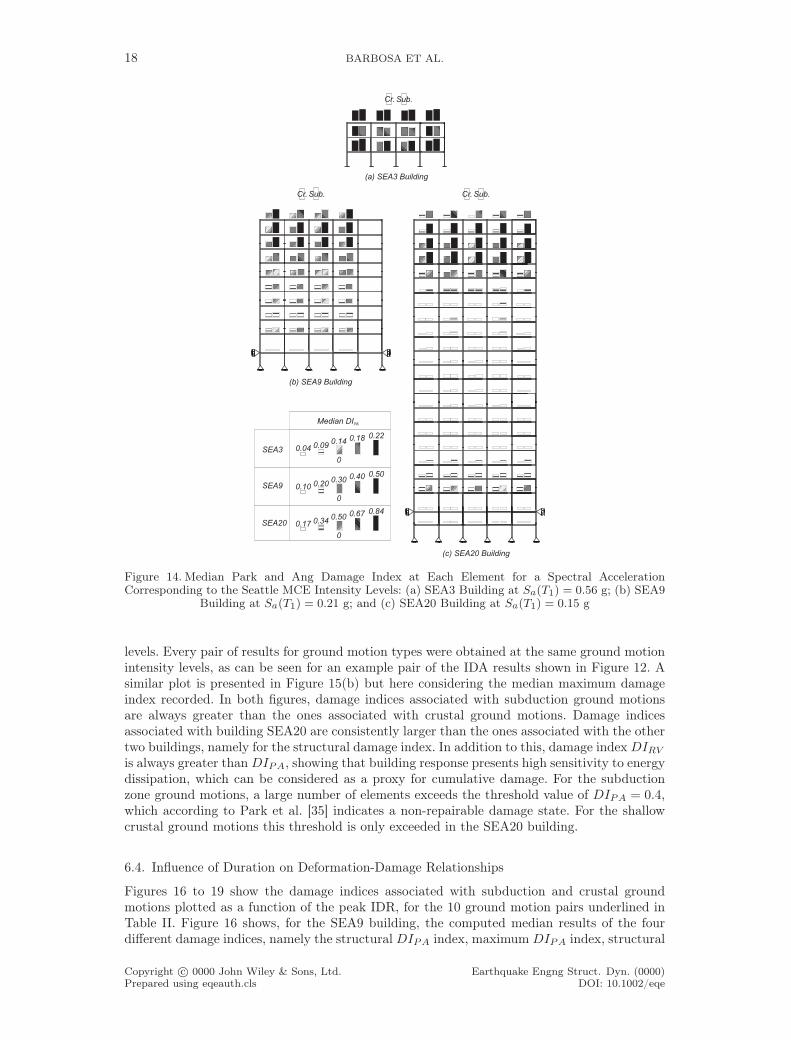
Figure 14 shows the median DIPA damage index recorded at three different intensities,Sa(T1) = 0.56 g, Sa(T1) = 0.21 g, and Sa(T1) = 0.15 g for SEA3, SEA9, and SEA20 buildings,respectively. The subduction ground motions consistently lead to higher damage indices, thusproving to be more damaging than crustal ground motions. The maximum damage index isachieved in the SEA20 building, which is consistent with conclusions drawn from Figure 13.At the elements where the maximum damage index is recorded in SEA9 and SEA20 buildings,the index associated with crustal ground motions is, at most, 60% of the corresponding valuefor subduction ground motions.
Figure 15(a) shows the median structural damage indices obtained for subduction groundmotions plotted versus the indices obtained for the crustal ground motions for all IDA intensity
Copyright c© 0000 John Wiley & Sons, Ltd. Earthquake Engng Struct. Dyn. (0000)Prepared using eqeauth.cls DOI: 10.1002/eqe
18 BARBOSA ET AL.
(a) SEA3 Building
(b) SEA9 Building
(c) SEA20 Building.
Median DIPA
0
0
0.220.180.140.090.04
0
SEA9
SEA20
0.500.400.300.200.10
0.840.670.500.340.17
Cr. Sub.
Cr. Sub. Cr. Sub.
SEA3
Figure 14. Median Park and Ang Damage Index at Each Element for a Spectral AccelerationCorresponding to the Seattle MCE Intensity Levels: (a) SEA3 Building at Sa(T1) = 0.56 g; (b) SEA9
Building at Sa(T1) = 0.21 g; and (c) SEA20 Building at Sa(T1) = 0.15 g
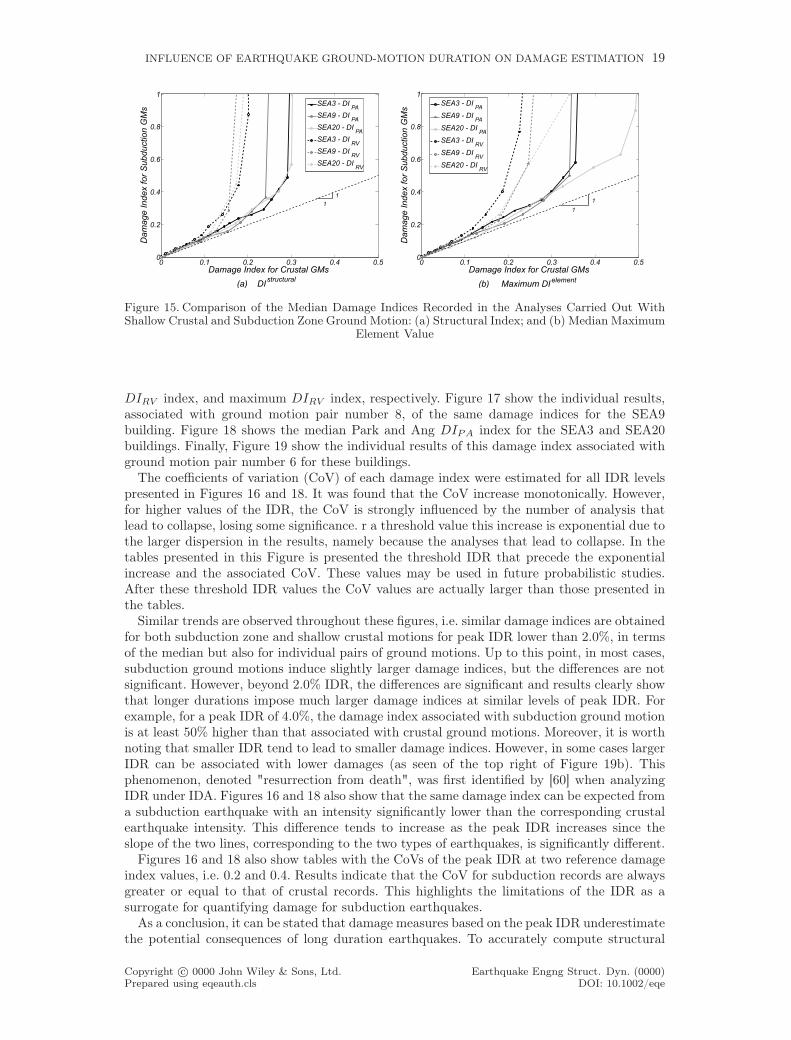
levels. Every pair of results for ground motion types were obtained at the same ground motionintensity levels, as can be seen for an example pair of the IDA results shown in Figure 12. Asimilar plot is presented in Figure 15(b) but here considering the median maximum damageindex recorded. In both figures, damage indices associated with subduction ground motionsare always greater than the ones associated with crustal ground motions. Damage indicesassociated with building SEA20 are consistently larger than the ones associated with the othertwo buildings, namely for the structural damage index. In addition to this, damage index DIRV
is always greater than DIPA, showing that building response presents high sensitivity to energydissipation, which can be considered as a proxy for cumulative damage. For the subductionzone ground motions, a large number of elements exceeds the threshold value of DIPA = 0.4,which according to Park et al. [35] indicates a non-repairable damage state. For the shallowcrustal ground motions this threshold is only exceeded in the SEA20 building.
6.4. Influence of Duration on Deformation-Damage Relationships
Figures 16 to 19 show the damage indices associated with subduction and crustal groundmotions plotted as a function of the peak IDR, for the 10 ground motion pairs underlined inTable II. Figure 16 shows, for the SEA9 building, the computed median results of the fourdifferent damage indices, namely the structural DIPA index, maximum DIPA index, structural
Copyright c© 0000 John Wiley & Sons, Ltd. Earthquake Engng Struct. Dyn. (0000)Prepared using eqeauth.cls DOI: 10.1002/eqe
INFLUENCE OF EARTHQUAKE GROUND-MOTION DURATION ON DAMAGE ESTIMATION 19
0 0.1 0.2 0.3 0.4 0.50
0.2
0.4
0.6
0.8
1
(a) DIstructural
Damage Index for Crustal GMs
Da
ma
ge
In
de
x f
or
Su
bd
uctio
n G
Ms
SEA3 - DIPA
SEA9 - DIPA
SEA20 - DIPA
SEA3 - DIRV
SEA9 - DIRV
SEA20 - DIRV
1
1
0 0.1 0.2 0.3 0.4 0.50
0.2
0.4
0.6
0.8
1
(b) Maximum DIelement
Damage Index for Crustal GMs
Da
ma
ge
In
de
x f
or
Su
bd
uctio
n G
Ms
SEA3 - DIPA
SEA9 - DIPA
SEA20 - DIPA
SEA3 - DIRV
SEA9 - DIRV
SEA20 - DIRV
1
1
Figure 15. Comparison of the Median Damage Indices Recorded in the Analyses Carried Out WithShallow Crustal and Subduction Zone Ground Motion: (a) Structural Index; and (b) Median Maximum
Element Value
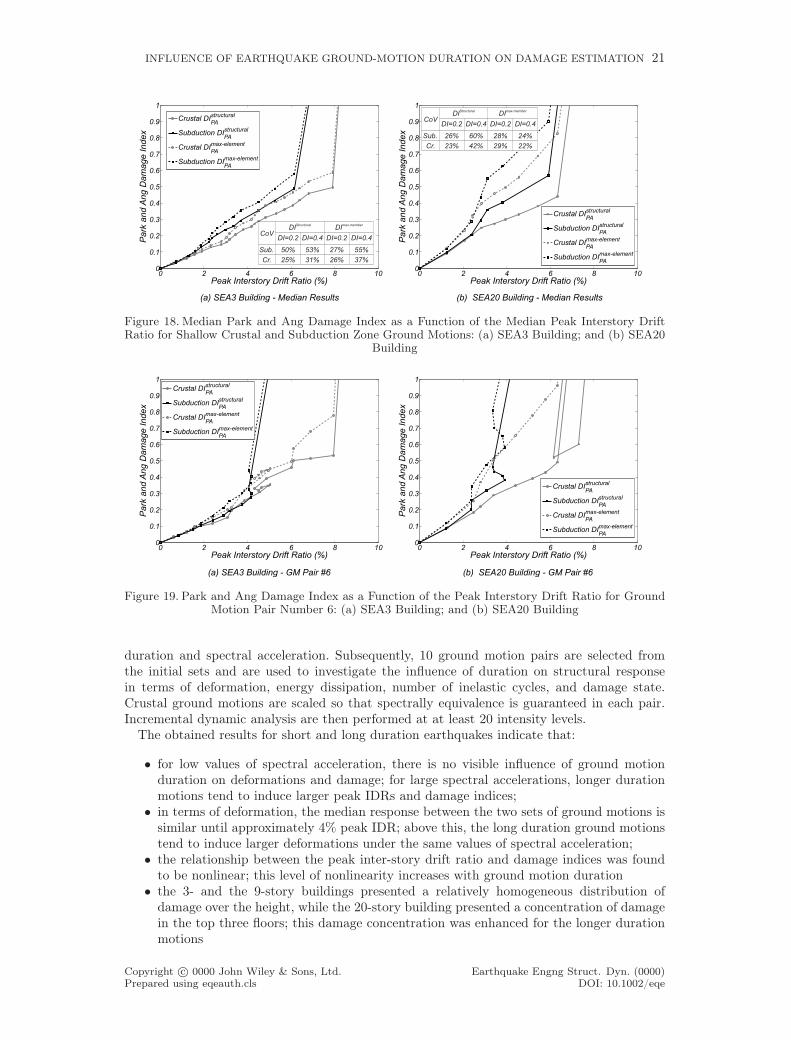
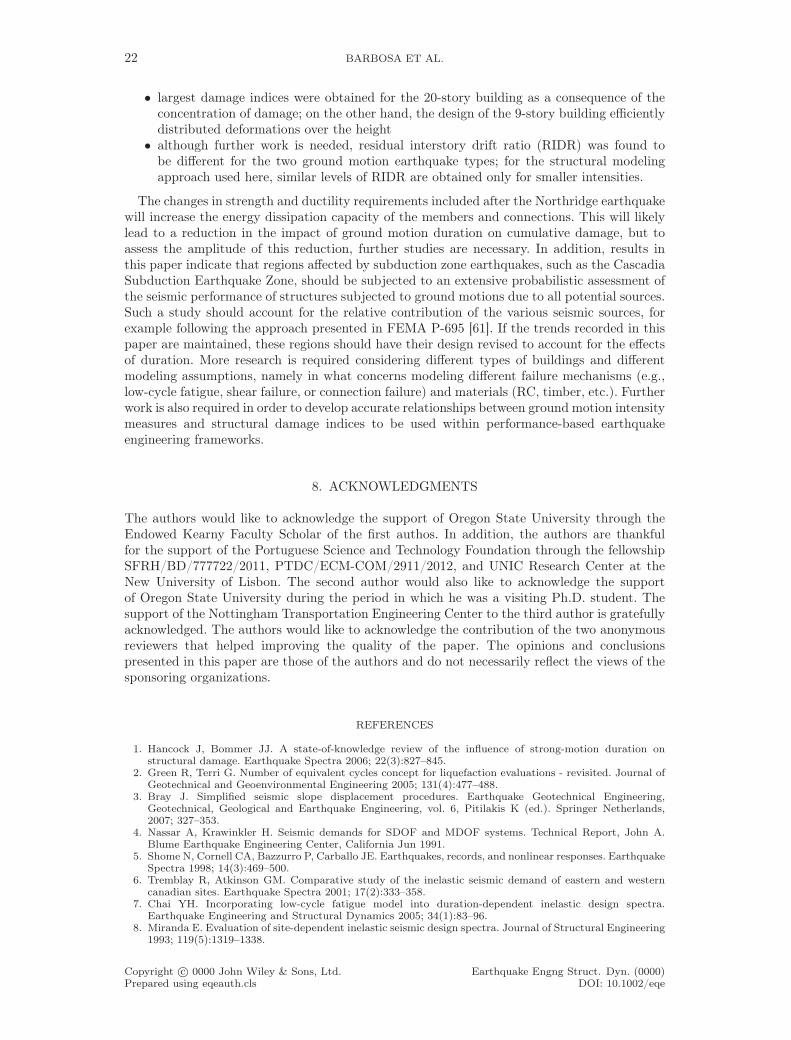
DIRV index, and maximum DIRV index, respectively. Figure 17 show the individual results,associated with ground motion pair number 8, of the same damage indices for the SEA9building. Figure 18 shows the median Park and Ang DIPA index for the SEA3 and SEA20buildings. Finally, Figure 19 show the individual results of this damage index associated withground motion pair number 6 for these buildings.
The coefficients of variation (CoV) of each damage index were estimated for all IDR levelspresented in Figures 16 and 18. It was found that the CoV increase monotonically. However,for higher values of the IDR, the CoV is strongly influenced by the number of analysis thatlead to collapse, losing some significance. r a threshold value this increase is exponential due tothe larger dispersion in the results, namely because the analyses that lead to collapse. In thetables presented in this Figure is presented the threshold IDR that precede the exponentialincrease and the associated CoV. These values may be used in future probabilistic studies.After these threshold IDR values the CoV values are actually larger than those presented inthe tables.
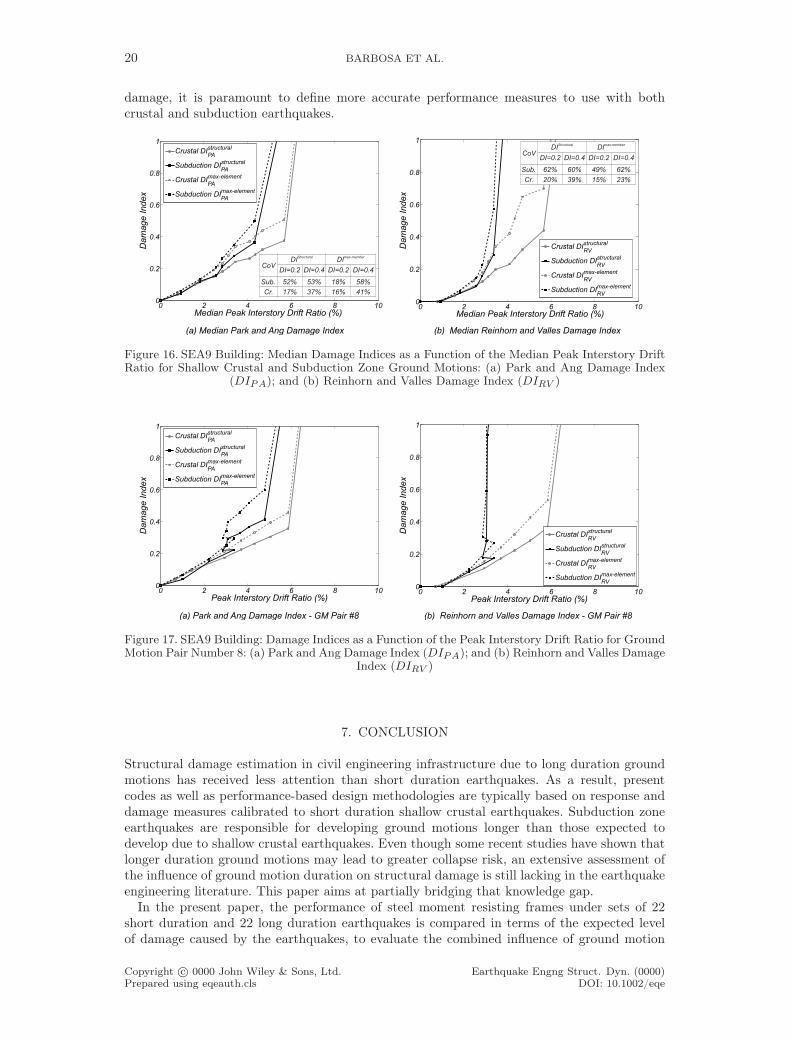
Similar trends are observed throughout these figures, i.e. similar damage indices are obtainedfor both subduction zone and shallow crustal motions for peak IDR lower than 2.0%, in termsof the median but also for individual pairs of ground motions. Up to this point, in most cases,subduction ground motions induce slightly larger damage indices, but the differences are notsignificant. However, beyond 2.0% IDR, the differences are significant and results clearly showthat longer durations impose much larger damage indices at similar levels of peak IDR. Forexample, for a peak IDR of 4.0%, the damage index associated with subduction ground motionis at least 50% higher than that associated with crustal ground motions. Moreover, it is worthnoting that smaller IDR tend to lead to smaller damage indices. However, in some cases largerIDR can be associated with lower damages (as seen of the top right of Figure 19b). Thisphenomenon, denoted "resurrection from death", was first identified by [60] when analyzingIDR under IDA. Figures 16 and 18 also show that the same damage index can be expected froma subduction earthquake with an intensity significantly lower than the corresponding crustalearthquake intensity. This difference tends to increase as the peak IDR increases since theslope of the two lines, corresponding to the two types of earthquakes, is significantly different.
Figures 16 and 18 also show tables with the CoVs of the peak IDR at two reference damageindex values, i.e. 0.2 and 0.4. Results indicate that the CoV for subduction records are alwaysgreater or equal to that of crustal records. This highlights the limitations of the IDR as asurrogate for quantifying damage for subduction earthquakes.
As a conclusion, it can be stated that damage measures based on the peak IDR underestimatethe potential consequences of long duration earthquakes. To accurately compute structural
Copyright c© 0000 John Wiley & Sons, Ltd. Earthquake Engng Struct. Dyn. (0000)Prepared using eqeauth.cls DOI: 10.1002/eqe
20 BARBOSA ET AL.
damage, it is paramount to define more accurate performance measures to use with bothcrustal and subduction earthquakes.
(a) Median Park and Ang Damage Index (b) Median Reinhorn and Valles Damage Index
0 2 4 6 8 100
0.2
0.4
0.6
0.8
1
Median Peak Interstory Drift Ratio (%)
Da
ma
ge
In
de
xCrustal DI
PA
structural
Subduction DIPA
structural
Crustal DIPA
max-element
Subduction DIPA
max-element
0 2 4 6 8 100
0.2
0.4
0.6
0.8
1
Median Peak Interstory Drift Ratio (%)
Da
ma
ge
In
de
x
Crustal DIRV
structural
Subduction DIRV
structural
Crustal DIRV
max-element
Subduction DIRV
max-element
CoVDI
StructuralDI
max-member
DI=0.2 DI=0.4 DI=0.2 DI=0.4
Sub. 52% 53% 18% 58%
Cr. 17% 37% 16% 41%
CoVDI
StructuralDI
max-member
DI=0.2 DI=0.4 DI=0.2 DI=0.4
Sub. 62% 60% 49% 62%
Cr. 20% 39% 15% 23%
Figure 16. SEA9 Building: Median Damage Indices as a Function of the Median Peak Interstory DriftRatio for Shallow Crustal and Subduction Zone Ground Motions: (a) Park and Ang Damage Index
(DIPA); and (b) Reinhorn and Valles Damage Index (DIRV )
0 2 4 6 8 100
0.2
0.4
0.6
0.8
1
Peak Interstory Drift Ratio (%)
Da
ma
ge
In
de
x
Crustal DIPA
structural
Subduction DIPA
structural
Crustal DIPA
max-element
Subduction DIPA
max-element
0 2 4 6 8 100
0.2
0.4
0.6
0.8
1
Peak Interstory Drift Ratio (%)
Da
ma
ge
In
de
x
Crustal DIRV
structural
Subduction DIRV
structural
Crustal DIRV
max-element
Subduction DIRV
max-element
(a) Park and Ang Damage Index - GM Pair #8 (b) Reinhorn and Valles Damage Index - GM Pair #8
Figure 17. SEA9 Building: Damage Indices as a Function of the Peak Interstory Drift Ratio for GroundMotion Pair Number 8: (a) Park and Ang Damage Index (DIPA); and (b) Reinhorn and Valles Damage
Index (DIRV )
7. CONCLUSION
Structural damage estimation in civil engineering infrastructure due to long duration groundmotions has received less attention than short duration earthquakes. As a result, presentcodes as well as performance-based design methodologies are typically based on response anddamage measures calibrated to short duration shallow crustal earthquakes. Subduction zoneearthquakes are responsible for developing ground motions longer than those expected todevelop due to shallow crustal earthquakes. Even though some recent studies have shown thatlonger duration ground motions may lead to greater collapse risk, an extensive assessment ofthe influence of ground motion duration on structural damage is still lacking in the earthquakeengineering literature. This paper aims at partially bridging that knowledge gap.
In the present paper, the performance of steel moment resisting frames under sets of 22short duration and 22 long duration earthquakes is compared in terms of the expected levelof damage caused by the earthquakes, to evaluate the combined influence of ground motion
Copyright c© 0000 John Wiley & Sons, Ltd. Earthquake Engng Struct. Dyn. (0000)Prepared using eqeauth.cls DOI: 10.1002/eqe
INFLUENCE OF EARTHQUAKE GROUND-MOTION DURATION ON DAMAGE ESTIMATION 21
(a) SEA3 Building - Median Results (b) SEA20 Building - Median Results
0 2 4 6 8 100
0.1
0.2
0.3
0.4
0.5
0.6
0.7
0.8
0.9
1
Peak Interstory Drift Ratio (%)
Pa
rk a
nd
An
g D
am
ag
e I
nd
ex
Crustal DIPA
structural
Subduction DIPA
structural
Crustal DIPA
max-element
Subduction DIPA
max-element
0 2 4 6 8 100
0.1
0.2
0.3
0.4
0.5
0.6
0.7
0.8
0.9
1
Peak Interstory Drift Ratio (%)
Pa
rk a
nd
An
g D
am
ag
e I
nd
ex
Crustal DIPA
structural
Subduction DIPA
structural
Crustal DIPA
max-element
Subduction DIPA
max-element
CoVDI
StructuralDI
max-member
DI=0.2 DI=0.4 DI=0.2 DI=0.4
Sub. 50% 53% 27% 55%
Cr. 25% 31% 26% 37%
CoVDI
StructuralDI
max-member
DI=0.2 DI=0.4 DI=0.2 DI=0.4
Sub. 26% 60% 28% 24%
Cr. 23% 42% 29% 22%
Figure 18. Median Park and Ang Damage Index as a Function of the Median Peak Interstory DriftRatio for Shallow Crustal and Subduction Zone Ground Motions: (a) SEA3 Building; and (b) SEA20
Building
(a) SEA3 Building - GM Pair #6 (b) -SEA20 Building GM Pair #6
0 2 4 6 8 100
0.1
0.2
0.3
0.4
0.5
0.6
0.7
0.8
0.9
1
Peak Interstory Drift Ratio (%)
Pa
rk a
nd
An
g D
am
ag
e I
nd
ex
Crustal DIPA
structural
Subduction DIPA
structural
Crustal DIPA
max-element
Subduction DIPA
max-element
0 2 4 6 8 100
0.1
0.2
0.3
0.4
0.5
0.6
0.7
0.8
0.9
1
Peak Interstory Drift Ratio (%)
Pa
rk a
nd
An
g D
am
ag
e I
nd
ex
Crustal DIPA
structural
Subduction DIPA
structural
Crustal DIPA
max-element
Subduction DIPA
max-element
Figure 19. Park and Ang Damage Index as a Function of the Peak Interstory Drift Ratio for GroundMotion Pair Number 6: (a) SEA3 Building; and (b) SEA20 Building
duration and spectral acceleration. Subsequently, 10 ground motion pairs are selected fromthe initial sets and are used to investigate the influence of duration on structural responsein terms of deformation, energy dissipation, number of inelastic cycles, and damage state.Crustal ground motions are scaled so that spectrally equivalence is guaranteed in each pair.Incremental dynamic analysis are then performed at at least 20 intensity levels.
The obtained results for short and long duration earthquakes indicate that:
• for low values of spectral acceleration, there is no visible influence of ground motionduration on deformations and damage; for large spectral accelerations, longer durationmotions tend to induce larger peak IDRs and damage indices;
• in terms of deformation, the median response between the two sets of ground motions issimilar until approximately 4% peak IDR; above this, the long duration ground motionstend to induce larger deformations under the same values of spectral acceleration;
• the relationship between the peak inter-story drift ratio and damage indices was foundto be nonlinear; this level of nonlinearity increases with ground motion duration
• the 3- and the 9-story buildings presented a relatively homogeneous distribution ofdamage over the height, while the 20-story building presented a concentration of damagein the top three floors; this damage concentration was enhanced for the longer durationmotions
Copyright c© 0000 John Wiley & Sons, Ltd. Earthquake Engng Struct. Dyn. (0000)Prepared using eqeauth.cls DOI: 10.1002/eqe
22 BARBOSA ET AL.
• largest damage indices were obtained for the 20-story building as a consequence of theconcentration of damage; on the other hand, the design of the 9-story building efficientlydistributed deformations over the height
• although further work is needed, residual interstory drift ratio (RIDR) was found tobe different for the two ground motion earthquake types; for the structural modelingapproach used here, similar levels of RIDR are obtained only for smaller intensities.
The changes in strength and ductility requirements included after the Northridge earthquakewill increase the energy dissipation capacity of the members and connections. This will likelylead to a reduction in the impact of ground motion duration on cumulative damage, but toassess the amplitude of this reduction, further studies are necessary. In addition, results inthis paper indicate that regions affected by subduction zone earthquakes, such as the CascadiaSubduction Earthquake Zone, should be subjected to an extensive probabilistic assessment ofthe seismic performance of structures subjected to ground motions due to all potential sources.Such a study should account for the relative contribution of the various seismic sources, forexample following the approach presented in FEMA P-695 [61]. If the trends recorded in thispaper are maintained, these regions should have their design revised to account for the effectsof duration. More research is required considering different types of buildings and differentmodeling assumptions, namely in what concerns modeling different failure mechanisms (e.g.,low-cycle fatigue, shear failure, or connection failure) and materials (RC, timber, etc.). Furtherwork is also required in order to develop accurate relationships between ground motion intensitymeasures and structural damage indices to be used within performance-based earthquakeengineering frameworks.
8. ACKNOWLEDGMENTS
The authors would like to acknowledge the support of Oregon State University through theEndowed Kearny Faculty Scholar of the first authos. In addition, the authors are thankfulfor the support of the Portuguese Science and Technology Foundation through the fellowshipSFRH/BD/777722/2011, PTDC/ECM-COM/2911/2012, and UNIC Research Center at theNew University of Lisbon. The second author would also like to acknowledge the supportof Oregon State University during the period in which he was a visiting Ph.D. student. Thesupport of the Nottingham Transportation Engineering Center to the third author is gratefullyacknowledged. The authors would like to acknowledge the contribution of the two anonymousreviewers that helped improving the quality of the paper. The opinions and conclusionspresented in this paper are those of the authors and do not necessarily reflect the views of thesponsoring organizations.
REFERENCES
1. Hancock J, Bommer JJ. A state-of-knowledge review of the influence of strong-motion duration onstructural damage. Earthquake Spectra 2006; 22(3):827–845.
2. Green R, Terri G. Number of equivalent cycles concept for liquefaction evaluations - revisited. Journal ofGeotechnical and Geoenvironmental Engineering 2005; 131(4):477–488.
3. Bray J. Simplified seismic slope displacement procedures. Earthquake Geotechnical Engineering,Geotechnical, Geological and Earthquake Engineering, vol. 6, Pitilakis K (ed.). Springer Netherlands,2007; 327–353.
4. Nassar A, Krawinkler H. Seismic demands for SDOF and MDOF systems. Technical Report, John A.Blume Earthquake Engineering Center, California Jun 1991.
5. Shome N, Cornell CA, Bazzurro P, Carballo JE. Earthquakes, records, and nonlinear responses. EarthquakeSpectra 1998; 14(3):469–500.
6. Tremblay R, Atkinson GM. Comparative study of the inelastic seismic demand of eastern and westerncanadian sites. Earthquake Spectra 2001; 17(2):333–358.
7. Chai YH. Incorporating low-cycle fatigue model into duration-dependent inelastic design spectra.Earthquake Engineering and Structural Dynamics 2005; 34(1):83–96.
8. Miranda E. Evaluation of site-dependent inelastic seismic design spectra. Journal of Structural Engineering1993; 119(5):1319–1338.
Copyright c© 0000 John Wiley & Sons, Ltd. Earthquake Engng Struct. Dyn. (0000)Prepared using eqeauth.cls DOI: 10.1002/eqe
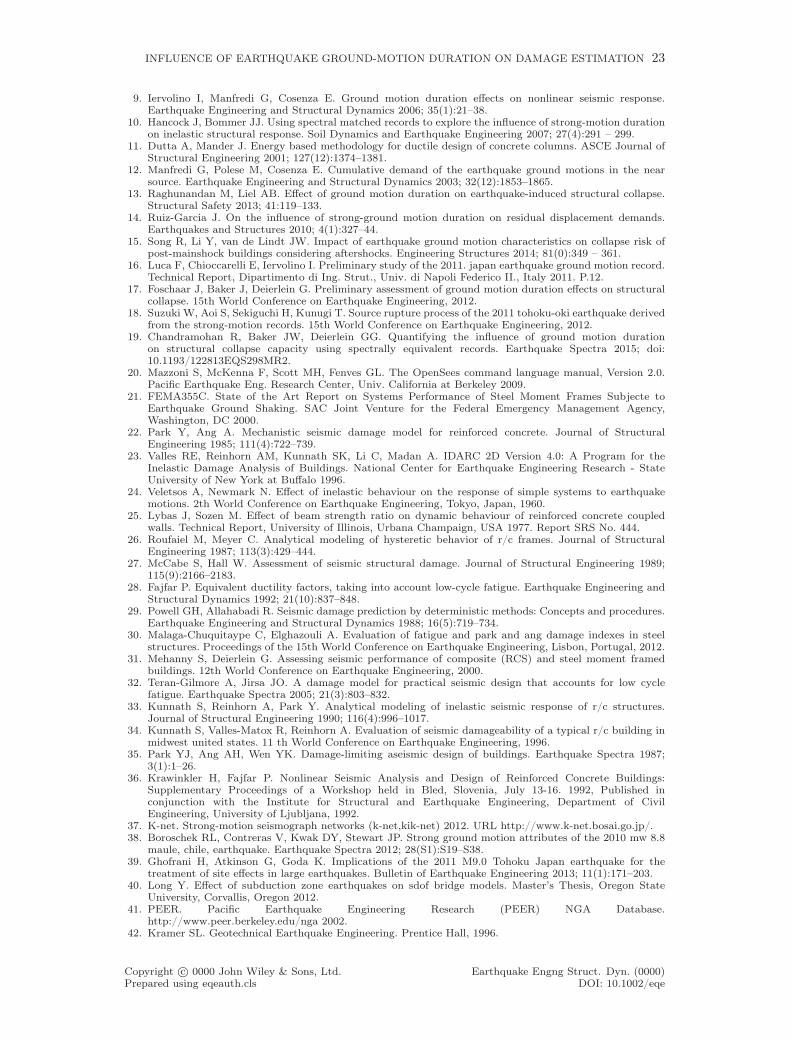
INFLUENCE OF EARTHQUAKE GROUND-MOTION DURATION ON DAMAGE ESTIMATION 23
9. Iervolino I, Manfredi G, Cosenza E. Ground motion duration effects on nonlinear seismic response.Earthquake Engineering and Structural Dynamics 2006; 35(1):21–38.
10. Hancock J, Bommer JJ. Using spectral matched records to explore the influence of strong-motion durationon inelastic structural response. Soil Dynamics and Earthquake Engineering 2007; 27(4):291 – 299.
11. Dutta A, Mander J. Energy based methodology for ductile design of concrete columns. ASCE Journal ofStructural Engineering 2001; 127(12):1374–1381.
12. Manfredi G, Polese M, Cosenza E. Cumulative demand of the earthquake ground motions in the nearsource. Earthquake Engineering and Structural Dynamics 2003; 32(12):1853–1865.
13. Raghunandan M, Liel AB. Effect of ground motion duration on earthquake-induced structural collapse.Structural Safety 2013; 41:119–133.
14. Ruiz-Garcia J. On the influence of strong-ground motion duration on residual displacement demands.Earthquakes and Structures 2010; 4(1):327–44.
15. Song R, Li Y, van de Lindt JW. Impact of earthquake ground motion characteristics on collapse risk ofpost-mainshock buildings considering aftershocks. Engineering Structures 2014; 81(0):349 – 361.
16. Luca F, Chioccarelli E, Iervolino I. Preliminary study of the 2011. japan earthquake ground motion record.Technical Report, Dipartimento di Ing. Strut., Univ. di Napoli Federico II., Italy 2011. P.12.
17. Foschaar J, Baker J, Deierlein G. Preliminary assessment of ground motion duration effects on structuralcollapse. 15th World Conference on Earthquake Engineering, 2012.
18. Suzuki W, Aoi S, Sekiguchi H, Kunugi T. Source rupture process of the 2011 tohoku-oki earthquake derivedfrom the strong-motion records. 15th World Conference on Earthquake Engineering, 2012.
19. Chandramohan R, Baker JW, Deierlein GG. Quantifying the influence of ground motion durationon structural collapse capacity using spectrally equivalent records. Earthquake Spectra 2015; doi:10.1193/122813EQS298MR2.
20. Mazzoni S, McKenna F, Scott MH, Fenves GL. The OpenSees command language manual, Version 2.0.Pacific Earthquake Eng. Research Center, Univ. California at Berkeley 2009.
21. FEMA355C. State of the Art Report on Systems Performance of Steel Moment Frames Subjecte toEarthquake Ground Shaking. SAC Joint Venture for the Federal Emergency Management Agency,Washington, DC 2000.
22. Park Y, Ang A. Mechanistic seismic damage model for reinforced concrete. Journal of StructuralEngineering 1985; 111(4):722–739.
23. Valles RE, Reinhorn AM, Kunnath SK, Li C, Madan A. IDARC 2D Version 4.0: A Program for theInelastic Damage Analysis of Buildings. National Center for Earthquake Engineering Research - StateUniversity of New York at Buffalo 1996.
24. Veletsos A, Newmark N. Effect of inelastic behaviour on the response of simple systems to earthquakemotions. 2th World Conference on Earthquake Engineering, Tokyo, Japan, 1960.
25. Lybas J, Sozen M. Effect of beam strength ratio on dynamic behaviour of reinforced concrete coupledwalls. Technical Report, University of Illinois, Urbana Champaign, USA 1977. Report SRS No. 444.
26. Roufaiel M, Meyer C. Analytical modeling of hysteretic behavior of r/c frames. Journal of StructuralEngineering 1987; 113(3):429–444.
27. McCabe S, Hall W. Assessment of seismic structural damage. Journal of Structural Engineering 1989;115(9):2166–2183.
28. Fajfar P. Equivalent ductility factors, taking into account low-cycle fatigue. Earthquake Engineering andStructural Dynamics 1992; 21(10):837–848.
29. Powell GH, Allahabadi R. Seismic damage prediction by deterministic methods: Concepts and procedures.Earthquake Engineering and Structural Dynamics 1988; 16(5):719–734.
30. Malaga-Chuquitaype C, Elghazouli A. Evaluation of fatigue and park and ang damage indexes in steelstructures. Proceedings of the 15th World Conference on Earthquake Engineering, Lisbon, Portugal, 2012.
31. Mehanny S, Deierlein G. Assessing seismic performance of composite (RCS) and steel moment framedbuildings. 12th World Conference on Earthquake Engineering, 2000.
32. Teran-Gilmore A, Jirsa JO. A damage model for practical seismic design that accounts for low cyclefatigue. Earthquake Spectra 2005; 21(3):803–832.
33. Kunnath S, Reinhorn A, Park Y. Analytical modeling of inelastic seismic response of r/c structures.Journal of Structural Engineering 1990; 116(4):996–1017.
34. Kunnath S, Valles-Matox R, Reinhorn A. Evaluation of seismic damageability of a typical r/c building inmidwest united states. 11 th World Conference on Earthquake Engineering, 1996.
35. Park YJ, Ang AH, Wen YK. Damage-limiting aseismic design of buildings. Earthquake Spectra 1987;3(1):1–26.
36. Krawinkler H, Fajfar P. Nonlinear Seismic Analysis and Design of Reinforced Concrete Buildings:Supplementary Proceedings of a Workshop held in Bled, Slovenia, July 13-16. 1992, Published inconjunction with the Institute for Structural and Earthquake Engineering, Department of CivilEngineering, University of Ljubljana, 1992.
37. K-net. Strong-motion seismograph networks (k-net,kik-net) 2012. URL http://www.k-net.bosai.go.jp/.38. Boroschek RL, Contreras V, Kwak DY, Stewart JP. Strong ground motion attributes of the 2010 mw 8.8
maule, chile, earthquake. Earthquake Spectra 2012; 28(S1):S19–S38.39. Ghofrani H, Atkinson G, Goda K. Implications of the 2011 M9.0 Tohoku Japan earthquake for the
treatment of site effects in large earthquakes. Bulletin of Earthquake Engineering 2013; 11(1):171–203.40. Long Y. Effect of subduction zone earthquakes on sdof bridge models. Master’s Thesis, Oregon State
University, Corvallis, Oregon 2012.41. PEER. Pacific Earthquake Engineering Research (PEER) NGA Database.
http://www.peer.berkeley.edu/nga 2002.42. Kramer SL. Geotechnical Earthquake Engineering. Prentice Hall, 1996.
Copyright c© 0000 John Wiley & Sons, Ltd. Earthquake Engng Struct. Dyn. (0000)Prepared using eqeauth.cls DOI: 10.1002/eqe
24 BARBOSA ET AL.
43. UBC. Structural Engineering Design Provisions, Uniform Building Code, Vol. 2. International Conferenceof Building Officials 1994.
44. Gupta A, Krawinkler H. Seismic demands for performance evaluation of steel moment resisting framestructures. Technical Report 132, The John A. Blume Earthquake Engineering Center 1999.
45. Ribeiro F, Barbosa A, Neves L. Application of reliability-based robustness assessment of steel momentresisting frame structures under post-mainshock cascading events. ASCE Journal of Structural Engineering2014; -(140, SPECIAL ISSUE: Computational Simulation in Structural Engineering, A4014008).
46. Ribeiro F, Neves L, Barbosa A. Implementation and calibration of finite-length plastic hinge elements foruse in seismic structural collapse analysis. Journal of Earthquake Engineering 2015; doi:In Press.
47. Barbosa A, Ribeiro F, Neves L. Effects of subduction zone earthquake motions on a 9-story SAC steelmoment resisting frame. 10th National Conference on Earthquake Engineering, 2014.
48. Scott MH, Fenves GL. Plastic hinge integration methods for force-based beam-column elements. ASCEJournal of Structural Engineering 2006; 132(2):244–252.
49. Ribeiro F, Barbosa A, Scott M, Neves L. Deterioration modeling of steel moment resisting framesusing finite-length plastic hinge force-based beam-column elements. Journal of Structural Engineering0; 141(2):04014 112.
50. Ibarra LF, Krawinkler H. Global collapse of frame structures under seismic excitations. Technical Report152, The John A. Blume Earthquake Engineering Research Center, Department of Civil Engineering,Stanford University, Stanford, CA 2005.
51. Lignos DG, Krawinkler H. Deterioration modeling of steel components in support of collapse predictionof steel moment frames under earthquake loading. ASCE Journal of Structural Engineering 2011;137(11):1291–1302.
52. Rahnama M, Krawinkler H. Effects of soft soil and hysteresis model on seismic demands. John A. BlumeEarthquake Engineering Center Report 1993; -(108).
53. Scott M, Ryan K. Moment-rotation behavior of force-based plastic hinge elements. Earthquake Spectra2013; 29(1).
54. Lignos D, Krawinkler H. Development and utilization of structural component databases forperformance-based earthquake engineering. ASCE Journal of Structural Engineering 2012; doi:10.1061/(ASCE)ST.1943-541X.0000646.
55. Lignos DG, Chung Y, Nagae T, Nakashima M. Numerical and experimental evaluation of seismic capacityof high-rise steel buildings subjected to long duration earthquakes. Comput. Struct. 2011; 89(11-12):959–967.
56. Prakash V, Powell G, Campbell S. Drain-2dx base program description and user guide, version 1.0.Technical Report, Engineering Mechanics and Material, Department of Civil Engineering, University ofCalifornia, Berkeley, CA 1993. Report No. UCB/SEMM-93/17 and 18.
57. Teran-Gilmore A. Performance-based earthquake-resistant design of framed buildings using energyconcepts. PhD Thesis, University of California at Berkeley 1996.
58. Baker JW, Allin Cornell C. A vector-valued ground motion intensity measure consisting of spectralacceleration and epsilon. Earthquake Engineering and Structural Dynamics 2005; 34(10):1193–1217.
59. Tirca L, Chen L, Tremblay R. Assessing collapse safety of cbf buildings subjected to crustal and subductionearthquakes. Journal of Constructional Steel Research 2015; 115(1):47–61.
60. Vamvatsikos D, Cornell C. Incremental dynamic analysis. Earthquake Engineering and StructuralDynamics 2002; 31(3):491–514.
61. FEMA-P-695. Quantification of Building Seismic Performance Factors. ATC - Applied Technology Council2009.
Copyright c© 0000 John Wiley & Sons, Ltd. Earthquake Engng Struct. Dyn. (0000)Prepared using eqeauth.cls DOI: 10.1002/eqe
Top Related
Copyright © 2022 FDOKUMEN

