

Bahasa
Halaman
Hukum

How Regulatory CD25�CD4� T Cells Impinge on TumorImmunobiology: The Differential Response of Tumors toTherapies
Kalet Leon,1*† Karina Garcia,* Jorge Carneiro,† and Agustin Lage*
Aiming to get a better insight on the impact of regulatory CD25�CD4� T cells in tumor-immunobiology, a simple mathematicalmodel was previously formulated and studied. This model predicts the existence of two alternative modes of uncontrolled tumorgrowth, which differ on their coupling with the immune system, providing a plausible explanation to the observation that thedevelopment of some tumors expand regulatory T cells whereas others do not. We report now the study of how these two tumorclasses respond to different therapies, namely vaccination, immune suppression, surgery, and their different combinations. Weshow 1) how the timing and the dose applied in each particular treatment determine whether the tumor will be rejected, with orwithout concomitant autoimmunity, or whether it will continue progressing with slower or faster pace; 2) that both regulatory Tcell-dependent and independent tumors are equally sensitive to vaccination, although the former are more sensitive to T celldepletion treatments and are unresponsive to partial surgery alone; 3) that surgery, suppression, and vaccination treatments, cansynergistically improve their individual effects, when properly combined. Particularly, we predict rational combinations helpingto overcome the limitation of these individual treatments on the late stage of tumor development. The Journal of Immunology,2007, 179: 5659–5668.
R egulatory T (TR)2 cells, which are contained within theCD4�CD25� pool and actively suppress the activity ofother cells, are important factors for the immunobiology
of some tumors (1–3). Depletion of these cells with mAbs (4, 5)leads to rejection of some transplantable syngenic tumors; TR cellsaccumulate inside tumors or their adjacent lymph nodes, correlat-ing with disease progression (6–12); and moreover, vaccinationwith tumor associated Ags can induce the expansion ofCD4�CD25� TR cells accelerating tumor progression (13–16).Based on these observations TR cells promise a better understand-ing and management of tumors though there are still many openquestions. Particularly, it is quite alarming that the enrolment of TR
cells in tumor development could entail negative effects rather thanclinical benefits to patients, in response to classical treatments,such as vaccines.
In a previous work (17), we studied the tumor-immune systemdynamics in the presence of effector T (TE) cells that can poten-tially reject or induce the rejection of the tumor, and TR cells, byformulating a simple mathematical model for the interaction be-tween a solid tumor and the lymphocytes on its adjacent lymphnode. This model predicts that tumors could grow uncontrolled intwo alternative modes differing on whether or not they involve TR
cells expansion, denoted GR� or GR�, respectively. Tumorscharacterized by high specific growth rates, low immunogenicityand relative resistance to TE cell-dependent destructive functions
were predicted to induce the expansion of tumor-specific TE cellsthat competitively exclude TR cells. Tumors showing a slow spe-cific growth rate, that are immunogenic, and/or that are highlysensitive to T cell effector function were predicted to sustain TR
cells that control TE cell expansion. These results provide a naturalinterpretation for the observation that tumors are heterogeneous inrespect to the selective expansion and role of TR cells in transgenicmice models (18). This tumor heterogeneity regarding regulatory Tcell function is also observed in humans if one considers the en-semble of reports. Although in some cases the development of thetumor seems to be associated with the concomitant expansion ofFoxp3� TR cells (7, 12, 19) in other cases, the bad prognosis, isdissociated from regulatory cells activity (20–23). Although it isnot unequivocal, at first sight the latter tumors could be interpretedas tumors progressing irrespective of TR cells.
Furthermore, the latter theoretical results raised the intriguingpossibility that the two classes of tumors may be susceptible todifferent immunotherapeutic strategies. In this work we directlyaddress this possibility, exploring in our mathematical model thedifferential response of TR cell-independent (GR�) tumors and TR
cell-dependent (GR�) tumors to different therapies. We simulatedthe responses of these tumors to vaccination, immune suppression,surgery, or different combinations of these therapies. Our resultspredict plausible strategies for the differential treatment of thesetumors, providing clues for the rational design of more effectivetherapies.
Materials and MethodsMathematical model
The mathematical model of tumor-immune system dynamics was devel-oped in detail elsewhere (17). The following subsection briefly describesthe main postulates and assumptions of this model, relegating for AppendixA the presentation of the model equations and parameter values.
Model structure in two spatial compartments
The model contemplates two spatial compartments (Fig. 1), representing,respectively, the solid tumor (T) and its adjacent lymph node (LN). Both
*Centro de Inmunologıa Molecular, Havana, Cuba; and †Instituto Gulbenkian deCiencia, Oeiras, Portugal
Received for publication March 1, 2007. Accepted for publication August 7, 2007.
The costs of publication of this article were defrayed in part by the payment of pagecharges. This article must therefore be hereby marked advertisement in accordancewith 18 U.S.C. Section 1734 solely to indicate this fact.1 Address correspondence and reprint requests to Dr. Kalet Leon, Instituto Gulben-kian de Ciencia, Rua da Quinta Grande, no 6, Apartado 14, Oeiras, Portugal. E-mailaddress: [email protected] and [email protected] Abbreviations used in this paper: TR cells, regulatory T cells; TE, effector T cells;LN, lymph node.
The Journal of Immunology
www.jimmunol.org
compartments have a variable volume that is proportional to the number ofTR cells, TE cells, APCs, and, in the case of the tumor compartment, thetumor cells they contain at any given time. These two compartments arecoupled via cell migration. APCs presenting tumor determinants are acti-vated in the tumor and migrate to the LN. A fraction of the TE and TR cellsactivated at the lymph node migrate to the tumor compartment, whereassome tumor-infiltrating T cells migrate back to the lymph node. Cell mi-gration between these compartments is assumed to be fast, reaching a qua-si-steady-state equilibrium rapidly. (Note that this approximation does notpreclude TR and TE cells to differentially accumulate inside the tumorburden, it only implies fast migration and equilibrium. The model could beeasily set to get at equilibrium, for instance, the TR cells being preferen-tially accumulated in the tumor site, just as experimentally reported forsome tumors.)
Dynamics at the lymph node compartment
The LN compartment contains TE cells, TR cells, and APCs measured,respectively, as E, R, and A. Both T cell subpopulations recognize thetumor-related self-Ags that are presented by the APCs. Conjugation anddeconjugation of TE and TR cells with the APC antigenic sites are assumedto be fast processes that are in quasi-steady-state equilibrium. Activation ofboth TE and TR cells to perform functions and to progress through the cellcycle is assumed to require interactions with cognate APCs, and furtherdepends on interactions these T cell types make with each other (Fig. 1).Particularly, TE and TR cells are assumed to interact indirectly by compe-tition for access to cognate APCs and more directly by molecular processesthat require their colocalization in the physical domains in the vicinity ofthese cognate APCs (inside an APC foci, see Ref. 24). We assume here forsimplicity that each of these physical domains is composed of a cluster ofspatially close APCs, collectively containing a constant number of inde-pendent and equivalent sites s for T cell conjugation and interactions.
The total number of APC clusters in the LN compartment is assumed toincrease with tumors size, saturating asymptotically on a maximal valuegiven by parameter AM, i.e., the larger the tumor size the larger the numberof APC clusters presenting tumor-related Ags, but when the tumor be-comes too large the Ag presentation levels reach a plateau. Inside eachAPC cluster the following interactions are considered (Fig. 1): TE cells getactivated and proliferate following productive interactions with the APC,but such proliferation is completely inhibited/suppressed if at least one TR
cells gets activated inside the same cluster. In contrast TR cells get acti-vated and proliferate depending on interactions with both APCs and TE
cells colocalized in the same cluster. Upon activation, a fraction of both TE
and TR cells migrate to the tumor compartment, and some of them canrecycle back into the LN compartment.
Dynamics in the tumor compartment
The tumor compartment (Fig. 1) contains tumors cells, and infiltrating TE
and TR cells, measured, respectively, as TU, ET, and RT. The number of TE
and TR cells in the tumor increases due to migration of activated lympho-cytes from the LN and decreases due to cell death or migration back to theLN. The number of tumor cells TU is assumed to increase with a charac-teristic proliferation rate, to decrease as cells die by nonimmune processes,and to be killed by immune effector functions, depending on the proportionof infiltrating TE and TR cells. TR cells are assumed to inhibit/suppresslocally the TE cell-dependent killing of tumor cells.
ResultsTwo modes of uncontrolled tumor growth in the absence oftherapy
As described before (17), simulations of the progression of aninitially very small tumor in the absence of any treatment leads tothree scenarios. The tumor can grow uncontrolled (Fig. 2), it canreach a stable equilibrium size; or it can be eliminated by theimmune response it triggers (data not shown). The simulation re-sults depend on the parameter values controlling tumor properties.Namely, the tumor-specific growth rate, the sensitivity of tumor
FIGURE 1. Basic interactions in the model. Two compartments in-cluded tumor site and adjacent lymph node, plus cell migration betweenthem. At the lymph node, a, TE (H)and TR (I) cells not conjugated toAPCs die with a constant death rate. b–d, TE and TR cells conjugated toAPCs (symbol 1) interact between them, if conjugated to APCs which arespatially close to each other (i.e., inside the same APC foci/cluster). b),APCs foci containing only TE cells result in proliferation of this T cells; c,APCs foci containing mixtures of TE and TR cells result in the inhibitionof TE cell activation and the proliferation of the TR cells. TR cells areassumed to response to a local growth factor produced by the TE cells. d,Foci containing only R cells do not lead to the proliferation of these T cells.At the tumor site, e, tumor cells (symbol 2) divide continuously; f, TE cellsinduce tumor cells death, which might be inhibited (g) by the presence ofTR cells in their local neighborhood.
FIGURE 2. Sample kinetic outcomes obtained inthe model numerical simulation for the growth of aspontaneous tumor in an immune-competent individ-ual. The panels show typical change over time of thenumber tumor cells (Tu), Effector (E) and regulatory(R) T cells obtained on numerical integration ofmodel equations. Specific parameter values used onthese simulations are provided on Appendix A. a)Typical grow of GR� tumors, inducing the prefer-ential expansion of Effector T cells. b) Typical growof GR� tumors, inducing a balanced expansion ofboth Effector and Regulatory T cells, where the lattercontinuously prevent tumor cell destruction by theEffector immune T cells. Vertical doted lines delim-ited the three dynamics phases (I-II-II) of tumor im-mune system interaction described on the main text.
5660 IMPLICATIONS OF REGULATORY T CELLS FOR THE DESIGN OF CANCER THERAPIES
cells to the immune effector functions, and the tumor immunoge-nicity, defined as the intrinsic capacity of the tumor to induce thepresentation of its Ags by the APCs in the adjacent LN.
For the purposes of studying cancer therapy we are interested inthe simulations where tumors grow uncontrolled, which is pre-dicted to happen in two modes depending on the engagement ofregulatory T cells during the immune response (Fig. 2). In theGR� mode, TE cells predominate early on in the response to thetumor and eventually outcompete TR cells from the LN, althoughthe tumor overgrowth this spontaneous immune reaction. In theGR� mode, the tumor induces a balanced expansion of both TE
and TR cells, and the latter continuously prevent tumor cell de-struction by the former in the tumor compartment (Fig. 2b). Themodel predicts that tumors that grow fast, are poorly immuno-genic, and are resistant to T cell destructive functions will grow inmode GR�; whereas tumors that grow slowly, are strongly im-munogenic, and/or that are sensitive to destruction by T cells willgrow in mode GR�.
Despite the latter differences, GR� and GR� tumors share thesame general phases of interaction with the immune T cells (seeFig. 1, a and b), and these phases, as we will see later, are relevantto interpret the response to therapies on simulations. In the initialphase (I) of tumor growth the dynamics of the T cells is not af-fected, because the tumor is too small. This is followed by a sec-ond phase (II) of strong interaction between the T cells and thegrowing tumor. In this phase GR� tumors break tolerance, ex-panding preferentially TE cells, while GR� tumors expand alsothe regulatory population. Finally there is a third phase (III) whereT cell dynamics reach a plateau while the tumor continues to grow.This plateau of the immune response follows the saturation of thetumor-induced flux of mature APCs from the tumor to the lymphnode and is controlled by parameter AM in the model.
Response to therapy
Model responses to different therapies, simulated as particular dy-namical perturbations, are studied here for tumors that grow, in theabsence of treatment, either as GR� or GR� tumors. Our aim isto establish whether therapies are differentially effective to treatthese classes of tumors. We classify the results of the simulation ofresponse to therapy by looking at the long term dynamics of dif-ferent cell populations in the system (i.e., neglecting transient ef-fects of perturbations). We found five generic classes of responses,despite the particular type of treatment studied. They are describedbelow and extensively exemplified for the particular treatmentsstudied on this work, in our home-maintained web site. (At sitehttp://www.cim.sld.cu/articulos/Regulatory_T_Cells_&_Tumor_biology(kalet2007)/index.htmyou may download several figures, which complement and extendthe information provided in this original manuscript, as well as aMathematica 4.2 notebook allowing you to reproduce our simula-tion of tumor growth kinetics in the presence or absence of treat-ments, for parameter values of your choice.)1. Tumor rejection (symbol R) when tumor mass reduces to zerofollowing treatment. In this class, we further check which T cellsdominate the final state of the system. If dominated by TE (R � E)or by TR (R � E) cells we refer to them respectively as autoim-mune positive (symbol A�) and negatives (symbol A�) states.
2. Persistent tumor growth (symbol G) when tumor keeps grow-ing despite treatment. In this class we further check whether thissecondary growth expands preferentially TE cells (GR� likemode, symbol GR�) or expands along the TR cells (GR� likemode, symbol GR�).
3. Accelerated tumor progression (gray shadow regions in fig-ures), when tumor continues to grow but reaches the net size of 109
cells faster than expected without treatment. .In the following sections we study how different treatments ofinterest elicit the possible responses as function of relevant controlparameters in the simulations. We illustrate these dependencieswith the tumors whose population dynamics, with no treatment,are shown in Fig. 2.
Response to vaccination
Cancer vaccines are being currently used as immunotherapeuticintervention in cancer. These vaccines consist in immunizing thepatients with tumor Ags (or tumor cells) together with adjuvants.This has two distinct effects: on the one hand, it increases tran-siently the availability of tumor Ags on APCs, and in contrast itinduces a massive maturation of professional APCs from precur-sors that will migrate to and accumulate transiently in the lymphnode. Accordingly, we simulate cancer vaccines by an instanta-neous and transient increase in the number of APCs presentingtumor related Ags in the lymph node compartment of the model(LN). The mathematical translation of this therapy is described inAppendix A, corresponding to the last term of Equation A4.
Our simulations of cancer vaccines are controlled by three pa-rameters. The vaccine dose Dv sets the value for the net increasein the number of APCs induced by the vaccine. Parameter Tv setsthe time of vaccine application because tumor growth initiation.Parameter, dTV, determines the duration of the transient APC in-crease induced by the vaccine. Examples of typical populationdynamics in the model after vaccinations are provided in our website (See http://www.cim.sld.cu/articulos/Regulatory_T_Cells_&_Tumor_biology(kalet2007)/index.htm).
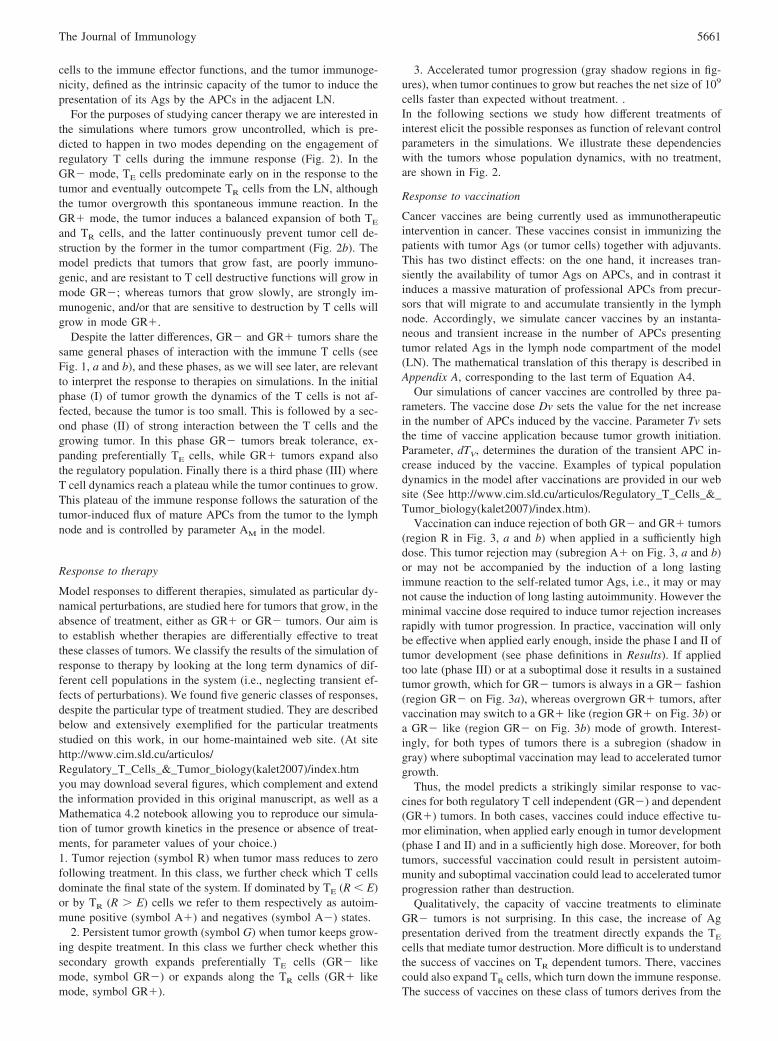
Vaccination can induce rejection of both GR� and GR� tumors(region R in Fig. 3, a and b) when applied in a sufficiently highdose. This tumor rejection may (subregion A� on Fig. 3, a and b)or may not be accompanied by the induction of a long lastingimmune reaction to the self-related tumor Ags, i.e., it may or maynot cause the induction of long lasting autoimmunity. However theminimal vaccine dose required to induce tumor rejection increasesrapidly with tumor progression. In practice, vaccination will onlybe effective when applied early enough, inside the phase I and II oftumor development (see phase definitions in Results). If appliedtoo late (phase III) or at a suboptimal dose it results in a sustainedtumor growth, which for GR� tumors is always in a GR� fashion(region GR� on Fig. 3a), whereas overgrown GR� tumors, aftervaccination may switch to a GR� like (region GR� on Fig. 3b) ora GR� like (region GR� on Fig. 3b) mode of growth. Interest-ingly, for both types of tumors there is a subregion (shadow ingray) where suboptimal vaccination may lead to accelerated tumorgrowth.
Thus, the model predicts a strikingly similar response to vac-cines for both regulatory T cell independent (GR�) and dependent(GR�) tumors. In both cases, vaccines could induce effective tu-mor elimination, when applied early enough in tumor development(phase I and II) and in a sufficiently high dose. Moreover, for bothtumors, successful vaccination could result in persistent autoim-munity and suboptimal vaccination could lead to accelerated tumorprogression rather than destruction.
Qualitatively, the capacity of vaccine treatments to eliminateGR� tumors is not surprising. In this case, the increase of Agpresentation derived from the treatment directly expands the TE
cells that mediate tumor destruction. More difficult is to understandthe success of vaccines on TR dependent tumors. There, vaccinescould also expand TR cells, which turn down the immune response.The success of vaccines on these class of tumors derives from the
5661The Journal of Immunology
fact that, in our model, the stringency of the regulation exertedby TR cells over TE cells is a function of the ratio of TR cellsper APCs (value of R/A) in the system and not of the ratio ofTR cells per TE cells (values of R/E). We have proved theoret-ically this property of our model (24 –26), and we have shownexperimentally that such a dependency is observed at least forthe suppression exerted by CD4�CD25� T cells over the pro-liferation of CD4�CD25� T cells when cocultured with APCsin vitro (24, 27). Thus, following the latter property, vaccinesthat suddenly increases the number of APCs may be expected toinduce rejection of GR� tumor, because they reduce the ratioR/A in the system, relaxing tolerance and favoring the expan-sion of the TE cells.
Other interesting result of our simulations is that the vaccinedose required to induce tumor rejection, rapidly increases withtumor development. This result can be understood, from the factthat tumor development gradually increases the number of APCs,TE cells, and TR cells at the LN, in the model. Thus, perturbationsto the system based on increasing the number of APCs (like ourvaccine) will be relevant if they are large enough relative to thepreexistent number of APCs. Therefore with tumor progression theminimal vaccine required for efficient therapy increases and even-tually reaches unfeasible values.
Response to T cell depletion/suppression treatments
In recent years, Ag-nonspecific T cell depletion or suppressionwith anti-CD4 or anti-CD25 Abs have been used successfully totreat tumors in animal models (5, 28, 29) or humans (30). Thesetreatments are simulated here as an instantaneous and transient
increase in T cell death rate. See last terms of Equations A1 and A2of appendix A for the mathematical implementation. Note that wehave assumed no preferential bias toward TE or TR cell depletionon this treatment.
In the simulations, three parameters control depletion treatment.The dose of immunosuppressor drug is controlled through param-eter Dd that sets the increase in T cell death rate. The time ofinitiation of suppression is determined by the value of parameterTd which is relative to the initiation of the tumor. The parameter,dTd, which sets the duration of the transient effect of depletion.(parameter dTd was explored for values ranging from 0.5 to 5,obtaining qualitative results similar to those reported here fordTd � 4.) Examples of typical population dynamics in the modelafter T cell depletion are provided in our web site.
GR� tumors are rejected, in the simulations, following a strongT cell depletion during a small time window, that spans over phaseI of tumor development (Fig. 3c). Such tumor rejection may ormay not be concomitant with the induction of long lasting auto-immunity. Suboptimal treatments with either low dose of immu-nosuppressants or administered outside the sensitivity time win-dow (on phase II and III) have no major implications in tumorgrowth, and may even accelerate tumor progression (Fig. 3c).
For GR� tumors, there is also an initial time window, whichspans over phase I and II of tumor development, where T cellsuppression treatments can induce tumor rejection (Fig. 3d). Thisrejection may or may not lead to long lasting autoimmunity. Insidethis sensitivity window, the response shows a dose dependency,similar to the one observed for GR� tumors, i.e., there is a
FIGURE 3. Parameter dependen-cies of tumor responses to treatmentsof vaccination (a and b) and T cell de-pletion (c and d). Different regions inthese graphs, delimited parameter val-ues (of those parameters indicated onthe axes, which control treatment ap-plication) leading to qualitatively dif-ferent dynamic outcomes after treat-ment in our numerical simulations.These regions are labeled according tothe dynamic outcome classificationprovided in Results. Briefly, symbol Rlabels regions of parameter valuesleading to tumor rejection, while thesubregions, inside this one, labeled asA� demark parameter regions wherethere is induction of long lasting auto-immunity as a byproduct of tumorelimination. Symbols GR� and GR�label region of parameters where treat-ment results on tumor sustainedgrowth, that preferentially expand ef-fector T cells (GR�) or regulatory Tcells (GR�). Subregions, inside thelatter’s, shadow in gray corresponds tothe induction of an overall acceleratedtumor progression by treatment appli-cation. a and b, the response of GR�(a) and GR� (b) tumors to vaccinationas a function of the dose (Dv) and thetiming of application (Tv). Panels c andd, the response of GR� (c) and GR�(d) tumors to T cell depletion treatmentas a function of treatment dose (Dd)and timing of application (Td).
5662 IMPLICATIONS OF REGULATORY T CELLS FOR THE DESIGN OF CANCER THERAPIES
minimal dose of treatment above which suppression is always ef-fective. Suboptimal depletion dose most typically causes the tumorto continue to grow in a GR� like mode, whereas treatment afterthe sensitivity time windows (phase III), always result in a sus-tained tumor progression, either in a GR� like mode or in GR�like mode. Interestingly, as observed in Fig. 3d, for the parametervalues used here (dTd � 5), this treatment appears unable to induceaccelerated tumor progression of GR� tumors. Although, if onedeliberately extend the depletion period (dTd �� 5), when apply-ing a high dose depletion, such negative effect can be obtainedmainly inside phase II of GR� tumor development (data notshown).
Thus, in summary, the model predicts that transient depletiontreatment can induce rejection of both TR cell dependent (GR�)and independent (GR�) tumors. This treatment will be effectivewhen applied during an initial time window of tumor developmentand when applied with the appropriate dose ranges. However,GR� tumors are better targets for this treatment than GR� tu-mors. On the one hand, GR� tumors have a wider sensitivity timewindow than GR� tumors, and in contrast, the adverse conse-quence of accelerated tumor progression (region shadow in grayon Fig. 3, c and d) appears more easily in GR� tumors.
The predicted capacity of T cell depletion treatment to inducerejection of both GR� and GR� tumors is counter intuitive, giventhat it eliminates equally the cells needed to destroy the tumor andthe cells that can suppress the immune reaction. This result stemsfrom the stringency of the regulation exerted by TR cells over TE
cells, which in our model (as we explained before) is a function ofthe ratio of TR cells per APCs (value of R/A). Therefore, depletiontreatment that, among others, reduces the number of R cells dy-namically favor TE cell dominance, because it reduce the ratio R/Ain the system, consequently relaxing tolerance.
Relevantly, like vaccines, depletion treatment is predicted to beineffective on late phases of tumors development, although thereare different explanations, for such effect on GR� and GR� tu-mors. Treatment of GR� tumors becomes inefficient on phase II oftumor development; when the TE population is significantly ex-panded in the system. In this and later phases, after tolerance hasbeen broken by tumor growth, depletion treatment has no qualita-tive impact, because there is no relevant TR activity left to besuppressed. However, for GR� tumors, depletion treatment be-comes inefficient only at phase III of tumor development, when theimmune response has reached the plateau determined by the sat-uration of the tumor-dependent influx of APCs to the lymph node(control by parameter AM). In this condition, depletion could in-duce a TE cell expansion but with a limited size, determined by themaximal existent levels of Ag presentation. Thus, if the tumor islarge enough, such limited response would be nevertheless inef-fective to control its growth.
Response to incomplete surgery
Surgery is common practice in medical treatment of solid tumors.We simulate surgery as an instantaneous but incomplete reductionof tumor cell numbers, taking into account the practical impossi-bility to remove all tumor cells either due to inefficient surgicalprocedures or due to the incapacity to identify all tumor cellsamong normal tissues. (Note that surgery could also eliminate TE
and TR cells infiltrating the tumor, but we neglect this followingthe previous assumptions that migration of T cells between thelymph node and the tumor compartment is in rapid equilibrium andthat the lymph node contains more T cells than the tumor com-partment at any given time.) Incomplete surgery is controlled bytwo parameters in the simulations. The efficiency is controlled byparameter Ds that sets the number of tumor cells that are left over
by surgery. The timing of surgery is measured relative to tumoronset by parameter Ts. Examples of typical population dynamics,in the model, after incomplete surgery, are provided in ourweb site.
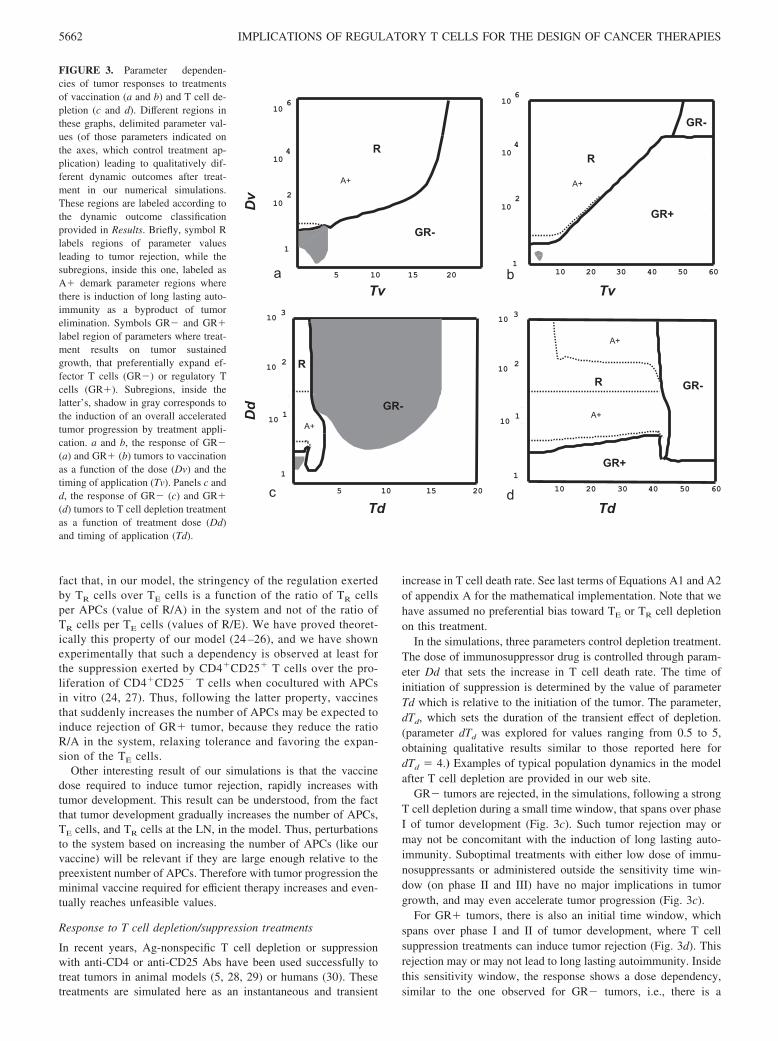
TR cell-dependent (GR�) and TR cell-independent (GR�) tu-mors respond differently to incomplete surgery in the simulations.GR� tumors are sensitive to surgeries that are done on phase IIand III of tumor development, provided that they reduce the tumorburden to a magnitude that is handled by the spontaneously ex-panded immune response (Fig. 4). Furthermore, successful surgerycan induce a long lasting immune reaction (subregion A�) inter-preted as autoimmunity, which will work also as an efficient anti-tumor immune memory (i.e., it prevents the growth of a new tumorof the same kind, data not shown). GR� tumors are insensitive toincomplete surgery during the phase I of their development whenimmune tolerance is still not broken (Fig. 4). Incomplete surgery atthis phase can be seen as a resetting the tumor to its initial state,which can delay but will not prevent tumor progression.
In contrast with TR-independent tumors, GR� tumors are in-sensitive to incomplete surgery at any phase of their development,irrespective of how many tumors cells are left. The rational to theresistance to surgery is that these tumors lead to a progressiveincrease of the TR cells and therefore decreasing tumor size willdelay progression (see Fig. S4 for kinetics) but cannot imbalancethe response toward TE cells due to the concomitant and fast de-crease in Ag-presentation derived from surgical reduction oftumor size.
In summary, incomplete surgery alone can deal effectively withGR� tumors that have progressed over their first phase, but willnot work with GR� tumors in their first phase of development orGR� tumors at any phase of their development. Relevantly, thistreatment shows no negative effects for the patients other thanautoimmunity, because there are no conditions leading to acceler-ated tumor progression upon treatment.
Combination therapies
The monotherapies studied in previous sections could induce tu-mor elimination when targeting either GR� or GR� tumorswithin a sensible phase of their development, and with a dose
FIGURE 4. Parameter dependencies of the response of GR� tumors tosurgery. Different regions, in the graphs, delimited parameter values lead-ing to qualitatively different dynamic outcomes of numerical simulations.They are labeled as explained on Fig. 3. Parameter Ds, stands for theamount of tumor cells remaining in the system after treatment (i.e., it setsthe maximal efficiency of the surgery); and the parameter Ts refers to thetime relative to tumor progression when surgery is applied.
5663The Journal of Immunology
inside the appropriate effective range. If any of these prerequisitesis not met then the treatment fails or, even worse, may lead to somenegative effects for the patient. Thus vaccination and T cell deple-tion appear to fail on late phases of tumor development, whileincomplete surgery of GR� tumors is ineffective. An appealingpossibility is that the combination of these therapies could broadentheir individual effectiveness. Therefore, we have studied everypossible pairwise combination therapy. We describe below the bestcombinations to target GR� or GR� tumors.
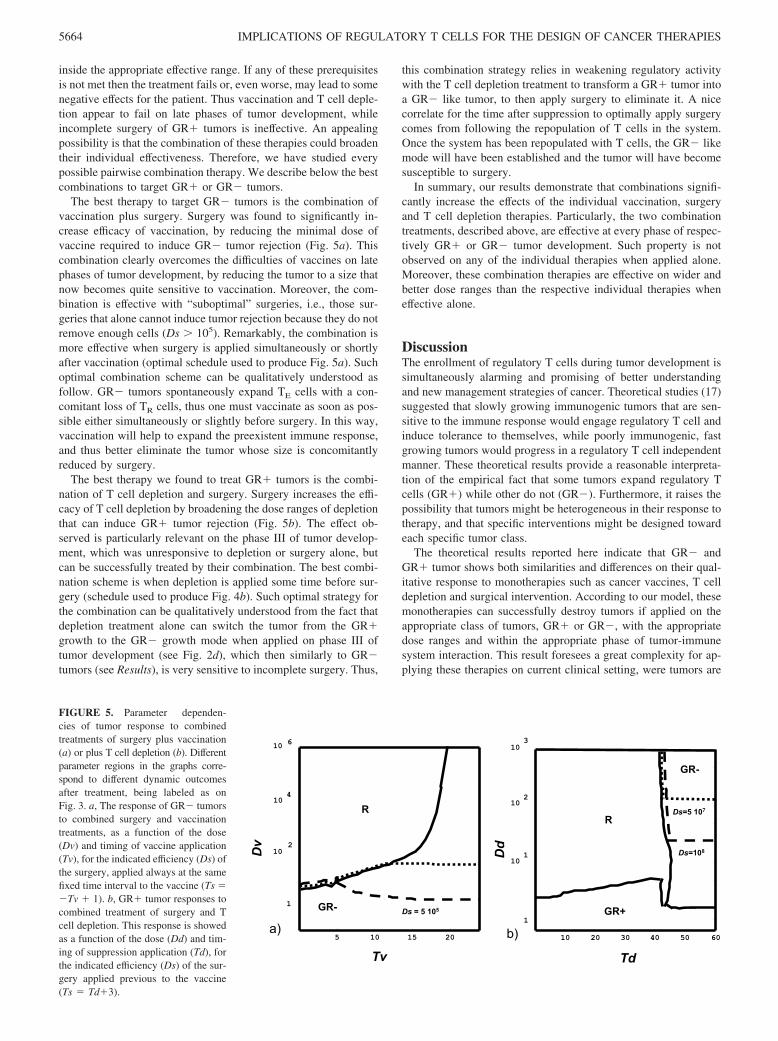
The best therapy to target GR� tumors is the combination ofvaccination plus surgery. Surgery was found to significantly in-crease efficacy of vaccination, by reducing the minimal dose ofvaccine required to induce GR� tumor rejection (Fig. 5a). Thiscombination clearly overcomes the difficulties of vaccines on latephases of tumor development, by reducing the tumor to a size thatnow becomes quite sensitive to vaccination. Moreover, the com-bination is effective with “suboptimal” surgeries, i.e., those sur-geries that alone cannot induce tumor rejection because they do notremove enough cells (Ds � 105). Remarkably, the combination ismore effective when surgery is applied simultaneously or shortlyafter vaccination (optimal schedule used to produce Fig. 5a). Suchoptimal combination scheme can be qualitatively understood asfollow. GR� tumors spontaneously expand TE cells with a con-comitant loss of TR cells, thus one must vaccinate as soon as pos-sible either simultaneously or slightly before surgery. In this way,vaccination will help to expand the preexistent immune response,and thus better eliminate the tumor whose size is concomitantlyreduced by surgery.
The best therapy we found to treat GR� tumors is the combi-nation of T cell depletion and surgery. Surgery increases the effi-cacy of T cell depletion by broadening the dose ranges of depletionthat can induce GR� tumor rejection (Fig. 5b). The effect ob-served is particularly relevant on the phase III of tumor develop-ment, which was unresponsive to depletion or surgery alone, butcan be successfully treated by their combination. The best combi-nation scheme is when depletion is applied some time before sur-gery (schedule used to produce Fig. 4b). Such optimal strategy forthe combination can be qualitatively understood from the fact thatdepletion treatment alone can switch the tumor from the GR�growth to the GR� growth mode when applied on phase III oftumor development (see Fig. 2d), which then similarly to GR�tumors (see Results), is very sensitive to incomplete surgery. Thus,
this combination strategy relies in weakening regulatory activitywith the T cell depletion treatment to transform a GR� tumor intoa GR� like tumor, to then apply surgery to eliminate it. A nicecorrelate for the time after suppression to optimally apply surgerycomes from following the repopulation of T cells in the system.Once the system has been repopulated with T cells, the GR� likemode will have been established and the tumor will have becomesusceptible to surgery.
In summary, our results demonstrate that combinations signifi-cantly increase the effects of the individual vaccination, surgeryand T cell depletion therapies. Particularly, the two combinationtreatments, described above, are effective at every phase of respec-tively GR� or GR� tumor development. Such property is notobserved on any of the individual therapies when applied alone.Moreover, these combination therapies are effective on wider andbetter dose ranges than the respective individual therapies wheneffective alone.
DiscussionThe enrollment of regulatory T cells during tumor development issimultaneously alarming and promising of better understandingand new management strategies of cancer. Theoretical studies (17)suggested that slowly growing immunogenic tumors that are sen-sitive to the immune response would engage regulatory T cell andinduce tolerance to themselves, while poorly immunogenic, fastgrowing tumors would progress in a regulatory T cell independentmanner. These theoretical results provide a reasonable interpreta-tion of the empirical fact that some tumors expand regulatory Tcells (GR�) while other do not (GR�). Furthermore, it raises thepossibility that tumors might be heterogeneous in their response totherapy, and that specific interventions might be designed towardeach specific tumor class.
The theoretical results reported here indicate that GR� andGR� tumor shows both similarities and differences on their qual-itative response to monotherapies such as cancer vaccines, T celldepletion and surgical intervention. According to our model, thesemonotherapies can successfully destroy tumors if applied on theappropriate class of tumors, GR� or GR�, with the appropriatedose ranges and within the appropriate phase of tumor-immunesystem interaction. This result foresees a great complexity for ap-plying these therapies on current clinical setting, were tumors are
Ds=5 107
Dd
Td
b) 10 20 30 40 50 601
10
10 1
10 2
3
GR+
GR-
R
Ds=108
5 10 15 20
1
10 6
10 4
10 2
Ds = 5 105
R
GR-
Dv
Tv
a)
FIGURE 5. Parameter dependen-cies of tumor response to combinedtreatments of surgery plus vaccination(a) or plus T cell depletion (b). Differentparameter regions in the graphs corre-spond to different dynamic outcomesafter treatment, being labeled as onFig. 3. a, The response of GR� tumorsto combined surgery and vaccinationtreatments, as a function of the dose(Dv) and timing of vaccine application(Tv), for the indicated efficiency (Ds) ofthe surgery, applied always at the samefixed time interval to the vaccine (Ts ��Tv � 1). b, GR� tumor responses tocombined treatment of surgery and Tcell depletion. This response is showedas a function of the dose (Dd) and tim-ing of suppression application (Td), forthe indicated efficiency (Ds) of the sur-gery applied previous to the vaccine(Ts � Td�3).
5664 IMPLICATIONS OF REGULATORY T CELLS FOR THE DESIGN OF CANCER THERAPIES
not classified neither in terms of their TR dependence or indepen-dence, nor in terms of the phase of their natural interaction with theimmune system. (Note that currently we mainly classify tumors inthe clinic by having or not some particular target of interest andaccording to their stage of progression, that essentially consideredthe geographical spreading of the tumor and not necessarily thestage of its interaction with the immune system.) Thus on theseconditions the application of these therapies with a fixed timeschedule and dose will at most benefit some particular sets of sus-ceptible patients, while will be ineffective or will even worsen theclinical situation of the others. Our theoretical study suggests thentwo possible ways to improve the efficacy of these cancer thera-pies. The first one is to classify better the clinical tumors accordingto the type and the stage of their interaction with the immunesystem. Our description of the therapeutically relevant phases I, IIand III of this interaction, in the model, could provide some clueson the relevant aspect required for this classification. The otherpossible way to proceed is to look for new therapies that are ableto work on a more heterogeneous setting, for instance that work foreither TR- dependent and independent tumors or that could work atevery phase of tumor-immune system interaction. Interestingly, inthis sense, our results suggest that the appropriate combinations ofthe very same therapies would be effective on more heterogeneoussettings. Particularly, we propose two combinations that are able towork at any phase of tumor development, respectively for GR�and GR� tumors.
Response of GR� and GR� tumors to vaccination
In contrast with our initial expectation, responses of GR� andGR� tumors to vaccination treatment are strikingly similar, de-spite their differential capacity to expand regulatory T cells. Bothtypes of tumors show a complex and diverse response to vaccina-tion, which can result in tumor rejection with or without the in-duction of concomitant autoimmunity, or might even result in anaccelerated tumor progression. All these possibilities have beenobserved in experimental tumor models (see (14–16) for examplesof accelerated progression and (31–33) for the complex relationwith autoimmunity). Notwithstanding, our analysis further predictshow these alternative outcomes might originate as a function of thetiming of vaccination with respect to tumor development and onthe dose of the vaccine (which directly correlates here with theincrease in Ag presentation). Particularly, our model proposes that:1) Vaccination induces tumor rejection at high dose, although theminimal effective dose increases with tumor growth until it reachesunfeasible values; 2) Induction of an accelerated tumor progres-sion results from suboptimal vaccination in early tumor states;thus, increasing the efficiency of vaccination in these situationsmight turn this negative effect to the desired tumor rejection; and3) Autoimmunity induction may correlate very well with the de-velopment of effective anti-tumoral responses, although there aresome ranges of intermediate vaccine doses were autoimmunitycould be avoided.
Response of GR� and GR� tumors to T cell depletiontreatments
The responses of GR� and GR� tumors to T cell depletion ther-apies also show some similarities according to our model. Bothtypes of tumors show a complex and diverse response to this treat-ment, which results either in tumor rejection with or without con-comitant autoimmunity, or in partially delayed or even acceleratedtumor progression. Remarkable is the capacity of this treatment toinduce tumor rejection, particularly given the fact that it has nobias toward a preferential regulatory T cell depletion, i.e., the treat-ment depleted both the cells that mediate the regulation and the
cells that mediate the immune reaction. The latter result is of prac-tical importance, because so far there is no cell marker which couldbe safely used for the ideal treatment of specific TR cell depletion.Thus, our theoretical results support the use of nonspecific treat-ments that deplete TE and TR cells simultaneously, which despitebeing less efficient and harder to predict, can achieve similar goalsthan treatments depleting specifically TR cells. These treatmentsmay be achieved with several existent therapeutic agents. For in-stance, mAbs against CD4, CD3, and CD25 markers, or even somechemotherapeutic treatments that deplete dividing lymphocytes.Indeed, such predicted types of effect have been observed exper-imentally (28, 34–37), but they are often interpreted as an indica-tion that the delivered treatment preferentially eliminated the TR
cells and not as the result of a perturbation to the dynamical bal-ance of TE and TR cell populations as favored by our model. It isnevertheless important to state that having a treatment that pref-erentially eliminate TR cells is always desirable, and in our sim-ulations (data not shown) the stronger the bias toward depletion ofTR cells the wider becomes the dose range leading to effectivetreatment
Another important theoretical result of our simulations is that Tcell depletion induces rejection in both GR� and GR� tumorsonly if performed within an initial time window during tumor de-velopment. If the treatment is applied either too early before tumorinitiation or too late when the tumor is too large then it fail toinduce tumor rejection. This complex dependence arrives fromcoupling the dynamics of normal tumor immune system interac-tion with the imbalance in the strength of the interaction among Tcells induced by depletion. Because this imbalance is transient itcannot be done too early otherwise it will fade away before thetumor start having a non negligible impact on T cell dynamics, andamplifies it. Overall this result provides a simple and plausibleinterpretation for the findings (4, 5) that rejection of some trans-plantable tumors can be induced by treatment with anti-CD25 de-pleting Abs but only if applied shortly before or early enough aftertumor implantation. Surprisingly, in our model, such dependenceis not particular to GR� tumors, where TR cells have a dominantrole in the overall system dynamics, but is also observed in GR�tumors, in which TR cells only participate in the very initial phaseof response. Thus, according to our model, observing such phe-nomenology in an experimental tumor, although important, doesnot indicate per se that regulatory T cells play a relevant role on itsoverall tumor dynamics, i.e., it does not help to identify regulatoryT cell-dependent tumors.
Despite similarities, there are also significant differences in theresponses to T cell depletion treatments observed for GR� andGR� tumors. Particularly relevant is that, in our simulations,GR� tumors appear better targets for this treatment than GR�tumors. On the one hand, GR� tumors have a wider sensitivitytime window than the one observed in GR� tumors; and in con-trast, the adverse event of accelerated tumor progression is moreeasily obtained in GR� tumors. This result can be qualitativelyunderstood from the dominant role that regulatory T cells play inthe dynamics of this mode of tumor growth. The suppression treat-ment aims to eliminate immune regulation by regulatory T cells.Therefore, if this phenomenon is more relevant in the dynamics ofGR� tumors, the treatment must be more effective for them.
Response of GR� and GR� tumors to surgery
GR� and GR� tumors strongly differ in their response to incom-plete surgery. Although the former can be eliminated depending onthe efficiency and timing of the surgical procedure (i.e., how much
5665The Journal of Immunology
it reduces tumor burden), the latter are expected to be always un-responsive. These results provide a novel interpretation to the fail-ure of therapeutic surgery in tumors. Reappearance of the tumorfollowing surgical intervention is commonly interpreted as a fail-ure to remove all tumor cells. In line with this, medical doctorsoften choose not to operate when they foresee that removal of allor most malignant tissue is unlikely. Instead, our results suggestthat different responses of tumors to surgery could rely solely onthe differences in the pre-established tumor specific immune ac-tivity. Tumors that spontaneously induce a TR-independent im-mune reaction will be sensitive to incomplete surgery; but tumorsthat are tolerated by the immune system will require a completetumor extirpation to prevent a recurrent growth. Moreover, ourresults suggest that it may be useful to perform surgery even whenit is known a priori that a significant number of malignant cellswill be left over, as these may be susceptible to the immuneresponse.
Response of GR� and GR� tumors to combination therapies
We explored potentially useful combination therapies searching toidentify the dose and time schedules that maximize their benefitialeffects. The theoretical results presented here suggest that combi-nations increase the effectiveness of therapy beyond that of vac-cination, surgery, and T cell depletion monotherapies. Particularly,we propose two combination strategies specifically effective whentargeted to GR� and GR� tumor. These specific combinations areeffective at every phase of each of two tumor classes, and thus mayallow their treatment on the heterogeneous clinical settings. More-over, they are effective on wider and better dose ranges than thoseof the monotherapies on which they are based, further sustainingtheir practical value.
We propose that TR- independent tumors can be best managedby vaccination plus surgery. Moreover, the optimal combinationrequires vaccinating concomitantly or slightly before surgery. Thisstrategy, intends to further expands, with the vaccine, the preex-istent spontaneous immune reaction on this class of tumor, facil-itating the immune mediated removal of the tumor mass remainingafter surgery. Interestingly, this type of combination has been pre-viously explored experimentally (38) being referred to as vacci-nation in adjuvant settings and was proven successful in sometumor models. Our results thus support the effectiveness of thiscombination, for GR� tumors. But more relevantly, they providea rational for the scheme of these therapies combination that differsfrom the most classical scheme used on the practical settings, werevaccine is commonly applied after surgery and not before or si-multaneously to it. Therefore our finding, suggest a rationale tooptimize some of the adjuvant setting strategies used on animalmodels and the clinic.
We propose that therapy of choice for TR- dependent tumors isthe combination of surgery and T cell depletion. As far as weknow, this type of combination has never been proposed before orexplored in experimental tumor models. Although one might try toreinterpret in this framework the effects of some chemotherapieswhen applied to adjuvant settings (39, 40), particularly if onestresses the fact that some chemotherapies could induce lympho-cyte depletion. In any case, our simulations predict that such com-bination might be useful, although only in tumors that expand reg-ulatory T cell activity (GR� tumors). Thus, our result proposes anew type of combined therapy, whose optimal combination occurswhen surgery is applied after T cell depletion, when T cells havejust recovered from the depletion treatment. We believe this pre-diction is amenable for experimental testing and may be of prac-tical value.
Finally, we would like to stress that our model is a radical sim-plification of tumor immunobiology, focusing on some of its as-pects and neglecting many others. Some of these major simplifi-cations and their consequences are worth emphasizing here.
In a major simplification of reality, our model assumed thatparameters controlling tumor dynamics (like growth rate, immu-nogenicity, sensitivity to immune effectors functions and TE or TR
migration/accumulation inside the tumor site) remain constant allalong tumor development. Based on this simplification we couldhighlight the interplay between TE and TR cells crossregulationand tumor dynamics. We simulated other model variants, for in-stance tumors growing with variable growth rate according to aGompertz law. We found that in most cases, tumors could still beclassified as purely GR� or GR�, although we found also someswitches in dynamic tumor classification, for instance obtainingtumors that initially evolve as GR� tumor and then switch “spon-taneously” to GR� growth. In any case, hybrid tumors that behavetransiently like GR� or GR� react to the simulated treatments insimilar qualitative terms as the pure GR� and GR� tumors stud-ied here. Therefore, although we acknowledge the simplicity ofthis first approach we believe it is a stepping stone to understandmore realistic and eventually more complex cases.
Other major simplification of our model is that it excluded themultitude of components of the immune system that likely play arole in tumor development besides T cells and APCs. Examples ofputative relevant mechanism ignored in our model are the produc-tion of soluble factor by tumor cell that could impair T cell activityon its microenvironments, the recruitment by the tumor of otherregulatory cell populations, like myeloid dendritic cells or someNK cells. It is then very important to note that the model developedhere focused on the minimal set of interactions influencing TR
activity and maintenance, particularly those interactions related totheir main function on controlling the pathologic autoimmune re-sponse to peripheral self-Ags. In principle, no tumor mostly mayescape the influence of this elementary regulatory mechanism, atleast in its initial and decisive phases of growth, because all tumorsare mainly composed of self-Ag. This minimal model has shownan interesting, and quite complex dynamic behavior, particularlyregarding tumor response to different treatments. It explains someknown experimental facts and makes several counterintuitive, yettestable predictions. Adding further layers of complexity, by in-cluding now neglected regulatory mechanism, should improvemodel performance, better explaining particular tumors dynamics.Nevertheless, having understood the behavior of the minimalmodel developed here will be useful and instrumental to betteranalyze and interpret simulation result of more complex models.Our expectation is that adding new regulatory mechanism, willlead to further subdivision in different subclasses of tumors insidethe broader GR� and GR� tumor classes defined here. Thesesubclasses will differ on the response to some therapies, but mostlikely they will inherit some properties of the broader GR� orGR� tumor class they belong to.
Despite the latter simplifications it is fair to stress that our modelis a step forward in respect to previous mathematical models (41–48) by including the regulatory T cells, whose existence and rel-evance is well accepted by the immunological community. Oursimulations then reveal the impact that regulatory T cell populationhas for tumor immunobiology and therapy. Furthermore, we be-lieve they contain sufficient realism to warrant some qualitativetestable predictions, which may be used to improve tumor immu-nobiology modeling and may serve as a stepping stone for therational-design of novel combination therapies.
5666 IMPLICATIONS OF REGULATORY T CELLS FOR THE DESIGN OF CANCER THERAPIES
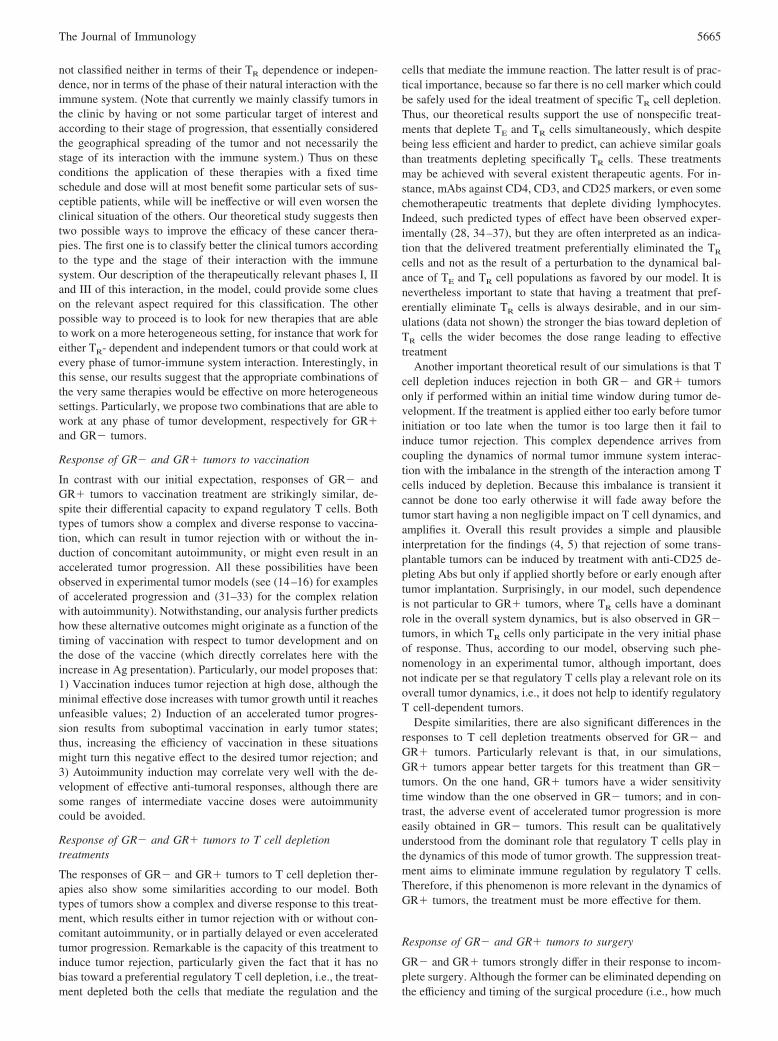
Appendix A: Model equations and Parameters values.
In our numerical simulations, a nondimensional form of our pre-vious model (17) was used to reduce significantly the number ofparameters and to prevent the occurrence of numerical errors in thecomputation. This nondimensional model is obtained by introduc-ing the following change of variables:
t � x / d; E � e � A0; R � r � A0; Tu � tu � � � A0; A � a � A0
This change of variables normalizes the time in the model to thedeath rate for lymphocytes (d) and normalizes the cell numbers fortumor cells (Tu), effector (E) and regulatory T cells (R) to the basalnumber of APCs (A0) in the absence of the tumor. It results in thefollowing system of equations plus algebraic relationships
de
dx� �e � � � �1 �
rc
sa�s�1
� ec � �e � ec�
� Dd � H�x � Td� � H�Td � dTd � x� � e (A1)
dr
dx� �r �
�s � 1�
s� � �
rc � ec
a�r � rc�
� Dd � H�x � Td� � H�Td � dTd � x� � r (A2)
d tu
dx� g � tu � ki �
eT
�tu � eT � rT�� �1 �
rT
�tu � eT � rT��
� tu
(A3)
a � 1 � � aM � tu
aM � � tu� DV � H�x � TV� � H�TV � dTV � x�
(A4)
eT � � � �1 �rc
sa�s�1
� ec, rT � � �rc � ec
a(A5)
tc �k � �s � a � e � r� � �� � a � e � r�
2 � k
�� �k � �s � a � e � r� � �� � a � e � r��2 � 4 � k2 � s � a � �e � r�
2 � k
(A6)
Where H(x) is the heavyside function, defined as 1 for positivearguments and 0 for negative ones, and the nondimensional vari-ables and parameters represent:
e, r, a Rescaled number of TE cells, TR cell and APCsclusters at the lymph node.
ec, rc Rescaled number of E and R conjugated to APCs atthe lymph node.
eT, rT Rescaled number of E and R infiltrating thetumor site.
�E, �R Source term of new E and R cells incoming from thethymus.
�, � Proliferation rates of E and R cells. Tumor immunogenicity, defined by its capacity to
promote its Ag presentation at LN.aM Rescaled maximal number of APC clusters attainable
at the lymph node.k Conjugation constants of E and R cells with the
APC site.s� Number of conjugation sites for T cells on an APC
cluster.� Ratio between the per-cell, volume occupy by APCs
and lymphocytes.
g Rescaled net growth rate of tumor in the absence of Tcells.
ki Rescaled rate at which immune effector T cells candestroy a tumor cells.
Coefficient controlling the efficiency of regulatory Tcell inhibition of effectors T cell-dependent tumor celldestruction.
Dv, Dd Doses for vaccination and T cell depletion treatments,respectively.
Tv, Td Timing for treatment application, either forvaccination or T cell depletion.
dTv, dTd Duration of direct treatment effects, either forvaccination or T cell depletion.
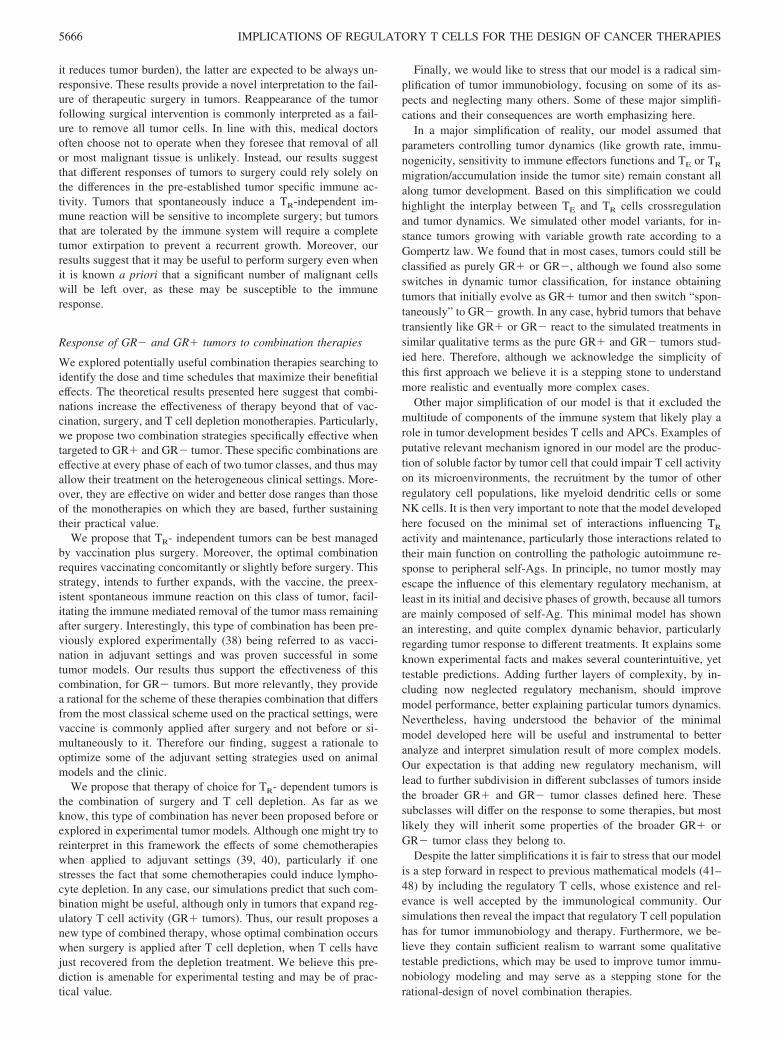
In the figures along this paper, nondimensional parameters wereset to the following values, based on the analysis in our previouswork (17) � � 21, � � 2.9, k � 7.0, �e � 0.01, �r � 0.01, s �6, aM � 104, � 8, � � 1, ki � 400, � � 1, Ao � 102. Theseparameter values are compatible with a life span and doubling timefor effector lymphocytes respectively of 7 days and 8 h. Thereforethey result in a nondimensional time unit corresponding to a weekof real time and a nondimensional cell-number unit correspondingto 102 real cells.
To simulate a typical GR� or GR� tumor, we used differentvalues for the tumor immunogenicity parameter () and the tumorspecific growth rate parameter (g). Particularly, in this paper’s fig-ures, we use � 0.0001, g � 4.7 for GR� tumors, and � 0.01,g � 2.1 for GR� tumors. However, we have explored many otherparameter conditions selected inside the GR� and GR� regionsprovided on Fig. 2 of reference (17) obtaining results for the effectof treatments, qualitatively similar to those explicitlyreported here.
AcknowledgmentsThe work was supported by the Foundation for Science and Technology(Portugal): fellowships to KL (respectively BPD/11575/2002) and grants toJC (POCTI/MGI/46477/2002 with FEDER funds). We thank Dr. Rui Gard-ner for kindly revising this manuscript.
DisclosuresThe authors have no financial conflict of interest.
References1. Beyer, M., and J. L. Schultze. 2006. Regulatory T cells in cancer. Blood 108:
804–811.2. Knutson, K. L., M. L. Disis, and L. G. Salazar. 2006. CD4 regulatory T cells in
human cancer pathogenesis. Cancer Immunol. Immunother. 56: 271–285.3. Yamaguchi, T., and S. Sakaguchi. 2006. Regulatory T cells in immune surveil-
lance and treatment of cancer. Semin. Cancer Biol. 16: 115–123.4. Shimizu, J., S. Yamazaki, and S. Sakaguchi. 1999. Induction of tumor immunity
by removing CD25�CD4� T cells: a common basis between tumor immunityand autoimmunity. J. Immunol. 163: 5211–5218.
5. Onizuka, S., I. Tawara, J. Shimizu, S. Sakaguchi, T. Fujita, and E. Nakayama.1999. Tumor rejection by in vivo administration of anti-CD25 (interleukin-2receptor �) monoclonal antibody. Cancer Res. 59: 3128–3133.
6. Kono, K., H. Kawaida, A. Takahashi, H. Sugai, K. Mimura, N. Miyagawa,H. Omata, and H. Fujii. 2006. CD4�CD25high regulatory T cells increase withtumor stage in patients with gastric and esophageal cancers. Cancer Immunol.Immunother. 55: 1064–1071.
7. Wolf, D., A. M. Wolf, H. Rumpold, H. Fiegl, A. G. Zeimet, E. Muller-Holzner,M. Deibl, G. Gastl, E. Gunsilius, and C. Marth. 2005. The expression of theregulatory T cell-specific forkhead box transcription factor FoxP3 is associatedwith poor prognosis in ovarian cancer. Clin. Cancer Res. 11: 8326–8331.
8. Li, X., D. F. Ye, X. Xie, H. Z. Chen, and W. G. Lu. 2005. Proportion ofCD4�CD25� regulatory T cell is increased in the patients with ovarian carci-noma. Cancer Invest. 23: 399–403.
9. Nishikawa, H., T. Kato, I. Tawara, T. Takemitsu, K. Saito, L. Wang, Y. Ikarashi,H. Wakasugi, T. Nakayama, M. Taniguchi, et al. 2005. Accelerated chemicallyinduced tumor development mediated by CD4�CD25� regulatory T cells inwild-type hosts. Proc. Natl. Acad. Sci. USA 102: 9253–9257.
10. Hontsu, S., H. Yoneyama, S. Ueha, Y. Terashima, M. Kitabatake, A. Nakano,T. Ito, H. Kimura, and K. Matsushima. 2004. Visualization of naturally occurring
5667The Journal of Immunology
Foxp3� regulatory T cells in normal and tumor-bearing mice. Int. Immunophar-macol. 4: 1785–1793.
11. Curiel, T. J., G. Coukos, L. Zou, X. Alvarez, P. Cheng, P. Mottram,M. Evdemon-Hogan, J. R. Conejo-Garcia, L. Zhang, M. Burow, et al. 2004.Specific recruitment of regulatory T cells in ovarian carcinoma fosters immuneprivilege and predicts reduced survival. Nat. Med. 10: 942–949.
12. Woo, E. Y., H. Yeh, C. S. Chu, K. Schlienger, R. G. Carroll, J. L. Riley,L. R. Kaiser, and C. H. June. 2002. Cutting edge: regulatory T cells from lungcancer patients directly inhibit autologous T cell proliferation. J. Immunol. 168:4272–4276.
13. Nair, R. E., M. O. Kilinc, S. A. Jones, and N. K. Egilmez. 2006. Chronic immunetherapy induces a progressive increase in intratumoral T suppressor activity anda concurrent loss of tumor-specific CD8� T effectors in her-2/neu transgenic micebearing advanced spontaneous tumors. J. Immunol. 176: 7325–7334.
14. Nishikawa, H., T. Kato, I. Tawara, K. Saito, H. Ikeda, K. Kuribayashi,P. M. Allen, R. D. Schreiber, S. Sakaguchi, L. J. Old, and H. Shiku. 2005.Definition of target antigens for naturally occurring CD4� CD25� regulatory Tcells. J. Exp. Med. 201: 681–686.
15. Zhou, G., C. G. Drake, and H. I. Levitsky. 2006. Amplification of tumor-specificregulatory T cells following therapeutic cancer vaccines. Blood 107: 628–636.
16. Nishikawa, H., T. Kato, K. Tanida, A. Hiasa, I. Tawara, H. Ikeda, Y. Ikarashi,H. Wakasugi, M. Kronenberg, T. Nakayama, et al. 2003. CD4� CD25� T cellsresponding to serologically defined autoantigens suppress antitumor immune re-sponses. Proc. Natl. Acad. Sci. USA 100: 10902–10906.
17. Leon, K., K. Garcia, J. Carneiro, and A. Lage. 2007. How regulatoryCD25�CD4� T cells impinge on tumor immunobiology: on the existence of twoalternative dynamical classes of tumors. J. Theor. Biol. 247: 122–137.
18. Wall, E., K. Milne, M. Martin, P. Watson, P. Theiss, and B. Nelson. 2007.Spontaneous mammary tumors differ widely in their inherent sensitivity to adop-tively transferred T cells. Cancer Res. 67: 6442–6450.
19. Cesana, G. C., G. DeRaffele, S. Cohen, D. Moroziewicz, J. Mitcham,J. Stoutenburg, K. Cheung, C. Hesdorffer, S. Kim-Schulze, and H. L. Kaufman.2006. Characterization of CD4�CD25� regulatory T cells in patients treated withhigh-dose interleukin-2 for metastatic melanoma or renal cell carcinoma. J. Clin.Oncol. 24: 1169–1177.
20. Badoual, C., S. Hans, J. Rodriguez, S. Peyrard, C. Klein, H. Agueznay Nel,V. Mosseri, O. Laccourreye, P. Bruneval, W. H. Fridman, et al. 2006. Prognosticvalue of tumor-infiltrating CD4� T-cell subpopulations in head and neck cancers.Clin. Cancer Res. 12: 465–472.
21. Leong, P. P., R. Mohammad, N. Ibrahim, H. Ithnin, M. Abdullah, W. C. Davis,and H. F. Seow. 2006. Phenotyping of lymphocytes expressing regulatory andeffector markers in infiltrating ductal carcinoma of the breast. Immunol. Lett. 102:229–236.
22. DeLong, P., R. G. Carroll, A. C. Henry, T. Tanaka, S. Ahmad, M. S. Leibowitz,D. H. Sterman, C. H. June, S. M. Albelda, and R. H. Vonderheide. 2005. Reg-ulatory T cells and cytokines in malignant pleural effusions secondary to me-sothelioma and carcinoma. Cancer Biol. Ther. 4: 342–346.
23. Fox, S. B., R. Launchbury, G. J. Bates, C. Han, N. Shaida, P. R. Malone,A. L. Harris, and A. H. Banham. 2007. The number of regulatory T cells inprostate cancer is associated with the androgen receptor and hypoxia-induciblefactor (HIF)-2� but not HIF-1�. Prostate 67: 623–629.
24. Carneiro, J., K. Leon, I. Caramalho, C. Van den Dool, R. Gardner, V. Oliveira,M. Bergman, N. Sepulveda, T. Paixao, J. Faro, and J. Demengeot. 2007. Whenthree is not a crowd: a crossregulation model of the dynamics and repertoireselection of regulatory CD4 T cells. Immunol. Rev. 216: 48–68.
25. Leon, K., R. Perez, A. Lage, and J. Carneiro. 2000. Modelling T-cell-mediatedsuppression dependent on interactions in multicellular conjugates. J. Theor. Biol.207: 231–254.
26. Leon, K., R. Perez, A. Lage, and J. Carneiro. 2001. Three-cell interactions in Tcell-mediated suppression? A mathematical analysis of its quantitative implica-tions. J. Immunol. 166: 5356–5365.
27. Leon, K. 2002. A Quantitative Approach to Dominant Tolerance. University ofPorto, Porto, Portugal.
28. Yu, P., Y. Lee, W. Liu, T. Krausz, A. Chong, H. Schreiber, and Y. X. Fu. 2005.Intratumor depletion of CD4� cells unmasks tumor immunogenicity leading tothe rejection of late-stage tumors. J. Exp. Med. 201: 779–791.
29. Tanaka, H., J. Tanaka, J. Kjaergaard, and S. Shu. 2002. Depletion of CD4�
CD25� regulatory cells augments the generation of specific immune T cells intumor-draining lymph nodes. J. Immunother. 25: 207–217.
30. Dannull, J., Z. Su, D. Rizzieri, B. K. Yang, D. Coleman, D. Yancey, A. Zhang,P. Dahm, N. Chao, E. Gilboa, and J. Vieweg. 2005. Enhancement of vaccine-mediated antitumor immunity in cancer patients after depletion of regulatory Tcells. J. Clin. Invest. 115: 3623–3633.
31. Overwijk, W. W., D. S. Lee, D. R. Surman, K. R. Irvine, C. E. Touloukian,C. C. Chan, M. W. Carroll, B. Moss, S. A. Rosenberg, and N. P. Restifo. 1999.Vaccination with a recombinant vaccinia virus encoding a “self” antigen inducesautoimmune vitiligo and tumor cell destruction in mice: requirement for CD4� Tlymphocytes. Proc. Natl. Acad. Sci. USA 96: 2982–2987.
32. Dudley, M. E., J. R. Wunderlich, P. F. Robbins, J. C. Yang, P. Hwu,D. J. Schwartzentruber, S. L. Topalian, R. Sherry, N. P. Restifo, A. M. Hubicki,et al. 2002. Cancer regression and autoimmunity in patients after clonal repopu-lation with antitumor lymphocytes. Science 298: 850–854.
33. Engelhorn, M. E., J. A. Guevara-Patino, G. Noffz, A. T. Hooper, O. Lou,J. S. Gold, B. J. Kappel, and A. N. Houghton. 2006. Autoimmunity and tumorimmunity induced by immune responses to mutations in self. Nat. Med. 12:198–206.
34. Ghiringhelli, F., N. Larmonier, E. Schmitt, A. Parcellier, D. Cathelin, C. Garrido,B. Chauffert, E. Solary, B. Bonnotte, and F. Martin. 2004. CD4�CD25� regu-latory T cells suppress tumor immunity but are sensitive to cyclophosphamidewhich allows immunotherapy of established tumors to be curative. Eur. J. Im-munol. 34: 336–344.
35. Motoyoshi, Y., K. Kaminoda, O. Saitoh, K. Hamasaki, K. Nakao, N. Ishii,Y. Nagayama, and K. Eguchi. 2006. Different mechanisms for anti-tumor effectsof low- and high-dose cyclophosphamide. Oncol. Rep. 16: 141–146.
36. Jones, E., D. Golgher, A. K. Simon, M. Dahm-Vicker, G. Screaton, T. Elliott, andA. Gallimore. 2004. The influence of CD25� cells on the generation of immunityto tumour cell lines in mice. Novartis Found. Symp. 256: 149–152; discussion152–169.
37. Knutson, K. L., Y. Dang, H. Lu, J. Lukas, B. Almand, E. Gad, E. Azeke, andM. L. Disis. 2006. IL-2 immunotoxin therapy modulates tumor-associated regu-latory T cells and leads to lasting immune-mediated rejection of breast cancers inneu-transgenic mice. J. Immunol. 177: 84–91.
38. Choudhury, A., S. Mosolits, P. Kokhaei, L. Hansson, M. Palma, and H. Mellstedt.2006. Clinical results of vaccine therapy for cancer: learning from history forimproving the future. Adv Cancer Res. 95: 147–202.
39. Izawa, J. I., J. L. Chin, and E. Winquist. 2006. Timing cystectomy and periop-erative chemotherapy in the treatment of muscle invasive bladder cancer. Can.J. Urol. 13 (Suppl. 3): 48–53.
40. Potti, A., and A. K. Ganti. 2006. Adjuvant chemotherapy for early-stage non-small cell lung cancer: the past, the present and the future. Exp. Opin. Biol. Ther.6: 709–716.
41. Cappuccio, A., M. Elishmereni, and Z. Agur. 2006. Cancer immunotherapy byinterleukin-21: potential treatment strategies evaluated in a mathematical model.Cancer Res. 66: 7293–7300.
42. Frieboes, H. B., X. Zheng, C. H. Sun, B. Tromberg, R. Gatenby, and V. Cristini.2006. An integrated computational/experimental model of tumor invasion. Can-cer Res. 66: 1597–1604.
43. de Pillis, L. G., A. E. Radunskaya, and C. L. Wiseman. 2005. A validated math-ematical model of cell-mediated immune response to tumor growth. Cancer Res.65: 7950–7958.
44. Castiglione, F., and B. Piccoli. 2006. Optimal control in a model of dendritic celltransfection cancer immunotherapy. Bull. Math Biol. 68: 255–274.
45. de Pillis, L. G., W. Gu, and A. E. Radunskaya. 2006. Mixed immunotherapy andchemotherapy of tumors: modeling, applications and biological interpretations.J. Theor. Biol. 238: 841–862.
46. Matzavinos, A., M. A. Chaplain, and V. A. Kuznetsov. 2004. Mathematical mod-elling of the spatio-temporal response of cytotoxic T-lymphocytes to a solidtumour. Math. Med. Biol. 21: 1–34.
47. Wodarz, D., and V. A. Jansen. 2003. A dynamical perspective of CTL cross-priming and regulation: implications for cancer immunology. Immunol. Lett. 86:213–227.
48. Takayanagi, T., and A. Ohuchi. 2001. A mathematical analysis of the interactionsbetween immunogenic tumor cells and cytotoxic T lymphocytes. Microbiol. Im-munol. 45: 709–715.
5668 IMPLICATIONS OF REGULATORY T CELLS FOR THE DESIGN OF CANCER THERAPIES
Top Related
Copyright © 2022 FDOKUMEN

