The calcineurin inhibitor tacrolimus allows the induction of functional CD4+CD25+ regulatory T cells...
14
The calcineurin inhibitor tacrolimus allows the induction of functional CD4 + CD25 + regulatory T cells by rabbit anti-thymocyte globulinsV. D. K. D. Sewgobind,* † L. J. W. van der Laan, † M. M. L. Kho,* R. Kraaijeveld,* S. S. Korevaar,* W. Mol,* W. Weimar* and C. C. Baan* Departments of *Internal Medicine and † Surgery, Erasmus MC, University Medical Centre Rotterdam, Rotterdam, the Netherlands Summary Rabbit anti-thymocyte globulins (rATG) induce CD4 + CD25 + forkhead box P3 (FoxP3 + ) regulatory T cells that control alloreactivity. In the present study, we investigated whether rATG convert T cells into functional CD4 + CD25 + FoxP3 + CD127 -/low regulatory T cells in the presence of drugs that may hamper their induction and function, i.e. calcineurin inhibitors. CD25 neg T cells were stimulated with rATG or control rabbit immunoglobulin G (rIgG) in the absence and presence of tacrolimus for 24 h. Flow cytometry was per- formed for CD4, CD25, FoxP3 and CD127 and the function of CD25 + T cells was examined in suppression assays. MRNA expression profiles were com- posed to study the underlying mechanisms. After stimulation, the percentage CD4 + CD25 + FoxP3 + CD127 -/low increased (from 2% to 30%, mean, P < 0·01) and was higher in the rATG samples than in control rIgG samples (2%, P < 0·01). Interestingly, FoxP3 + T cells were also induced when tacrolimus was present in the rATG cultures. Blockade of the interleukin (IL)-2 pathway did not affect the frequency of rATG-induced FoxP3 + T cells. The rATG tacrolimus-induced CD25 + T cells inhibited proliferative responses of alloantigen-stimulated effector T cells as vigorously as rATG-induced and natural CD4 + CD25 + FoxP3 + CD127 -/low T cells (67% 18% versus 69% 16% versus 45% 20%, mean standard error of the mean, respectively). At the mRNA-expression level, rATG-induced CD25 + T cells abundantly expressed IL-10, IL-27, interferon (IFN)-g, perforin and granzyme B in contrast to natural CD25 + T cells (all P = 0·03), while FoxP3 was expressed at a lower level (P = 0·03). These mRNA data were confirmed in regulatory T cells from kidney transplant patients. Our findings demonstrate that tacrolimus does not negatively affect the induction, phenotype and function of CD4 + CD25 + T cells, suggesting that rATG may induce regulatory T cells in patients who receive tacrolimus maintenance therapy. Keywords: calcineurin inhibitors, rabbit immunoglobulins, regulatory T cells Accepted for publication 26 March 2010 Correspondence: Dr C. C. Baan, Erasmus MC, University Medical Center Rotterdam, PO Box 2040, Room Ee559a, 3000 CA Rotterdam, the Netherlands. E-mail: [email protected] Introduction The major goal of transplantation immunobiology is to prevent alloreactivity by inducing a state of donor-specific hyporesponsiveness in order to acquire graft acceptance. There are several protocols to establish this. First, a straight- forward way of inhibiting alloreactivity can be accomplished by immunosuppressive therapy. However, a major limitation of the most common immunosuppressive regimens is that they lack specificity, as they not only dampen the immune responses against the allograft. Secondly, apart from mecha- nisms such as clonal deletion, anergy or activation-induced cell death (AICD), the in vivo skewing of the immune system towards the regulatory T cells (Tregs) that control alloreac- tivity seems to be promising in obtaining donor-specific hyporesponsiveness as demonstrated in experimental trans- plantation models [1,2]. It is tempting to speculate that immunosuppressive drugs may also contribute to the development of donor-specific hyporesponsiveness via the active induction of Tregs. Indeed, experimental studies analysing the effects of various immu- nosuppressive agents suggest that these drugs contribute beneficially to immunoregulatory mechanisms [3–5]. For instance, rabbit anti-thymocyte globulin (rATG), which is Clinical and Experimental Immunology ORIGINAL ARTICLE doi:10.1111/j.1365-2249.2010.04183.x 364 © 2010 British Society for Immunology, Clinical and Experimental Immunology, 161: 364–377
Transcript of The calcineurin inhibitor tacrolimus allows the induction of functional CD4+CD25+ regulatory T cells...

The calcineurin inhibitor tacrolimus allows the inductionof functional CD4
+CD25+ regulatory T cells by rabbit
anti-thymocyte globulinscei_4183 364..377
V. D. K. D. Sewgobind,*†
L. J. W. van der Laan,† M. M. L. Kho,*
R. Kraaijeveld,* S. S. Korevaar,*
W. Mol,* W. Weimar* and C. C. Baan*Departments of *Internal Medicine and †Surgery,
Erasmus MC, University Medical Centre
Rotterdam, Rotterdam, the Netherlands
Summary
Rabbit anti-thymocyte globulins (rATG) induce CD4+CD25+forkhead boxP3 (FoxP3+) regulatory T cells that control alloreactivity. In the presentstudy, we investigated whether rATG convert T cells into functionalCD4+CD25+FoxP3+CD127-/low regulatory T cells in the presence of drugs thatmay hamper their induction and function, i.e. calcineurin inhibitors. CD25neg
T cells were stimulated with rATG or control rabbit immunoglobulin G (rIgG)in the absence and presence of tacrolimus for 24 h. Flow cytometry was per-formed for CD4, CD25, FoxP3 and CD127 and the function of CD25+ T cellswas examined in suppression assays. MRNA expression profiles were com-posed to study the underlying mechanisms. After stimulation, the percentageCD4+CD25+FoxP3+CD127-/low increased (from 2% to 30%, mean, P < 0·01)and was higher in the rATG samples than in control rIgG samples (2%,P < 0·01). Interestingly, FoxP3+T cells were also induced when tacrolimus waspresent in the rATG cultures. Blockade of the interleukin (IL)-2 pathway didnot affect the frequency of rATG-induced FoxP3+ T cells. The rATGtacrolimus-induced CD25+ T cells inhibited proliferative responses ofalloantigen-stimulated effector T cells as vigorously as rATG-induced andnatural CD4+CD25+FoxP3+CD127-/low T cells (67% � 18% versus 69% � 16%versus 45% � 20%, mean � standard error of the mean, respectively). At themRNA-expression level, rATG-induced CD25+ T cells abundantly expressedIL-10, IL-27, interferon (IFN)-g, perforin and granzyme B in contrast tonatural CD25+ T cells (all P = 0·03), while FoxP3 was expressed at a lower level(P = 0·03). These mRNA data were confirmed in regulatory T cells fromkidney transplant patients. Our findings demonstrate that tacrolimus doesnot negatively affect the induction, phenotype and function of CD4+CD25+ Tcells, suggesting that rATG may induce regulatory T cells in patients whoreceive tacrolimus maintenance therapy.
Keywords: calcineurin inhibitors, rabbit immunoglobulins, regulatory T cells
Accepted for publication 26 March 2010
Correspondence: Dr C. C. Baan, Erasmus MC,
University Medical Center Rotterdam, PO Box
2040, Room Ee559a, 3000 CA Rotterdam, the
Netherlands.
E-mail: [email protected]
Introduction
The major goal of transplantation immunobiology is toprevent alloreactivity by inducing a state of donor-specifichyporesponsiveness in order to acquire graft acceptance.There are several protocols to establish this. First, a straight-forward way of inhibiting alloreactivity can be accomplishedby immunosuppressive therapy. However, a major limitationof the most common immunosuppressive regimens is thatthey lack specificity, as they not only dampen the immuneresponses against the allograft. Secondly, apart from mecha-nisms such as clonal deletion, anergy or activation-induced
cell death (AICD), the in vivo skewing of the immune systemtowards the regulatory T cells (Tregs) that control alloreac-tivity seems to be promising in obtaining donor-specifichyporesponsiveness as demonstrated in experimental trans-plantation models [1,2].
It is tempting to speculate that immunosuppressive drugsmay also contribute to the development of donor-specifichyporesponsiveness via the active induction of Tregs. Indeed,experimental studies analysing the effects of various immu-nosuppressive agents suggest that these drugs contributebeneficially to immunoregulatory mechanisms [3–5]. Forinstance, rabbit anti-thymocyte globulin (rATG), which is
Clinical and Experimental Immunology ORIGINAL ARTICLE doi:10.1111/j.1365-2249.2010.04183.x
364 © 2010 British Society for Immunology, Clinical and Experimental Immunology, 161: 364–377

given as induction therapy after transplantation, converthuman CD25neg T cells into functional suppressiveCD4+CD25+forkhead box P3 (FoxP3+) T cells in vitro [5,6].Previously, we have reported that the number ofCD4+CD25bright regulatory T cells recovered slowly andincompletely in kidney transplant recipients within 6months after rATG-induction therapy when given in combi-nation with a calcineurin inhibitor (CNI) and mycopheno-late mofetil (MMF) [7]. Nevertheless, the donor-specificsuppressive properties of these peripheral CD4+CD25bright Tcells were equivalent to that of the CD4+CD25bright T cellsbefore transplantation. In line with these results, it has beenshown that steroids do not hamper the recovery ofCD4+CD25+ regulatory T cells after treatment of kidneytransplant patients with a non-depletive rATG-solution [8].Moreover, the patient group that received rATG-treatmentwithout steroids did not show enhanced levels of Tregs aftertreatment. Our study and the latter imply that CNIs might beresponsible for the lack of enhanced Treg numbers after rATGtherapy compared to pretreatment.
As CD4+CD25+ regulatory T cells require interleukin(IL)-2 and other members of the IL-2 cytokine family fortheir development, homeostasis and function [9–12], theirfrequency or function might be affected by CNIs that inhibitthe transcription nuclear factor of activated T cells (NFAT)required for IL-2 transcription [13–15] or by anti-IL-2receptor antibodies (daclizumab/basiliximab) that blockIL-2 signalling [15]. This may imply that in patients, theseagents may influence negatively the beneficial effects of rATGon the induction of Tregs.
To understand the factors that enhance or harm the devel-opment of functional rATG-induced Tregs, we investigated theinduction of rATG-induced Tregs in the presence and absenceof a CNI (tacrolimus), antibodies that abolish IL-2 (anti-IL-2) and block IL-2R signalling (daclizumab) on humanperipheral blood cells. Furthermore, the rATG-treated cellswere analysed functionally and characterized according totheir gene-expression patterns to reveal their underlyingmechanisms. The gene-expression profiles obtained in vitrowere verified in kidney transplant patients who receivedrATG induction therapy and CNI maintenance therapy andwere compared to a non-rATG group. These findings mayhave important implications for understanding one of themechanisms of action of rATG in transplanted patients afterrATG induction therapy which is followed by concomitantimmunosuppression.
Materials and methods
Induction of Tregs
Peripheral blood mononuclear cells (PBMC) were isolatedby density gradient centrifugation over Ficoll-Paque (Amer-sham Pharmacia Biotech, Uppsala, Sweden) from buffycoats of five blood bank donors (Sanquin Blood Bank,
Rotterdam, the Netherlands). PBMC were washed twice andresuspended in 10% human cell medium (HCM), whichconsisted of RPMI-1640 medium with L-glutamine (Bio-Whittaker, Verviers, Belgium) supplemented with 10%pooled human serum and 100 IU/ml penicillin and100 mg/ml streptomycin (GIBCO, BRL, Scotland, UK). TheCD25+ T cells were depleted of the PBMC by incubationwith anti-CD25 microbeads (Miltenyi Biotech, BergischGladbach, Germany) followed by negative selection on theautoMACS (Miltenyi Biotech; deplete-s program). Theuntouched residual fraction consisted of CD25neg cells(>95% Fig. 1a). To induce Tregs with rATG, the residual(CD25neg) fraction was washed and resuspended in HCM toa final concentration of 5·105/ml. RATG (10 mg/ml, thymo-globulin; Genzyme Corporation, Cambridge, MA, USA), acontrol polyclonal rabbit IgG antibody (rIgG, 10 mg/ml,Sigma-Aldrich, St Louis, MO, USA), was added for 24 and72 h. Tacrolimus (10 ng/ml; Astellas, Tokyo, Japan), mono-clonal anti-human IL-2 Ra antibody (1 mg/ml; R&DSystems, Minneapolis, MN, USA) or anti-human IL-2 anti-body (1 mg/ml; R&D Systems) was added to the rATG-treated cultures for 24 h.
Flow cytometry
Flow cytometry was performed using antibodies conjugateddirectly to fluorescein isothiocyanate (FITC), phycoerythrin(PE), allophycocyanin (APC) or peridinin chlorophyllprotein (PerCP) and Amcyan. After incubation with rATGor rIgG, PBMC were harvested and FoxP3-intracellularstaining was performed according to the manufacturer’sinstructions (FoxP3-APC, clone PCH101; eBioscience, SanDiego, CA, USA). Extracellular staining was conductedprior to intracellular staining with FITC-conjugated CD127(eBioscience), IgG1, PerCP-conjugated CD4, PE-conjugatedCD25 epitope B (clone M-A251; BD Biosciences, San Jose,CA, USA), PE-conjugated CD25 and Amcyan-conjugatedCD3 at 4°C for 30 min (BD Biosciences). In a separate plate,PE-conjugated granzyme B (Pelicluster, clone CLB-GB11;CLB, Amsterdam, the Netherlands) was added simulta-neously during incubation with the FoxP3-antibody. Priorto this intracellular staining, extracellular staining withPE-Cy7-conjugated CD25 epitope B (clone M-A251; BDBiosciences) and PerCP-conjugated CD4 was performed.Flow cytometry was performed on an eight-colour fluores-cence activated cell sorter (FACS) Canto II supplementedwith diva software (BD Biosciences). Isotype controlsIgG1-FITC and IgG1-PE for CD25 and granzyme B andCD127 and IgG2a-APC were included at each staining ascontrols as well as the fluorescence minus one (FMO) con-trols [16].
Phosphospecific flow cytometry was performed accordingto the manufacturer’s specifications (BD Biosciences) onCD25neg cells (blood bank donor buffy coats n = 3; Sanquin)before (unstimulated) and after 24 h of rATG (10 mg/ml)
Treg induction by rATG and tacrolimus
365© 2010 British Society for Immunology, Clinical and Experimental Immunology, 161: 364–377
and rATG–tacrolimus (10 ng/ml) stimulation. PBMC andCD25neg cells (1·106) that were stimulated with PMA–ionomycin for 10 min at 37°C served as positive controls.Phosphorylation of P38 in CD3+CD4+, CD4+CD25+ andCD4+CD25neg gated cells was determined by five-colour flowcytometry using the following antibodies: mitogen-activatedprotein kinase (MAPK)-P38-PE (clone 36/p38 pT180/
pY182; BD Biosciences), CD3-PerCP, CD4-PB and CD25-PE-Cy7 epitope B (clone M-A251; BD Biosciences). Cellswere analysed on a FACSCanto II flow cytometer (BD Bio-sciences) for data analysis. Twenty thousand gated lympho-cyte events were acquired from each tube. Medianfluorescent intensity values (MFI) were generated by analys-ing the data with diva version 6·0 software (BD Biosciences).
PBMC(a)
(b)
(c)
24 h rlgG 24 h Tacrolimus 24 h rATG
24 h ATG+ Tacrolimus
24 h rATG+ anti IL-2Rα
24 h rATG+ anti IL-2
CD4
CD4
CD
25
CD
25
9·0%
1·83%
37·95%
3·29% 25·54%
17·85% 23·20%
0·4%
CD4+CD25neg
CD4+CD25+
CD25
neg
rIgG
rATG
Tac
Tac+r
ATG
IL-2
Rα
IL-2
Rα +
rATG
Anti-I
L-2
Anti-I
L-2
+rATG
0
10
20
30
40
50
24 h0 h
******
****
% C
D25
+ o
f C
D4
+
(mean ±
SE
M)
Fig. 1. Induction of regulatory T cells. (a)
Depletion of CD25+ T cells from peripheral
blood mononuclear cells (PBMC). (b)
Incubation of CD25neg T cells with rabbit
immunoglobulin G (rIgG), tacrolimus, rabbit
anti-thymocyte globulins (rATG), rATG +tacrolimus, rATG + interleukin (IL)-2 receptor
(R)-a and rATG + anti-IL-2. Gate shows the
percentage of CD25+ of CD4+ T cells. (c)
Percentage of CD25+ T cells of CD4+, n = 3.
Differences were tested statistically by analysis
of variance (anova), P < 0·0001. (d)
Representative example of percentage of
forkhead box P3 (FoxP3+)CD127-/lowI within
the induced CD25+ T cells of all cultures in the
presence of rATG. CD25neg cells from PBMC
(top panels) were stimulated for 24 h with
rATG, rATG + tacrolimus, rATG + anti-IL-2Raand rATG + anti-IL-2. After 24 h, induced
CD25+ T cells were gated and analysed for their
FoxP3+CD127-/low expression (middle panels).
Gates for positivity were set on
FoxP3+CD127-/low cells within natural (nCD25+)
T cells after 24 h of incubation with rATG.
FoxP3+CD127-/low cells were absent within
CD25neg cells incubated with control rIgG
(lower panels). (e) Percentage of
FoxP3+CD127-/low of induced CD25+ T cells,
three healthy individuals. Error bars represent
mean � standard error of the mean. Differences
were tested statistically by anova. P < 0·0001;
*P < 0·05; ***P < 0·001.
V. D. K. D. Sewgobind et al.
366 © 2010 British Society for Immunology, Clinical and Experimental Immunology, 161: 364–377

FMO controls and unstained control tubes were alsoincluded.
Isolation of human natural and induced Tregs and suppressionassays. To test their function, natural and induced CD25+ Tcells were isolated from the PBMC after incubationwith anti-CD25 microbeads; Miltenyi Biotech) followedby a positive selection (posseld program) on theautoMACS (Miltenyi Biotech), as described previously [17].The isolated and residual fractions were washed and resus-pended in HCM for functional analysis. The untouchedresidual fraction consisted for �98% of CD25-/dim effectorcells. The purity of the CD25+ isolated fraction was �90%[17].
The function of CD25+ T cells was determined by mixedlymphocyte reactions in which their suppressive capacitieswere measured by their ability to inhibit the proliferativeresponse of autologous CD25neg effector T cells (CD25neg
Teff). CD25neg Teff were co-cultured in triplicate with naturalCD25+ T cells or with induced CD25+ T cells. Irradiated(40 Gy) 2-2-2 HLA mismatched allogeneic PBMC were usedas stimulator cells (105 cells/100 ml) and co-cultured with5·104 cells/100 ml of a CD25+ : CD25neg mixture at 1:10 intriplicate wells in round-bottomed 96-well plates (Nunc,Roskilde, Denmark). Moreover, the natural and rATG-induced CD25+ T cells were co-cultured with irradiatedCD25-/dim Teff in the presence of alloantigens to confirmtheir anergic state.
FoxP3+CD127-/low of CD4+CD25+
CD25
neg
rIgG
rATG
Tac
Tac+r
ATG
IL-2
Rα
IL-2
Rα +
rATG
Anti-I
L-2
Anti-I
L-2
+ rA
TG0
10
20
30
40
24 h0 h
******
*****
% F
oxP
3C
D127
-/lo
w
of C
D4
+C
D25
+
(mean ±
s.e
.m.)
***
day 0 PBMC(d)
(e)
CD127
FoxP
3
CD127
FoxP
3
CD127
FoxP
3
10·1% 1·4% 85%
31·4% 19·4%
3·4% 91%
27·7% 29·4%
day 0 CD25neg day 0 nCD25+
24 h rATG
24 h rlgG 24 h rATG nCD25+
24 h rATG+ Tacrolimus
24 h rATG+ anti IL-2Rα
24 h rATG+ anti-IL-2
Fig. 1. Continued
Treg induction by rATG and tacrolimus
367© 2010 British Society for Immunology, Clinical and Experimental Immunology, 161: 364–377

After 7 days of incubation at 37°C in a humidifiedatmosphere of 5% CO2, proliferation was measuredafter [3H]-thymidine (0·5 mCi/well; Amersham PharmaciaBiotech, Buckinghamshire, UK) incubation for the last 16 hbefore harvesting. [3H]-thymidine incorporation into DNAwas assessed using a Betaplate counter (LKB-Wallac, Turku,Finland).
Patient samples
Six kidney transplant patients were enrolled in this study andwere part of a feasibility study. Three patients were given oneinfusion of 1·5 mg/kg anti-thymocyte globulin (rabbit) (Thy-moglobulin®, Genzyme Corporation, Cambridge, MA, USA)each day at days 1, 2 and 3 after transplantation followed by atriple therapy maintenance regimen consisting of tacrolimus,MMF and prednisone. MMF and prednisone were given fromday 1 and tacrolimus was given from day 2 after transplanta-tion. A control non-rATG group (three patients) was treatedwith tacrolimus, MMF and prednisone. Heparinized bloodwas drawn at 12 weeks (median) post-transplant, whenmedian T cell numbers were 400 T cells/ml (three rATGpatients). PBMC were isolated as described above by densitygradient centrifugation over Ficoll-Paque. Subsequently,CD4+CD25+CD127-/low and CD4+CD25negCD127+ T cellswere sorted with the FACSAria II (BD Biosciences) onPerCP-conjugated 7AAD, Pacific Blue-conjugated CD4,PE-Cy7-conjugated CD25 and PE-conjugated CD127 (BDBiosciences). The purity of CD25+ within sorted cells was�98%. After isolation, T cell subsets were snap-frozen forpolymerase chain reaction (PCR) analyses.
Quantitative (Q) PCR
To analyse the gene expression patterns of the samplesobtained from healthy individuals and patients, the CD25neg
T cells on day 0, rATG-induced and rATG–tacrolimus-induced CD25+ and CD25neg T cells after 24 h, and naturalCD25+ T cells were harvested and total RNA was isolatedusing the High Pure RNA isolation kit (Roche AppliedScience, Penzberg, Germany), according to the manufactur-er’s instructions. RNA isolation from the patient sampleswas performed by extraction with phenol. In brief, cDNAwas synthesized from total RNA with random primers asdescribed previously [15]. Q-PCR was applied to quantifythe mRNA expression levels of IL-4, retinoic acid-relatedorphan receptor (ROR)gt, perforin and granzyme B usingthe primer express software (Applied Biosystems, FosterCity, CA, USA). Assay-on-demand products for thedetection and quantification of 18S (Hs99999901_s1),CD25 (Hs00166229.m1), FoxP3 (Hs00203958_m1), IL-2(Hs00174114.m1), IL-10 (Hs00174086.m1), Epstein–Barrvirus-induced gene 3 (EBI3) (Hs01057148.m1), IL27p28(Hs00377366.m1) and interferon (IFN)-g (Hs00174143.m1)mRNA was designed by Applied Biosystems. The PCR reac-tions were performed using a StepOnePlus real-time PCR
system (Applied Biosystems). The amount of each targetmolecule was quantified by measuring the cycle threshold(Ct) values, which were transformed to the number of cDNAcopies [2(40-Ct)] [18]. Each run contained several negativecontrols (no template) and two positive reference samples tocheck intra- and interassay variations. The same referencesamples were used in all experiments. There were no signifi-cant differences in Ct values of reference samples within andbetween the experiments (all <0·25 Ct). The relative concen-trations of the analysed markers were normalized to therelative concentration of the housekeeping gene 18S that waspresent in each sample and multiplied by 106 due to thelower concentration of the target gene compared with theconcentration of 18S [18].
Cytotoxic T lymphocyte-mediated lysis (CML) assay
Activated CD25-/dim T cells (six blood bank donors) thatserved as target cells were isolated by autoMACS as describedabove and were stimulated with 200 IU/ml recombinant IL-2(proleukin; Chiron BV, Amsterdam, the Netherlands),2 mg/ml of the mitogen phytohaemaagglutinin (PHA) and100 ng/ml IFN-g [to up-regulate human leucocyte antigen(HLA) class II, U-Cytech, the Netherlands, Fig. 5d] in24-well plates (Greiner) for 7 days at 37°C. On day 7, theseautologous or allogeneic target blasts (target; T) werelabelled with Europium-DTPA. HLA-class II expression bythe target cells was analysed after staining with HLAD-regulated (HLA-DR) FITC and CD4-PerCP by flowcytometry (BD Biosciences).
For effector cells we used PBMC that were stimulated withallogeneic irradiated PBMC and 200 IU/ml IL-2 for 7 days at37°C. At day 7, these activated cells (effector; E) wereco-cultured in 96-well plates for 4 h with autologous or allo-geneic target blasts and served as the negative and positivecontrol for cytotoxicity, respectively. Natural CD25+ T cells,rATG-induced and rATG–tacrolimus-induced CD25+ T cellswere also used as effector cells and co-cultured with autolo-gous and allogeneic target blasts at different effector : target(E : T) ratios (40:1, 20:1, 10:1, 5:1). After 4 h of incubation,the plates were centrifuged and 20 ml of the supernatant washarvested. Enhancement solution (100 ml; PerkinElmer,Groningen, the Netherlands) was added to the wells. Fluo-rescence of the released Europium was measured andexpressed in counts per second (cps). The percentage lysiswas calculated by [measured E:T Europium release –background Europium release (0:1)/(maximum Europium
release – background Europium release) (¥100%)]. Maxi-mum Europium release was measured by incubation oftarget cells with 1% Triton (Sigma-Aldrich, Zwijndrecht, theNetherlands).
Calculations and statistical analyses
Statistical analysis of flow cytometry was performed usingGraphpad Prism (version 5). To test if the values have
V. D. K. D. Sewgobind et al.
368 © 2010 British Society for Immunology, Clinical and Experimental Immunology, 161: 364–377

normal distribution, the Kolmogorov–Smirnov test wasused. For the determination of statistically significant levels,two-sided probability values were used according to theMann–Whitney U-test. One-way analysis of variance(anova) was performed for multiple testing and post hocanalyses were performed using Bonferroni’s test for multiplecomparisons. P-values �0·05 were considered statisticallysignificant.
Results
Induction of human CD4+CD25+FoxP3+CD127–/low
Tregs with rATG
We performed induction experiments with rATG by theincubation of human CD25neg T cells that were depletedfrom PBMC (Fig. 1a). A typical example of induced CD25expression after stimulation with rATG is shown in Fig. 1b.CD25+ T cells were induced in the rATG-treated samples[27% � 1·7%, mean � standard error of the mean (s.e.m.),n = 5, Fig. 1c] and the percentage CD25+ was significantlyhigher than in the rIgG-treated samples (2·6% � 0·5%,Fig. 1c). Also, when incubated with rATG in the presence oftacrolimus, the proportion of CD25+ T cells was significantlyhigher compared to the rIgG-treated samples (41% � 1·6%,Fig. 1c), while tacrolimus alone had no effect on the percent-age of CD25+ T cells compared to the rIgG-treated samples.
To evaluate the effect of IL-2, we subsequently inhibitedthe IL-2 pathway. Incubation of CD25neg T cell cultures in thepresence of an IL-2Ra inhibitor and rATG for 24 h alsoresulted in a significantly higher percentage of CD25-expressing CD4+ T cells than in the rIgG-treated samples(IL-2Ra: 21% � 3·9% and anti-IL-2: 34% � 8·1%, Fig. 1c).Next, the percentage of FoxP3+CD127-/low T cells was assessedwithin the CD4+CD25+ T cells. FoxP3+CD127-/low T cellswere induced within the CD25+ T cells in all cultures withrATG (Fig. 1d). The percentages of FoxP3+CD127-/low ofCD4+CD25+ T cells for the rIgG, rATG, rATG–tacrolimus,IL-2Ra and anti-IL-2 antibody were 2% � 0·6%, 30% �
3·9%, 19% � 4·4%, 27% � 2·2% and 30% � 3·5%, respec-tively (Fig. 1e).
It has been reported that phosphorylation P38, an impor-tant component of the MAPK pathway that is linked toNFAT, can be inhibited by CNI [19–21]. Interestingly, P38phosphorylation is required for transforming growth factor(TGF)-b-induced conversion of CD4+CD25neg cells intoCD4+CD25+FoxP3+ Tregs [22]. Therefore, we questionedwhether P38 phosphorylation was also induced after stimu-lation of CD25neg cells with rATG to induce FoxP3expression. We found that phosphorylation was present atlow levels in unstimulated CD25neg cells (Fig. 2a) andincreased after 10 min of stimulation with PMA–ionomycin.Subsequently, the phosphorylation level of P38 was mea-sured in the total CD4+ population after 24 h of incubationof CD25neg cells with rATG and rATG–tacrolimus. Phospho-
rylation of P38 was increased in the rATG-treated samplesand the rATG–tacrolimus incubated samples. We did notfind a difference in P38 phosphorylation level betweenrATG- and rATG–tacrolimus-treated samples (Fig. 2b).When gated on the rATG-induced CD25+ T cells, the level ofphosphorylated P38 was comparable with that in naturalCD25+ (Fig. 2b). Moreover, the level of phosphorylated P38was higher in natural and rATG-induced CD25+ than inCD25neg.
Functional analysis of Tregs
Subsequently, we studied the suppressive capacity of rATG-and rATG–tacrolimus-induced CD4+CD25+ T cells. There-fore, these induced CD4+CD25+ T cells were isolated fromthe total PBMC population after 24 h and co-cultured in asuppression assay with autologous CD25neg T cells duringstimulation with alloantigen.
After co-culture with natural CD25+, rATG-inducedCD25+ or rATG–tacrolimus-induced CD25+ T cells, the pro-liferative responses by CD25neg T cells were lower (Fig. 3a).The rATG-induced CD25+ T cells that were induced in thepresence or absence of tacrolimus inhibited the response at acomparable level to natural CD25+ T cells (mean � s.e.m.) ata 1:10 ratio (rATG-induced CD25+ 69% � 16%, rATG–tacrolimus-induced CD25+ 67% � 18% versus naturalCD25+ 45% � 20%, Fig. 3b). The analogous suppressivecapacities of the rATG-induced and the rATG–tacrolimus-induced CD25+ T cells suggest that rATG promotes bona fideregulatory T cells even in the presence of tacrolimus.
A key characteristic of natural CD25+ suppressor T cells isthat they do not proliferate upon stimulation withalloantigen. We found that the rATG-induced and rATG–tacrolimus-induced CD25+ T cells also did not show a pro-liferative response upon stimulation with alloantigen for 7days, suggesting that the cells are anergic (rATG; 487 � 153,rATG–tacrolimus; 369 � 186, mean � s.e.m.).
Gene expression profile of rATG-induced Tregs in theabsence and presence of tacrolimus
To reveal the key molecules involved in the mechanism ofaction of rATG–tacrolimus-induced CD25+ T cells, we inves-tigated their gene expression profiles on these T cells andcompared them with rATG-induced and natural CD25+ Tcells. The purity of CD25+ within sorted cells was �98%.
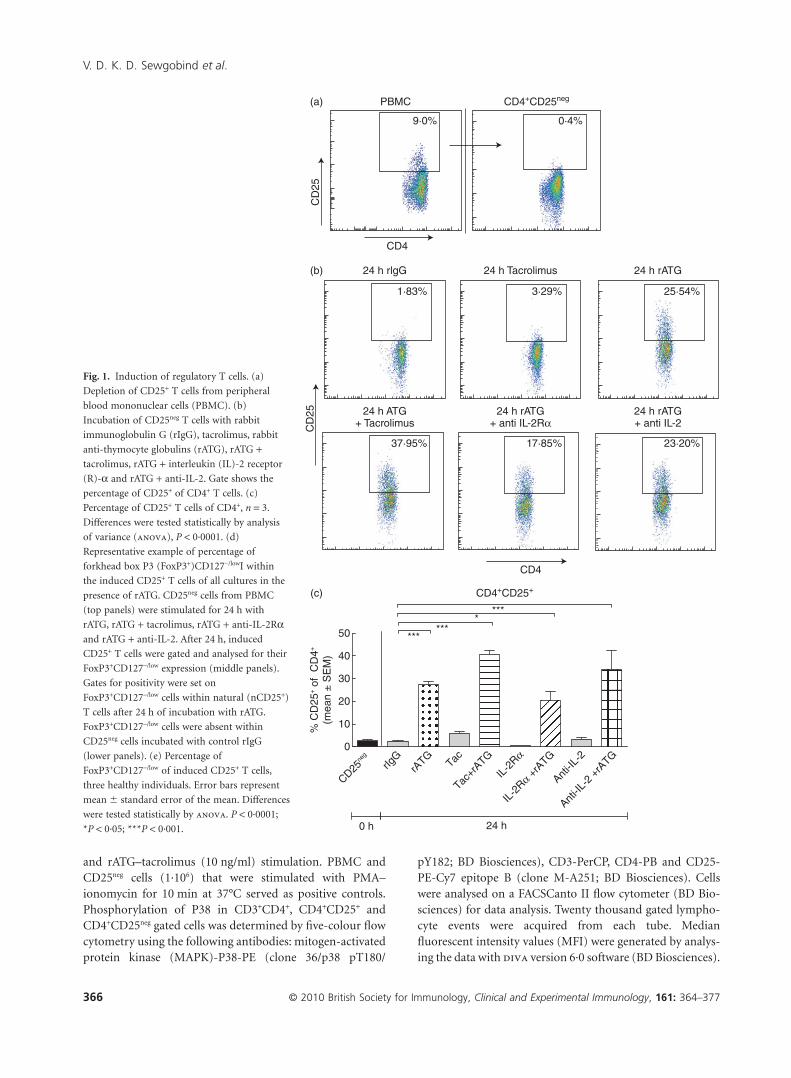
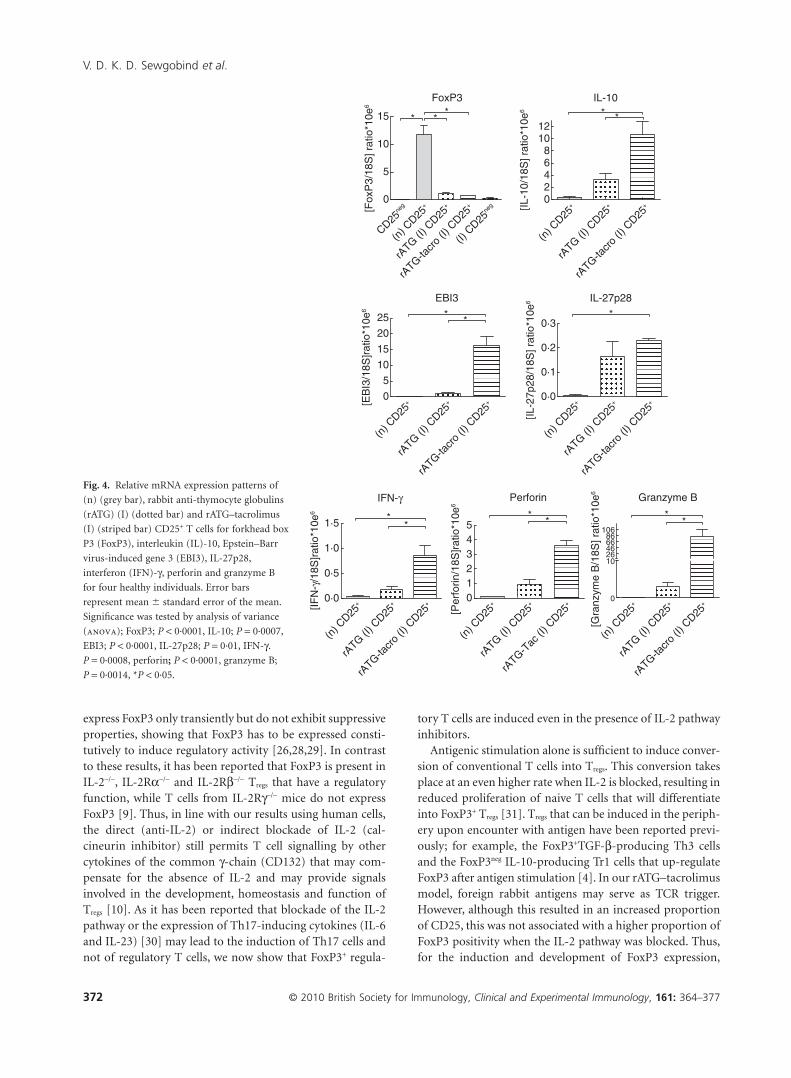
The mRNA expression of FoxP3 was significantly lower inthe rATG-induced and rATG–tacrolimus-induced CD25+ Tcells compared with natural CD25+ T cells (Fig. 4). IL-10,IL-27p28 and EBI3, IFN-g, perforin and granzyme B were allexpressed abundantly in the rATG- and rATG–tacrolimus-induced CD25+ T cells compared to natural CD25+ T cells(Fig. 4).
Next, we compared the profiles of the rATG-inducedCD25+ T cells in the presence and absence of tacrolimus and
Treg induction by rATG and tacrolimus
369© 2010 British Society for Immunology, Clinical and Experimental Immunology, 161: 364–377

it appeared that the mRNA expression of all tested genes,with the exclusion of FoxP3 and IL-27p28, were significantlyhigher in the rATG-(I) CD25+ T cells in the presence oftacrolimus (Fig. 4). Overall, the gene expression profile ofthe rATG–tacrolimus-induced CD25+ T cells was compa-rable to the rATG-induced CD25+ T cells while distinct fromthat of natural CD25+ T cells (Fig. 4). IL-2, IL-4 and thetranscription factor for T helper type 17 (Th17) cells RORgTwere undetectable.
Flow cytometric analyses of granzyme B and cytotoxicactivities by induced Tregs
The finding that granzyme B mRNA levels were up-regulatedin the rATG-induced and more than 80-fold in rATG–tacrolimus-induced CD25+ T cells compared to naturalCD25+ T cells prompted us to link the results on the transcrip-tional level with the translational level. Therefore, we also
investigated the expression of this protein in these T cells. Thepercentages and fluorescence intensities of granzyme B+ Tcells within the CD4+CD25+FoxP3+ T cells were measuredto determine co-expression of granzyme B and FoxP3.A representative example of granzyme B+ T cells withinCD4+CD25+FoxP3+ T cells is shown in Fig. 5a. A considerablyhigher percentage was granzyme B+ of the rATG–tacrolimus-induced CD4+CD25+FoxP3+ T cells, compared with naturalCD25+FoxP3+ T cells (Fig. 5a,b). The fluorescence intensitiesof granzyme B were also higher in the rATG–tacrolimus- andrATG-induced CD25+FoxP3+ T cells compared to the naturalCD25+FoxP3+ T cells, suggesting a higher per-cell expression(Fig. 5a). The percentage of granzyme B+ T cells was the samebetween rATG and rATG–tacrolimus-induced CD25+ T cellpopulations, whether defined as CD4+CD25+FoxP3+ (Fig. 5b)or CD4+CD25+ T cells (Fig. 5c).
To check whether the rATG-induced and rATG–tacrolimus-induced CD25+ T cells have cytotoxic activities,
Fig. 2. P38 phospho-specific flow cytometry.
(a) Representative example of P38
phosphorylation levels in unstimulated, phorbol
myristate acetate (PMA)–ionomycin-stimulated,
rabbit anti-thymocyte globulins
(rATG)-stimulated CD4+CD25neg cells. Median
fluorescence intensities are depicted of
phosphorylated P38 in CD4+ T cells after 24 h
of culture. (b) P38 phosphorylation in
unstimulated CD4+CD25neg cells,
PMA–ionomycin-stimulated CD4+CD25neg cells,
rATG-stimulated CD4+CD25neg cells and
rATG–tacrolimus-stimulated CD4+CD25neg cells,
n = 3. (c) phosphorylation of P38 in
unstimulated and PMA–ionomycin-stimulated
natural CD4+CD25+ (nCD4+CD25+) and
CD4+CD25neg cells from PBMC and
rATG-induced CD4+CD25+ and CD25neg cells.
(P)
P38
CD4
Unstimulated
CD4+CD25neg cells
(a)
(b)
(c)
PMA-iono stimulated
CD4+CD25neg cells
rATG-stimulated
CD4+CD25neg cells
143
(P) P38 within CD4+ T cells
Unstimulated PMA/iono rATG rATG+Tac0
100120
140
160
180
MF
I of (P
)P38
(P) P38
Uns
timulat
ed
Uns
timulat
ed
PMA/io
no
PMA/io
no
rATG
rATG
rATG
+Tac
rATG
+Tac
0
100
150
200
250
gated on CD4+CD25+
gated on CD4+CD25neg
natural
CD4+CD25+
natural
CD4+CD25+
MF
I of (P
)P38
171179
V. D. K. D. Sewgobind et al.
370 © 2010 British Society for Immunology, Clinical and Experimental Immunology, 161: 364–377

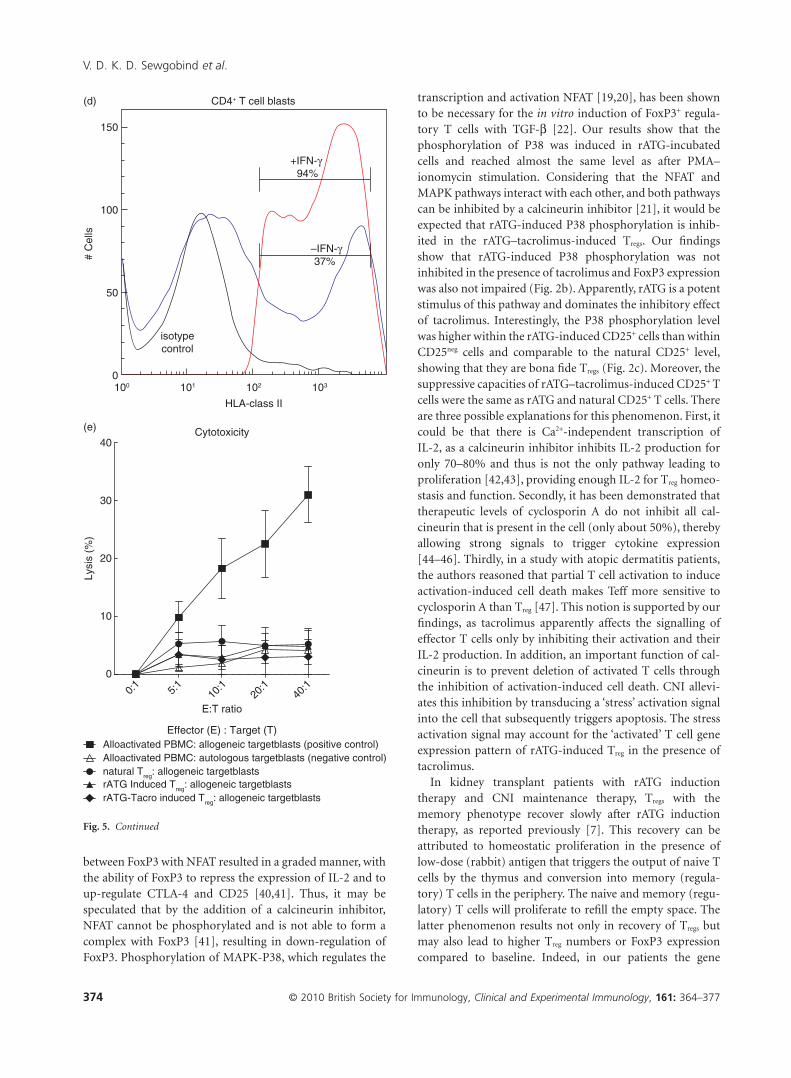
we performed a CML assay. Natural, rATG-induced andrATG–tacrolimus-induced CD25+ T cells were used as effec-tor cells and target blasts were generated in the presence ofIL-2 and IFN-g from autologous and allogeneic PBMC andlabelled with Europium. First, we checked the HLA-class IIexpression on T cell blasts. In the presence of IFN-g, T cellblasts abundantly up-regulated HLA-class II (Fig. 5d).Allogeneic-stimulated PBMC were able to lyse allogeneic butnot autologous target blasts. The percentage lysis of alloge-neic target blasts by natural, rATG and rATG–tacrolimus-induced CD25+ was comparable to that of the autologous
control, showing that they do not lyse allogeneic target blasts(Fig. 5e).
Gene expression profile of Tregs in kidney transplantpatients after rATG induction therapy
To confirm expression levels found in vitro in cells fromhealthy individuals, the mRNA expression patterns of thesame set of genes on CD25+ T cells from kidney transplantpatients who received rATG induction therapy were followedby maintenance therapy consisting of tacrolimus. A non-rATG group who received maintenance therapy alone servedas control, because their PBMC are composed of only naturalTregs and are not heterogeneous, as expected for the rATG-treated patients. The FACS-sorted CD4+CD25+CD127-/low Tcells of patients within the rATG group showed significantlyhigher expression of CD25 and FoxP3 than the same T cellsubset from patients in the non-rATG group (Fig. 6). More-over, the mRNA-expression levels of IL-10, IL-2, IFN-g, per-forin and granzyme B were also expressed highly in theCD4+CD25+CD127-/low from rATG-treated patients com-pared with the CD4+CD25+CD127-/low T cells from the controlgroup (Fig. 6). The mRNA levels of IL-27p28 and EBI3 werenot detectable in the patient samples.
Discussion
The main mechanism of action of most immunosuppressivedrugs is to down-regulate immune responses against alloan-tigen by effector T cells. However, it became apparent thatimmunoglobulins can serve as the trigger for cytokines as,for example, IL-10 or TGF-b in the microenvironment of Tcells to induce or expand Tregs.
In the present study, we explored the effect of immuno-suppressants that hamper the IL-2 pathway on inducibleregulatory T cells by rATG. We show that rATG induce CD25and FoxP3 expression both in the presence and absence oftacrolimus and Daclizumab (Fig. 1). These rATG–tacrolimusCD25+ T cells have the same phenotype (Fig. 1) and P38-phosphorylation levels (Fig. 2), exhibit equal suppressiveactivities (Fig. 3) and have similar gene expression patterns(Fig. 4) compared to rATG-induced CD25+ T cells, showingthat tacrolimus does not affect Treg induction negatively byrATG. The gene expression levels of rATG-induced CD25+ Tcells in the presence of tacrolimus even seem to be enhanced.When the gene expression levels were verified in kidneytransplant patients who received rATG-induction therapy,the in vitro data were confirmed (Fig. 6).
As it is well known that IL-2 expandsCD4+CD25brightFoxP3+ T cells in vitro [23–25], the role ofIL-2 in the development and homeostasis of FoxP3+ T cellswith suppressive function is inconclusive. Incubation ofhuman CD4+CD25neg T cells with IL-2 does not necessarilyresult in induction of CD25 or FoxP3 [26,27]. After activa-tion with anti-CD3/CD28 and IL-2, the FoxP3neg T cells
CD25
neg
+ (n
) CD25
+
+ rA
TG (I
) CD25
+
+ rA
TG-T
acro
(I) C
D25
+0
10 000
20 000
30 000
40 000
50 000
Pro
lifera
tion
[3H
]-th
ym
idin
e (
cpm
)
(mean ±
s.e
.m.)
(a)
(n) C
D25
+
rATG
-(I) C
D25
+
rATG
-Tac
ro-(I
) CD25
+
0
20
40
60
80
100
Inhib
itio
n (
%)
(mean ±
s.e
.m.)
(b)
Fig. 3. Suppression assays with natural (n) and rATG-induced (I) and
rATG-tacrolimus-induced CD25+ T cells. (a) Proliferative responses
after [3H]-thymidine incorporation are shown in counts per minute
(cpm) of CD25neg T cells in response to alloantigen (black bar) and
of CD25neg T cells in the presence of (n) CD25+ T cells (grey bar),
rATG (I) (dotted bar) and rATG–tacrolimus-induced (striped bar)
CD25+ T cells. (b) Percentage inhibition of the proliferation of
CD25neg T cells by (n) (grey bar), rATG-(I) (dotted bar) and
rATG–tacrolimus-induced (striped bar) CD25+ T cells.
Mean � standard error of the mean are shown for five healthy
individuals.
Treg induction by rATG and tacrolimus
371© 2010 British Society for Immunology, Clinical and Experimental Immunology, 161: 364–377
express FoxP3 only transiently but do not exhibit suppressiveproperties, showing that FoxP3 has to be expressed consti-tutively to induce regulatory activity [26,28,29]. In contrastto these results, it has been reported that FoxP3 is present inIL-2-/-, IL-2Ra-/- and IL-2Rb-/- Tregs that have a regulatoryfunction, while T cells from IL-2Rg-/- mice do not expressFoxP3 [9]. Thus, in line with our results using human cells,the direct (anti-IL-2) or indirect blockade of IL-2 (cal-cineurin inhibitor) still permits T cell signalling by othercytokines of the common g-chain (CD132) that may com-pensate for the absence of IL-2 and may provide signalsinvolved in the development, homeostasis and function ofTregs [10]. As it has been reported that blockade of the IL-2pathway or the expression of Th17-inducing cytokines (IL-6and IL-23) [30] may lead to the induction of Th17 cells andnot of regulatory T cells, we now show that FoxP3+ regula-
tory T cells are induced even in the presence of IL-2 pathwayinhibitors.
Antigenic stimulation alone is sufficient to induce conver-sion of conventional T cells into Tregs. This conversion takesplace at an even higher rate when IL-2 is blocked, resulting inreduced proliferation of naive T cells that will differentiateinto FoxP3+ Tregs [31]. Tregs that can be induced in the periph-ery upon encounter with antigen have been reported previ-ously; for example, the FoxP3+TGF-b-producing Th3 cellsand the FoxP3neg IL-10-producing Tr1 cells that up-regulateFoxP3 after antigen stimulation [4]. In our rATG–tacrolimusmodel, foreign rabbit antigens may serve as TCR trigger.However, although this resulted in an increased proportionof CD25, this was not associated with a higher proportion ofFoxP3 positivity when the IL-2 pathway was blocked. Thus,for the induction and development of FoxP3 expression,
Fig. 4. Relative mRNA expression patterns of
(n) (grey bar), rabbit anti-thymocyte globulins
(rATG) (I) (dotted bar) and rATG–tacrolimus
(I) (striped bar) CD25+ T cells for forkhead box
P3 (FoxP3), interleukin (IL)-10, Epstein–Barr
virus-induced gene 3 (EBI3), IL-27p28,
interferon (IFN)-g, perforin and granzyme B
for four healthy individuals. Error bars
represent mean � standard error of the mean.
Significance was tested by analysis of variance
(anova); FoxP3; P < 0·0001, IL-10; P = 0·0007,
EBI3; P < 0·0001, IL-27p28; P = 0·01, IFN-g.
P = 0·0008, perforin; P < 0·0001, granzyme B;
P = 0·0014, *P < 0·05.
Granzyme B
(n) C
D25
+
rATG
(I) C
D25
+
rATG
-tacr
o (I)
CD25
+0
1026466686
106*
*
[Gra
nzym
e B
/18
S]
ratio
*10
e6
IL-27p28
(n) C
D25
+
rATG
(I) C
D25
+
rATG
-tacr
o (I)
CD25
+0·0
0·1
0·2
0·3*
[IL-2
7p28/1
8S
] ra
tio*1
0e
6
Perforin
(n) C
D25
+
rATG
(I) C
D25
+
rATG
-Tac
(I) C
D25
+0
1
2
3
4
5*
*
[Pe
rfo
rin
/18
S]r
atio
*10
e6
IFN-γ
(n) C
D25
+
rATG
(I) C
D25
+
rATG
-tacr
o (I)
CD25
+0·0
0·5
1·0
1·5*
[IF
N-γ
/18
S]r
atio
*10
e6
*
IL-10
(n) C
D25
+
rATG
(I) C
D25
+
rATG
-tacr
o (I)
CD25
+02468
1012
**
[IL-1
0/1
8S
] ra
tio*1
0e
6
EBI3
(n) C
D25
+
rATG
(I) C
D25
+
rATG
-tacr
o (I)
CD25
+0
5
10
15
20
25 **
[EB
I3/1
8S
]ratio*1
0e
6
FoxP3
CD25
neg
(n) C
D25
+
rATG
(I) C
D25
+
rATG
-tacr
o (I)
CD25
+
(I) C
D25
neg
0
5
10
15 ***
[FoxP
3/1
8S
] ra
tio*1
0e
6
V. D. K. D. Sewgobind et al.
372 © 2010 British Society for Immunology, Clinical and Experimental Immunology, 161: 364–377

both gc-cytokines and T cell receptor (TCR) stimulation arerequired.
Interestingly, the protein levels of other cytokines of theIL-2 family, IL-7 and IL-15, are increased in the serum ofrenal allografts recipients during the early post-transplantperiod, as demonstrated by Simon et al. [32]. These othercytokines of the IL-2 family may thus bypass the function ofIL-2 itself to facilitate a certain FoxP3 expression and mayallow the induction of Tregs in the presence of a calcineurininhibitor in vitro and in vivo, as shown by our findings. IFN-gis highly expressed by rATG-induced Tregs. It has beendescribed previously that this cytokine may also play acrucial role in the function of induced Tregs in vivo [33,34].Furthermore, a convincing role has been attributed to per-forin and granzyme B in Tregs to mediate suppression andinduce tolerance [35,36]. However, the rATG- and rATG–tacrolimus-induced Tregs do not operate by cytotoxicity, asshown in Fig. 5e. There could be two explanations for theabsence of cytotoxic activity by the rATG-induced T cells.First, the frequency of granzyme B-expressing cells is lower
in the rATG-induced CD4+CD25+ T cells (11% mean,Fig. 5c) than in cytotoxic CD8+ T cells or natural killer (NK)cells (40% of CD8+ T cells and 50% of NK cells after stimu-lation [37]). Thus, to accomplish lysis of target blasts, thefrequency of granzyme B-expressing cells should be higher.Secondly, granzyme B expression in the induced Tregs ismerely a phenotypic marker of T cell activation and is notlinked to cytotoxic activities (cell granule exocytosis). Thelack of correlation between granzyme B expressing PBMC inenzyme-linked immunospot (ELISPOT) and cytotoxicactivities has also been found previously by our group [38],and has been shown in other human non-cytotoxicgranzyme B-expressing cells types [39]. In these cells and therATG-induced Tregs, granzyme B may have other non-apoptotic functions [39].
RATG-induced CD4+ and CD4+CD25+ T cells are charac-terized by high NFAT1-expression, as has been described byFeng et al. [6]. This observation clarifies the induction ofFoxP3 in these cells, thereby confirming FoxP3 expressionand regulatory activity. Disruption of the interaction
(b)
(a)
(c)
% Granzyme B
rIgG
(n) C
D25
+
rATG
(I) C
D25
+
Tac+r
ATG (I
) CD25
+0
10
20
30
% G
ranzym
e B
of
CD
25
+F
oxP
3+ (
mean ±
s.e
.m.)
% Granzyme B
rIgG
(n) C
D25
+
rATG
(I) C
D25
+
Tac+r
ATG (I
) CD25
+0·0
2·5
5·0
7·5
10·0
12·5
% G
ranzym
B o
f C
D4
+C
D25
+
(mean ±
s.e
.m.)
Granzyme B
22·4%
18·7%
3%
1%
101 102 103 104 105
Isotype control
Natural CD4+CD25+FoxP3+CD127lowrATG (I) CD4+CD25+FoxP3+CD127low
rATG-Tacro (I) CD25+FoxP3+CD127low
672·81
564·021061·07
1253·06
Subset Name Median, Comp-PE-A
Fig. 5. Flow cytometric analyses of granzyme B
expression (a) within natural (green curve),
rabbit anti-thymocyte globulins (rATG) (I)
(dark blue curve) and rATG–tacrolimus (I) (red
curve) CD25+FoxP3+CD127low T cells. The
marker represents the percentage of granzyme
B-positive cells. The table shows the median
fluorescence of granzyme B. (b) Percentage of
granzyme B-positive cells for three healthy
individuals and (c) percentage of granzyme
B-positive cells within CD4+CD25+ T cells of
three healthy individuals. Mean � standard
error of the mean (s.e.m.) is shown. (d) One
example of up-regulation of human leucocyte
antigen (HLA) class II on CD4+ T cell blasts
(gated on CD3+CD4+ T cells) in the presence of
interferon (IFN)-g. (e) Cytotoxicity assay with
natural, rATG and rATG–tacrolimus-induced
regulatory T cells (Treg) as effector cells (E) and
Europium-labelled target blasts (T). Natural
and induced Tregs are co-cultured with
allogeneic target blasts. Means � s.e.m. are
shown for six healthy controls.
Treg induction by rATG and tacrolimus
373© 2010 British Society for Immunology, Clinical and Experimental Immunology, 161: 364–377
between FoxP3 with NFAT resulted in a graded manner, withthe ability of FoxP3 to repress the expression of IL-2 and toup-regulate CTLA-4 and CD25 [40,41]. Thus, it may bespeculated that by the addition of a calcineurin inhibitor,NFAT cannot be phosphorylated and is not able to form acomplex with FoxP3 [41], resulting in down-regulation ofFoxP3. Phosphorylation of MAPK-P38, which regulates the
transcription and activation NFAT [19,20], has been shownto be necessary for the in vitro induction of FoxP3+ regula-tory T cells with TGF-b [22]. Our results show that thephosphorylation of P38 was induced in rATG-incubatedcells and reached almost the same level as after PMA–ionomycin stimulation. Considering that the NFAT andMAPK pathways interact with each other, and both pathwayscan be inhibited by a calcineurin inhibitor [21], it would beexpected that rATG-induced P38 phosphorylation is inhib-ited in the rATG–tacrolimus-induced Tregs. Our findingsshow that rATG-induced P38 phosphorylation was notinhibited in the presence of tacrolimus and FoxP3 expressionwas also not impaired (Fig. 2b). Apparently, rATG is a potentstimulus of this pathway and dominates the inhibitory effectof tacrolimus. Interestingly, the P38 phosphorylation levelwas higher within the rATG-induced CD25+ cells than withinCD25neg cells and comparable to the natural CD25+ level,showing that they are bona fide Tregs (Fig. 2c). Moreover, thesuppressive capacities of rATG–tacrolimus-induced CD25+ Tcells were the same as rATG and natural CD25+ T cells. Thereare three possible explanations for this phenomenon. First, itcould be that there is Ca2+-independent transcription ofIL-2, as a calcineurin inhibitor inhibits IL-2 production foronly 70–80% and thus is not the only pathway leading toproliferation [42,43], providing enough IL-2 for Treg homeo-stasis and function. Secondly, it has been demonstrated thattherapeutic levels of cyclosporin A do not inhibit all cal-cineurin that is present in the cell (only about 50%), therebyallowing strong signals to trigger cytokine expression[44–46]. Thirdly, in a study with atopic dermatitis patients,the authors reasoned that partial T cell activation to induceactivation-induced cell death makes Teff more sensitive tocyclosporin A than Treg [47]. This notion is supported by ourfindings, as tacrolimus apparently affects the signalling ofeffector T cells only by inhibiting their activation and theirIL-2 production. In addition, an important function of cal-cineurin is to prevent deletion of activated T cells throughthe inhibition of activation-induced cell death. CNI allevi-ates this inhibition by transducing a ‘stress’ activation signalinto the cell that subsequently triggers apoptosis. The stressactivation signal may account for the ‘activated’ T cell geneexpression pattern of rATG-induced Treg in the presence oftacrolimus.
In kidney transplant patients with rATG inductiontherapy and CNI maintenance therapy, Tregs with thememory phenotype recover slowly after rATG inductiontherapy, as reported previously [7]. This recovery can beattributed to homeostatic proliferation in the presence oflow-dose (rabbit) antigen that triggers the output of naive Tcells by the thymus and conversion into memory (regula-tory) T cells in the periphery. The naive and memory (regu-latory) T cells will proliferate to refill the empty space. Thelatter phenomenon results not only in recovery of Tregs butmay also lead to higher Treg numbers or FoxP3 expressioncompared to baseline. Indeed, in our patients the gene
Cytotoxicity
0:1
5:1
10:1
20:1
40:1
0
10
20
30
40
(e)
(d)
natural Treg
: allogeneic targetblasts
rATG-Tacro induced Treg
: allogeneic targetblasts
rATG Induced Treg
: allogeneic targetblasts
Alloactivated PBMC: allogeneic targetblasts (positive control)
Alloactivated PBMC: autologous targetblasts (negative control)
Effector (E) : Target (T)
E:T ratio
Lysis
(%
)#
Ce
lls
150
100
50
0100 101 102 103
HLA-class II
CD4+ T cell blasts
+IFN-γ 94%
–IFN-γ37%
isotype
control
Fig. 5. Continued
V. D. K. D. Sewgobind et al.
374 © 2010 British Society for Immunology, Clinical and Experimental Immunology, 161: 364–377

expression of FoxP3 was higher than in the non-rATGcontrol group (Fig. 6).
It should be taken into account that the FoxP3-inducedexpression in our model may represent a marker not only forTregs, but also for T cell activation. Our rATG-induced CD25+
cells expressed FoxP3+ at a lower level (19–31%) than naturalTregs (85%). Furthermore, according to their mRNA-patternthey show a somewhat ‘activated T cell’ phenotype. Thesedata emphasize that their phenotype does not fully resemblenatural Tregs. However, the suppression assays show thatrATG-induced CD25+ cells and natural Tregs have comparableregulatory activities. It is therefore essential to addresswhether the induced FoxP3+CD25+ T cells within the hetero-geneous CD25+ T cell population or CD25+FoxP3neg cellsexhibit suppressive activities. To date, it has not been possibleto study the function of human FoxP3+ T cells because it is anintracellular marker. Thus, phenotypical analysis or mRNAexpression analysis alone is not sufficient to classify cells intoa particular T cell subset. It is essential to examine the func-tion of T cells and combine these data with the phenotypeanalysis, as we have shown in the present study.
Taken together, in the present report we show that in thepresence of immunosuppressants that inhibit IL-2 (tacroli-mus) or IL-2 pathway inhibitors (anti-IL-2, anti IL-2Ra)indirectly it is still possible to induce Tregs by rATG that areidentical phenotypically, functionally and at the gene expres-sion level as Tregs that are induced by rATG in the absence ofthese immunosuppressants. Furthermore, it remains unclear
whether natural or induced Tregs are more important in theircontribution to donor-specific hyporesponsiveness aftertransplantation. More research needs to be conducted tocharacterize these rATG-induced T cells and to utilize fullytheir immunosuppressive properties to promote graftacceptance.
References
1 Waldmann H, Adams E, Fairchild P, Cobbold S. Infectious toler-
ance and the long-term acceptance of transplanted tissue.
Immunol Rev 2006; 212:301–13.
2 Walker LS, Chodos A, Eggena M, Dooms H, Abbas AK. Antigen-
dependent proliferation of CD4+CD25+ regulatory T cells in vivo.
J Exp Med 2003; 198:249–58.
3 Bloom DD, Chang Z, Fechner JH et al. CD4+CD25+FOXP3+regulatory T cells increase de novo in kidney transplant patients
after immunodepletion with Campath-1H. Am J Transplant 2008;
8:793–802.
4 Battaglia M, Stabilini A, Draghici E et al. Rapamycin and
interleukin-10 treatment induces T regulatory type 1 cells that
mediate antigen-specific transplantation tolerance. Diabetes 2006;
55:40–9.
5 Lopez M, Clarkson MR, Albin M, Sayegh MH, Najafian N. A novel
mechanism of action for anti-thymocyte globulin: induction of
CD4+CD25+Foxp3+ regulatory T cells. J Am Soc Nephrol 2006;
17:2844–53.
6 Feng X, Kajigaya S, Solomou EE et al. Rabbit ATG but not horse
ATG promotes expansion of functional CD4+CD25highFOXP3+regulatory T cells in vitro. Blood 2008; 111:3675–83.
Fig. 6. Relative mRNA expression patterns of
CD25, forkhead box P3 (FoxP3), interleukin
(IL)-10, IL-2, interferon (IFN)-g, perforin and
granzyme B within CD25+ T cells that were
isolated from peripheral blood mononuclear
cells (PBMC) of rabbit anti-thymocyte
globulins (rATG) (striped bars, n = 3) and
control patients (grey bars, n = 3). Data are
shown as mean � standard error of the mean.
Statistical significance was tested by
Mann–Whitney U-test, *P < 0·05.
CD25
rATG
Con
trol
0
20
40
60*
Rela
tive C
D25
mR
NA
expre
ssio
n
FoxP3
rATG
Con
trol
0
100
200
300*
Rela
tive F
oxP
3
mR
NA
expre
ssio
n
IL-2
rATG
Con
trol
0·00
0·02
0·04
0·06
0·08
0·10
Rela
tive IL-2
mR
NA
expre
ssio
n
Perforin
rATG
Con
trol
02468
101214 *
Rela
tive p
erf
orin
mR
NA
gene e
xpre
ssio
nIFN-γ
rATG
Con
trol
0·0
0·2
0·4
0·6
0·8
1·0
Rela
tive IF
N-γ
mR
NA
gene e
xpre
ssio
n
IL-10
rATG
Con
trol
0·0
0·5
1·0
1·5
2·0
Rela
tive IL-1
0
mR
NA
gene e
xpre
ssio
n
Granzyme B
rATG
Con
trol
0·0
0·1
0·2
0·3
0·4
Rela
tive g
ranzym
e B
mR
NA
gene e
xpre
ssio
n
Treg induction by rATG and tacrolimus
375© 2010 British Society for Immunology, Clinical and Experimental Immunology, 161: 364–377

7 Sewgobind VD, Kho MM, van der Laan LJ et al. The effect of rabbit
anti-thymocyte globulin induction therapy on regulatory T cells
in kidney transplant patients. Nephrol Dial Transplant 2009;
24:1635–44.
8 Louis S, Audrain M, Cantarovich D et al. Long-term cell monitor-
ing of kidney recipients after an antilymphocyte globulin induction
with and without steroids. Transplantation 2007; 83:712–21.
9 Fontenot JD, Rasmussen JP, Gavin MA, Rudensky AY. A function
for interleukin 2 in Foxp3-expressing regulatory T cells. Nat
Immunol 2005; 6:1142–51.
10 Maloy KJ, Powrie F. Fueling regulation: IL-2 keeps CD4+ Treg cells
fit. Nat Immunol 2005; 6:1071–2.
11 Wuest TY, Willette-Brown J, Durum SK, Hurwitz AA. The influ-
ence of IL-2 family cytokines on activation and function of natu-
rally occurring regulatory T cells. J Leukoc Biol 2008; 84:973–80.
12 Wang H, Zhao L, Sun Z, Sun L, Zhang B, Zhao Y. A potential side
effect of cyclosporin A: inhibition of CD4(+)CD25(+) regulatory T
cells in mice. Transplantation 2006; 82:1484–92.
13 Demirkiran A, Kok A, Kwekkeboom J, Metselaar HJ, Tilanus HW,
van der Laan LJ. Decrease of CD4+CD25+ T cells in peripheral
blood after liver transplantation: association with immuno-
suppression. Transplant Proc 2005; 37:1194–6.
14 Segundo DS, Ruiz JC, Izquierdo M et al. Calcineurin inhibitors, but
not rapamycin, reduce percentages of CD4+CD25+FOXP3+ regu-
latory T cells in renal transplant recipients. Transplantation 2006;
82:550–7.
15 Baan CC, van der Mast BJ, Klepper M et al. Differential effect of
calcineurin inhibitors, anti-CD25 antibodies and rapamycin on the
induction of FOXP3 in human T cells. Transplantation 2005;
80:110–17.
16 Roederer M. Spectral compensation for flow cytometry: visualiza-
tion artifacts, limitations, and caveats. Cytometry 2001; 45:194–205.
17 Sewgobind VD, van der Laan LJ, Klepper M et al. Functional analy-
sis of CD4+ CD25bright T cells in kidney transplant patients:
improving suppression of donor-directed responses after
transplantation. Clin Transplant 2008; 22:579–86.
18 Bustin SA. Absolute quantification of mRNA using real-time
reverse transcription polymerase chain reaction assays. J Mol
Endocrinol 2000; 25:169–93.
19 Round JL, Humphries LA, Tomassian T, Mittelstadt P, Zhang M,
Miceli MC. Scaffold protein Dlgh1 coordinates alternative p38
kinase activation, directing T cell receptor signals toward NFAT but
not NF-kappaB transcription factors. Nat Immunol 2007; 8:154–
61.
20 Wu CC, Hsu SC, Shih HM, Lai MZ. Nuclear factor of activated T
cells c is a target of p38 mitogen-activated protein kinase in T cells.
Mol Cell Biol 2003; 23:6442–54.
21 Matsuda S, Koyasu S. Regulation of MAPK signaling pathways
through immunophilin–ligand complex. Curr Top Med Chem
2003; 3:1358–67.
22 Huber S, Schrader J, Fritz G et al. P38 MAP kinase signaling is
required for the conversion of CD4+CD25– T cells into iTreg. PLoS
One 2008; 3:e3302.
23 Hoffmann P, Eder R, Kunz-Schughart LA, Andreesen R, Edinger
M. Large-scale in vitro expansion of polyclonal human
CD4(+)CD25high regulatory T cells. Blood 2004; 104:895–903.
24 Elpek KG, Yolcu ES, Franke DD, Lacelle C, Schabowsky RH,
Shirwan H. Ex vivo expansion of CD4+CD25+FoxP3+ T regulatory
cells based on synergy between IL-2 and 4-1BB signaling.
J Immunol 2007; 179:7295–304.
25 Hoffmann P, Eder R, Boeld TJ et al. Only the CD45RA+ subpopu-
lation of CD4+CD25high T cells gives rise to homogeneous
regulatory T-cell lines upon in vitro expansion. Blood 2006;
108:4260–7.
26 Wang J, Ioan-Facsinay A, van der Voort EI, Huizinga TW, Toes RE.
Transient expression of FOXP3 in human activated nonregulatory
CD4+ T cells. Eur J Immunol 2007; 37:129–38.
27 Zorn E, Nelson EA, Mohseni M et al. IL-2 regulates FOXP3 expres-
sion in human CD4+CD25+ regulatory T cells through a STAT-
dependent mechanism and induces the expansion of these cells in
vivo. Blood 2006; 108:1571–9.
28 Allan s.e., Crome SQ, Crellin NK et al. Activation-induced FOXP3
in human T effector cells does not suppress proliferation or cytok-
ine production. Int Immunol 2007; 19:345–54.
29 Zhou X, Bailey-Bucktrout SL, Jeker LT et al. Instability of the tran-
scription factor Foxp3 leads to the generation of pathogenic
memory T cells in vivo. Nat Immunol 2009; 10:1000–7.
30 Kimura A, Naka T, Kishimoto T. IL-6-dependent and -independent
pathways in the development of interleukin 17-producing T helper
cells. Proc Natl Acad Sci USA 2007; 104:12099–104.
31 Kretschmer K, Apostolou I, Hawiger D, Khazaie K, Nussenzweig
MC, von Boehmer H. Inducing and expanding regulatory T cell
populations by foreign antigen. Nat Immunol 2005; 6:1219–
27.
32 Simon T, Opelz G, Weimer R et al. The effect of ATG on cytokine
and cytotoxic T-lymphocyte gene expression in renal allograft
recipients during the early post-transplant period. Clin Transplant
2003; 17:217–24.
33 Levings MK, Sangregorio R, Galbiati F, Squadrone S, de Waal
Malefyt R, Roncarolo MG. IFN-alpha and IL-10 induce the differ-
entiation of human type 1 T regulatory cells. J Immunol 2001;
166:5530–9.
34 Wood KJ, Sawitzki B. Interferon gamma: a crucial role in the func-
tion of induced regulatory T cells in vivo. Trends Immunol 2006;
27:183–7.
35 Grossman WJ, Verbsky JW, Barchet W, Colonna M, Atkinson JP,
Ley TJ. Human T regulatory cells can use the perforin pathway
to cause autologous target cell death. Immunity 2004; 21:589–
601.
36 Gondek DC, Devries V, Nowak EC et al. Transplantation survival is
maintained by granzyme B+ regulatory cells and adaptive regula-
tory T cells. J Immunol 2008; 181:4752–60.
37 Bratke K, Kuepper M, Bade B, Virchow JC Jr, Luttmann W. Differ-
ential expression of human granzymes A, B, and K in natural killer
cells and during CD8+ T cell differentiation in peripheral blood.
Eur J Immunol 2005; 35:2608–16.
38 van Besouw NM, Zuijderwijk JM, de Kuiper P, Ijzermans JN,
Weimar W, van der Mast BJ. The granzyme B and interferon-
gamma enzyme-linked immunospot assay as alternatives for
cytotoxic T-lymphocyte precursor frequency after renal
transplantation. Transplantation 2005; 79:1062–6.
39 Romero V, Andrade F. Non-apoptotic functions of granzymes.
Tissue Antigens 2008; 71:409–16.
40 Mantel PY, Ouaked N, Ruckert B et al. Molecular mechanisms
underlying FOXP3 induction in human T cells. J Immunol 2006;
176:3593–602.
41 Wu Y, Borde M, Heissmeyer V et al. FOXP3 controls regulatory T
cell function through cooperation with NFAT. Cell 2006; 126:375–
87.
42 Roifman CM, Mills GB, Cheung RK, Gelfand EW. Mitogenic
V. D. K. D. Sewgobind et al.
376 © 2010 British Society for Immunology, Clinical and Experimental Immunology, 161: 364–377

response of human thymocytes: identification of functional Ca2+-
dependent and independent signals. Clin Exp Immunol 1986;
66:139–49.
43 Schwarz EC, Kummerow C, Wenning AS et al. Calcium depen-
dence of T cell proliferation following focal stimulation. Eur J
Immunol 2007; 37:2723–33.
44 Nikolic B, Zhao G, Swenson K, Sykes M. A novel application of
cyclosporine A in nonmyeloablative pretransplant host condition-
ing for allogeneic BMT. Blood 2000; 96:1166–72.
45 Furtado GC, Curotto de Lafaille MA, Kutchukhidze N, Lafaille JJ.
Interleukin 2 signaling is required for CD4(+) regulatory T cell
function. J Exp Med 2002; 196:851–7.
46 Akl A, Luo S, Wood KJ. Induction of transplantation tolerance –
the potential of regulatory T cells. Transpl Immunol 2005; 14:225–
30.
47 Brandt C, Pavlovic V, Radbruch A, Worm M, Baumgrass R. Low-
dose cyclosporine A therapy increases the regulatory T cell popu-
lation in patients with atopic dermatitis. Allergy 2009; 64:1588-96.
Treg induction by rATG and tacrolimus
377© 2010 British Society for Immunology, Clinical and Experimental Immunology, 161: 364–377