


Bahasa
Halaman
Hukum


6zet
Bankacr,k sahasrnda maliyet ga,gmalarrnrn gogu, bankacrlrk kurumlarrigin nispeten dugtik grktr duzeylerinde olgek ekonomilerinin oldulu sonucunavarmrglardrr' Dorayrsryra, bu kurumrarrn en kugLik, en uzmanragmrg oranrarrnrn,daha buyLik ve daha farkrrragmrg kurumrara kargr bir mariyet dezavantajra,olabilir' Diler taraftan, bankacrrrk end,strisinde yo$unragma-fiyat garrgmara.,yofunragma ve fiyat arasrnda g,grti bir irigki burmugrardrr. Gerenekser origoporteorisini de destekrer niterikte, satrg fiyararrnrn yo!unlagma ire arttr!r, arrqfiyatlannrn ise yo$unlagma ile dugtugu gortilmugtur. Bu galrgma, yatay bankabirregmererini daha iyi anariz edebirmek igin, konuyra irgiri yaprrmrg ampirikgalrgmalarrn bir krsmrnrn incelenmesinden sonra, Turk bankacrrrkend0strisinde yo$unlagma derecesini hesaplamayr konu edinmigtir. Sonugolarak, Turk (ticari) barkacrrrk endLrstrisinin nisbeten rekabetgi bir piyasayaprsrna sahip oldugu, ancak sonuglarrn yine de oldukga itinalr olarakyorumlanmasr gerektigi belirtilmigtir.

HOR:ZONTAL BANK MERGERS: EMP:RICAL STUDIES ANDAPPL:CAT10N FOR THE TURKiSH BANKING :NDuSTRY
Ekrem Donek*
1. INTRODUCTION
Horizontal bank mergers have been explored in dozens of empirical studies
since the early 1960s. A subset of these studies has concentrated on reductions in
bank costs, elaborating economies of scale and scope at these institutions. On the
other hand, concentration-price relationship in banking industry have been of
considerable research interest for some researchers.
While the increasing number of bank mergers have led new legislations,
such as the Bank Holding Act (1956) and the Bank Merger Act (l960), these
changes in laws and regulations have caused to lift some restrictions on interstate
banking and intrastate branching in the United States. This was an opportunity for
commercial and depository financial Institutions to extend their operations. This
development might allow a small number of large diversified institutions to
dominate the industry. With this market structure, they will of course have a cost
advantage relative to the small but large part of the industry, increasing loan rates
and decreasing deposit rates. Then, this will be a misallocation for the financial
institutions and for a whole society (Clark, 1988: 16).
This should be an important interest of regulators and managers to get more
correct information to make an appropriate decision on mergers, acquisitions, and
so on (Goldstein, at al, 1987: 199). Furthermore, when we think that every individual
economic agent in the economy has an important connection with these institutions,
we can imagine how the cost and concentralion-price studies in banking have
become an attractive interest of researchers over 30 years.
On the other hand, regional banking is one of the important concern of the
concentration-price relationship; some bank prices are determined in local markets
such as check charges and time deposit interest rates' Also, monopolization of the
'Yard. Dog. Dr., Erciyos Universitesi, lktisadi ve ldari Bilimler Fakultesi, lktisat Bolomu.
The aulhor would like to thank Proressor James MacDonald lor his helpful assistance andcritiques during the study.

banking market is the biggest issue. All these issues are so impodant things thataffect the people's daily life.
This paper will attempt to provide the basic theory of mergers (and of coursethe theory of oligopoly) and a review and analysis of some of the empirical literatureon both cost studies and concentration studies in banking cited in the references,and later on an empirical study on the Turkish commercial banking industry willtake place.
2. MERGERS AND THE THEORY OF OLIGOPOLYThe price theory simpry teils us that as firms go away from perfectry
competitive market, they will lead to market power and reduce the marketcompetition. ln these circumstances, the quantity produced will be less and theprice will be higher than the perfectly competitive market. For example, if there aretwo producers in the market, they will produce z/3 of the market (each producing'1 ,/3 of the market), which is less than the competitive market. But the prices will behigher than the competitive one (cournot duopoly analysis). lf there is only oneproducer (monopoly), it will produce less than duopoly but charge higher price thanit. Because, the market price will be no longer given to the firm; it faces adownward-sloping demand curve for its products. The price will be higher thanmarginal cost. Thus, as the firms collude, it will lead to a market power.
The relationship between concentration and price was the main concern ofclassical oligopoly theory. Most oligopoly theory predicts that price will rise withconcentration. For instance, according to chamberlin, "many small sellers actindependently as purely or monopolistically competitive firms, but as their marketshares rise, there comes to a point where they recognize their independence and
begin to act collusively. This means that at higher levels of concentration, they will
price in response to the industry's demand curve" (Weiss, 1989: 2). Also, Stigler
argued that "firms with large market shares can detect secret price cutting by rivals
than small firms, and the ability of leaders to identify secrel price concessions
increases at an increasing rate with concentration" (Weiss, 1g89: 2). Many studieshave tried to test this traditional oligopoly concentration-price theory over three
decades.
Mergers can be seen in different forms. A "vertical merger,' occurs when the
output of one firm is an input of the other firm. Purchasing an autoparts producer
firm by an automobile producer firm is an example of vertical mergers. lf two firms in
うん

unrelated markets form a single firm, such as a firm of lextile and a firm of tobacco, it
is called "conglomerate merge/'. Finally, when a firm purchase its competitor in the
same market, it is called "horizontal merger''. Purchasing an international airline
company by another international airline company or purchasing a commercial
bank by another commercial bank, forming a single company or bank, is an
example of horizontal merger.
To understand the sources of mergers and effective market power, we need
to analyze important barriers to entry. There are three major barriers to entry. One,
legal barriers erected by governments through an exclusive franchise (public
utilities, cable television, such as'ClNE5" in Turkey), public ownerships [(PTT, State
Economic Enterprises such as Etibank and lnstitution of Machinery and Chemicals
lndustry (MKEK)1, patents, copyrights, licences, and some other exemptions. Two,
natural barriers to entry, happening in two forms: One is the natural monopoly
coming from the nature of nonproducibility of some natural resources and minerals
such as, crude oil and iron ore. Another one is economies of scale in production.
Especially the last type of entry can be seen in many induslries in many countries
such as automobiles, beer and cola. Since the efficient scale of operation in these
markets is very high, entry to these industries will not be so easy for the new
investors. The final type of barrier to entry is a behavioral one' coming true by a
strategic decision of the succeslully operated firms such as product differentiation,
limii pricing and investment in excess capacity (Tresch, 1994: 467-469).
When the mergers during the nineteenth century gave birth to some
important U.S. companies such as General Motors, IBM and Standard Oil, the
Federal Government of the U.S. began to control the market power of rapidly
spreading mergers in 1890 first with the Sherman Antitrust Act. This act regulates
ihe,contracts, combination or conspiracy in trade or commerce such as price fixing
and any kind of cartel, forbids anyone from any action of monopolizing trade and
commerce, and allows individuals or firms that suffer from the violatton of the above
regulations and restrictions to sue for triple damages. The second act is the Clayton
Antitrust Act of 1914, aiming to remedy a serious defect of the sherman Act. The
thiid act is the Federal Trade Commission Act of 1914. lt creates an independent
commission and gives it authority to enforce the substantive provisions of both this
act and the clayton Act. The Robinson-Patman Act of 1936, which is the fourth act,
intents to protect Smaller retailers from chain stores although the small one are less
efficient. Finally, the Celler-Kefauver Act of 1950 brings another restrictlons on the

firm violating the others competition right buying the other's assets (Tresch, 1994:
487-489; Ragan and Thomas: 737-740).
Now, we can understand better how the issue is so important for almost
every individual economic agent: On the one hand, mergers will lead to market
power, which may causes cost reduction in the firm, and lack of competition in the
industry; in turn, it will cause a misallocation, which will harm both the sources of
banking industry and its consumers. On the other hand, if the concentration
increases the prices, like the theory says, the other parties will have been again
harmed. Therefore, it should be analyzed very carefully.
3. ECONOMIES OF SCALE
There are two types of production economies: (i) Economies of scope, which
is related to the.ioint production; and (ii) economies of scale, which is associated
with firm size. That is, "economies of scale exist if per-unit or average production
costs decline as output rises" (Clark, 1988: 17).
Two kinds of economies of scale can be seen: (i) Overall (global) economies
of scale, which is associated with increases in all of a firm's outputs, so that a firm's
average cost declines as production increases (Rossi, 1991: 5); and (ii) product-
specific economies of scale, which is related to the increases in the production of
individual products.
It can be mentioned from three major economies of scale at the financial
institutions (clark, 198B: 18). They are briefly: (i) using more specialized labor in
the production process, (ii) increasing computer and telecom m unications
technology in transactions, and (iii) linally, information'
4. COST STUDIES IN BANKING
There are many studies regarding cost reductions in banking industry since
early 1960s. Each study has tries to estimate economies of scale and scope,
usually measuring both of them, for credit unions, savings and loan associations, or
commercial banks. They employ similar measures of economies of scale and
scope, and use a translog cost funclion since it is llexible enough to yield both
economies and diseconomies of scale and scope at ditferent output levels.
ln the literature, while some researchers have measured both overall and
product-specific economies of scal€, some others tried only one of them (usually,
overall economies of scale). Also, some of the studies have investigated the issue
in a multiproduct context. For example, the studies by Murray and white (1983), Kim

(1986) and Cebenoyan (1988) have been done in a maltiproduct context for credit
unions; the first study measures only overall economies of scale, and the second
one measures both overall and product specific economies of scale. But, the study,
for example, by Goldstein, et al (1987) has been done for savings and loan
associations.
Considering model, the transcendental logarithmic (translog) cost funclion,
which is a Taylor series expansion in output quantities and input prices is a widely
used model in the field as in the studies above. Because, it allows the researchers
to enter the various outputs as separate variables and does not force them to treat
the hypothesis of homogeneity and constant elasticity of substitution. The translog
function also provides a second order approximation to any twice-differentiable
function, so that the production technology of multiproduct financial instilution can
easily be modelled with maximum flexibility. Translog function is flexible to use
because of its advantages to permit to estimate U-shaped cost curves and separate
scale and branch economies, and also to allow the cost elasticities to vary by size
of f inancial institutions-.
Total costs are defined somewhat similar to each other; as all labor and real
capital expenses, as well as the interest and dividends paid to depositors and
shareholders [Murray and White (1983) and Kim (1986)], labor and real capital
expenses [Cebenoyan (1988)] and expenditures on personnel, office occupancy,
and all other ope-rating expenses (interest expense is excluded) [Goldstein af a/
(1e87)1.
Different measurements are used for output. Murray and White (1983) and
Kim (1986) employ three output variables: Mortgage lending, other loans, and
investments in excess of minimum liquldity requirements. Each of them equal to the
average of its beginning and end-of-year dollar values. Cebenoyan (1988)
* The study by Goldstein at al (19871 measures scale economies in two ways; lhe usual scaleeconomy rieasure (SCE), and the augmented scale economy measure (SCE'). SCE' coversSCE:
SCE' = SCE + ScB (z), (1)
whereSCE = lnO/'lnO = Pq + hq lnQ + Pbq lnB, e\scB = lnc/'lnB = pb + pbb lnB + pbq lno, (3)
(a measure ol olfice economies)Z = regression coellicient lrom the auxiliary regression,tne = i+ z (lnO) (4)
Therefore, SCE: measures the elaslicity of cost with respect to output with branch
expansion. since scE'includes both output and branch expansion, it will always be greater than
SCE (only output expansion).
ζυ

meusures output as total deposit and total loan accounls, and Goldstein at al(1 987) employs total asset of the institutions for outpLrt.
As far as price variables are considered, Murray and White (1983) and Kim
(1986) employ four variables for input prices: The unit price of capital is sum of the
ma.jor capital expenses such as rent, depreciation, and utilities. The unit cost of
labor is an average hourly rate based wage and salaries. The price of demand
deposit is an effective interest rate paid to demand deposits. Finally, the price of
term deposits is a combination of the interest paid on term deposits, member
shares and so on. On the other hand, Cebenoyan (1988) measures input prices as
the sum of labor and capital expenses.
Beyond these commonly used variables, Goldstein at al (1987) use number
of offices operated by the individual institution representing the branches operated
by the inslitution, and a vector of other factors influencing operating costs. Under
the last variable, they use eight significant variables. Also, Munay and White (1983)
and Kim (1986) use some other control variables such as "Branch" (to see any cost
differences between bank branches), "Risk" (to capture the effect of risk differences
on credit unions), and "Growth" (to see the cost effect of short-term disequilibrium).
Munay and White (1983) found economies of scale in most of their credit
unions in their sample. They got no evidence to support the imposition of
homotheticity, unitary elasticity of substitution, or constanl returns to scale
condltions on credit union produclion functions.
Kim (1986)'s results showed that there are mild overall economies of scale
for the "average" credit union, while the study by Murray and White (1983) found
overall economies of scale for almost "all" credit unions. lt is possible that the
difference is coming from the fact that Murray and White (1983) estimated the
translog multiproduct function for both the system estimation and the single
equation estimation methods while Kim tested it only for the system estimation. Kim
(1 986)'s results also suggest modest product-specif ic economies of scale
associated with mortgage loans, substantial diseconomies of scale associated with
non-mortgage loan services, and constant returns to scale with respect to
investment activilies. Finally, product-specific diseconomies of scale with respect to
non-mortgage loans together with economies of scope brought him to the
conclusion that British Columbia credit unions are subject to natural monopoly.
6

Table 1: Summary of the Cost Studies in Banking
Studles lssu e Model Data ResultsMurrayWhte(1983)
- Multiproductcontext- Credit unions- Only overaleconomies of scale
Translogcostfu nct io n
- Total costs (Sum oflabor and real capitalexpenses)- Output (Mortgagelending Yr, non-modgage loans Y2,investment activit. Y3)- lnput prices (Unitprice of capital, unitcosl of labor, price ofdemand deposit andprice of term deposit)- Control variables
- There exist (overall)economies of sca lein most of c red itunions.
Kim(1986) - Multiproductconlext- Credit unions- Both economiesof scale
Translogcostlu nctlon
- Total costs (Sum oflabor and real capitalexpenses)- Outpul (Mortgagelending Y1 , non-mortgage loans Y2,investment activitiesYe)- lnpul prices (Unitprice of capital P1,unit cost ol labor P2,price of d emanddeposit P3 and priceof term deposit P4)- Control va riab les(Such as Branch, Biskand Growth)
- There exist mildoverall econ. of scalefor the averagecredit unions.- Modest p rod uct-s pecil jc econ. ofscale assoc. with Y1.- Substantial d is-econ. of scale assoc.with Y2- Constant returns toscale wlth resp. to Y3- Product-specific dis-economies of scalewith respect to Y2- Econom. of scope- British Colum. creditunions are subject tonatural monooolv.
Cebenoyan(198o
‐Multiproductcontext
Tran slogcostlunction
- Total costs (Sum oflabor and capitalexpenses)- Output (Total depositand total loanaccounts)- lnput prices (laborand capital factorexoenses)
- Economies ol scaleare exhausted afterS25 million ofdeposits for unitbanks.- As lor branchbanks, economies olscale don't exist foranv size.
Goldstein ar a′
(1987)
- Savings andLoans (S&L)industry
Translogcostfunction
- Total costs(personnel, of liceoccupancy, and allother operatingexpenses (in te restexpense is excluded)- Output (Total assetof the institutions)- Branches (number ofolflces operated bythe individualinstitution)- Other factors (Avector ol other tactorsinf luen-cing operatingcosts)
- There exist econ. ofscale throughout allsize classes,/ ra n gesol output.- Expansion th roughbranches in thesmaller size classeshas a greater impacton operating coststhan in the la rge rsize classes.- Stock in stitutio nstend to have opera-tin g costs almost1o% higher thanmutual institutions.
7

The results of Cebenoyan (1988) indicate that economies of scale are
exhausted after $25 million of deposits for unit banks in the United States. As for
branch banks, economies of scale don't exist for any size. Also, he did not flnd any
significant evidence for a U-shaped average cost curve for $25-$50 million deposit
size class. He categorizes all these banks as being inefficient in costs.
Goldstein, at al (1987) compare the results of the usual scale economies
(SCE) and the augmented scale economies (SCE'). Their findings are so similar:
The elasticities are significantly less than 1 in all cases, indicating the presence of
economies of scale throughout all size classes/ ranges of output. The only
difference is that the SCE' estimates are sharply higher than the SCE estimates in
the smaller size classes, which means that expansion through branches in the
smaller size classes has a grealer impact on operating costs than in the larger size
classes. Also, stock institutions tend to have operating costs almost 10 percent
higher than mutual institutions. Findings of Goldstein, at al (1987) are similar to the
earlier sludies of scale economies of savings and loan institutions. Because, they
indicate economies of scale throughout all ranges of output. The difference
between these S&L studies and the recent commercial bank studies (indicating
diseconomies of scale beyond $25 million) may be due to the fact that they have
different sizes. Therefore, based on this study, policies which encourage larger size
firms in the industry need not to be discouraged on the basis of obvious
diseconomies of scale.
5. CONCENTRATION.PRICE STUDIES IN BANKING
There are many studies published on concentration-price relationship in
banking, Weiss reports the number at least 34 as of 1987. Most of them employ the
data created by questionnaires or tabulations of Federal Beserve System in the
U.S. (Weiss, 1989: 219). They were done for different banking markets and prices'
such as branch banking, rural banking, and winning depositors; and loan interest
rates, mortgage interest rates, dePosit interest rates, demand deposit service
charges.
Almost all the studies in the concentration-price area in banking use a linear
regression function. They also calculale Herfindahl lndex (Hl) and different
concentration ratios depending on the number of firms taken into account. For
instance, Bell and Murphy (1969) regresses price on marginal cost and
concentration linearly, Berger and Hannan (1989a) regresses price (interest rate)
8

on concentration and a vector of control variables linearly, and finally, Berger andHannan (1989b) regresses Money Market Deposit Account (MMDA) rate on s-firmdeposit concentration ratios (CR1, CR2, CR3, CR4 and CRS), Hl, Square root of Hl(RTH) and 2 dummy variables linearly again.
Different measures are used for price. For example, Berger and Hannan(1989a) employs six dilferenl interest rates and Berger and Hannan (l9g9b)employs Money Market Deposit Account (MMDA) rate only. Also, differentmeasures of concentration ratios have calculated: While Berger and Hannan(1989a) employ the three{irm concentration ratios (CR3), Berger and Hannan(1989b) employ 5 different deposit concentration ratios (CRl, CR2, CR3, CR4 and
CRS). These kinds of studies also calculate Herfindahl lndex (Hl) and some othercontrol variables and dummy variables.
The results of Bell and Murphy (1969) show that there is a positive,
significant effect of cost on prices, which supports their argument. Also,
concentration has a consislent, positive and statistically significant effect on price.
This causes a dilemma for lhe authorities: On the one hand, while the bank mergers
lower costs which should reduce prices, because of economies of scale in banking;
on the other hand, the merger increases concentration and causes higher prices.
This will be a serious problem for the policy makers. Another finding is that there is
no difference among the various measures of concentralion. Finally, they found that
"large accounts have wide geographical alternatives, and the competitive situation
in local markets would not affect these accounls".
Berger and Hannan (1989a) is a very detailed study and tries to use different
variables and ways to see the differences. The study tests "the structure-
pedormance hypothesis" (SPH), which predicts that prices will be less favorable to
consumers in concentrated markets since the markets are not competitive. ln
contrast, the usual form of "the efficienLstructure hypothesis" (ESH) predicts that
prices are more favorable to consumers in concentrated markets since the
production in such markets is more efficient. One important finding of the study is
that banks in more concentrated markets pay lower deposit rates, which is
consislent with the implication of SPH, rather than ESH. Onother important finding is
that the difference in deposit rates in concentrated and unconcentrated markets is
strongly related to the aggregate level of interest rates.
9

Table 2:Summary Ofthe COncentra‖on― Price Studies in Banking
Studles lssue Model Data FiesultsBe‖ &Murphy(1969)
Regressingprice onmarginalcost &concentra-tion (linearly)
- Price- Marginal cost- Concentration
- A positive, signilicant eftect ofcost on prices.- Concentration has a consislent,positive and statistically signif icanteflecl on price.- There is no difference among thevarious measures ol concentration.- Large accounts have widegeographical allernatives, and thecompetitive slluation in localmarkets would not arfect theseaccounls.
Berger &Hannan(1989a)
Testrng andcomparing"the structure-performancehypothesis"(SPH), and"the eflicient-structurehypothesis"(ESH)
Reg ressin gprice(inlerestrate) onconcentrati-on & avector ofcontrolvariables(linearlv)
- Price (sixdiff erentinlerest rates)- Concentrationlboth 3-lirmconcentrationratio (CB3) &Hedindahlrndex (Hl)l- Control var.
- Banks in more concentratedmarkets pay lower deposit rales,which is consistent with theimplication of SPH, rather thanESH.- The difrerence in deposit rates inconcentrated and unconcentratedmarkets is strongly related to theaggregate level ol interest rates.
Berger &Hannan(1989b)
Examining therelationshipbetween localmarketconcentrationand pricingbehaviour inthe bankingindustry withinthe sameyear, focusingon the ratesofrered bybanks forMMOAS.
RegressingMMDA rateon 5‐ firmdepositconcentra‐
tion ratios
(CRl, CR2,CR3,CR4&CR5), Hl,Square rootol HI & 2dunnmyvariablos
(‖ nearly)
‐Pttce IMoneyMarket DeposIAccount(MMDA)ratel‐ Firm deposIconcentrationratlo (5‐ CRs:CRl, CR2,CR3,CR4 andCR5)‐HI‐ Square rootof HI(RTH)‐ 2 dummyvariables
- The results have supported SPH,suggesting a strong, statisticallysig nilica nt relationship betweenmarkel structure and bank prices.- The |ive CRs, Hl & RTH werefound similar in both adlusted Fl2and predjcted quantitative effectsof concentration.- The lwo dichotomous measuresof concentration (dummy var.) havethe hlgher adjusted 82, but smallerpredictions for the maximum effectof concentration than the othervariables.
Finally, the findings of Berger and Hannan (19Bgb) supports SPH,
suggesting a strong, statistically significant relationship between market structure
and bank prices. The tive CRs, Hl, and RTH are found similar in both adjusted
R-squares and predicted quantitative effects of concentration.
6. SOURCES OF THE DIFFERENCES IN THE RESULTS
There are some differences in the results among the studies. These
differences stem from different sources, such as the data, variables, model and
estimation techniques, conlext, and markets considered in the study.
The results may differ because of the "data" that they used. Because; (i) each
data set have different calculation and collection methods. (ii) Also' they may race
10

different econometric problems depending on what kind of data they used. Forexample, if data is cross-section, they might have a heteroscedasticity problem; or ifdata is time-series, they might have a serial correlation problem. (iii) The period ofdata may also differ the results. (iv) The size and the content of sample charactermay differ from study to study. (v) Finally, the environment of data may affect the
results. Because, the institutions may be different in different countries.
They have used different "variables", including control variables. Especiallydifferent interest rates are paid to different groups. Even they employed the samevariables, definitions of them were not same. This may lead to different results andconclusions. Almost all of them used cost and output varlables, but the contents ofthem were different. For example, while the interest expenses were included in the
study by Murray and White (1983), they were excluded in Goldstein, at al (1987).
Another source of differences in the results may come from the,,model and
estimation techniques" employed in each model. (i) They all may use the translog
cost function; but econometrically, restrictions on the lunction and share equations
are very important. Recently, Cebenoyan ('l 988) proved that the incorrect
specification of homogeneity restrictions on the translog cost functions are leading
to different results. (ii) The disagreement among the researchers on the
measurement of overall and product specific economies of scale may differ the
results, like Goldstein, at al (1987)'s two types measurement of scale economies.
(iii) Finally, what kind of estimalion techniques have been used, single or system
equations; or Maximum Likelihood, Three Stage Least Squares (3SLS), or Zellner's
iterative method (SUR), may be the source of difference, such as the different
results between the studies of Murray and White (1983) and Kim (1986).
The difference may come from the "context" that the study was done. For
example, if it was done in a multiproduct context, it would cause a different
estimation of economies of scale.
Finally, if the studies have been done for different "markets", such as credit
unions, Savings and Loan institutions, and commercial banks, that may cause
different results. This is very important especially for the concentration-price studies;
usually differences come from being difterent markets. As we mentioned earlier,
Weiss reported different results for ditferent markels. For example, the relationship
was strong for demand deposit service charges, because "banks discriminated
when they are few enough to conlrol their prices, and that means they raise prices
most where customers resist least-on check charges, of all things" (Weiss, 1989:
11
260). He also reported that, during the time that the studies tor time deposit interest
rates were done, there was a ceiling on them. There was no relationship when the
ceiling was tight, at other times, cR tented to reduce time deposit interest rates
(Weiss, 1989: 260).
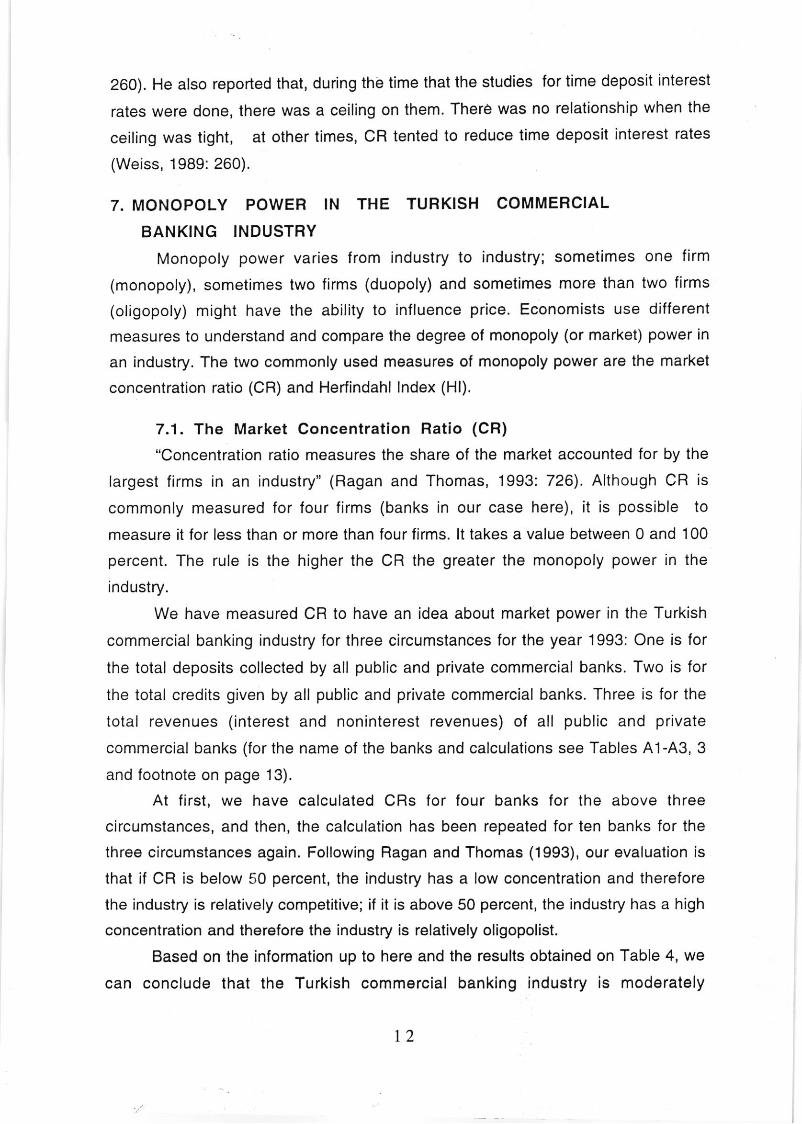
7. MONOPOLY POWER IN THE TURKISH COMMERCIAL
BANKING INDUSTRY
Monopoly power varies from industry to industry; sometimes one firm
(monopoly), sometimes two firms (duopoly) and sometimes more than two firms
(oligopoly) might have the ability to influence price. Economists use different
measures to understand and compare the degree of monopoly (or market) power in
an industry. The two commonly used measures of monopoly power are the market
concentration ratio (CR) and Herfindahl lndex (Hl).
7.1, The Market Concentration Ratio (CR)
"Concentration ratio measures the share of the market accounted for by the
largest firms in an industry" (Ragan and Thomas, 1993: 726). Although CR is
commonly measured for four firms (banks in our case here), it is possible to
measure it for less than or more than four firms. lt takes a value between 0 and 100
percent. The rule is the higher the CR the greater the monopoly power in the
industry.
We have measured CR to have an idea about market power in the Turkish
commercial banking industry for three circumstances for the year 1993: One is for
the total deposits collected by all public and private commercial banks. Two is for
the total credits given by all public and private commercial banks. Three is for the
total revenues (interest and noninterest revenues) of all public and private
commercial banks (for the name of the banks and calculations see Tables A1-A3, 3
and footnote on page '13).
At first, we have calculated CRs for four banks for the above three
circumstances, and then, the calculation has been repeated for ten banks for the
three circumstances again. Following Ragan and Thomas ('1993), our evalualion is
that if CR is below 50 percent, the industry has a low concenlration and therefore
the industry is relatively competitive; if it is above 50 percent, the industry has a high
concentration and therefore the industry is relatively oligopolist.
Based on the information up to here and the results obtained on Table 4, we
can conclude that the Turkish commercial banking industry is moderately
う4

competitive and has relatively low CRs in terms of all above three circumstances,
namely total deposits, total credits and total revenues lor four banks (CR4).
Because, the CR4 is %46.16 for total deposits, "/"48.65 for total credits and "/"45.65
for total revenues. On the other hand, the ten banks* concentration ratios (C810) for
the three circumstances give a highly concentrated industry picture. Because, the
CR10 is %77.29 for total deposits, %77.88 for total credits and %77.37 for total
revenues. Therefore, the results of the CRs need to be interpreted very cautiously**.
Table 3:Four Banks That Have The Highest Market Shares
ln: Total Deposits Total Credns Total Revenues
B
A
N
K
T .C. Ziaal Bankasr f .C. Ziraal Bankasr T.C. Ziaal Bankasr
T. Emlak Bankasr T. Emlak Bankasr T Halk Bankasl
T is Bankasl T.|§ Bankas, Akbank
Yapr ve Kredi Bankasr Yapr ve Kredi Bankasr T is BankasI
Source: Tables 41, A2 and 43.
7.2. The Herfindahl lndex (Hl)
Another commonly used measure of monopoly power is the Herfindahl lndex
(Hl), which sums the market shares of all firms in the industry. Hl takes the sum of
the squares of each firm's market share.
Hl = 2512 = (S1)2 + (S2)2 + (S3)2 + ......... + (S)2 + .........+ (Sn)2
where Si is the market share of each (i th) firm, expressed as a decimial function,
and n is the number of firms (commercial banks) in the industry.The possible values
of the Hl vary between 0 and 1, indicating the market structures from purely
competitive to purely monopoly. According to the generally accepted guidelines, if
the Hl is higher than %18, the industry is accepted as highly concentrated, and if
the Hl is less than %10, the industry is accepted as competitive. For horizontal
mergers, the followed guideline (by the U.S. Justice Department) is that if the Hl ishigher than 7"10, there is a substantial monopoly power in the industry, and if the Hl
is less than %10, there is a competitive structure in the industry (Tresch, 1994: 491,
* Ten banks that have the highesl market shares in total deposits, total credits and totalrevenues: T.C. Zinal Bankast, T. Emlak Bankast, T. Halk Bankast, T. Vaktflar Bankasl, Akbank,Pamukbank, T0rk Ticaret Bankast, T. Garanti Bankasr, T. lg Bankasr and Yapt ve Kredi Bankasr.** Concentration ratios for most of the manufacturing industries Turkey are much higher than thebanking industry. For instance, CR4 is %70 tor the soap and detergant induslry in 1993 (DPT,1994: 22-25; Dinler, 1994: 304).
13

492; and see Ragan and Thomas, 1993: 730 and Case and Fair, 1992 : 427, 428
for a different evaluation of the Hl results).
We have calculated Hl to have an idea about the degree of market power in
the Turkish commercial banking industry for three circumstances as in the case of
CR for the year 1993: One is for the total deposits collected by all public and private
commercial banks. Two is for the total credits given by all public and private
commercial banks. Three is for the total revenues (interest and noninterest
revenues) of all public and private commercial banks (Tables A1-A3).
As seen on Tables 41 to A3, we have calculated the Herfindahl lndexes for
the above three clrcumstances as follows. For the total deposits:
Hl = (0.0171)z + (0.0004)2 + (0.2031)2 +.....+ (0.0670)2 = 0.0845 (%8.5)
For the total credits:
Hl = (0.0043)2 + (0.1848)2 + (0.1135)2 +.....+ (0.0929)2 = 0.0822 ('/"8.2)
For the total revenues:
Hl= (0.0269)z + (0.0009)2 + (0.2204)2 +.....+ (0.0612)2 =0.0879 (%8.8)
Table 4:Resuls of■ Hland CR
Criteria Number of
Banks
Total
Deposits
Total
Credls
Total
Revenues
口Hl 38 00845 00822 0.0879
CR 4 04616 04865 0.4565
10 08655 07788 07737
Source: Calculated from Tables A1, 42 and 43.
Since the results of the Herfindahl lndexes for all the three cases above are
less than %10, the Turkish commercial banking industry has a relatively competitive
market structure. Considering both measures of monopoly power, CR and Hl, the
Turkish commercial banking industry has a moderately competitive market
structure, and therefore it is a lowely concentrated industry. But the results still need
to be interpreted very carefully (eafl+ffi) since the results of both criteria are very
close to the criticat numbers. F:?tl#dt", in terms of the totat deposits, CR4 is
0.4616 < 0.50 and Hl is 0.0845 < 0.10; in terms of the total credits, CR4 is
0.4865 < 0.50 and Hl is 0.0822 < 0.10; and in terms of the total revenues, CR4 is
0.4565 < 0.50 and Hl is 0.0879 < 0. 10. ln additlon to these results, the ten banks
14

concentration ratios are quite high in the industry (%77.29, %77.88 and '/"77.37, in
total deposits, in total credits and in total revenues, respectively)'
8. CONCLUSION AND SUGGESTIONS
Most of the cost studies in banking have concluded economies of scale for
banking institutions at relatively low levels of output. Most of them tried to measure
only overall economies of scale (Clark, 1988: 20), only a few of them tried to
measure prod uct-specif ic economies of scale because of long extrapolation
calculations. But, the ones that have estimated have not strongly suppoded the idea
of significant economies of scale for all the products. For example, Kim found a
modest result for mortgage loans.
Clark reviewed 13 cost studies and came to this conclusion (Clark, 1988: 26-
27) lhal "the smallest, most specialized of depository institutions may be at a cost
disadvantage relative to larger, more diversified institutions". This situation may
derive these depository institutions from the market and leave the market lo the
more efficient ones. The results also suggest that "once overall scale economies
have been exhausted, there will still be opportunities for the smaller, less diversified
depository institutions". On the other hand, in the case that there is no cost
advantage for the largest, most diversified financial institutions, "the banking
industry will be dominated by a few large depository financial institutions. The lifting
of restrictions on interstate banking and interstate branching might help consolidate
resources in states that have prohibited or severely limited branch banking by
permitted small banks to achieve more efficient scale of production".
On the other hand, the conclusion of the above concentration-price studies
have shown that there is a strong relationship between concentration and prices.
Weiss (1989) reviewed many studies and come to the conclusion that "selling
prices rise with concentration, and buying prices iall with concentration", ..... which
"yields massive suppon for the prediction of conventional oligopoly theory" (Weiss,
1989:259).
For the studies in the area to be done in the fulure, in addition to the ones
done up to now, we think that the "effect of technological change" on bank prices
need to be tested more carefully, may be adding a time trend to the translog cost
function, and putting its constrains for different data set. However, banking is one of
the most affected industry by technological change. Computer is the basic material
due to hightechnology.
15
Again, it would be preferable 'to change the structure of factor prices"; adding
"human capital" and "information technology". Becduse, recently there are some
important criticism regarding the traditional production factors; there are some
developing arguments that labor is not only a production cost, it is a part of capital
with a new co-operative organization structure. Also, information technology is
being recently considered as an input, which is extremely needed by the banking
industry. lf the banks have a good information and continue to have it, they will be
computing more successfully, and also they may not need to collude more.
Our calculations of concuntration ratios and Herfindahl lndexes indicate thatthe Turkish commercial banking industry has a moderately competitive marketstructure, and therefore it is a lowely concentrated industry. But the results still needto be interpreted very cautiously since the results of both criteria are very close tothe critical numbers. For example, in terms of the total deposits, CR4 is 0.4616 <0'50 and Hl is 0.0845 < 0.10; in terms of the total credits, CR4 is 0.4865 < 0.50 andHl is 0.0822<O.10; and in terms of the total revenues, CR4 is 0.4565 < 0.SO and Hlis 0.0879 < 0.10.
16

REFERENCES
Bell, Frederick W. and Murphy, Neil B.; "lmpact of Market Structure on The Price of a
Commercial Banking Service", The Review of Economics and
Statistics, Vol. 51, 210-213, May 1969.
Berger, Allen N. and Hannan, Timonthy H.; 'The Price-Concenlration Belationship
in Banking", The Review of Economics and Statistics, 291-p99, May1989a.
Berger, Allen N. and Hannan, Timonthy H.; "Dsposit lnterest Rates and Local
Market Concentration", in: Concentration and Prices, ed. by L.W. Weiss,
The MIT Press, Cambridge, Mass., 255-259, ig8gb.
Case, Karl E. and and Fair, Ray C.; Principles of Economics, prentice-Hall lnc.,
New Jersey, 1992.
Cebenoyan, A. Sinan; "Multiproduct Cost Funclions and Scale Economies inBanking", The Financial Review, Vol. 23, 499-512, .l9BB.
Cebenoyan, A. Sinan; "Scope economies in Banking: The Hybrid Box-Cox
Function", The Financial Review, Vol. 25, .1990.
Clark, Jeffrey A.; "Economies of Scale and Scope At Depository lnstitutions: AReview of the Literature", Federal Reserve Bank of Kansas CityEconomic Review, 16-33, September/October .tgBB.
Devlet Planlama Tegkilatr; Rekabet Hukuku ve politikasr, Dpr publication,pub. no: 2365/432, Ankara, 1994.
Dinler, Zeynel; Mikro Ekonomi, Ekin Kitabevi publication, Bursa, 1994.Donek, Ekrem; "Realizing Technological Change: The New Techno_Economic
Paradigm", Hacettepe University Journal ot i.i.A.f. (i.i.B.F.Dergisi), Vol. 13, 101-1 16, 1995.
Edwards, Franklin R.; "Concentration in Banking and lts Effect on Business LoanRates", The Review of Economics and Statistics, Vol. 46, 294_300,August 1964.
Evanoff, D.D. and lsrailevich, P.R.; ,,productive Efficiency in Banking,,, EconomicPerspective, 1990.
Evanoff, D.D. and Merris, R.C.; "Relative price Efficiency, Technical Change, andScale Economies for Large Commercial Banks", Journal of RegulatoryEconomics, September 1990.
17
Goldstein, Steven J., McNulty, James E. and Verbrugge, James A.; "Scale
Economies in the Savings and Loan lndustry Before Diversification",
Journal of Economics and Business, 199-207, 1987.
Kim, Youn; "Economies of Scale and Economies of Scope in Multiproduct Financial
lnstitutions: Further Evidence from Credit Unions", Journal of Money,
Credit, and Banking, Vol. 18, No: 2,220-226, May 1986.
Mester, Loretta J.; "Traditional and Non-traditional Banking: An lnformation-
Theorretic Approach", Journal of Banking and Finance, Vol. 16,
545-566, 1992.
Murray, John D. and White, Robert W.; "Economies of Scale and Economies of
Scope in Multiproduct Financial lnstitutions: A Study of British Columbia
Credit Unions", The Journal of Finance Vol. 38, No: 3, 887-901, June
1 983.
Ragan, James F. and Thomas, Lloyd B.; Principles of Economics, The Dryden
Press, New York, 1993.
Rossi, Clifford; Thrift lndustry Cost Structure and Competitive Viability,
Office of Thrift Supervision, Research Report Series, 92-01, Washington
D.C., 1991.
Tresch, Richard W.; Principles of Economics, West Publishing Company, St.
Paul, MN, 1994.
Turkiye Bankalar Birligi; Bankalanmrz 1993, TBB publication, Ankara, May 1994.
Weiss, Leonard; "A Review of Concentration-Price Studies in Banking", in:
Concentration and Price, ed. by L.W. Weiss, The MIT Press, Cambridge,
Mass., 218-265, 1989.
18

APPENDiX:Table Al:Total Credns
Banks S s2
Etibank 0.0043 0.00002S0merbank 0.0 0.0
T.C. Ziraal Bankast 0.1848 0.0341
l-. Emlak Bankasr 0.1135 0.0129T. Halk Bankasr 0.0523 0.0027T. Vakrflar Bankasr 0.0548 0.0030Adabank 0.0004 0.0000001Akbank 0.0536 0.0029Alternatifbank 0.0037 0.00001Bank Ekspres 0.0089 0.00008Demirbank 0.0160 0.0003Derbank 0.0 00
Eqebank 0.0099 0.0001
Eskisehir Bankasr 0.0266 0.0007Eurocredit T[irk Fransrz Tic. Bank. 0.0 0,0
Finansbank 0.0103 0.0001lnterbank 0.0153 0.0002lktisat Bankasr 0.0151 0.0002Kocbank 0.0109 0.0001Marmara Bankasr 0.0098 0.0001Mil‖ Avdin Bankasi 0.0025 0.000006Pamukbank 0.0560 0.0031
Sekerbank 0.0090 0.00008Tasarruf ve Kredi Bankasr 0.0 0.0
Tekstil Bankasr 0.0051 0.00003Toprakbank 0.0026 0.000007Turk Boston Bankasr 0.0013 0.000002Turk DrS Ticaret Bankast 0.0153 0.0002Tiirk Ekonomi Bankasr 0.0081 0.00007Turk Ticaret bankasr 0,0310 0.00096T. Garanti Bankasr 0.0446 0.0020T. lmar Bankasr 0.0097 0.00009T. is Bankasr 0.0953 0.0091T. lthalat ve lhracat Bankasr 0.0082 0.00007T. Konut End0stri ve Tic. Bankasl 0.0042 0.00002T. Turizm Yatrrrm ve Dr$ Tic. Bank. 0.0058 0.00003T. Tut0nc0ler Bankasr 0.0182 0.0003Yapr ve Kredi Bankasr 0.0929 0.0086
Source: Calculated from "Bankalarrmrz 1993", T0rkiye Bankalar Birli$i, 1994.
19

Table A2: Total DePosits
Banks S s2
Etibank 0.0171 0.0003
Sumerbank o.0004 0.0000001
f .C. Ziaal Bankast 0.2031 0.0412
T. Emlak Bankast 00972 0.0095
T.Halk BankasI 0.0630 0.0040
T. Vakrllar Bankast 0.0617 0.0038
Adabank 0.0006 0.0000003
Akbank 0.0600 0.0036
Alternatlfbank 0.0016 0.000003
Bank Ekspres 0.0207 0.0004
Demirbank 0.0125 0.0002
Derbank 0.0003 0.0000001
Eqebank 0.0045 0.00002
Eskisehir Bankast 0.0125 0.0002
Eurocredit T0rk Franstz Tic. Bank. 0.0036 0.00001
Finansbank 0.0177 0.0003
lnterbank 0.0038 0.00001
lktisat Bankast 0.0039 0.00002
Kocbank 0.0046 0.00002
Marmara Bankast 0.0240 0.0006
Milll Avdln Bankas: 0.0033 0.00001
Pamukbank 0.0476 0.0023
Sekerbank 0.0118 0.0001
Tasarruf ve Kredi Bankast 0.0011 0.0000012Tekstil Bankast 0.0053 0.00003
Toprakbank 0.0028 0.000008Trirk Boston Bankast 0.0 0.0
T0rk Drs Ticaret Bankast 0.0041 0.00002
Turk Ekonomi Bankast 0.0042 0.00002
T0rk Ticaret bankasr 0.0437 0.0019
T. Garanti Bankasr 0.0353 0.0012
T. lmar Bankasr 0.0094 0.00009
T. ls Bankasr 0.0943 0.0089
T. itnatat ve ihracat Bankasr 0.0281 0.0008
T. Konut Endustri ve Tic. Bankast 0.0030 0.000009T. Turizm Yatrnm ve Dtg Tic. Bank. 0.0063 0.00004
T. T0tunc0ler Bankast 0.0198 0.0004
Yapr ve Kredi Bankast 0.0670 0.0045
Source: Calculated from "Bankalartmtz 1993", T0rkiye Bankalar Birligi, 1994.
20

Table A3: Total Revenues (lnterest + Other)
Banks S s2
Etibank 0.0269 0.0007
S0merbank 0.0009 0.0000008T.C. Ziaal Bankasr 0.2204 0.0486
T. Emlak Bankasr 0.0671 0.0045
丁.Halk Bankasi 0.0675 0.0046
T. Vakrflar Bankast 0.0478 0.0023
Adabank 0.0010 0.000001Akbank 0.0780 0.0061
Alternatifbank 0.0029 0.000009Bank Ekspres 0.0086 0.00007
Demirbank 0.0127 0.0002
Derbank 0.0 0.0
Eqebank 0.0073 0.00005
Eskisehir Bankasr 0.0140 0.0002Eurocredit T0rk Fransrz Tic. Bank. 0.0 0.0
Finansbank 0.0169 0.0003lnterbank 0.0183 0.0003lktisat Bankasr 0.0158 0.0003Kocbank 0.0055 0.00003Marmara Bankasr 0.0073 0.0001Mil‖ Avdin Bankasi 0.0036 0.00001Pamukbank 0.0551 0.0030
$eke rban k 0.0120 0.0001Tasarruf ve Kredi Bankasr 0.0013 0.000002Tekstil Bankasr 0.0040 0.00002Toprakbank 0.0035 0.00001Turk Boston Bankasr 0.0010 0.0000009Turk Drs Ticaret Bankasr 0.0109 0.0001Turk Ekonomi Bankasr 0.0062 0.00004T[rrk Ticaret bankasr 0.0468 0.0022T. Garanti Bankasr 0.0392 0.0.0015T. lmar Bankasr 0.0124 0.0002T. ls Bankasr 0.0906 0.0082T. lthalat ve lhracat Bankasr 0.0099 0.0001T. Konut End0stri ve Tic. Bankasr 0.0024 0.000006T. Turizm Yatrrrm ve Dr$ Tic. Bank. 0.0046 0.00002T. Tut0nculer Bankasr 0.0160 0.0003Yapr ve Kredi Bankasr 00612 0.0037
Source: Calculated from "Bankalarrmrz 1993", Turkiye Bankalar Birligi, 1994.
21
Top Related
Copyright © 2022 FDOKUMEN

