


Bahasa
Halaman
Hukum


Heat and additive induced biochemical transitions in gluten
from good and poor breadmaking quality wheats
Mehmet Haytaa,*, J. David Schofieldb
aDepartment of Food Engineering, Inonu University, Elazig Yolu 44069 Malatya, TurkeybDepartment of Food Science and Technology, Reading University, Reading, UK
Received 26 February 2004; revised 7 June 2004; accepted 25 June 2004
Abstract
Glutens from poor breadmaking quality wheat, cv. Riband, had a higher SDS extractability than glutens from good quality cv. Hereward.
Heating of gluten, especially above 70 8C, caused a reduction in the amount of SDS-extractable gluten proteins. Treatment of gluten with
redox additives (ascorbic acid, potassium bromate or glutathione) affected extractability, being highest for bromate treated glutens. The SH
content of gluten was lower for poor breadmaking Riband and heating resulted in greater decrease in SH content of gluten from good
breadmaking Hereward. Hereward gluten had a higher SS content than Riband. The alteration of SS content on heating was not significant
and may indicate the heat-induced involvement of non-covalent interactions. SDS-PAGE revealed that oxidants, especially bromate, affect
polypeptide composition leading to a more heat stable/tolerant protein structure.
q 2004 Published by Elsevier Ltd.
Keywords: Wheat gluten; Heating; Redox additives; Sulphydryl; Disulphide
1. Introduction
Heat treatment can cause alterations in protein structure
e.g. in conformation and molecular size (Phillips et al.,
1994). During the baking process, gluten proteins are
exposed to mechanical work as well as to heat conditions
that might be expected to change their physicochemical
properties significantly. Heating causes the gluten proteins
to associate to form large protein aggregates that are less
extractable (Booth et al., 1980; Schofield et al., 1983).
Aggregation behaviour and extractability differences have
been reported between glutens from good and poor baking
quality flours, glutens from good baking quality flours being
more highly aggregated and less extractable than those from
flours of poor baking quality (Butaki and Dronzek, 1979;
He and Hoseney, 1991).
0733-5210/$ - see front matter q 2004 Published by Elsevier Ltd.
doi:10.1016/j.jcs.2004.06.006
Abbreviations: AA, ascorbic acid; DHAA, dehydroascorbic acid;
DTNB, dithiobis 2-nitrobenzoic acid; fwb, flour weight basis; GSH,
glutathione; mw, molecular weight; SDS, sodium dodecyl sulphate; SH,
sulphydryl; SS, disulphide; TGE, tris–glycine–EGTA.
* Corresponding author. Tel.: C90 42234 10010; fax: C90 42234 10046.
E-mail address: [email protected] (M. Hayta).
Redox agents modify the structure and functional
properties of wheat gluten proteins (Bloksma and Bushuk,
1988). Reducing agents, such as sodium sulphite, mercap-
toethanol, and dithiothreitol enhance the solubilization of
wheat proteins (Kim and Bushuk, 1995). Their action
cleaves SS bonds which results in a decrease in molecular
weight, leading to an increase in extractability (Lavelli
et al., 1996; Weegels et al., 1994). The extractability of
proteins by SDS solutions gives a good indication of the
degree of crosslinking. Extracting agents such as SDS
produce their effects by altering the intermolecular bonding
that is responsible for holding the protein chains together.
As aggregation progresses, the SDS extractable fraction
decreases and SDS unextractable fraction increases
(Jeanjean et al., 1980; Schofield et al., 1983).
Redox induced SH–SS exchange reactions cause altera-
tions in the native structures of proteins leading to
important physicochemical changes their properties. SH
groups and SS bonds have a significant role in determining
gluten properties and SS bond formation within gluten is
important in protein network formation which affects the
quality of the final product (Bloksma and Bushuk, 1988).
Measurements of changes in SH groups suggest that heat
Journal of Cereal Science 40 (2004) 245–256
www.elsevier.com/locate/jnlabr/yjcrs
M. Hayta, J.D. Schofield / Journal of Cereal Science 40 (2004) 245–256246
setting is accompanied by changes in SS bond structure
(Schofield et al., 1983; Weegels et al., 1994). SH/SS
changes have been determined using amperometric pro-
cedures (Redman and Ewart, 1971), radiolabelling of SH
groups with specific reagents (Schofield et al., 1983) and
by direct amino acid analysis (Ewart, 1985). However,
perhaps the most widely used method for SH/SS
determination in proteins relies on reaction of DTNB
(Ellman’s reagent) with SH groups. Electrophoretic
patterns of proteins before and after heat treatment have
been used to monitor changes in the aggregation behaviour
of gluten polypeptides after heat treatment (Boye et al.,
1997; Schofield et al., 1983).
As gluten proteins are chiefly responsible for differences
in baking quality among wheat flours, more information is
required to clarify the changes that occur during the
different steps in the breadmaking process. The objective
of the present study was to gain information on heat-induced
alterations in extractability, changes in free SH groups and
SS bonds and in polypeptide composition of gluten in the
absence and presence of redox additives.
2. Experimental
2.1. Materials
2.1.1. Wheat grain and flour milling procedure
Two bread wheat varieties, Hereward and Riband of
good and poor breadmaking quality, respectively, were
milled into straight-run white flours on a Buhler experi-
mental mill (Model MLU 202) after tempering for 24 h at
16% (w/w) moisture. The flours were stored at K4 8C.
2.2. Gluten isolation procedure
The procedure was that described by Booth and Melvin
(1979) with some modification. Flour (1 kg) and water or
solutions of ascorbic acid (AA) (100 ppm, flour weight
basis, fwb), potassium bromate (50 ppm, fwb) or reduced
glutathione (GSH) (100 ppm, fwb) (1 l) were evenly mixed
in a Hobart type hook mixer for 30 s at speed setting 1. The
mixing speed was then increased to speed setting 3 and the
batter mixed until a coherent mass formed i.e. when the
dough pulled away from the side of the bowl as a coherent
mass with a slapping noise. The mixer was then stopped and
another 2 l water at 15 8C was added. Stirring was continued
at speed setting 1 for 5 min. Normally gluten forms a
cohesive mass that sticks to the mixer hook but this varies
from flour to flour. Weak glutens may not behave as
described and may break up into strands, which requires the
use of a coarse metal sieve to separate them from starch
milk. After removal of the starch milk, the gluten was
returned to the mixer for additional washing at speed 1 until
the wash water was clear, at which stage the gluten was
frozen and freeze-dried. After coarse grinding the dry gluten
with a pestle and mortar, the samples were milled in a
micro-hammer mill (Glen Creston, setting 5) with a 1.0 mm
screen. This resulting in a gluten powder with a particle size
not exceeding 250 mm.
2.3. Heat treatment of gluten
Freeze-dried gluten powder (20 g) and water or solutions
of ascorbic acid (AA, 1000 ppm, gluten weight basis, gwb),
potassium bromate (500 ppm, gwb) or reduced glutathione
(GSH, 250 ppm, gwb) were hand mixed with a spatula, the
volume of water or solution being such as to give a final
moisture content of 65% (w/w). The gluten was allowed to
hydrate for 2 h in a sealed plastic container. Hydrated
glutens were placed between aluminium plates with a gap of
2 mm and rested for 15 min. The plates were immersed in a
temperature controlled water bath and heated at 30, 50, 70
or 90 8C for 15 min. Thereafter, the plates were cooled
immediately in ice water and the samples freeze-dried and
ground as described in Section 2.2.
2.4. Analytical procedures
2.4.1. Moisture
The moisture contents of flours and glutens (%, dry basis
(db)) were determined by oven drying method at 130 8C for
1 h (Approved Methods of American Association of Cereal
Chemist, 1995).
2.4.2. Protein
The total protein contents of flours and glutens were
determined using Kjeldahl (N!5.7) standard method. The
protein contents of sodium dodecyl sulphate (SDS) or acetic
acid extracts of glutens were determined using the
bicinchoninic acid (BCA) protein assay kit (Sigma Chemi-
cal Co., Procedure No.: Tpro-562). This method is based on
the reaction of BCA with protein-reduced copper (I)
forming a purple complex with an absorbance maximum
at 562 nm, which is proportional to protein concentration.
The extracts (0.1 ml) were diluted with distilled water
(0.9 ml). The diluted extracts (0.1 ml) were mixed with
2.0 ml of BCA reaction solution (50 part BCA plus 1 part
copper (II) sulphate) and incubated at 37 8C in a water bath
for 30 min. The absorbance values of reaction mixtures
were measured at 562 nm against blanks (2% SDS or
0.05 M acetic acid plus BCA reaction solution) after cooling
down to room temperature. Bovine serum albumin (Sigma,
P-0914) was used as the protein standard.
2.4.3. Starch
Total starch contents of glutens were determined by
amyloglucosidasealpha-amylase (Megazyme Int. Ireland
Ltd).
M. Hayta, J.D. Schofield / Journal of Cereal Science 40 (2004) 245–256 247
2.4.4. Farinograph and mixograph mixing tests
Farinograms of flours were obtained using a Brabender
Farinograph (C W. Brabender Instruments, Inc., South
Hackensack, NJ, USA) fitted with 300 g mixing bowl to
assess water absorption values according to the standard
method of Approved Methods of American Association of
Cereal Chemist (1995). The Farinograms were used to
obtain standard dough mixing characteristics, such as
development time. Mixing tests were also performed on
flour (2 g) samples with a 2 g direct drive Mixograph.
Samples were weighed at 14% moisture basis and mixed at a
speed of 88 rpm. Water was added according to the water
absorption values determined by the Farinograph to give
final moisture content of 63.3 and 57.6% (fwb) for flours of
Hereward and Riband wheat, respectively. The dough
mixing parameters were obtained using the software,
Mixsmart (National Mfg, TMCO, Lincoln, NE, USA).
2.4.5. Gluten protein extractability in SDS solution
To examine the effect of heat on extractability, gluten
(0.2 g) heated at different temperatures was suspended in
20 ml of 2% (w/v) SDS and mixed with a magnetic stirrer
for 30 min, 1, 2, 5, 10, 15, 20 h or overnight and centrifuged
at 30,000g for 1 h. The protein contents of the supernatants
were determined by the BCA method after filtration through
filter paper (Whatman No. 541).
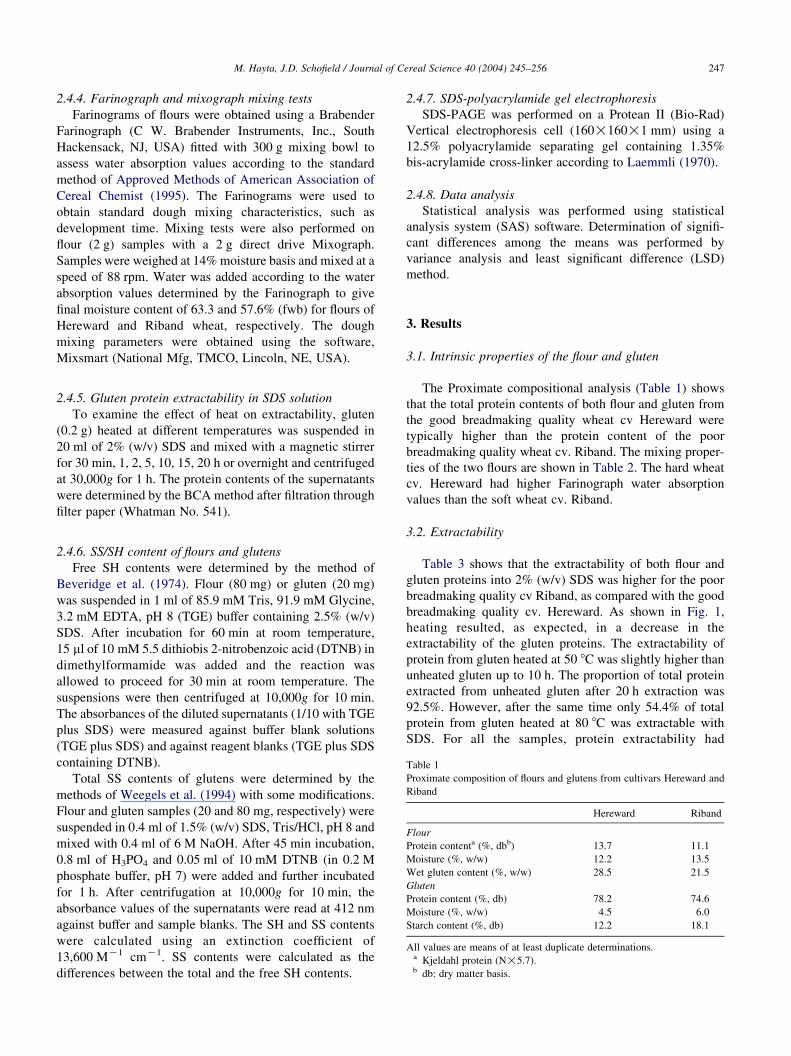
Table 1
Proximate composition of flours and glutens from cultivars Hereward and
Riband
Hereward Riband
Flour
Protein contenta (%, dbb) 13.7 11.1
Moisture (%, w/w) 12.2 13.5
Wet gluten content (%, w/w) 28.5 21.5
Gluten
Protein content (%, db) 78.2 74.6
Moisture (%, w/w) 4.5 6.0
Starch content (%, db) 12.2 18.1
All values are means of at least duplicate determinations.a Kjeldahl protein (N!5.7).b db: dry matter basis.
2.4.6. SS/SH content of flours and glutens
Free SH contents were determined by the method of
Beveridge et al. (1974). Flour (80 mg) or gluten (20 mg)
was suspended in 1 ml of 85.9 mM Tris, 91.9 mM Glycine,
3.2 mM EDTA, pH 8 (TGE) buffer containing 2.5% (w/v)
SDS. After incubation for 60 min at room temperature,
15 ml of 10 mM 5.5 dithiobis 2-nitrobenzoic acid (DTNB) in
dimethylformamide was added and the reaction was
allowed to proceed for 30 min at room temperature. The
suspensions were then centrifuged at 10,000g for 10 min.
The absorbances of the diluted supernatants (1/10 with TGE
plus SDS) were measured against buffer blank solutions
(TGE plus SDS) and against reagent blanks (TGE plus SDS
containing DTNB).
Total SS contents of glutens were determined by the
methods of Weegels et al. (1994) with some modifications.
Flour and gluten samples (20 and 80 mg, respectively) were
suspended in 0.4 ml of 1.5% (w/v) SDS, Tris/HCl, pH 8 and
mixed with 0.4 ml of 6 M NaOH. After 45 min incubation,
0.8 ml of H3PO4 and 0.05 ml of 10 mM DTNB (in 0.2 M
phosphate buffer, pH 7) were added and further incubated
for 1 h. After centrifugation at 10,000g for 10 min, the
absorbance values of the supernatants were read at 412 nm
against buffer and sample blanks. The SH and SS contents
were calculated using an extinction coefficient of
13,600 MK1 cmK1. SS contents were calculated as the
differences between the total and the free SH contents.
2.4.7. SDS-polyacrylamide gel electrophoresis
SDS-PAGE was performed on a Protean II (Bio-Rad)
Vertical electrophoresis cell (160!160!1 mm) using a
12.5% polyacrylamide separating gel containing 1.35%
bis-acrylamide cross-linker according to Laemmli (1970).
2.4.8. Data analysis
Statistical analysis was performed using statistical
analysis system (SAS) software. Determination of signifi-
cant differences among the means was performed by
variance analysis and least significant difference (LSD)
method.
3. Results
3.1. Intrinsic properties of the flour and gluten
The Proximate compositional analysis (Table 1) shows
that the total protein contents of both flour and gluten from
the good breadmaking quality wheat cv Hereward were
typically higher than the protein content of the poor
breadmaking quality wheat cv. Riband. The mixing proper-
ties of the two flours are shown in Table 2. The hard wheat
cv. Hereward had higher Farinograph water absorption
values than the soft wheat cv. Riband.
3.2. Extractability
Table 3 shows that the extractability of both flour and
gluten proteins into 2% (w/v) SDS was higher for the poor
breadmaking quality cv Riband, as compared with the good
breadmaking quality cv. Hereward. As shown in Fig. 1,
heating resulted, as expected, in a decrease in the
extractability of the gluten proteins. The extractability of
protein from gluten heated at 50 8C was slightly higher than
unheated gluten up to 10 h. The proportion of total protein
extracted from unheated gluten after 20 h extraction was
92.5%. However, after the same time only 54.4% of total
protein from gluten heated at 80 8C was extractable with
SDS. For all the samples, protein extractability had

Table 2
Mixing properties of flours from cultivars Hereward and Riband
Hereward Riband
Farinograph
Water absorption (%) 63.3 57.6
Development time (min) 3.0 2.0
Stability (min) 9.0 3.5
Degree of softening (BUa) 100 140
Mixing tolerance index (BU) 90 180
Mixograph
Peak time (min) 3.18 2.62
Peak dough resistance (MUb) 71.6 50.7
Peak height 71.7 51.2
Width at peak 27.4 18.5
All values are means of at least duplicate determinations.a BU, Brabender unit.b MU, Mixograph unit.
Fig. 1. Extractability of protein from unheated (C) heated at 50 8C (,),
60 8C (6), 70 8C (x), 80 8C (B), glutens (cv. Hereward flour) as a function
of time. Extractant was 2% (w/v) SDS at room temperature.
M. Hayta, J.D. Schofield / Journal of Cereal Science 40 (2004) 245–256248
essentially reached a plateau value after 5 h, indicating that
this time was adequate to extract gluten proteins into SDS.
The flour or gluten proteins from poor breadmaking quality
cv. Riband were more soluble in 2% (w/v) SDS than the
proteins of good breadmaking quality cv. Hereward.
3.3. Effect of redox additives on the extractability
of heat-treated glutens
The effect of redox additives was tested in two ways.
In the first, doughs were treated with different redox
additives and the gluten washed out immediately using
the Glutomatic apparatus or Hobart mixer. In the second,
freeze-dried gluten was prepared by the batter technique
in the absence of additives and then rehydrated by
mixing to peak development in the 2 g Mixograph in the
presence of different redox agents to a final moisture
content of 65% (w/w).
3.3.1. Gluten freshly washed out from dough
The SDS extractability of good quality Hereward gluten,
washed out from optimally mixed dough containing
ascorbic acid (AA, 100 ppm), potassium bromate
(50 ppm) or reduced glutathione (GSH, 100 ppm) remained
almost constant as the temperature increased from 30 to
70 8C. However, the SDS extractability of the protein of
Hereward control gluten decreased significantly (P!0.05)
Table 3
Extractability in SDS (2%, w/v) of the protein from flours and glutens from
cvs
Cultivar Extracted protein (%)
Flour
Hereward 87G1.7
Riband 91G2.3
Gluten
Hereward 59G0.9
Riband 68G1.5
Hereward and Riband, good and poor breadmaking quality wheats,
respectively. Extraction was for 30 min at room temperature.
over this temperature range (Fig. 2). The extractability
declined more strongly at 90 8C, such that approximately
58% of the protein of the control gluten of Hereward
became insoluble with heating at 90 8C. A similar pattern
was observed for Riband control gluten (Fig. 3), although
the changes in extractability were smaller.
Redox agents affected SDS-extractability of gluten
protein differently depending on the nature of the
additive and the temperature. The extractability of
protein from AA treated Hereward gluten remained
more or less constant from 30 to 70 8C, then decreased
significantly (P!0.05) to 54.1% at 90 8C (Figs. 2 and 3).
The extractability of the gluten from AA treated Riband
dough was slightly higher than the control at each
temperature up to 70 8C, but at 90 8C the extractability of
the AA treated Riband gluten fell to below that of the
control (56.0% compared with 60.4%).
Interestingly the extractability of the bromate treated
Hereward gluten was more or less constant up to 70 8C, but
at 90 8C it was approximately 15% higher than the control
(Fig. 2), which was significant (P!0.05).
While the protein extractability of untreated Hereward
gluten decreased by about 10% as a result of heating at
70 8C compared with the unheated control, treatment with
GSH, like that for oxidising agents, maintained protein
extractability up to 70 8C, whereas at 90 8C the extrac-
tability fell to a value similar to the control. Bromate
treated Riband gluten showed a similar pattern to the GSH
or bromate treated Hereward gluten in that protein
extractability remained constant up to 70 8C then at 90 8C
fell to a value similar to the control (Figs. 2 and 3). No
gluten could be washed out from the Riband dough treated
with GSH.
Hereward gluten treatment with both oxidants (bromate
and ascorbate) apparently maintained constant gluten
protein extractability constant up to 70 8C, whereas a
significant (P!0.05) fall was observed for the control.
The reducing agent, GSH, had a similar effect over this
temperature range. At 90 8C the protein extractability of the
oxidant treated Hereward gluten was higher than that of the
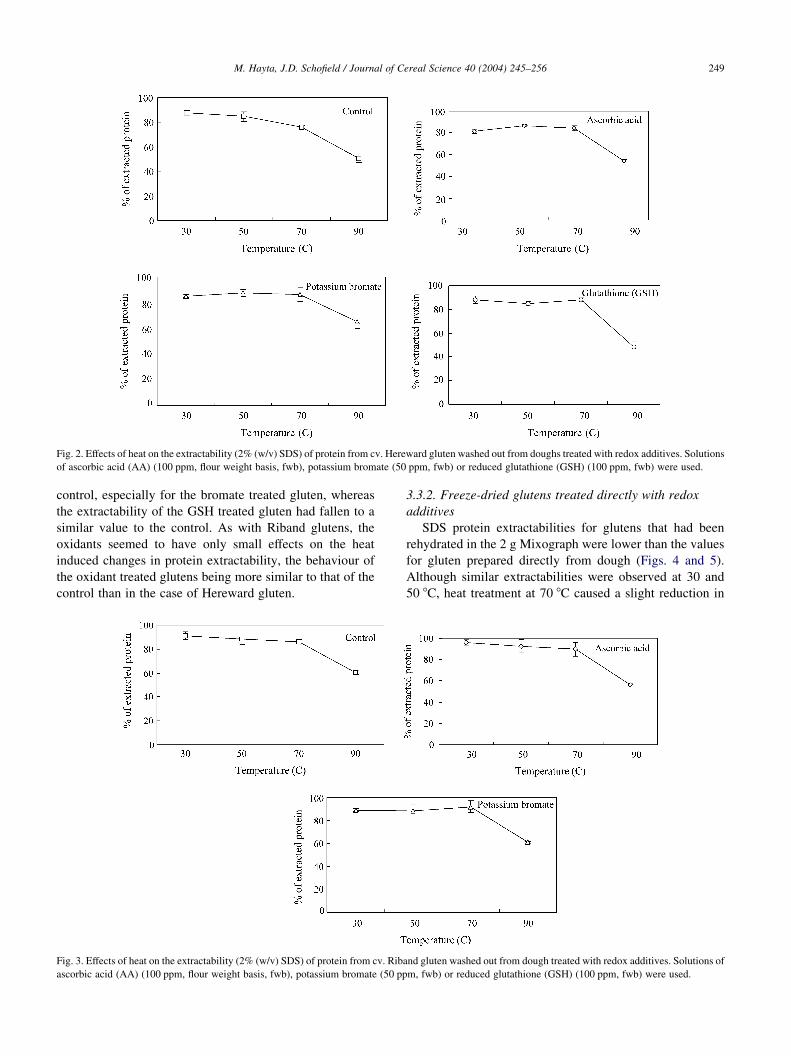
Fig. 2. Effects of heat on the extractability (2% (w/v) SDS) of protein from cv. Hereward gluten washed out from doughs treated with redox additives. Solutions
of ascorbic acid (AA) (100 ppm, flour weight basis, fwb), potassium bromate (50 ppm, fwb) or reduced glutathione (GSH) (100 ppm, fwb) were used.
M. Hayta, J.D. Schofield / Journal of Cereal Science 40 (2004) 245–256 249
control, especially for the bromate treated gluten, whereas
the extractability of the GSH treated gluten had fallen to a
similar value to the control. As with Riband glutens, the
oxidants seemed to have only small effects on the heat
induced changes in protein extractability, the behaviour of
the oxidant treated glutens being more similar to that of the
control than in the case of Hereward gluten.
Fig. 3. Effects of heat on the extractability (2% (w/v) SDS) of protein from cv. Riba
ascorbic acid (AA) (100 ppm, flour weight basis, fwb), potassium bromate (50 pp
3.3.2. Freeze-dried glutens treated directly with redox
additives
SDS protein extractabilities for glutens that had been
rehydrated in the 2 g Mixograph were lower than the values
for gluten prepared directly from dough (Figs. 4 and 5).
Although similar extractabilities were observed at 30 and
50 8C, heat treatment at 70 8C caused a slight reduction in
nd gluten washed out from dough treated with redox additives. Solutions of
m, fwb) or reduced glutathione (GSH) (100 ppm, fwb) were used.

Fig. 4. Effects of heat on the extractability (2% (w/v) SDS) of protein from cv. Hereward gluten treated with redox additives. Solutions of ascorbic acid
(1000 ppm, gluten weight basis, gwb), potassium bromate, (500 ppm, gwb) and reduced glutathione (GSH) (250 ppm, fwb) were used.
M. Hayta, J.D. Schofield / Journal of Cereal Science 40 (2004) 245–256250
extractability. Further heating at 90 8C dramatically reduced
the amount of SDS extractable protein except for the bromate
treated glutens of both cultivars. The extractabilities of
bromate treated glutens were significantly (P!0.05) high
even after heat treatment at 90 8C (Figs. 4 and 5). Slightly
Fig. 5. Effects of heat on the extractability (2% (w/v) SDS) of protein from cv. R
ascorbic acid (1000 ppm, gluten weight basis, gwb), potassium bromate, (500 pp
higher extractabilities were observed for poor quality Riband
gluten irrespective of temperature and additive used
compared with good quality Hereward gluten. There was
relatively little difference between the control and AA treated
glutens at any temperature. Interestingly, the GSH treated
iband gluten treated with redox additives. The solutions of additives were:
m, gwb) and reduced glutathione (250 ppm, gwb).

Table 4
Effect of heat on the SH (mmol/g of protein) contents of glutens prepared from doughs treated with redox additives
Wheat cultivar
treatment
Temperature (8C)
30 SDa 50 SD 70 SD 90 SD
Hereward control 2.78 0.11 1.95 0.13 1.51 0.16 1.16 0.13
AAb 1.88 0.07 1.61 0.11 1.33 0.11 0.99 0.04
Bromatec 1.75 0.09 1.56 0.15 1.20 0.13 0.76 0.07
GSHd 2.49 0.15 2.48 0.13 2.38 0.14 2.27 0.05
Riband control 1.83 0.13 1.52 0.06 1.44 0.13 1.40 0.10
AA 1.79 0.04 1.35 0.12 1.13 0.04 0.83 0.02
Bromate 1.46 0.20 1.17 0.10 0.81 0.04 0.38 0.06
All values are the means of triplicate determinations.a Standard deviation.b
L-Ascorbic acid.c Potassium bromate.d Reduced glutathione.
M. Hayta, J.D. Schofield / Journal of Cereal Science 40 (2004) 245–256 251
gluten had a significantly (P!0.05) lower extractability after
heating at 90 8C than the control unheated glutens for both
wheat cvs.
3.4. SH and SS contents
3.4.1. SH content of gluten freshly washed out from dough
The effect of heat treatment (30–90 8C) on the SH
contents of glutens prepared from dough treated with or
without redox additives is illustrated in Table 4. In
general, the SH contents of control and oxidant treated
glutens decreased significantly (P!0.05) as the tempera-
ture increased from 30 to 90 8C The SH content of control
(untreated) gluten from the cv. Hereward heated at 90 8C
was approximately 60% lower than that of gluten heated
at 30 8C. While oxidant treatments (ascorbate and
bromate) cause about a 50% reduction in SH content,
treatment with the reducing agent, glutathione (GSH),
resulted in less pronounced decrease in gluten SH content
when the gluten was heated at 70 and 90 8C compared
with 30 and 50 8C.
Table 5
Effect of heat on the SH (mmol/g of protein) contents of glutens treated directly w
Wheat cultivar
treatment
Temperature (8C)
30 SDa 50 SD
Hereward control 2.56 0.10 1.70 0.18
AAb 1.89 0.12 1.23 0.09
Bromatec 1.27 0.14 1.22 0.13
GSHd 3.76 0.16 3.47 0.17
Riband control 2.45 0.12 1.86 0.14
AA 2.15 0.15 1.81 0.10
Bromate 1.87 0.19 1.53 0.09
GSH 3.64 0.11 3.34 0.09
All values are the means of triplicate determinations.a Standard deviation.b
L-Ascorbic acid.c Potassium bromate.d Reduced glutathione.
The SH content of the gluten from the poor breadmaking
quality cv. Riband was significantly (P!0.05) lower than
that of the gluten from the good breadmaking quality cv.
Hereward. Whereas heating at 90 8C reduced the SH content
of Riband gluten by about 20%, whereas the reduction was
60% for the Hereward gluten.
3.4.2. SH content of freeze-dried glutens treated directly
with redox additives
Gluten isolated from flour was treated directly with redox
additives in a comparison of their direct effects on gluten
protein with their indirect effects when the gluten was
freshly washed out from doughs treated with additives
(Section 3.4.1). The addition of oxidants (ascorbate and
bromate) directly to gluten resulted in a decrease in the SH
content of both glutens (Table 5). Ascorbate treatment
reduced the SH content by 26 and 12% in Hereward and
Riband glutens, respectively. While bromate treatment
reduced the SH content of unheated (30 8C) Hereward
gluten by 50%, the decrease was 23% for poor quality
Riband gluten at 30 8C. Heating at 90 8C enhanced
ith redox additives
70 SD 90 SD
1.35 0.08 1.23 0.02
0.94 0.12 0.75 0.05
0.52 0.11 0.29 0.12
2.99 0.14 2.85 0.10
1.57 0.13 1.22 0.09
1.28 0.10 1.05 0.07
0.77 0.12 0.22 0.05
3.28 0.05 3.16 0.14

Table 6
Effect of heat on the SS (mmol/g of protein) contents of glutens prepared from doughs treated redox additives
Wheat cultivar
treatment
Temperature (8C)
30 SDa 50 SD 70 SD 90 SD
Hereward control 36.47 0.58 36.11 0.07 35.92 0.95 34.70 0.78
AAb 38.88 0.30 35.59 0.10 38.08 0.30 37.39 0.24
Bromatec 33.80 0.61 34.61 0.66 34.26 0.49 37.51 0.43
GSHd 37.47 0.43 36.41 0.22 33.26 1.10 32.24 0.14
Riband control 33.53 0.14 34.28 0.28 33.84 0.18 29.14 0.89
AA 34.28 0.11 31.14 0.32 32.50 0.09 31.12 0.06
Bromate 30.59 0.97 30.64 0.15 31.34 0.30 31.47 0.36
All values are the means of triplicate determinations.a Standard deviation.b
L-Ascorbic acid.c Potassium bromate.d Reduced glutathione.
M. Hayta, J.D. Schofield / Journal of Cereal Science 40 (2004) 245–256252
the decrease in the presence of bromate for both cultivars.
For example at 30 8C when bromate was used, the SH
content was reduced by 50%. However, on heating at 90 8C
a further 25% decrease in the SH content was observed. The
SH contents of the GSH treated glutens were higher than
those of the controls for both cultivars, and the SH contents
decreased slightly on heating.
3.4.3. SS content of gluten freshly washed out from dough
The SS contents of control and glutens of Hereward and
Riband treated with additives were similar (Table 6),
although the good quality Hereward gluten had a slightly
higher amount of SS than the poor quality Riband gluten
throughout the temperature range studied The SS analysis
provided little evidence that the decrease in SH content due
to oxidant treatment or to heating resulted in increases in SS
contents. However, since the changes in SH contents were
only about 1 mmol of SH/g gluten at most, and since two SH
groups are lost for every SS bond formed, the changes in SS
bond contents are, in any case, very small compared
with the total SS content of the control untreated gluten.
Table 7
Effect of heat on the SS (mmol/g of protein) contents of glutens treated with redo
Wheat cultivar
treatment
Temperature (8C)
30 SDa 50 SD
Hereward control 35.60 0.17 36.44 0.17
AAb 36.12 0.46 36.40 0.91
Bromatec 36.03 0.30 32.80 0.32
GSHd 36.78 0.15 34.55 0.58
Riband control 33.10 0.30 33.17 1.29
AA 33.83 0.50 34.24 1.07
Bromate 31.75 0.23 33.60 0.34
GSH 32.69 0.50 33.07 0.14
All values are the means of triplicate determinations.a Standard deviation.b
L-Ascorbic acid.c Potassium bromate.d Reduced glutathione.
Such small changes are likely to be within the experimental
error of the method used for SS determination.
3.4.4. SS content of gluten treated directly with redox
additives
The SS bond contents of glutens treated directly with
redox additives were similar to those of glutens prepared
from dough treated with redox additives (Table 7). Again
there was no clear effect on SS bond content of redox
additive treatment or of heat treatment.
3.5. Polypeptide composition of gluten freshly washed out
from dough
Heating the glutens prepared from redox treated doughs
at 30 and 50 8C had no apparent effect on polypeptide
composition of the glutens when analysed by SDS-PAGE
under reducing conditions (not shown). However, band
intensities generally decreased after heating to 70 8C and the
decrease became more pronounced as a result of heating to
90 8C (not shown). Bands corresponding to HMW subunits
x additives
70 SD 90 SD
33.54 0.86 34.03 0.16
37.67 0.85 35.68 1.36
34.74 0.76 36.84 0.26
36.66 0.43 36.43 0.15
35.13 0.85 32.39 0.30
32.69 0.29 32.86 0.14
32.86 0.80 32.74 0.19
33.83 0.19 33.27 0.21

M. Hayta, J.D. Schofield / Journal of Cereal Science 40 (2004) 245–256 253
of glutenin had almost disappeared after heating to 70 and
90 8C, but interestingly the band intensities of HMW
glutenin subunits in bromate treated glutens were partly
retained when compared with untreated control gluten.
Ascorbate treatment also showed a slight protective effect
against heating. Additionally, the HMW glutenin subunits
from the good quality Hereward gluten were affected to a
greater extent by heating to 90 8C than were those of poor
quality Riband gluten as evidenced by the band intensities.
Almost all the protein that did not enter the separating gel
under non-reducing condition (not shown) migrated into the
gel as discrete identifiable bands under reducing conditions.
3.6. Polypeptide composition of gluten treated directly
with redox additives
Similar trends were observed in the electrophoretic
patterns of SDS-extractable proteins of glutens treated
directly with redox additives. Again the band intensities in
HMW glutenin subunit region of bromate treated gluten
from both varieties were partly preserved even after heat
treatment at 90 8C.
4. Discussion
4.1. Intrinsic properties of the flours and glutens
Total protein and gluten contents generally show a linear
relationship with breadmaking performance as measured by
loaf volume (Finney and Barmore, 1948). The starch
damage and protein content of wheat are the main
determinants of the water absorption of flour. The
differences in endosperm texture results in variation in the
ability to direct the mechanical energy to the starch granules
during milling (Stevens, 1987). The degree of starch
damage during milling is greater for hard wheats than for
soft wheats, therefore, the water absorption capacity of hard
wheats increases. Protein content is also generally higher in
hard wheats than in soft wheats (Kent and Evers, 1994). As
expected the dough development time and peak time
measured by the Farinograph and Mixograph, respectively,
were longer for Hereward flour than for the poor quality
Riband flour. This implies that the hydration of protein and
starch and the development of the viscoelastic structure to a
certain consistency require more time and energy input for
good quality flour. Starch, protein and their interactions
have a strong influence on the mixing behaviour of flour
(Preston and Kilborn, 1984). Again stability and mixing
tolerance index values, which are influenced by interactions
of flour components, especially starch and proteins, were
greater for Hereward flour.
The empirical data on mixing characteristics suggests
that there are differences in physical and possibly molecular
properties of flours from diverse breadmaking quality wheat.
Thus these data gave assurance, that the flours chosen for
this study had diverse physicochemical/functional
properties.
4.2. SDS-extractability
The extractability of flour and gluten proteins with SDS
from good and poor breadmaking quality (cvs. Hereward
and Riband, respectively) showed that gluten is less
extractable from good than poor flours. This observation
is in accordance with previous studies. Butaki and Dronzek
(1979) found that stronger wheat flours had more acid
insoluble (0.05 M acetic acid) gluten than weak flours.
Similarly, He and Hoseney (1991) showed that gluten from
poor quality flour had higher solubility in SDS solution than
gluten from good quality flour. The difference in protein
extractabilities between glutens was assumed to result from
differences in molecular size and aggregation tendency.
Differences in the aggregation behaviour (Arakawa and
Yonezawa, 1975), molecular weight or interaction tendency
(He and Hoseney, 1991) or conformational properties
(Huang and Khan, 1996) have been suggested as possible
factors responsible for the varying extractabilities of gluten
proteins from wheats of diverse breadmaking quality.
However, in respect to extractability in SDS solution,
molecular weight is likely to be the dominant factor. As the
solubility of heated proteins depends on their molecular
weights (MW) (Pomeranz, 1988), the decrease in extrac-
tability into SDS solution after heat treatment, especially at
higher temperatures, probably indicates an increase in MW,
which might result from aggregation of proteins during
heating.
In agreement with the previous reports of Booth et al.
(1980), Jeanjean et al. (1980) and Schofield et al. (1983), the
results of the extractability of gluten proteins with SDS
solution revealed that heat causes the gluten proteins to
associate to form larger protein aggregates that are less
extractable; as aggregation (crosslinking) progresses the
SDS-extractable fraction decreases. The heat effect on
gluten is explained on the basis of protein crosslinking
through a SH/SS exchange mechanism.
Redox agents affected SDS-extractability of gluten
protein differently depending on the type of additive and
the temperature. The effect of redox improvers is greater in
good breadmaking flour than in poor breadmaking flour due
to differences in the rate of reactions, which are lower in
good quality flour (Mair and Grosch, 1979).
One might have expected that oxidising agents would
have caused a reduction in protein extractability by
increasing protein crosslinking through SS bond formation,
whereas reducing agents would have caused a depolymer-
isation of gluten by cleaving the SS bonds. However,
improvers such as ascorbic acid and potassium bromate
increase the solubilization of insoluble protein during dough
mixing (Danno and Hoseney, 1982; Graveland et al., 1985;
Sievert et al., 1991). Different explanations have
been proposed involving physical forces, covalent and

M. Hayta, J.D. Schofield / Journal of Cereal Science 40 (2004) 245–256254
non-covalent bonds and conformational rearrangements.
One proposed explanation is that oxidising agents cause
crosslinking between glutenin fractions leading to increase
in stiffness of dough and increased work input.
The increased work input would lead to mechanical rupture
of SS bonds that would increase protein extractability
(Graveland et al., 1984). However, Eckert et al. (1993)
proposed that oxidant effects result from conformational
rearrangements rather than size reduction leading to a more
extended structure and thus increased extractability. If the
dough is allowed to rest after mixing, polymerisation of
glutenin due to oxidation of SH groups (Graveland et al.,
1985; Wang et al., 1992) or decrease in polymer surface due
to structural relaxation, results in a decrease in protein
extractability (Eckert et al., 1993).
In the presence of oxidants (ascorbic acid and potassium
bromate), the enhancement of the changes in glutathione
(GSH, GSSG, PSSG) during dough mixing (Chen, 1994),
such as shortening of the dough development time and
narrowing of Farinograph band width in rheological tests
(Frater et al., 1960; Ikoeza and Tipples, 1968) are consistent
with the results of the present study. One of the postulates is
that oxidants enhance protein depolymerization and dough
breakdown (Chen, 1994). However, it is also known that
oxidation favours polymerisation of gluten proteins.
The higher extractability of additive treated, especially
AA and bromate treated glutens, after heat treatment at
higher temperatures (70 and 90 8C) suggest that redox
additives alter the protein structure in such a way that heat
induced changes in SS bonding are modified and gluten
protein extractability is maintained. The rate of oven rise for
oxidant treated doughs was observed to be higher than that
of untreated doughs implying a delay in the denaturation
temperature of gluten network (Yamada and Preston, 1992).
This appears to be consistent with the present observations
on the effects of heat on the SDS extractability of glutens
from oxidant treated doughs. We observed an increase in
extractability of good breadmaking quality Hereward
glutens washed from oxidant treated dough. The action of
AA is thought to involve oxidation of endogenous flour
GSH to GSSG (Grosch and Wieser, 1999). Although this
reaction has not been experimentally demonstrated, it is
speculated that AA (a reducing agent) must first be
converted by oxidation with molecular oxygen to dehy-
droascorbic acid (DHAA, an oxidising agent). If the mixing
environment does not incorporate enough oxygen into the
dough, the conversion of AA to DHAA may not occur
efficiently. Therefore, AA may act as a reducing agent by
breaking SS bonds under conditions of oxygen insufficiency
(Mauseth et al., 1967).
The increase in protein extractability in SDS caused by
oxidants is likely to result from redox modification of SH
groups such that interchain SS bonding among gluten
polymers was decreased. This is not to say that hydrophobic
interactions do not play a role in the non-covalent
aggregation of gluten proteins during heating that may
facilitate subsequent oxidation of SH groups to SS bonds or
the rearrangement of SS bonds through SH/SS exchange
reactions, but that heat-induced changes in hydrophobic
interactions themselves do not lead to differences in SDS
extractability. With other non-denaturing solvents,
however, such interactions could well affect protein
solubility.
4.3. SH and SS contents
The actions of oxidising and reducing agents on dough
properties occur at different stages of breadmaking (mixing,
proofing, baking) and consequently there are also changes in
protein structure at different stages of breadmaking (Fitchett
and Frazer, 1986). There are contradictory reports of the
effects of heat and oxidant on the SH content of doughs.
Although a significant decrease in the SH content of
bromate treated and baked dough was reported by Tsen
(1968), the finding of a similar reduction in SH groups
during heating of both bromate treated and untreated doughs
does not support the mechanism of bromate oxidation
(Andrews et al., 1995). Notwithstanding an extremely high
level of oxidant, compared with commercial practice, was
used, the SH content of oxidant treated (ascorbate and
bromate, 1200 ppm) doughs mixed in the Do-Corder and
heated from 35 to 75 or 85 8C decreased and the decrease in
SH content of bromate treated dough was higher than that of
ascorbate treated dough (Nagao et al., 1981).
The concentrations of SH groups, analysed by ampero-
metric titration, by Matsuo and McCalla (1964) for glutens
from hard, soft and durum wheat varieties were 3.8, 4.0 and
4.4 mequiv/g of protein, respectively. The values were
approximately half those obtained in the present study
although the differences in wheat cultivars and method of
determination would obviously affect the results.
There are various reports on the relationship between SH
and SS contents and wheat variety. For example, Tsen and
Bushuk (1968) reported that total SH content increases with
decreasing flour strength. Although total SS content
decreased with decreasing strength, the number of reactive
SS bonds increased. It was also found that there was no
relationship between protein and SH contents (Axford et al.,
1962, Tsen and Anderson, 1963). SH content of doughs
differing in their response to bromate showed that the
decline in the SH content of bromate responsive flours was
larger than that for non-responsive flours (Andrews et al.,
1995).
The literature regarding the SS contents of flours is
somewhat contradictory. Total SS content showed an
inverse relationship with various flour quality parameters
and also varied independently among very strong, strong
and weak wheat flours (Axford et al., 1962). In another
study neither total SH nor SS contents of flours showed
correlations with baking quality (Graveland et al., 1978).

M. Hayta, J.D. Schofield / Journal of Cereal Science 40 (2004) 245–256 255
4.4. Polypeptide composition
In wheat, the glutenin protein components of gluten are
polymers stabilised by intra- and intermolecular SS bonds
and the gliadins are monomers with either no SS bonds
(u-gliadins) or intramolecular bonds (a- and b-type)
(Tatham et al., 1990). During heating the native protein
structure is destabilised and unfolding may facilitate SH/SS
interchange and oxidation together with hydrophobic
interactions (Li and Lee, 1998).
The appearance of the HMW glutenin subunit region in
the reduced gels even after high temperature (90 8C) heat
treatment of gluten in the presence of bromate suggests that
the addition of bromate could reduce the decrease in protein
extractability caused by heat treatment. It is also likely that
bromate favours oxidation to the disulphide and higher
oxidation states. This observation is consistent with the
direct measurements of protein extractability for glutens
heated to different temperatures. This may occur by
weakening the extensive crosslinking of gluten. However,
this finding contrary to previous reports in which SDS-
PAGE (Atanassova and Popova, 1977) and SE-HPLC
(Bekes et al., 1996) of flour proteins showed that the high
molecular weight fraction (glutenin aggregates) increased as
a result of bromate treatment. A similar, but less
pronounced, effect of ascorbate was also observed. In a
study by Veraverbeke et al. (1997), it was found that
addition of the oxidant, potassium iodate, to dough resulted
in higher levels of SDS-extractable protein from bread. This
is consistent with the findings of the present study on heat-
induced SDS-extractability and the polypeptide compo-
sition of gluten proteins as determined SDS-PAGE analysis.
References
Andrews, D.C., Caldwell, R.A., Quail, K.J., 1995. Sulfhydryl analysis.II
Free sulfydryl content of heated doughs from two wheat cultivars and
effect of potassium bromate. Cereal Chemistry 72, 330–333.
Approved Methods of American Association of Cereal Chemist. 1995.
St Paul. MN.
Arakawa, T., Yonezawa, D., 1975. Compositional difference of wheat flour
glutens in relation to their aggregation behaviour. Agricultural and
Biological Chemistry 39, 2123–2128.
Atanassova, E., Popova, V. (1977). Effects of oxidising agents on the
proteins and lipids in wheat flour. In: Internationale Probleme
der Modernen Getreideverarbeitung und Getreidechemie.7th Symp.
pp 11-16.
Axford, D.W.E., Campbell, J.D., Elton, G.A.H., 1962. Disulphide groups in
flour proteins. Journal of the Science of Food and Agriculture 13,
73–78.
Bekes, F., Panozzo, J.F., Gupta, R.B., Ronald, J.A., Wrigley, C.W., 1996.
Bromate and baking test: changes in proteins and lipids. In: Proceedings
of the 46th Australian Cereal Chemistry Conferance. RACI, Melbourne.
pp. 313–316.
Beveridge, T., Toma, S.J., Nakai, S., 1974. Determination of SH and SS
groups in some food proteins using Ellman’s reagent. Journal of Food
Science 39, 49–51.
Bloksma, A.H., Bushuk, W., 1988. Rheology and chemistry of dough, in:
Pomeranz, Y. (Ed.), Wheat Chemistry and Technology, third ed,
pp. 131–152.
Booth, M.R., Melvin, M.A., 1979. Factors responsible for the poor
breadmaking quality of high yielding European wheat. Journal of the
Science of Food and Agriculture 30, 1057–1064.
Booth, M.R., Bottomley, R.C., Ellis, J.R.S., Malloch, G., Schofield, J.D.,
Timms, M.F., 1980. Annales de Technologie Agricole 29, 399–408.
Boye, J.I., Ma, C.Y., Harwalkar, V.R., 1997. Thermal denaturation and
coagulation of proteins, In: Damodaran, S., Paraf, A. (Eds.), Food
Proteins and Their Applications. Marcel Dekker, New York, pp. 25–44.
Butaki, R.C., Dronzek, B., 1979. Effect of protein content and wheat variety
on relative viscosity, solubility and electrophoretic properties of gluten
proteins. Cereal Chemistry 56, 162.
Chen, X., 1994. Glutathione in wheat, PhD Thesis, King’s College,
London.
Danno, G., Hoseney, R.C., 1982. Changes in flour proteins during dough
mixing. Cereal Chemistry 59, 249–253.
Eckert, B., Amend, T., Belitz, H.D., 1993. The course of SDS and zeleny
sedimentation tests for gluten quality and related phenomena studied
using the light microscope. Zeitschrift fur Lebensmittel-Untersuchung
und-Forschung. 196, 122–125.
Ewart, J.A.D., 1985. Blocked thiols in glutenin and protein quality. Journal
of the Science of Food and Agriculture 36, 101–112.
Finney, K.F., Barmore, M.A., 1948. Loaf volume and protein content of
hard winter and spring wheats. Cereal Chemistry 25, 291–312.
Fitchett, C.S., Frazer, P.J., 1986. Action of oxidants and other improvers,In:
Blanshard, J.M.V, Frazier, P.J., Galliard, T. (Eds.), Chemistry and
Physics of Baking Special Publication No. 56, 56. The Royal Society of
Chemistry, London, pp. 179–198.
Frater, R., Hird, F.J.R., Moss, H.J., Yates, J.R., 1960. A role for thiol and
disulfide groups in determining the rheological properties of dough
made from wheaten flour. Nature. 186, 451–454.
Graveland, A., Bosveld, P., Marseille, J.P., 1978. Determination of thiol
groups and disulphide bonds in wheat flour and dough. Journal of the
Science of Food and Agriculture 29, 53–61.
Graveland, A., Bosveld, P., Lichtendonk, W.J., Moonen, J.H.E., 1984.
Structure of glutenins and their breakdown during dough mixing by a
complex oxidation-reduction system, In: Graveland, A., Moonen, J.H.E.
(Eds.), Proceedings of 2nd International Workshop: Gluten Proteins.
Waganingen, Netherland.
Graveland, A., Bosveld, P., Lichtendonk, W.J., Marsseille, J.P.,
Moonen, J.H.E., Scheepstra, A., 1985. A model for the molecular
structure of the glutenins from wheat flour. Journal of Cereal Science 4,
1117–1128.
Grosch, W., Wieser, H., 1999. Redox reactions in wheat dough as affected
by ascorbic acid. Journal of Cereal Science 29, 1–16.
He, H., Hoseney, R.C., 1991. Gas retention in bread dough during baking.
Cereal Chemistry 68, 521–525.
Huang, D.Y., Khan, K., 1996. Unexpected solubility changes in wheat
proteins during fermentation and oven stages of the breadmaking
process. Cereal Chemistry 73, 512–513.
Ikoeza, K., Tipples, K.H., 1968. Farinoraph studies on the effect of various
oxidising agents in the sponge and dough system. Cereal Science
Today 13, 327–330 (see also p. 358).
Jeanjean, M.F., Damidaux, R., Feillet, P., 1980. Effect of heat treatment on
protein solubility and viscoelastic properties of wheat gluten. Cereal
Chemistry 57, 325–331.
Kent, N.L., Evers, A.D., 1994. Tecnology of Cereals, fourth ed. Pergamon
Press, Oxford, UK.
Kim, H.R., Bushuk, W., 1995. Changes in some physicochemical properties
of flour proteins due to partial reduction with dithiothreitol. Cereal
Chemistry 72, 450–456.
Laemmli, U.K., 1970. Cleavage of structural proteins during the assembly
of the head of bacteriophage T4. Nature 227, 680–685.

M. Hayta, J.D. Schofield / Journal of Cereal Science 40 (2004) 245–256256
Lavelli, V., Guerrieri, N., Cerletti, P., 1996. Controlled reduction study
of modifications induced by gradual heating in gluten proteins.
Journal of the Science of Food and Agriculture 44, 2549–2555.
Li, M., Lee, T.C., 1998. Effect of cysteine on the molecular weight
distribution and the disulfide crosslink of wheat flour proteins in
extrudates. Journal of the Science of Food and Agriculture 46, 846–853.
Mair, G., Grosch, W.J., 1979. Changes in glutathione content (reduced and
oxidised form) and the effect of ascorbic acid and potasium bromate on
glutathione oxidation during dough mixing. Journal of the Science of
Food and Agriculture 30, 914–920.
Matsuo, R.R., McCalla, A.G., 1964. Physicochemical properties of gluten
from three types of wheat. Canadian Journal Biochemistry 42, 1487–
1498.
Mauseth, R.E., Nees, J.L., Chamberlain, L.M., Johnston, W.R., 1967.
Oxidising and reducing effects in the continuous dough process. Cereal
Science Today 12, 390–396.
Nagao, S., Endo, S., Tanaka, K., 1981. Scanning electron microscopy
studies of wheat protein fractions from doughs mixed with oxidants at
high temperature. Journal of the Science of Food and Agriculture 32,
235–242.
Phillips, L.G., Whitehead, D.M., Kinsella, J.E., 1994. Structure-Function
Properties of Food Proteins. Academic Press, San Diego.
Pomeranz, Y., 1988. Composition and functionality of wheat flour
components,In: Pomeranz, Y. (Ed.), Wheat Chemistry and Technology,
vol. II. AACC, St Paul, MN.
Preston, K.R., Kilborn, R.H., 1984. Dough rheology and Farinograph, In:
D’Appolonia, B.L., Kunerth, W.H. (Eds.), Farinograph Handbook, third
ed. AACC, St Paul., MN.
Redman, H., Ewart, J.A.D., 1971. Measurement of disulphide bonds
in cereal glutelins. Journal of the Science of Food and Agriculture 22,
19–21.
Schofield, J.D., Bottomley, R.C., Timms, M.F., Booth, M.R., 1983. The
effect of heat on wheat gluten and the involvement of sulphydryl-
disulphide interchange reactions. Journal of Cereal Science 1, 241–253.
Sievert, D., Sapirstein, H.D., Bushuk, W., 1991. Changes in electrophoretic
patterns of acetic acid-insoluble wheat proteins during dough mixing.
Journal of Cereal Science 14, 243–256.
Stevens, D.J., 1987. Water absorption of flour, In: Morton, I.D. (Ed.),
Cereals in European Context. VCH. Weinhem and Ellis Horwood Ltd,
Chichester, pp. 273–284.
Tatham, A.S., Shewry, P.R., Belton, P.S., 1990. Structural studies of cereal
prolamins including wheat gluten. Advences in Cereal Science and
Technology 10, 1–78.
Tsen, C.C., 1968. Oxidation of sulfhydryl groups of flour by bromate under
various conditions and during the breadmaking process. Cereal
Chemistry 45, 531.
Tsen, C.C., Anderson, J.A., 1963. Determination of Sulfhydryl and
disulfide groups in floor and their relation to wheat quality. Cereal
Chemistry 40, 314–323.
Tsen, C.C., Bushuk, W., 1968. Reactive and total sulfhydryl and disulfide
contents of flours of different mixing properties. Cereal Chemistry 45,
58–62.
Veraverbeke, W.S., Roels, S.P., Delcour, J.A., 1997. Heat-induced
changes in sodium dodecyl sulphate-sedimentation volume and
functionality of vital wheat gluten. Journal of Cereal Science 26,
177–181.
Wang, G.I.J., Faubion, J.M., Hoseney, R.C., 1992. Studies of bread making
and reformation of SDS insoluble glutenin proteins with dough mixing
and resting. Lebensmıttel-Wıssenschaft und-Technologie-Food Science
and Technology 25, 228–231.
Weegels, P.L., Verhoek, J.A., de Groot, A.M., Hamer, R.J., 1994.
Effects on gluten of heating at different moisture contents. I.
Changes in functional properties. Journal of Cereal Science 19,
31–38.
Yamada, Y., Preston, K.R., 1992. Effects of individual oxidants and oven
rise and bread properties of Canadian short process bread. Journal of
Cereal Science 15, 237–244.
Top Related
Copyright © 2022 FDOKUMEN

