


Bahasa
Halaman
Hukum


Materials Characterization
Growth and microstructure evolution of the Nb2Al–Al3Nb
eutectic in situ composite
C.T. Riosa, P.L. Ferrandinib, S. Milenkovica, R. Carama,*
aState University of Campinas, P.O. Box 6122, Campinas, SP 13083-970, BrazilbCentro Universitario da FEI, C.P.85, CEP:09850-901, SP- Brasil
Abstract
In situ composite materials obtained by directional growth of eutectic alloys usually show improved properties, that make
them potential candidates for high temperature applications. The eutectic alloy found in the Al–Nb system is composed of the
two intermetallic phases Al3Nb (D022) and Nb2Al (D8b). This paper describes the directional solidification of an Al–Nb eutectic
alloy using a Bridgman type facility at growth rates varying from 1.0 to 2.9 cm/h. Longitudinal and transverse sections of grown
samples were characterized regarding the solidification microstructure by using optical and scanning electron microscopy,
energy dispersive spectroscopy (EDS) and X-ray diffraction. Despite both phases being intermetallic compounds, the eutectic
microstructure obtained was very regular. The results obtained were discussed regarding the effect of the growth rate on the
microstructure, lamellar–rod transition and variation of phase volume fraction.
D 2004 Elsevier Inc. All rights reserved.
Keywords: A. composites; A. intermetallic compounds; B. crystal growth; C. electron microscopy; D. microstructure
1. Introduction
In situ composites obtained by directional solid-
ification of eutectic alloys present interesting and
different properties when compared to their constitu-
ent phases. This material consists of alternating
lamellae of two phases or rods in a matrix. In the
Al–Nb system, the eutectic transformation leads to the
1044-5803/$ - see front matter D 2004 Elsevier Inc. All rights reserved.
doi:10.1016/j.matchar.2004.08.017
* Corresponding author. Tel./fax: +55 19 37883314.
E-mail address: [email protected] (R. Caram).
formation of the Nb2Al–Al3Nb in situ composite,
which is a potentially interesting high temperature
structural material due to its high melting point and
elevated thermal stability. The j phase, Nb2Al,
presents an ordered tetragonal structure (D8b), similar
to jCrFe. As a result of the wide composition range
(30 to 40 at.% at 1,600 8C), the lattice parameters
depend on Al content, varying from a=9.9525 2 and
c=5.169 2 for 32 at.%. Al to a=9.898 2 and c=5.187
2 for 42 at.%. Al. Al3Nb also presents an ordered
tetragonal structure (D022) similar to TiAl3. The lattice
parameters are a=3.844 2 and c=8.605 2 [1,2].
54 (2005) 187–193

C.T. Rios et al. / Materials Characterization 54 (2005) 187–193188
In spite that some information about this eutectic
system is available in the literature, including the results
mainly provided by Ludin [3], Kaufman and Nesor [4]
and Jorda [1], there are inconsistencies related to the
eutectic temperature and composition, as well as the
composition range of the intermetallic phases. On the
other hand, a well-accepted phase diagram of the Al–
Nb system was suggested by Massalski et al. [5].
Therefore, the main objective of this paper is to
investigate the microstructure evolution of the direc-
tionally solidified Nb2Al–Al3Nb eutectic alloy.
2. Materials and methods
High-purity niobium and aluminum were weighted
to meet the eutectic (Al–42.2 at.% Nb) and off-
eutectic compositions and then melted in an arc
furnace equipped with a vacuum system combined
with a pure argon injection system.
After preparing the alloys, they were directionally
solidified in a Bridgman type furnace. The samples
50.0 mm long and 6.0 mm in diameter were inserted
in high-purity Al2O3 crucibles and further within a
niobium tube used as susceptor. Next, the sample
together with the alumina crucible and the susceptor
were coaxially positioned inside a 50.0-mm diameter
quartz tube and heated by an induction coil properly
connected to a radiofrequency generator. The experi-
ments were carried out at 1610 8C, measured by an
optical pyrometer, using a thermal gradient of
approximately 100 8C/cm and growth rates varying
from 1.0 to 2.9 cm/h.
The microstructure details were evaluated on both
longitudinal and transverse sections by using conven-
tional procedures of sample preparation, optical and
scanning electron microscopy, energy dispersive
spectroscopy (EDS) and X-ray diffraction technique
using CuKa radiation. Measurements of lamellar
spacing were carried out using the line intercept
method on transverse sections, and the reported values
are a ten reading average.
3. Results and discussion
The eutectic temperature and composition were
determined by thermal analysis and microstructure
examination. After studying a series of compositions,
it was found that a fully eutectic sample corresponds
to a composition close to Al-42.2 at.% Nb. Results of
differential thermal analysis indicated that the eutectic
transformation occurs at the temperature of 1595.2 8C.Such information is in good agreement with data
provided by Jorda [1] and Massalski [5].
Fig. 1 shows a sequence of directionally solidified
eutectic microstructures grown at rates varying from
1.0 to 2.9 cm/h. On the SEM micrographs, the dark
phase is Al3Nb, and the light one is Nb2Al, while
under optical microscopy it is the opposite, since the
darker phase consists of Nb2Al. The use of a 1.0 cm/h
growth rate resulted in large lamellar spacings and a
very regular eutectic microstructure. This fact is
associated with an intense cooperative growth and
efficient mass transport in the liquid ahead the solid/
liquid interface. As the growth rate was increased, the
microstructure became more refined and less regular.
A 2.9 cm/h growth rate produced smaller lamellar
spacings and the microstructure exhibited eutectic
colonies, which may be attributed both to constitu-
tional undercooling and growth out of the coupled
zone. Furthermore, it was confirmed that in the Al–Nb
system, the relationship between lamellar spacing and
growth rate follows the classic Jackson and Hunt
equation, k2V=K [7]. The measurement of the
lamellar spacing on the transverse sections of direc-
tionally solidified samples at different growth rates,
indicated that K is equal to 4.19�10�7 cm3/h, as
shown in Fig. 2. The influence of the growth rate on
the microstructure can be summarized from Fig. 3,
where an abrupt increase in the growth rate led to
changes in lamellar spacing. In this case, the final
growth rate was high enough to cease the regular and
aligned lamellar array. The decrease in the lamellar
spacing is obtained by increasing the amount of
lamellae, which may be dependent on the movements
of lamellar faults. Such an adjustment mechanism is
well described in the literature [8]. According to
Jackson and Hunt [7], the lamellar spacing selection is
related to the growth with a minimum undercooling.
In the case of nonfaceted phases, the spacing adjust-
ments are easily obtained. However, this behavior
should not be expected when the Al3Nb–Nb2Al
eutectic is concerned, since this system consists of
two intermetallic phases that usually present high
melting entropy. Intriguing, this eutectic structure

Fig. 1. Sections of the directionally solidified samples grown at different rates: (a) 1.0 cm/h, longitudinal; (b) 1.0 cm/h, transverse; (c) 1.3 cm/h,
longitudinal; (d) 1.3 cm/h, transverse; (e) 1.6 cm/h, longitudinal; (f) 1.6 cm/h, transverse; (g) 2.0 cm/h, longitudinal; (h) 2.0 cm/h, transverse; (i)
2.9 cm/h, longitudinal and (j) 2,9 cm/h, transverse.
C.T. Rios et al. / Materials Characterization 54 (2005) 187–193 189
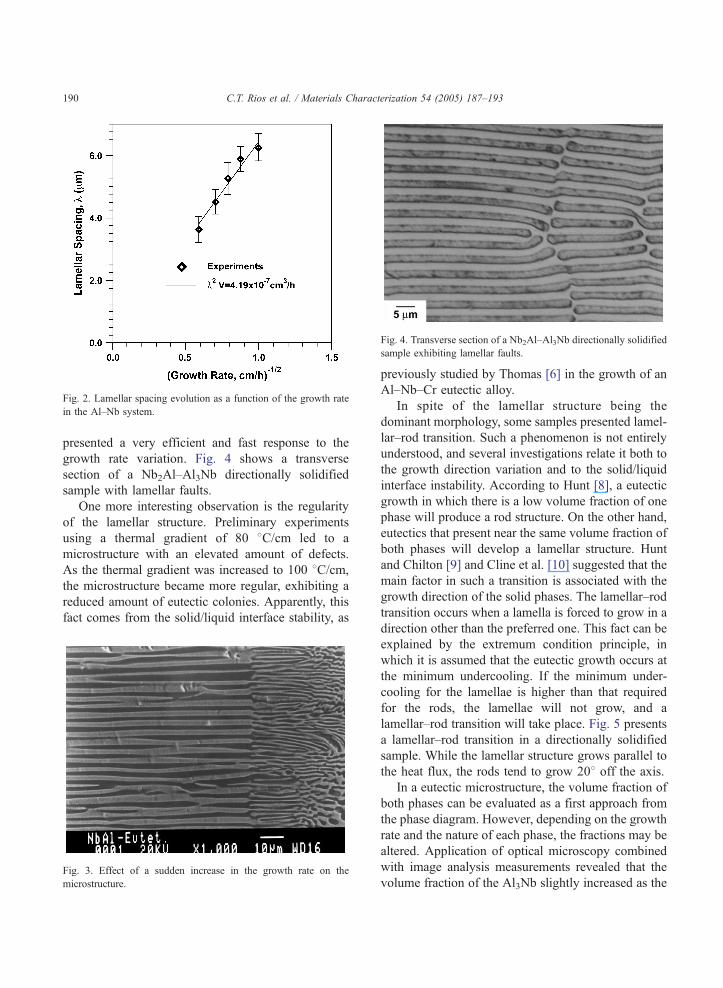
Fig. 4. Transverse section of a Nb2Al–Al3Nb directionally solidified
sample exhibiting lamellar faults.
Fig. 2. Lamellar spacing evolution as a function of the growth rate
in the Al–Nb system.
C.T. Rios et al. / Materials Characterization 54 (2005) 187–193190
presented a very efficient and fast response to the
growth rate variation. Fig. 4 shows a transverse
section of a Nb2Al–Al3Nb directionally solidified
sample with lamellar faults.
One more interesting observation is the regularity
of the lamellar structure. Preliminary experiments
using a thermal gradient of 80 8C/cm led to a
microstructure with an elevated amount of defects.
As the thermal gradient was increased to 100 8C/cm,
the microstructure became more regular, exhibiting a
reduced amount of eutectic colonies. Apparently, this
fact comes from the solid/liquid interface stability, as
Fig. 3. Effect of a sudden increase in the growth rate on the
microstructure.
previously studied by Thomas [6] in the growth of an
Al–Nb–Cr eutectic alloy.
In spite of the lamellar structure being the
dominant morphology, some samples presented lamel-
lar–rod transition. Such a phenomenon is not entirely
understood, and several investigations relate it both to
the growth direction variation and to the solid/liquid
interface instability. According to Hunt [8], a eutectic
growth in which there is a low volume fraction of one
phase will produce a rod structure. On the other hand,
eutectics that present near the same volume fraction of
both phases will develop a lamellar structure. Hunt
and Chilton [9] and Cline et al. [10] suggested that the
main factor in such a transition is associated with the
growth direction of the solid phases. The lamellar–rod
transition occurs when a lamella is forced to grow in a
direction other than the preferred one. This fact can be
explained by the extremum condition principle, in
which it is assumed that the eutectic growth occurs at
the minimum undercooling. If the minimum under-
cooling for the lamellae is higher than that required
for the rods, the lamellae will not grow, and a
lamellar–rod transition will take place. Fig. 5 presents
a lamellar–rod transition in a directionally solidified
sample. While the lamellar structure grows parallel to
the heat flux, the rods tend to grow 208 off the axis.
In a eutectic microstructure, the volume fraction of
both phases can be evaluated as a first approach from
the phase diagram. However, depending on the growth
rate and the nature of each phase, the fractions may be
altered. Application of optical microscopy combined
with image analysis measurements revealed that the
volume fraction of the Al3Nb slightly increased as the

Table 1
Nominal and measured values of chemical composition for the
eutectic structure and its phases
Phase Nominal Measured
Al (at.%) Nb (at.%) Al (at.%) Nb (at.%
Al3Nb 75.0 25.0 75.5 24.5
Nb2Al 33.3 66.7 43.9 56.1
Eutectic Structure 57.8 42.2 60.2 39.8
Fig. 5. Longitudinal section of a Nb2Al–Al3Nb eutectic sample
showing a lamellar–rod transition.
C.T. Rios et al. / Materials Characterization 54 (2005) 187–193 191
growth rate was increased, as shown in Fig. 6. The
coupled eutectic growth is a function of the solute
diffusion in the liquid in front of the solid/liquid
interface, which decreases when the solid/liquid
undercooling is increased. As the growth rate is
increased, the undercooling is increased too, which
may limit the eutectic growth. Depending on the
melting entropy of each phase, an increase in the
growth rate restricts the growth of one phase, leading
to an increase in the volume fraction of the other phase.
The examination of the eutectic microstructure by
means of EDS allows one to determine the compo-
sition of each phase, while the X-ray emission
technique reveals the distribution of Nb and Al in
both phases. Table 1 presents the compositions of the
Fig. 6. Volume fraction of the Al3Nb phase as a function of the
growth rate. Fig. 7. X-ray image of Nb and Al distribution in a eutectic sample
)
eutectic structure and its constituent phases, where
one can observe the difference between the nominal
and measured values, especially for the Nb rich Nb2Al
.

Fig. 8. X-ray diffraction of a transverse section of the directionally solidified sample.
C.T. Rios et al. / Materials Characterization 54 (2005) 187–193192
phase. Several reasons may cause the discrepancy,
like the considerable difference of Al and Nb atomic
numbers, uncertainty about the acceleration voltage,
beam deviation and small lamellar width. Fig. 7
presents a longitudinal microstructure and the Al and
Nb distributions in a directionally solidified sample.
As expected, Nb2Al presents much more Nb, while
Al3Nb is Al rich.
It is well known that the phases in a eutectic array
show some preferred growth direction, and this may
be attributed to the selection of a low-energy interface
between the phases during the growth [11]. Fig. 8
depicts X-ray diffraction traces from transverse
sections of a sample. Accordingly, the preferred
growth directions are (210) and (420) for Nb2Al and
(004) for Al3Nb.
4. Conclusions
The Al3Nb–Nb2Al eutectic system was success-
fully grown by directional solidification. The analysis
of the results shows that a very regular lamellar
structure was obtained, as well as a relationship
between lamellar spacing, k, and growth rate, V. It
follows the Jackson and Hunt equation, k2V=K, with
K=4.19�10�7 cm3/h. Despite the dominant morphol-
ogy being lamellar, some samples presented the
lamellar–rod transition, which is probably due to
changes in the lamellae growth direction. Examination
of the solid phases volume fraction indicates that an
increase in the growth rate leads to an increase in the
Al3Nb fraction, which is possibly attributed to an
undercooling increase during the eutectic growth.
Finally, X-ray diffraction analysis revealed that Nb2Al
grows preferably along the (210) and (420) directions,
while Al3Nb grows along the (004) direction.
Acknowledgements
The authors acknowledge FAPESP and CNPq for
financial support.
References
[1] Jorda JL, Flqkiger R, Muller J. A new metallurgical inves-
tigation of the niobium aluminium system. J Less-Common
Met 1980;75:227.

C.T. Rios et al. / Materials Characterization 54 (2005) 187–193 193
[2] Nourbakhsh S, Sahin O, Rhee WH, Margolin H. Micro-
estrutctural characterization of a zirconia-toughened alumina
fiber reinforced niobium aluminide composite. Acta Metall
Mater 1992;40(2):285.
[3] Lundin CE, Yamamoto AS. The equilibrium phase diagram,
niobium (columbium)-aluminum. Trans Metall Soc AIME
1963;236:863.
[4] Kaufman L, Nesor H. Theoretical approaches to the
determination of the phase diagrams. Annu Rev Mater Sci
1973;3:1.
[5] Massalski TB, Okamoto H, Subramaniam PR, Kacprzak L.
Binary alloy phase diagrams. 2nd ed. vol. 1. OH: ASM,
Materials Park; 12/1990. p.179.
[6] Thomas MK. Unidirectional solidification of a Cr–Nb–Al
eutectic alloy, conf. In: Jackson MR, et al., editors. In situ
Composites-II, Lake George, NY; 1976. p. 37.
[7] Jackson KA, Hunt JD. Lamellar and rod eutectic growth.
Trans AIME 1966;236:1129.
[8] Hunt JD. Developments in eutectics. J Cryst Growth
1968;3(4):82.
[9] Hunt JD, Chilton MA. An investigation of the lamellaYrod
transition in binary eutectics. J Inst Met 1962–1963;91:91.
[10] Cline HE, Walter JL, Lifshin E, Russell RR. Structures, faults,
and the rod-plate transitions in eutectics. Met Trans
1971;2:189.
[11] Elliott R. Eutectic solidification. Int Met Rev 1977;219:161.
Top Related
Copyright © 2022 FDOKUMEN

