


Bahasa
Halaman
Hukum


Article
Gli1/DNA interaction is a druggable target forHedgehog-dependent tumorsPaola Infante1,†, Mattia Mori1,†, Romina Alfonsi2,†, Francesca Ghirga3, Federica Aiello4, Sara Toscano1,
Cinzia Ingallina1, Mariangela Siler2, Danilo Cucchi2, Agnese Po2, Evelina Miele1, Davide D’Amico2,
Gianluca Canettieri2, Enrico De Smaele5, Elisabetta Ferretti5, Isabella Screpanti2,
Gloria Uccello Barretta4, Maurizio Botta6,7, Bruno Botta3,***, Alberto Gulino1,2,8,9,** &
Lucia Di Marcotullio2,*
Abstract
Hedgehog signaling is essential for tissue development and stem-ness, and its deregulation has been observed in many tumors.Aberrant activation of Hedgehog signaling is the result of geneticmutations of pathway components or other Smo-dependent orindependent mechanisms, all triggering the downstream effectorGli1. For this reason, understanding the poorly elucidated mecha-nism of Gli1-mediated transcription allows to identify novel mole-cules blocking the pathway at a downstream level, representing acritical goal in tumor biology. Here, we clarify the structuralrequirements of the pathway effector Gli1 for binding to DNA andidentify Glabrescione B as the first small molecule binding to Gli1zinc finger and impairing Gli1 activity by interfering with its inter-action with DNA. Remarkably, as a consequence of its robust inhib-itory effect on Gli1 activity, Glabrescione B inhibited the growth ofHedgehog-dependent tumor cells in vitro and in vivo as well as theself-renewal ability and clonogenicity of tumor-derived stem cells.The identification of the structural requirements of Gli1/DNA inter-action highlights their relevance for pharmacologic interference ofGli signaling.
Keywords cancer; Gli inhibitors; Gli1–DNA interaction; Hedgehog
Subject Categories Cancer; Chemical Biology; Structural Biology
DOI 10.15252/embj.201489213 | Received 10 June 2014 | Revised 4 November
2014 | Accepted 12 November 2014 | Published online 4 December 2014
The EMBO Journal (2015) 34: 200–217
Introduction
Inappropriate reactivation of the Hedgehog (Hh) developmental
signaling pathway is responsible for the formation and progres-
sion of several human cancers through aberrant regulation of the
functional properties of cancer stem cells (i.e. self-renewal,
survival, metastatic spread, neoangiogenesis) (reviewed in Gulino
et al, 2012; Amakye et al, 2013; Briscoe & Therond, 2013;
Aberger & Ruiz I Altaba, 2014). Autocrine/paracrine Shh, Ihh or Dhh
ligands bind to Patched (Ptch) receptor relieving its repressive
activity on the seven-transmembrane protein Smoothened (Smo),
which in turn activates the downstream transcription factors
belonging to the Gli family. Gli proteins harbor a five zinc finger
(ZF) region in which ZF4 and ZF5 domains bind target DNA in a
sequence-specific way, whereas ZF1, ZF2 and ZF3 bind the phos-
phate backbone and possibly contributed to control binding stabil-
ity and recruitment of co-regulatory factors (Kinzler & Vogelstein,
1990; Pavletich & Pabo, 1993). A C-terminal region is provided of
transactivating function through modulation of chromatin remod-
eling induced by recruitment of TFIID TATA box-binding protein-
associated factor TAFII31 (Yoon et al, 1998; Bosco-Clement et al,
2013) or HAT and HDAC (Canettieri et al, 2010; Malatesta et al,
2013), SWI-SNF5 (Jagani et al, 2010) and SWI/SNF-like Brg/Brm-
associated factor (Zhan et al, 2011). In this way, Gli transcription
factors behave as the final effectors for the control of specific
oncogenic target genes (Aberger & Ruiz I Altaba, 2014). Although
many Hh-driven human cancers involve upstream pathway acti-
vation (i.e. either loss-of-function Ptch1 or gain-of-function Smo
1 Center for Life NanoScience@Sapienza, Istituto Italiano di Tecnologia, Rome, Italy2 Department of Molecular Medicine, University La Sapienza, Rome, Italy3 Dipartimento di Chimica e Tecnologie del Farmaco, University La Sapienza, Rome, Italy4 Department of Chemistry and Industrial Chemistry, University of Pisa, Pisa, Italy5 Department of Experimental Medicine, University La Sapienza, Rome, Italy6 Department of Biotechnology, Chemistry and Pharmacy, University of Siena, Siena, Italy7 Sbarro Institute for Cancer Research and Molecular Medicine, Temple University, Philadelphia, PA, USA8 Istituto Pasteur, Fondazione Cenci-Bolognetti - University La Sapienza, Rome, Italy9 IRCCS Neuromed, Pozzilli, Italy
*Corresponding author. Tel: +39 649255657; Fax: +39 649255660; E-mail: [email protected] or**Corresponding author. Tel: +39 649255129; Fax: +39 649255660; E-mail: [email protected] or***Corresponding author. Tel: +39 649912781; E-mail: [email protected]†These authors contributed equally to this work
The EMBO Journal Vol 34 | No 2 | 2015 ª 2014 The Authors. Published under the terms of CC BY NC ND 4.0 license200
Published online: December 4, 2014

mutations or Smo activation by loss of cAMP/PKA-mediated
inhibitory Ga-GNAS tumor suppressor or ligand overproduction)
(Goodrich et al, 1997; Yauch et al, 2009; He et al, 2014), several
tumors harbor Smo-independent increased function of the
downstream Gli effectors, due to high protein levels or activatory
mechanisms (i.e. Gli gene amplification or epigenetically driven
overexpression, mutation in or loss of heterozygosity of SuFu
gene or a number of post-synthetic modifications such as
decreased ubiquitination-mediated degradation or acetylation of
the Gli proteins or increased PI3K/mTOR/S6K1 kinase-dependent
phosphorylation) (Kinzler et al, 1987; Taylor et al, 2002; Dahlen
et al, 2004; Di Marcotullio et al, 2006a, 2011; Canettieri et al,
2010; Wang et al, 2012; Mazza et al, 2013; Tang et al, 2014).
Notwithstanding, the mechanisms of regulation of Gli functions
and the way it interacts with target DNA and controls transcrip-
tion are still poorly understood.
Small molecules have been reported to represent helpful tools
to understand the mechanisms of modulation of Hh/Gli function
at the level of Smo transducer and Gli effector. This allowed the
development of several inhibitors targeting components of the
pathway in order to control tumor growth. However, whereas
several Smo antagonists are currently investigated in clinical
trials (GDC-0449 has been recently approved by FDA), a few Gli
inhibitors have been identified (Mas & Ruiz I Altaba, 2010; Coni
et al, 2013a). Therefore, novel drugs targeting specific molecular
steps underlying Gli function would be beneficial either for a
wide spectrum of patients whose tumors have high Gli protein
levels and/or activity. Furthermore, downstream activation of Gli
function is frequently occurring with the appearance of
resistance to Smo antagonists observed during therapy (Galimberti
et al, 2012; Amakye et al, 2013). The lack of information on the
structural and functional requirements of Gli1/DNA interaction
accounts for the low number of small molecules inhibiting Gli.
HPI-1 and HPI-4 have been shown to target the post-translational
events of Gli processing/ activation downstream of Smo, such as
increase of the proteolytic cleavage of Gli2-FL to its repressor
form Gli2-R or overall Gli1 degradation (Hyman et al, 2009).
Arsenic trioxide (ATO) has been recently shown to prevent Gli2
localization to primary cilium, thus leading to its proteolytic
degradation, while binding-dependent inactivation of Gli1 has not
been yet characterized (Kim et al, 2010; Beauchamp et al, 2011).
Similarly, GANT61 inhibits Gli1/DNA binding only in living cells,
suggesting that it indirectly impairs its interaction with target
gene promoters by as yet unelucidated mechanisms (Lauth et al,
2007).
Based on the knowledge of the crystallographic structure of the
zinc finger domain of Gli1 (Gli1ZF) in complex with DNA (Pavletich
& Pabo, 1993), together with NMR studies as well as computational
and experimental mutagenesis, we clarify here the structural
requirements of Gli1/DNA interaction and identify Glabrescione B
(GlaB), an isoflavone naturally found in the seeds of Derris
glabrescens (Leguminosae), as a novel small molecule that binds
Gli1ZF and interferes with its interaction with DNA. This small
molecule turned out to be an efficient inhibitor of the growth of Hh/
Gli-dependent tumors and cancer stem cells in vitro and in vivo,
indicating that Gli/DNA interference is an appealing therapeutic
strategy to control the heterogeneous molecular changes leading to
Hh/Gli pathway activation in cancer.
Results
Structural and functional requirements for Gli1/DNA interaction
To identify the molecular bases of the function of the Gli1/DNA
complex, we established a computational screening protocol, based
on the available X-ray structure of cobalt ion-coordinated Gli1ZF in
complex with DNA (Pavletich & Pabo, 1993) that, although structur-
ally relevant, does not provide by itself information on the energy of
the system. Therefore, we investigated the conformational dynamics
using the physiological zinc within the Zn-coordination system of
each zinc finger by performing four independent replicas of
molecular dynamics (MD) simulations. A representative Gli1ZF
structure was extracted from MD trajectories (Fig 1A, Supplemen-
tary Movie S1) for further ligand design in silico.
Based on MD analysis and X-ray structure, the impact of
serine and basic residues of ZF4 and ZF5 on the thermodynamic
stability of the Gli1ZF/DNA adduct was evaluated by computa-
tional alanine scanning. The delta energy (DG) of binding of Gli1
mutants to DNA was calculated along MD trajectories (Fig 1B,
Supplementary Table S1) and compared to the wild-type Gli1ZF
(Gli1ZF-WT) (DDG). The results show that the strongest DDGcontribution was given by basic residues involved in H-bonding
DNA bases or in electrostatic interaction with the phosphate
backbone of DNA. Indeed, mutation in silico of K340, K350, R354
in ZF4 and K360, K371, R380 and K381 of ZF5 strongly impaired
the Gli1ZF DG of binding to DNA.
To correlate these observations with transactivating function of
Gli1, we performed a functional assay in HEK293T cells,
transiently expressing ectopic Gli1 or different Gli1ZF mutants
and a Gli-dependent luciferase reporter driven by a Gli-responsive
consensus sequence. Mutations in K350 and R354 in ZF4 or R380
and K381 in ZF5 completely abrogated the transcriptional activity
of Gli1, whereas K340, K371 and K360 did it to a lesser extent.
Notably, a significant linear correlation was obtained
(R2 = 0.6918) by comparing each theoretical DDG value with the
respective percentage of luciferase activity observed in cell
assays.
Mutagenesis studies suggested that the above residues may be
involved in Gli1 binding to DNA (Fig 1C, Supplementary
Table S1). We chose the K350A and K340A mutants, showing
the highest and intermediate DDG of binding, respectively
(Supplementary Table S1), to test their direct interaction with
DNA. An electrophoretic mobility shift assay (EMSA) was
performed using equal amounts of recombinant GST-Gli1ZF-WT
or GST-Gli1ZF-K350A or GST-Gli1ZF-K340A (Supplementary Fig S2)
and a DNA probe containing Gli-responsive consensus DNA
sequence or a mutated version unable to bind Gli1 (Fig 1D and E).
Comparison with the strong DNA binding affinity of the
recombinant GST-Gli1ZF-WT confirms that GST-Gli1ZF-K350A
was unable to bind DNA, whereas GST-Gli1ZF-K340A did it, albeit
to a significantly lower extent (Fig 1E, Supplementary Fig S2).
Notably, these results correlate with the impaired and
intermediate transcriptional activity of Gli1ZF-K350A and
Gli1ZF-K340A mutants in cell-based assays, respectively (Fig 1C),
and suggest that both K350 and K340 are involved in DNA
binding and transcriptional activity, although with a different
strength.
ª 2014 The Authors The EMBO Journal Vol 34 | No 2 | 2015
Paola Infante et al Gli1/DNA complex as a drug target The EMBO Journal
201
Published online: December 4, 2014

Virtual library and transcriptional screening of Gli1 interactingsmall molecules
To understand whether Gli1 binding to DNA and function could be
regulated by small molecules, an in house library composed of more
than 800 unique natural compounds was docked toward the MD
representative Gli1ZF structure using the GOLD program (Supple-
mentary Fig S3) (Verdonk et al, 2003). Literature data (Sheng et al,
2006) and results of the mutagenesis study were used to set up
docking and analyze ligand poses, respectively. Indeed, only small
molecules able to interact at least with one of the basic residues
highlighted by the mutagenesis study were selected. The ligand DG
B
ZF4 ZF5
% lu
cife
rase
act
ivity
* *
*
*
**
*
*
0
20
40
60
80
100
ZF4 ZF5
MM-PBSA
-5
0
5
10
15
20
G b
indi
ng (k
cal/m
ol)
A
ZFs TAD
1 237 433 1020 1106
C
*
0
0.2
0.4
0.6
0.8
1
E
Canonical GliBS
Gli1
Mutated GliBS
P
D
rela
tive
DN
A b
indi
ngFigure 1. Structure-based analysis of Gli1/DNA complex.
A Representative Gli1ZF/DNA structure extrapolated from MD trajectories. Gli1ZF is shown as blue cartoon, residues involved in binding to DNA (based on single pointmutation study) are shown as magenta sticks, and Zn ions as gray spheres.
B Effect of Gli1ZF mutants on the binding affinity to DNA as predicted by in silico alanine scanning. The ΔΔG was calculated along MD trajectories as the differencebetween the ΔG of each Gli1ZF alanine mutant and Gli1ZF-WT. Results are shown as ΔΔG values in kcal/mol calculated by means of the MM-PBSA methods � SEM.
C Effect of Gli1ZF mutants on Gli1-dependent transcriptional activation. Luciferase assay was performed in HEK293T cells transfected with 12XGliBS-Luc (GliBS, Glibinding site), pRL-TK Renilla (normalization control), Flag-Gli1 WT or the indicated Flag-Gli1 mutants. Data show the mean � SD of three independent experiments.*P < 0.01; **P < 0.05 versus Gli1 WT. Western blot analysis of Flag-Gli1 WT or the indicated Flag-Gli1 mutant expression levels (bottom panel).
D Specific H-bond interactions between K350 of Gli1ZF and Gli1 binding site consensus, as predicted by MD.E Gli1/DNA binding. Double-stranded oligonucleotide containing the canonical GliBS sequence (50–TTGCCTACCTGGGTGGTCTCTCCACTT–30) or mutated GliBS sequence
used as control (50–TTGCCTACCTCCCACTTCTCTCCACTT–30) was used as probe (P) in EMSA experiments. The assay was performed using recombinant GST-Gli1ZF-WT(Gli1 zinc finger fragment: aa 242–424), GST-Gli1ZF-K350A and GST-Gli1ZF-K340A. The graph on the right indicates ratio (mean arbitrary units � SD from threeindependent experiments) of GST-Gli1ZF-WT or GST-Gli1ZF mutants bound to the labeled GliBS probe/GliBS-free probe normalized to the amount of GST-Gli1ZF-WT/DNA binding (as described in Materials and Methods). *P < 0.05 versus Gli1 WT.
Source data are available online for this figure.
The EMBO Journal Vol 34 | No 2 | 2015 ª 2014 The Authors
The EMBO Journal Gli1/DNA complex as a drug target Paola Infante et al
202
Published online: December 4, 2014

of binding was then computed by means of the MM-GBSA method
(Mori et al, 2011) and divided by the number of heavy atoms to
provide the ligand efficiency (LE) as the final scoring parameter. We
identified six molecules (three vismiones, GlaB, the chalcone V94
and the opioid alkaloid narceine) putatively behaving as potential
Gli1 inhibitors (Supplementary Fig S4A). To investigate the
functional activity of these compounds as specific modulators of
Gli1, we used the Gli-dependent luciferase reporter screening
assay. Whereas GlaB and Vismione E inhibited luciferase activity
to a similar extent as GANT61 (a previously characterized Gli1
antagonist, Lauth et al, 2007), Vismione B only partially displayed
inhibitory activity and other compounds were not active at all in
this context (Fig 2A, Supplementary Fig S4B and C). Since
vismiones have been shown to be quite chemically unstable in
different conditions (Delle Monache, 1985), thus possibly limiting
the identification of the bioactive specie, we focused further stud-
ies only on GlaB (Fig 2B).
Structural requirements for Gli1/GlaB interaction
To investigate whether the Gli1 inhibitory activity of GlaB was
associated to the direct interaction of this small molecule with
the transcription factor, we monitored by NMR spectroscopy the
GlaB proton mono-selective relaxation rates (Rms), which prove
the slowing down of the small molecule motion upon binding to
a receptor (Valensin et al, 1986; Neuhaus & Williamson, 1989).
To this end, the protons H-1 and H-3 and the C-2 and C-4
methoxyl groups were chosen as probe for the interaction of ring A,
proton H-11, H-12 and H-15 for ring B and proton H-8 for ring C
(Table 1; Fig 2B).
First, mono-selective relaxation rates of free GlaB (Rf) were
measured to normalize the Rms detected in GlaB/protein mixtures
(Table 1). In the presence of GST-Gli1ZF, a significant increase in
Rms was observed for the vicinal protons H-11 and H-12 (ring B),
and to a lesser extent H-15 (ring B) and H-8 (ring C) (Table 1;
Supplementary Fig S5). Instead, the Rms of ring A protons were not
perturbed by the presence of GST-Gli1ZF-WT and very likely were
not involved in binding to Gli1ZF. To rule out any possible interfer-
ence by the sole recombinant GST, we also monitored the Rms of
GlaB in the GlaB/GST mixture, showing a weak and unspecific
involvement of all rings A, B and C (Table 1; Supplementary Fig S5).
Therefore, ring B was identified as the specific molecular determi-
nant for the interaction between GlaB and GST-Gli1ZF.
Although NMR analysis of O-prenyl groups was not too informa-
tive, because of the broad proton signals, they might be crucial for
the correct positioning of GlaB ring B. Indeed, molecular docking
studies showed that GlaB and Vismione B and E preferably bind
within the same site at the interface between ZF4 and ZF5, with a
noticeable shape and pharmacophoric overlapping (Supplementary
Fig S6). The O-prenyl group at C-13 of GlaB is clearly overimposed
to that of Vismione E, suggesting that a prenyl chain in this position
may be relevant for Gli1 inhibition. GlaB derivatives without prenyl
chains (Supplementary Fig S7) were also tested through the Gli-
dependent luciferase reporter assay, but none of them was active,
reinforcing that ring B prenyl chains may be important for GlaB
biological activity.
To investigate the role of Gli1 K340 and K350 residues, both
involved in DNA binding and transcriptional function (Fig 1C–E),
we monitored Rms of GlaB with the GST-Gli1ZF-K340A single
mutant or the GST-Gli1ZF-K340A/K350A double mutant. Notably,
the specific interaction of GlaB ring B was preserved in binding
to the Gli1ZF-K340A, although with weaker local affinity
(Table 1; Supplementary Fig S5). This suggests that GlaB may
adopt a similar binding conformation toward Gli1ZF-WT and
Gli1ZF-K340A. In contrast, the additional K350A mutation in the
Gli1ZF-K340A/K350A double mutant completely affects the
capability of GlaB ring B to interact with Gli1ZF, thus providing a
GlaB proton pattern spanning non-specifically throughout rings A,
B and C, as observed with the sole GST (Table 1, Supplementary
Fig S5).
In summary, results of NMR studies show that GlaB interacts
directly with Gli1 and further emphasize the role of K340 and K350.
The ring B and prenyl groups turned out to be key determinants for
GlaB activity.
GlaB inhibits Hh signaling by imparing Gli1/DNA binding andtranscriptional activity
Confirming the ability of GlaB to target Gli1, this compound
significatively inhibited the luciferase activity driven by a Gli-
responsive element reporter in Smo�/� MEF cells transfected with
ectopic Gli1 (Fig 2C). Consistently, GlaB reduced the expression
of several endogenous Gli target genes, whereas unrelated
transcripts were unaffected (Fig 2D and F), without influencing
cell survival (Supplementary Fig S8). Indeed, GlaB suppressed Hh
gene signature in genetically defined Ptch1�/� mouse embryonic
fibroblasts (Ptch1�/� MEFs) (Fig 2D), in which deletion of the
inhibitory Ptch1 receptor releases Smo function and leads to a
constitutive activation of Gli transcription factors (Goodrich et al,
1997) (Fig 2E). To further prove that GlaB is acting downstream
of Smo, we used SuFu�/� MEFs. Reporter activity in these cells
is high even in the absence of Shh or Smo stimulation, because
of the loss of the well-known Gli1 inhibitor SuFu (Fig 2E), and is
not suppressed by treatment with the Smo inhibitor cyclopamine
(Svard et al, 2006). In this cellular context, GlaB reduced constit-
utive endogenous Hh target gene expression (Fig 2F). Moreover,
ChIP assay in Gli1-overexpressing MEF cells showed a significant
reduction of the recruitment of Gli1 into the promoter of Ptch1
gene (Fig 2G).
According to the high homology degree between ZF domain of
Gli1 and Gli2, GlaB also inhibited Gli2-mediated transcription
(Supplementary Fig S9). Conversely, since Jun/AP-1 has been
reported to synergize with Gli1 while co-occupying the promoter
region (Laner-Plamberger et al, 2009; Schnidar et al, 2009), we
tested GlaB activity on this transcription factor. GlaB did not affect
Jun/AP-1 activity (Supplementary Fig S10), further indicating its
selectivity for Hh/Gli signaling. To better address the direct effect of
GlaB on Gli, we knocked down Gli1 and Gli2 by siRNA (Fig 2H) in
Hh-dependent Daoy tumor cells belonging to the Shh MB subgroup
(Northcott et al, 2012; Triscott et al, 2013). GlaB was unable to
repress Ptch1 mRNA levels in siGli1/Gli2-knocked down Daoy cells,
indicating that the presence of Gli factors is required for GlaB
activity.
Furthermore, in vitro enzymatic assays demonstrated that GlaB
did not affect the catalytic activity of a number of protein kinases
known to modulate Gli function (Supplementary Fig S11).
ª 2014 The Authors The EMBO Journal Vol 34 | No 2 | 2015
Paola Infante et al Gli1/DNA complex as a drug target The EMBO Journal
203
Published online: December 4, 2014
B CA
E
G H
D F
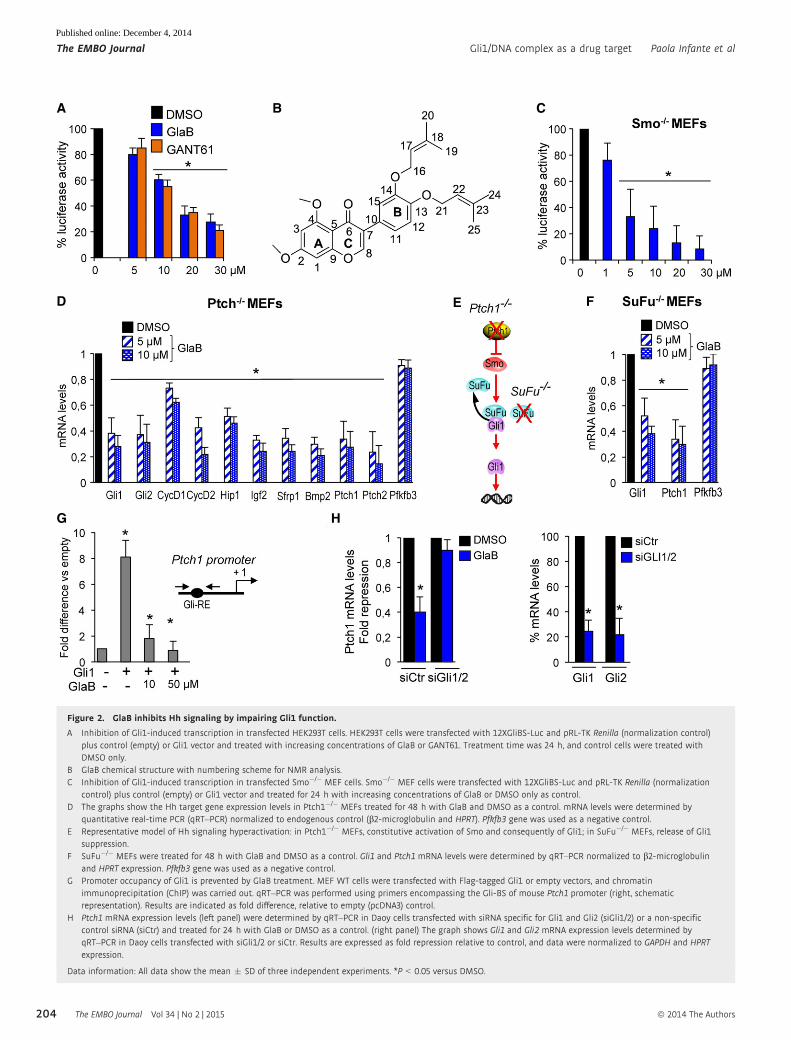
Figure 2. GlaB inhibits Hh signaling by impairing Gli1 function.
A Inhibition of Gli1-induced transcription in transfected HEK293T cells. HEK293T cells were transfected with 12XGliBS-Luc and pRL-TK Renilla (normalization control)plus control (empty) or Gli1 vector and treated with increasing concentrations of GlaB or GANT61. Treatment time was 24 h, and control cells were treated withDMSO only.
B GlaB chemical structure with numbering scheme for NMR analysis.C Inhibition of Gli1-induced transcription in transfected Smo�/� MEF cells. Smo�/� MEF cells were transfected with 12XGliBS-Luc and pRL-TK Renilla (normalization
control) plus control (empty) or Gli1 vector and treated for 24 h with increasing concentrations of GlaB or DMSO only as control.D The graphs show the Hh target gene expression levels in Ptch1�/� MEFs treated for 48 h with GlaB and DMSO as a control. mRNA levels were determined by
quantitative real-time PCR (qRT–PCR) normalized to endogenous control (b2-microglobulin and HPRT). Pfkfb3 gene was used as a negative control.E Representative model of Hh signaling hyperactivation: in Ptch1�/� MEFs, constitutive activation of Smo and consequently of Gli1; in SuFu�/� MEFs, release of Gli1
suppression.F SuFu�/� MEFs were treated for 48 h with GlaB and DMSO as a control. Gli1 and Ptch1 mRNA levels were determined by qRT–PCR normalized to b2-microglobulin
and HPRT expression. Pfkfb3 gene was used as a negative control.G Promoter occupancy of Gli1 is prevented by GlaB treatment. MEF WT cells were transfected with Flag-tagged Gli1 or empty vectors, and chromatin
immunoprecipitation (ChIP) was carried out. qRT–PCR was performed using primers encompassing the Gli-BS of mouse Ptch1 promoter (right, schematicrepresentation). Results are indicated as fold difference, relative to empty (pcDNA3) control.
H Ptch1 mRNA expression levels (left panel) were determined by qRT–PCR in Daoy cells transfected with siRNA specific for Gli1 and Gli2 (siGli1/2) or a non-specificcontrol siRNA (siCtr) and treated for 24 h with GlaB or DMSO as a control. (right panel) The graph shows Gli1 and Gli2 mRNA expression levels determined byqRT–PCR in Daoy cells transfected with siGli1/2 or siCtr. Results are expressed as fold repression relative to control, and data were normalized to GAPDH and HPRTexpression.
Data information: All data show the mean � SD of three independent experiments. *P < 0.05 versus DMSO.
The EMBO Journal Vol 34 | No 2 | 2015 ª 2014 The Authors
The EMBO Journal Gli1/DNA complex as a drug target Paola Infante et al
204
Published online: December 4, 2014

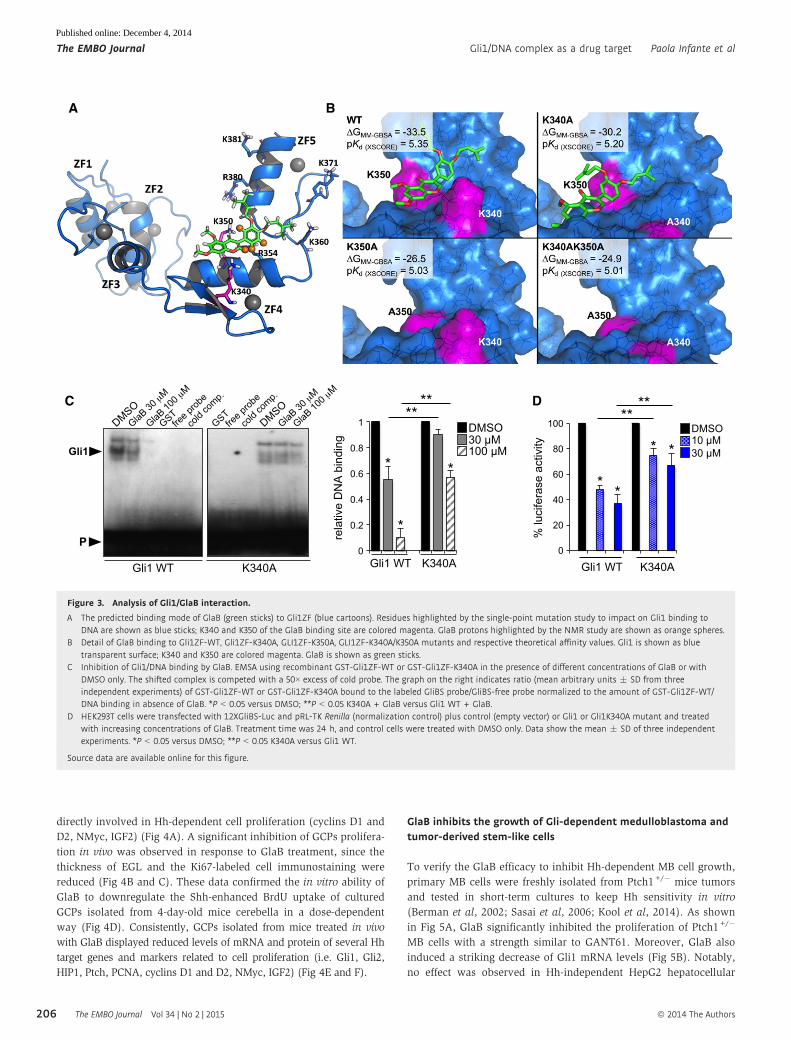
Analysis of GlaB binding mode to Gli1
The possible binding mode of GlaB to the representative Gli1 struc-
ture extrapolated from MD was investigated by molecular docking.
Although Gli1 is characterized by a scarce druggability, mostly due
to a rather flat surface, a high flexibility and the lack of deep lipo-
philic pockets, a significant cluster of top-ranking poses was found
in a surface groove between ZF4 and ZF5 (Fig 3A, Supplementary
Fig S12). The putative GlaB binding site was bounded by the resi-
dues at the N-terminal of ZF5 helix and by the side chain of K340,
which significantly contributes to sculpt the groove over the side
chain of R354 where the GlaB ring B performed its most profitable
interactions, in good agreement with NMR data (Fig 3B, Supplemen-
tary Figs S5 and S12). Besides non-specific hydrophobic contacts
within the putative binding site, GlaB also performed H-bond
interaction with the side chain of K350, a key residue in determining
Gli1/DNA binding and Gli1 transcriptional function (Fig 1B–E).
Moreover, the binding of GlaB to Gli1ZF-K340A, Gli1ZF-K350A
and Gli1ZF-K340A/K350A mutants was also investigated by molecu-
lar modeling and compared to that observed toward Gli1ZF-WT. In
agreement with NMR data, K350 was highlighted as the major
anchor point for GlaB within Gli1ZF. Indeed, in Gli1ZF-WT and the
Gli1ZF-K340A mutant, GlaB adopted a very similar binding
conformation and contacted K350 by H-bond interactions (Fig 3B).
Mutation of K350 to alanine significantly affected the specificity of
GlaB binding, as the small molecule was no more able to interact
within ZF4 and ZF5 (Fig 3B). Prediction of the ΔG of binding and
pKd values showed that GlaB has the highest affinity for Gli1ZF-WT,
whereas its affinity for Gli1ZF-K340A was slightly lower (Fig 3B), in
agreement with NMR studies and biological results. Contrarily, the
predicted GlaB affinity for Gli1ZF-K350A and Gli1ZF-K340A/K350A
was significantly lower than for Gli1ZF (Fig 3B), thus reinforcing
the structural relevance of K350 for Gli1 function and inhibition.
Therefore, we hypothesized that, by interacting with Gli1, GlaB
might impair its interaction with target DNA. As verified by EMSA,
the formation of Gli1ZF-WT/consensus DNA complex was strongly
prevented by GlaB (Fig 3C). The formation of DNA/Gli1ZF-K340A
single mutant is partially impaired with respect to WT protein,
implying a role of K340 in strengthening the binding with DNA.
However, the complex was still targeted by GlaB (Fig 3C), suggest-
ing its activity on the residual K350 amino acid of Gli1.
Consistent with the involvement of both K340 and K350 in
interaction with GlaB, this small molecule partially inhibited both
the formation of the DNA/Gli1ZF-K340A complex (Fig 3C) and the
transacting activity of the Gli1-K340A mutant compared to Gli1 WT
(Fig 3D), thus suggesting that GlaB binding to K340 contributes to
Gli1 inhibition.
Overall, these findings strongly support a GlaB direct inhibitory
activity on Gli1 by interfering with the cooperation of both K340
and K350 for binding to DNA and transcription function, thus
blunting Gli-driven gene expression.
GlaB inhibits Gli-dependent growth of cerebellum-derivednormal progenitors in vitro and in vivo
Subversion of Hh-dependent development of cerebellum is critical
for medulloblastoma (MB) formation (Wechsler-Reya & Scott, 2001;
Hatten & Roussel, 2011). Indeed, Hh signaling is crucial for enhancing
the expansion of a subset of granule cell progenitors (GCPs) that
populate the external germinal layer (EGL) of the cerebellar cortex
during the first week after birth in mice (Di Marcotullio et al, 2006b).
This process is triggered by Purkinje cell-derived Shh and is required
for intense GCP proliferation and proper development of the granule
neuron lineage. Importantly, the lack of GCP proliferation arrest
caused by withdrawal of Hh signal, which physiologically occurs
after the first week of age, is responsible for the tumorigenic conver-
sion of these progenitors, considered as the cell of origin of MB
(Schuller et al, 2008; Yang et al, 2008). In fact, mice harboring either
loss-of-function Ptch1 or gain-of-function Smo mutations develop
MB where Gli-dependent activation of specific oncogenic programs
(i.e. NMyc, IGF2) is required for tumor formation (Hahn et al, 2000;
Roussel & Robinson, 2013). Similar defects of Hh signaling pathway
are responsible for human MB (Goodrich et al, 1997).
To assess the in vivo efficacy of GlaB to interfere with Hh-
dependent growth events, we first tested its ability to suppress Hh
signaling in 6-day-old mouse cerebellar progenitors. GlaB treatment
reduced significantly the levels of several Gli target genes in the
cerebellar tissue in vivo (i.e. Gli1, Gli2, Ptch, Hip1) including genes
Table 1. Monoselective relaxation rates (Rms, s�1) of selected protons of GlaB (0.412 mM, 600 MHz, DMSO-d6, 25°C) and corresponding values ofnormalized relaxation rates (DR/Rf, where DR = Rms-Rf) in different mixtures.
Proton
GlaB/GST-Gli1ZF GlaB/GST-Gli1ZF K340AGlaB/GST-Gli1ZFK340A/K350A GlaB/GST
RING Rf(s�1) DR/Rf DR/Rf DR/Rf DR/Rf
H-1 A 0.41 0 0 0.03 0.02
2-OMe A 1.20 0 0 0.05 0.06
H-3 A 0.63 0 0 0.05 0.10
4-OMe A 1.39 0 0 n.d.a 0
H-8 C 0.36 0.13 0.05 0.07 0
H-11 B 0.63 1.20 0.15 0.38 0.22
H-12 B 0.89 0.95 0.23 n.d.b 0.03
H-15 B 0.76 0.22 0.22 0.14 0.14
aRelaxation rate of 4-OMe protons was not determined because its signal was partially superimposed to that of the water.bRelaxation rate of proton H-12 was not measured because of the large linewidth.
ª 2014 The Authors The EMBO Journal Vol 34 | No 2 | 2015
Paola Infante et al Gli1/DNA complex as a drug target The EMBO Journal
205
Published online: December 4, 2014
directly involved in Hh-dependent cell proliferation (cyclins D1 and
D2, NMyc, IGF2) (Fig 4A). A significant inhibition of GCPs prolifera-
tion in vivo was observed in response to GlaB treatment, since the
thickness of EGL and the Ki67-labeled cell immunostaining were
reduced (Fig 4B and C). These data confirmed the in vitro ability of
GlaB to downregulate the Shh-enhanced BrdU uptake of cultured
GCPs isolated from 4-day-old mice cerebella in a dose-dependent
way (Fig 4D). Consistently, GCPs isolated from mice treated in vivo
with GlaB displayed reduced levels of mRNA and protein of several Hh
target genes and markers related to cell proliferation (i.e. Gli1, Gli2,
HIP1, Ptch, PCNA, cyclins D1 and D2, NMyc, IGF2) (Fig 4E and F).
GlaB inhibits the growth of Gli-dependent medulloblastoma andtumor-derived stem-like cells
To verify the GlaB efficacy to inhibit Hh-dependent MB cell growth,
primary MB cells were freshly isolated from Ptch1+/� mice tumors
and tested in short-term cultures to keep Hh sensitivity in vitro
(Berman et al, 2002; Sasai et al, 2006; Kool et al, 2014). As shown
in Fig 5A, GlaB significantly inhibited the proliferation of Ptch1+/�
MB cells with a strength similar to GANT61. Moreover, GlaB also
induced a striking decrease of Gli1 mRNA levels (Fig 5B). Notably,
no effect was observed in Hh-independent HepG2 hepatocellular
A
C
P
Gli1 WT K340A
Gli1 *
*
* 100 µM 30 µM DMSO
0
0.2
0.4
0.6
0.8
1
** **
K340A Gli1 WT
% lu
cife
rase
act
ivity
Gli1 WT K340A
30 µM 10 µM DMSO
* *
* *
** **
0
20
40
60
80
100
B
D
rela
tive
DN
A b
indi
ng
Figure 3. Analysis of Gli1/GlaB interaction.
A The predicted binding mode of GlaB (green sticks) to Gli1ZF (blue cartoons). Residues highlighted by the single-point mutation study to impact on Gli1 binding toDNA are shown as blue sticks; K340 and K350 of the GlaB binding site are colored magenta. GlaB protons highlighted by the NMR study are shown as orange spheres.
B Detail of GlaB binding to Gli1ZF-WT, Gli1ZF-K340A, GLI1ZF-K350A, GLI1ZF-K340A/K350A mutants and respective theoretical affinity values. Gli1 is shown as bluetransparent surface; K340 and K350 are colored magenta. GlaB is shown as green sticks.
C Inhibition of Gli1/DNA binding by GlaB. EMSA using recombinant GST-Gli1ZF-WT or GST-Gli1ZF-K340A in the presence of different concentrations of GlaB or withDMSO only. The shifted complex is competed with a 50× excess of cold probe. The graph on the right indicates ratio (mean arbitrary units � SD from threeindependent experiments) of GST-Gli1ZF-WT or GST-Gli1ZF-K340A bound to the labeled GliBS probe/GliBS-free probe normalized to the amount of GST-Gli1ZF-WT/DNA binding in absence of GlaB. *P < 0.05 versus DMSO; **P < 0.05 K340A + GlaB versus Gli1 WT + GlaB.
D HEK293T cells were transfected with 12XGliBS-Luc and pRL-TK Renilla (normalization control) plus control (empty vector) or Gli1 or Gli1K340A mutant and treatedwith increasing concentrations of GlaB. Treatment time was 24 h, and control cells were treated with DMSO only. Data show the mean � SD of three independentexperiments. *P < 0.05 versus DMSO; **P < 0.05 K340A versus Gli1 WT.
Source data are available online for this figure.
The EMBO Journal Vol 34 | No 2 | 2015 ª 2014 The Authors
The EMBO Journal Gli1/DNA complex as a drug target Paola Infante et al
206
Published online: December 4, 2014

carcinoma cells or Jurkat T leukemia cells, which display undetect-
able levels of Gli1 (Lauth et al, 2007; Beauchamp et al, 2011)
(Supplementary Fig S13).
Several tumors, including MB, contain a small subset of stem-like
cells (SCs) responsible for cancer cell population expansion
(through unlimited self-renewal) that triggers tumorigenesis, drives
BA
E FD
C
Figure 4. GlaB inhibits Gli1-dependent growth of cerebellum-derived normal progenitors.
A qRT–PCR shows Hh target mRNA expression levels determined in 6-day-old mouse cerebellar progenitors after s.c. injections of GlaB.B Representative EGL H&E staining of 6-day-old mouse cerebellum after s.c. injections of GlaB (upper panel); immunohistochemistry shows Gli1 (middle panel) and
Ki67 stainings (lower panel). In all images, the scale bar represents 50 lm.C The graph shows the percentage of EGL thickness reduction in GlaB-treated mouse cerebella in comparison with vehicle mouse cerebella. Data show the
mean � SD of cerebella (n = 10) for each treatment. *P < 0.05 versus Ctr.D BrdU assay in GCPs. Cerebellar granule cell progenitors (GCPs) isolated from 4-day-old mice were treated with Shh (recombinant mouse Sonic Hedgehog, amino-
terminal peptide, ShhN, 3 lg/ml) and with different concentrations of GlaB, as indicated, for 48 h. Inhibition of cell proliferation was measured as percentage ofBrdU incorporation in comparison with DMSO-treated sample. Shown is the mean of three independent experiments. Error bars indicate SD. *P < 0.05 Shh versusDMSO; **P < 0.05 Shh + GlaB versus Shh.
E, F qRT–PCR and Western blot analysis show Hh and proliferation target mRNA and protein expression levels determined in ex vivo GCP culture derived from 6-day-old mouse cerebella after s.c. injections of GlaB. In all qRT–PCR experiments, the results were normalized to endogenous control (b2-microglobulin and HPRT).*P < 0.05 versus Ctr.
Source data are available online for this figure.
ª 2014 The Authors The EMBO Journal Vol 34 | No 2 | 2015
Paola Infante et al Gli1/DNA complex as a drug target The EMBO Journal
207
Published online: December 4, 2014

resistance to conventional therapies and favors tumor relapse
(Manoranjan et al, 2013). Hh signaling pathway is crucial for the
generation and maintenance of MB-SCs in human and mouse
through Gli-mediated transcriptional activation of the Nanog
stemness gene (Clement et al, 2007; Po et al, 2010; Garg et al,
2013), thus favoring tumorigenesis and MB progression. MB-SCs are
therefore appealing candidates for testing the therapeutic potential
of the novel Gli inhibitor we have identified, in order to eradicate
the tumor. We show that GlaB suppressed the ability of Ptch1+/�
MB-SCs to form spheres from single cell suspension (an expression
of their clonogenic self-renewal ability) that appeared reduced in
number and size (Fig 5C). Consistent with these results, GlaB
strikingly reduced Hh pathway activity as evaluated by the dramatic
decrease of the pathway readout Gli1, Gli2 and Ptch1 mRNAs,
B
0
0.2
0.4
0.6
0.8
1
0 24 48 72h 0 24 48 72h
Gli1
mR
NA
leve
ls GANT61
GlaB *
* *
* * *
MB in vitroPtch1+/-
0h 24h 48h 72h
200
400
600
800
1200
1000
A C
ell n
umbe
r (x1
03)
GlaB GANT61
DMSO
* *
Ptch+/- MB-SCs from secondary neurospheres
C E D F
0
0.2
0.4
0.6
0.8
1
Ctr
Gli1
G
li2
Ptc
h C
ycD
1 C
ycD
2 N
myc
P
CN
A N
anog
O
ct4
mR
NA
leve
ls
stemness cell growth Hh signature
DMSOGlaB
*
0 24 48h
DMSOGlaB
% B
rdU
upt
ake
0
20
40
60
80
100
* *
Pro-Casp-3
Cl. casp-3 Actin
GlaB - - + +
G
% n
s-fo
rmin
g ce
lls
0
10
20
30
40
*
* * GlaB 0 1 2 5 10 µM
* GlaB
Ctr
Actin
Nmyc
CycD1
PCNA
Gli1 GlaB - +
Oct4
% T
UN
EL-
posi
tive
cells DMSO
GlaB
0
20
40
60 *
24 48h
Figure 5. Inhibition of Gli-dependent MB tumor cell growth.
A, B Ex vivo cell cultures from Ptch1+/� mice MBs were treated with GlaB (5 lM), GANT61 (10 lM) or DMSO only. After the indicated times, a trypan blue count wasperformed (A) to determine the growth rate of viable cells. Gli1 mRNA expression levels were determined by qRT–PCR (B) normalized to endogenous control (b2-microglobulin and HPRT).
C–F GlaB inhibits MB-SCs’ self-renewal and proliferation. (C) Suspension of single MB-SCs isolated from Ptch1+/� mice. MBs were cultured in stem cell medium to allowthe formation of primary neurospheres. Primary neurospheres were dissociated and treated with increasing concentrations of GlaB or DMSO only. After 7 days oftreatment, the number of secondary neurospheres derived from a known number of single cells was counted. The self-renewal MB-SCs’ capability is expressed aspercentage of neurosphere-forming cells (left). Representative bright field images of tumor neurospheres after GlaB treatment are also shown (right). (D, E) MB-SCsisolated from Ptch1+/� mice MBs were treated for 48 h with GlaB (5 lM) or DMSO only. qRT–PCR and Western blot analysis show Hh, proliferation and stemnesstarget mRNA and protein expression levels. For qRT–PCR, results were normalized to endogenous control (b2-microglobulin and HPRT). (F) BrdU assay in MB-SCstreated with GlaB (5 lM) for 24 or 48 h and plated on polylysinated chamber slides. Inhibition of cell proliferation was measured as percentage of BrdUincorporation in comparison with DMSO-treated sample.
G TUNEL assay in MB-SCs. MB-SCs isolated from Ptch1+/� mice MBs were treated with GlaB (5 lM) and compared to DMSO-treated sample. Bottom panel shows aWestern blot of caspase-3 in GlaB-treated versus control cells.
Data information: In all experiments, data show the mean � SD of three independent experiments. *P < 0.05 versus DMSO.Source data are available online for this figure.
The EMBO Journal Vol 34 | No 2 | 2015 ª 2014 The Authors
The EMBO Journal Gli1/DNA complex as a drug target Paola Infante et al
208
Published online: December 4, 2014

stemness markers (Nanog, Oct4) as well as growth (cyclins D1 and
D2, PCNA) and oncogenic (NMyc) related signals (Fig 5D). The
ability of GlaB to suppress clonogenicity is due to inhibition of
stem-like cell proliferation, since BrdU uptake and PCNA protein
expression were significantly decreased at early phases (24 and
48 h) of cell expansion (Fig 5E and F). A pro-apoptotic role of
GlaB was also observed in MB-SCs, since the percentage of
TUNEL-labeled cells and the cleavage of caspase-3 were increased
after 48 h of drug treatment (Fig 5G).
In conclusion, the inhibitory activity of GlaB on the subset of
both normal and tumor progenitor/stem cells as well as the whole
tumor cell populations is restricted to Hh/Gli-dependent cells.
GlaB inhibits Gli-dependent growth of medulloblastomacells in vivo
To study the GlaB effect in vivo, we turned to an allograft model of
MB cells. Nude mice were grafted with spontaneous primary MB
from Ptch1+/� mice and treated every second day with s.c. injec-
tions of GlaB at a concentration of 75 lmol/kg or solvent only
(n = 6 for each group).
During an 18-day treatment period, suppression of tumor cell
growth was observed in GlaB-treated mice compared to controls
(Fig 6A and B). GlaB-treated tumor mass displayed a reduced cellu-
larity where a few MB cells were dispersed in a large amount of
Masson’s staining-mediated blue-labeled connective tissue,
compared to control (Fig 6C). Such a reduced cellularity was caused
by inhibition of tumor cell proliferation and survival, since the
percentages of Ki67 and TUNEL labeling were decreased and
increased, respectively, in GlaB-treated tumors (Fig 6C and D).
Consistently, additional markers of cell proliferation (PCNA, cyclins
D1 and D2), apoptosis (active caspase-3), oncogenicity (NMyc) and
stem-like cell content (Nanog) were also modulated by GlaB,
together with a reduction of Gli1 mRNA and protein levels (Fig 6E
and F). Overall, these findings suggest that GlaB interferes with
several Gli-dependent MB-associated processes.
A B
D E F
C
Figure 6. Ptch1+/� MB allografts.
A Change of tumor volume during GlaB or vehicle treatment period (18 days).B Representative flank allografts average volumes. Error bars indicate SD. *P < 0.05.C Representative Masson’s trichrome staining of tumors; immunohistochemistry of Gli1, Ki67 and TUNEL stainings. Scale bars represent 35 lm for Masson’s trichrome
staining, 25 lm for Gli1 and TUNEL, and 10 lm for Ki67 stainings.D Quantification of Ki67 and TUNEL stainings from immunohistochemistry shown in (C). Error bars indicate SD. *P < 0.05.E, F qRT–PCR and Western blot analysis show Hh and proliferation target mRNA and protein expression levels. For qRT–PCR, results were normalized to endogenous
control (b2-microglobulin and HPRT). Data show the mean � SD of tumor (n = 6) for each treatment. *P < 0.05 versus Ctr.
ª 2014 The Authors The EMBO Journal Vol 34 | No 2 | 2015
Paola Infante et al Gli1/DNA complex as a drug target The EMBO Journal
209
Published online: December 4, 2014
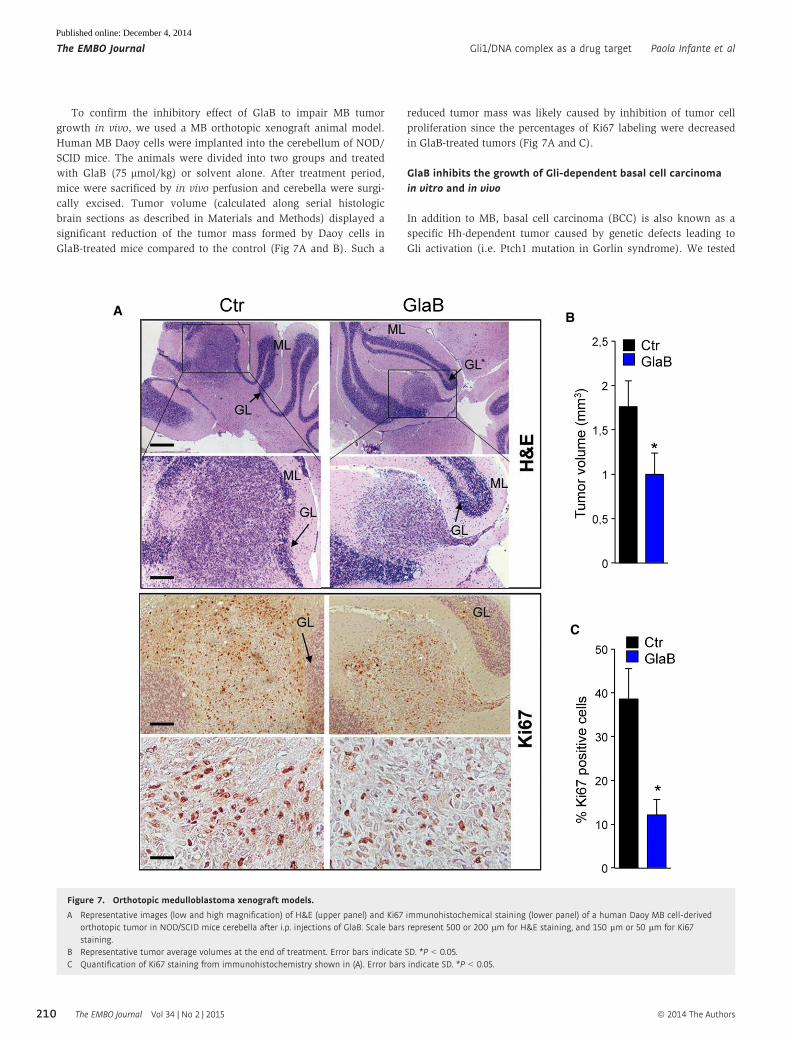
To confirm the inhibitory effect of GlaB to impair MB tumor
growth in vivo, we used a MB orthotopic xenograft animal model.
Human MB Daoy cells were implanted into the cerebellum of NOD/
SCID mice. The animals were divided into two groups and treated
with GlaB (75 lmol/kg) or solvent alone. After treatment period,
mice were sacrificed by in vivo perfusion and cerebella were surgi-
cally excised. Tumor volume (calculated along serial histologic
brain sections as described in Materials and Methods) displayed a
significant reduction of the tumor mass formed by Daoy cells in
GlaB-treated mice compared to the control (Fig 7A and B). Such a
reduced tumor mass was likely caused by inhibition of tumor cell
proliferation since the percentages of Ki67 labeling were decreased
in GlaB-treated tumors (Fig 7A and C).
GlaB inhibits the growth of Gli-dependent basal cell carcinomain vitro and in vivo
In addition to MB, basal cell carcinoma (BCC) is also known as a
specific Hh-dependent tumor caused by genetic defects leading to
Gli activation (i.e. Ptch1 mutation in Gorlin syndrome). We tested
A B
C
Figure 7. Orthotopic medulloblastoma xenograft models.
A Representative images (low and high magnification) of H&E (upper panel) and Ki67 immunohistochemical staining (lower panel) of a human Daoy MB cell-derivedorthotopic tumor in NOD/SCID mice cerebella after i.p. injections of GlaB. Scale bars represent 500 or 200 lm for H&E staining, and 150 lm or 50 lm for Ki67staining.
B Representative tumor average volumes at the end of treatment. Error bars indicate SD. *P < 0.05.C Quantification of Ki67 staining from immunohistochemistry shown in (A). Error bars indicate SD. *P < 0.05.
The EMBO Journal Vol 34 | No 2 | 2015 ª 2014 The Authors
The EMBO Journal Gli1/DNA complex as a drug target Paola Infante et al
210
Published online: December 4, 2014

the effect of GlaB on ASZ001 BCC cells, previously characterized as
an Hh/Gli-dependent tumor cell line harboring Ptch1 deletion
(Aszterbaum et al, 1999). BCC cell proliferation was impaired by
in vitro treatment with GlaB together with a suppression of Gli1
mRNA before a drug-induced cell death occurred (Fig 8A–C).
Notably, in vivo GlaB-induced tumor growth inhibition was also
observed in BCC s.c. allografts. A significant reduction of tumor
growth, as well as Gli1 mRNA levels, was observed 18 days after
administration of GlaB (100 lmol/kg) compared to solvent alone
(Fig 8D, E and H). GlaB-treated BCC allografts also displayed
decreased and increased Ki67 and TUNEL labeling, respectively, as
well as strong reduction of Gli1 expression (Fig 8F–H), suggesting a
drug-induced impairment of Hh-dependent tumor growth and
survival.
Discussion
In this study, we identify the structural requirements of Gli1/DNA
functional interaction and exploit this information to discover a
A B C
G D E H F
Figure 8. Inhibition of Gli-dependent BCC tumor cell growth.
A, B ASZ001 BCC cells were treated with GlaB (5 lM) or DMSO only. After the indicated times, a trypan blue count was performed to determine (A) the growth rate and(B) the percentage of cell death. Data show the mean � SD of three independent experiments. *P < 0.05 versus DMSO.
C Gli1 mRNA expression levels were determined by qRT–PCR after treatment of ASZ001 BCC cells with GlaB or DMSO only for the indicated times. Results werenormalized to endogenous control (b2-microglobulin and HPRT). Data show the mean � SD of three independent experiments. *P < 0.05 versus DMSO.
D–H GlaB inhibits Gli1-dependent BCC tumor growth in ASZ001 BCC allografts in vivo. (D) Change of tumor volume during GlaB or vehicle treatment period (18 days).(E) Representative flank allografts average volumes (upper panel). (F) H&E and immunohistochemical staining of Gli1, Ki67 and TUNEL of allograft tumor samples.Scale bars represent 50 lm for H&E, 25 lm for Gli1, 25 lm for Ki67 and 30 lm for TUNEL stainings. (G) Quantification of Ki67 and TUNEL stainings fromimmunohistochemistry shown in (F). (H) qRT–PCR of Hh and proliferation target mRNA expression levels. Results were normalized to endogenous control(b2-microglobulin and HPRT). Shown is the mean � SD of tumor (n = 6) for each treatment. *P < 0.05 versus Ctr.
ª 2014 The Authors The EMBO Journal Vol 34 | No 2 | 2015
Paola Infante et al Gli1/DNA complex as a drug target The EMBO Journal
211
Published online: December 4, 2014
low-molecular-weight compound capable of inhibiting Hh pathway
by targeting Gli1. Such a pharmacologic interference results in an
anti-tumor response in cultured cells and in vivo in transplanted
Hh-dependent tumor mouse models (MB and BCC).
Molecular bases of Gli1/DNA interaction
The structural and functional requirements of Gli1 interaction with
target promoters are far to be elucidated, although intensively
investigated. We identify here K340 and K350 residues as crucial
determinants of Gli1 binding to DNA and of its transcriptional
activity. Notably, K350 has been shown by MD to specifically bind
to the Gli consensus sequence by means of H-bond interactions with
two guanine bases and not by contacting the phosphate backbone,
thus providing a likely structural explanation for its critical role in
direct targeting specific DNA sequences. Site-specific mutagenesis
further supports this model through EMSA and reporter luciferase
assays.
Molecular mechanisms involved in Gli1 and Gli2 function have
so far addressed specific residues affected by post-translational
modifications occurring outside the DNA binding domain. Phos-
phorylation of S84 by mTOR/S6K1 releases Gli1 from its inhibitor
SuFu (Wang et al, 2012), a mechanism possibly involved also in
phosphorylation controlled by RAS/MAPK pathway (reviewed in
Aberger & Ruiz I Altaba, 2014). Furthermore, Y859, Y872 and S1060
of Gli1 are cooperatively bound by the E3 ligase Itch (Di Marcotullio
et al, 2006a, 2011), while DC degrons (residues 462–467) bind
bTrCP, all leading to protein ubiquitination and degradation
(Huntzicker et al, 2006). Finally, K518 (Gli1) and K757 (Gli2) are instead
acetylatable residues preventing transcriptional activity (Canettieri
et al, 2010; Coni et al, 2013b), whereas T374 of the Gli1ZF is a
major PKA site contrasting Gli1 localization into the nucleus (Sheng
et al, 2006). Once phosphorylated by aPKCι/k, S243 and T304 of
the GliZF confer to the protein an enhanced ability to form a
complex with DNA (Atwood et al, 2013), possibly through a confor-
mational change or binding stabilization or the recruitment of addi-
tional co-regulatory proteins, as these amino acids are located in
ZF-1 and ZF-3 that mainly establish a few contacts only with the
phosphate backbone. Overall, these data also imply that drug-mediated
interference with cell signals driving such a post-translational modi-
fication may impact on Gli1 function. Instead, neither acetylation
nor ubiquitination has been reported to affect K350 and K340,
suggesting that these residues are involved per se in DNA recogni-
tion. Therefore, they are likely direct druggable targets. To this
Gli-consensus DNA element
Smo[i] Ptch1mut/loss Smomut Loss GNAS Smo
Gli[i]
Kinase[i]
HDAC[i]
Hh antagonists:
[JQ1]
Cancer genetic/epigenetic changes:
SUFUmut Gli1/2 ampl.
BRD4 Gli1 act aPKC P-Gli1
PI3K/AKT/mTOR/S6K P-Gli1 RAS P-Gli1
Numb loss Gli1-Ub
HAD1/2 Gli1-Ac
GlaB
ZF1
ZF3
ZF2
ZF4
ZF5
K340
K350
Transcription ON
Transcription OFF
Cell growth Gli1
Figure 9. Schematic model of GlaB mechanisms of action.Several tumors harbor a number of genetic/epigenetic changes that activate Hh signaling to induce the Gli1 transcriptional activity. These mechanisms may be targetedby specific inhibitors (i.e. against Smo, BRD4, kinases, HDAC1/2). Gli1 suppression may be achieved by the common route of the interaction of Gli1 to DNA that ismediated by specific residues such as K350 localized in Gli1 ZF4. GlaB achieves the most profitable interactions on a groove sculpted by K340 residue on the surface of ZF4 aswell as a direct binding to K350. In this way, GlaB would mask critical DNA docking sites and impair the Gli1/DNA interaction, thus blunting the expression of Gli1target genes and repressing cell growth consequently.
The EMBO Journal Vol 34 | No 2 | 2015 ª 2014 The Authors
The EMBO Journal Gli1/DNA complex as a drug target Paola Infante et al
212
Published online: December 4, 2014

regard, by combining mutagenesis studies with NMR spectroscopy
and molecular simulations, we demonstrate here that K340 and
K350 are also bound by GlaB, the first described small molecule able
to impair Hh oncogenic activity in vitro and in vivo by inhibiting
Gli1 interaction to DNA. K340 may sculpt a groove over the side
chain of R354 on the rather flat surface of ZF4 where GlaB achieves
the most profitable interactions, whereas K350 contacts directly
GlaB by H-bond. These findings are consistent with the lack of activ-
ity of GlaB on several enzymes that have been described to modu-
late the function of Gli through post-synthetic modifications (i.e. the
phosphokinases Dyrk1, GSK3b, PKA, p70S6K, RAS/ERK). In this
way, we suggest that GlaB, binding to specific residues involved in
Gli1/DNA interaction, would mask critical DNA docking sites,
blunting the expression of target genes (Fig 9).
Translational relevance of regulation of Gli1/DNA interaction bysmall molecules: Smo/Gli activation redundancy versus thebottleneck of Gli/DNA interference
The biological relevance of our data is provided by the demon-
stration that Gli1/DNA interaction is druggable in order to inhibit
the Gli1 hyperactivation induced not only by upstream Smo/
cilium-derived signals, but also by the emerging downstream
bypass mechanisms (i.e. Gli1 phosphorylation, gene copy number
amplification, BRD4-driven epigenetic activation, deubiquitination,
deacetylation or activation by aPKCι/k or p70S6K or RAS/ERK)
that are responsible for the resistance to anti-Smo drugs
frequently observed in Hh-dependent tumor initiation, progression
and relapse (Amakye et al, 2013; Aberger & Ruiz I Altaba, 2014;
Tang et al, 2014). Indeed, non-canonical Hh/Gli pathway activa-
tion independent of Smo signals is emerging as an oncogenic load
driven by genetic and/or epigenetic hyperactivation of several
oncogenes commonly observed in tumors (Aberger & Ruiz I
Altaba, 2014) (Fig 9). The redundancy of such Gli-activating
mechanisms observed in several types of Hh-dependent tumors
may represent a challenge for the design of targeted personalized
therapies. PI3K/AKT inhibitors have been described to rescue the
anti-Smo drug resistance through inactivation of S6K1-enhanced
Gli1 phosphorylation (Buonamici et al, 2010). Similarly, hyperacti-
vation of aPKCι/k in BCC accounts for the resistance to Smo
inhibitor drugs and can be rescued by specific kinase inhibitors
(Atwood et al, 2013). Finally, HDAC inhibitors are effective in
suppressing Hh signaling and tumor growth cancer cell popula-
tions where HDAC1/2 are overexpressed (Canettieri et al, 2010).
Therefore, drug-mediated inhibition of the multiple signals that
enhance Gli1 through targeting its post-translational modifications
would appear to require a combination of therapeutic approaches
(Fig 9).
Instead, the identification of the structural requirements of
Gli1/DNA binding and of an interfering small molecule provides
valuable insights to optimize the pharmacologic strategies of direct
Gli1 targeting to prevent its interaction with DNA and the subse-
quent functional outputs. This would be an appealing therapeutic
strategy focusing on the unique downstream Gli transcriptional
effector rather than targeting a variety of upstream oncogenic
deregulated signals that either characterize each type of tumor or
sustain the evolution of tumor throughout drug sensitivity
changes.
Materials and Methods
Electrophoretic mobility shift assay
The canonical Gli binding sequence (Gli-BS, 50–TTGCCTACCTGGGTGGTCTCTCCACTT–30) or its mutant form unable to bind
Gli1 (50–TTGCCTACCTCCCACTTCTCTCCACTT–30) was produced
by annealing complementary oligos. Fragments were end-labeled
with c32P-ATP using T4 polynucleotide kinase in accordance
with manufacturer’s instructions and purified through G25
columns (Amersham Pharmacia, Milan, Italy) and used as probe
for electrophoretic mobility shift assays (EMSA). Glutathione
S-transferase (GST) fusion proteins, only-GST, GST-Gli1ZF-WT
(Gli1 zinc finger fragment: aa 242–424), GST-Gli1ZF-K340A or
GST-Gli1ZF-K350A, were produced as previously described (De
Smaele et al, 2008). Binding reactions were performed at room
temperature for 20 min using 4 lg of GST fusion proteins and
20,000 c.p.m. of 32P-end-labeled probes in 20 ll. The final concen-
tration of components of the binding buffer for all EMSA experi-
ments were the following: 50 mM HEPES (pH 7.5), 100 mM KCl,
5 mM DTT, 1 mM EDTA, 20% glycerol, 0.05% NP-40, 0.2 lg/llBSA, 5 mM MgCl2 and 50 lg/ml poly(dI)-poly(dC). Competition
experiments were performed by adding 50× molar excess of cold
oligonucleotides. Complexes were resolved on a non-denaturating
5% PAGE, dried and exposed for autoradiography. Radiolabeled
bands were quantitated with a PhosphorImager densitometer
(Molecular Dynamics) using IMAGE QUANT software to assess the
ratio of probe bound to GliZF versus free probe.
Docking-based analysis of GlaB binding to Gli1 and itsalanine mutants
The binding conformation of GlaB to Gli1ZF-WT, Gli1ZF-K340A,
Gli1ZF-K350A and Gli1ZF-K340A/K350A was studied by molecular
docking simulations, performed with the same program used for
virtual screening. Docking efficacy was improved to 200%, while
the binding site radius was set at 26 A. Docking complexes were
further relaxed by 5,000 steps of energy minimization in explicit
water solvent. GlaB affinity was then estimated by means of the
MM-GBSA method, and the pKd was computed by the empirical
functions implemented in XSCORE (Wang et al, 2002, 2003).
Molecular dynamics simulations
Initial coordinates of the Gli1ZF/DNA complex were retrieved from
the Protein Data Bank, under the PDB accession code 2GLI (X-ray
crystal structure at 2.6 A resolution) (Pavletich & Pabo, 1993). Coor-
dinates of water molecules were removed from the complex, and
original cobalt ions were manually replaced with zinc ions within
the coordination system of each ZF. The Amber11 program was
used for generating MD trajectories and performing energy calcula-
tions. AmberTools1.5 was used for preparing input coordinates and
topology files, and for performing the preliminary analysis of MD
trajectories by the ptraj and cpptraj modules. The ff99bsc0 force
field, which incorporates updates and modifications to the success-
ful ff99 force field, was used. Parameters for the zinc ion and resi-
dues within the zinc coordination system were adapted from a
previous QM study (Mori et al, 2010). The Gli1ZF/DNA complex
ª 2014 The Authors The EMBO Journal Vol 34 | No 2 | 2015
Paola Infante et al Gli1/DNA complex as a drug target The EMBO Journal
213
Published online: December 4, 2014

was inserted in a cuboid box of explicit TIP3P-typed water mole-
cules, buffering 8 A from the macromolecular system. The total
charge of the system was neutralized by the addition of sodium
counterions. The solvated macromolecular system was first energy
minimized by using SANDER. In details, water molecules and coun-
terions were first minimized for 250 steps by using a steepest
descent algorithm (SD) and for 750 steps by using a conjugate gradi-
ent algorithm (CG), while keeping Gli1ZF/DNA frozen. Then, the
solvated system was energy minimized for 1,000 steps SD and
further 4,000 steps CG without positional restraints, before heating
from 0 to 300 K for 50 ps with the Langevin thermostat. Density
was equilibrated for 50 ps. In these steps, Gli1 and DNA backbones
were restrained with a harmonic force constant of 5.0 kcal/mol/A2.
Restrained MD trajectories were produced for 3 ns while the force
constant was gradually decreased from 5 to 1 kcal/mol/A2. Finally,
unrestrained MD trajectories were generated for 20 ns. During all
MD simulations, a time step of 0.001 ps was used. Four independent
replicas of unrestrained MD simulations were performed, starting
from slightly different initial coordinates.
In silico alanine scanning
The alanine scanning procedure implemented in Amber11 was
used. The calculation of the delta energy of binding (ΔG) of
Gli1ZF to DNA was performed along 200 frames of each MD
trajectory, by means of the Molecular Mechanics Poisson
Boltzmann Surface Area (MM-PBSA) method. The delta–delta
energy of binding (ΔΔG) was calculated as the difference between
the ΔG of each Gli1ZF alanine mutant and the ΔG of the Gli1ZF-WT.
Water molecules closest to R354 and K381 were explicitly
accounted for in ΔΔG calculations.
NMR
NMR measurements were performed on a spectrometer operating at
600 MHz for 1H. The temperature was controlled to � 0.1°C. The
spin-lattice selective relaxation rates were measured by using the
inversion recovery pulse sequence (180°-s-90°-t)n and by applying a
selective p-pulse at the selected frequency. Measurements were
carried out for some protons of GlaB in the free state and in the
presence of different proteins ([GlaB] = 0.412 mM; GlaB/
protein = 150:1, DMSO-d6 solutions, 25°C). Each measurement was
repeated at least four times.
Source and characterization of GlaB
Glabrescione B (GlaB) was extracted and purified from seeds of
Derris glabrescens (Leguminosae) by following the procedure
already described (Delle Monache et al, 1977). Chemical identity
was established by NMR analysis and mass spectrometry. Purity of
the sample used in this study was higher than 99.5% by HPLC,
performed on a Phenomenex Luna C18, 5.0-lm stainless steel
column (250 × 4.0 mm L. × I.D.). Mobile Phase A: H2O:ACN, 95:5 v/v.
Mobile Phase B: H2O:ACN, 5:95. Gradient elution: 0–5 min A:B,
50:50; 5–20 min up to 100% B; 20–25 min 100% B. Flow rate:
1.0 ml/min. UV detection at 295 nm: retention time: 17.29 min.
GlaB characterization data are described in Supplementary Mate-
rials and Methods.
6-day-old mice injections
Six-day-old CD1 mice were randomly divided into two groups
(n = 6) and injected s.c. with solvent only (2-hydroxypropyl-b-cyclodextrin:ethanol, 3:1) or GlaB in solvent (100 lmol/kg) for
2 days (2-hydroxypropyl-b-cyclodextrin was purchased from Sigma
Aldrich). Cerebella were collected, and mRNA levels were deter-
mined by qRT–PCR. Histological sections were stained and surface
size calculated by Image Pro Plus 6.2 software.
Allograft experiments
Spontaneous MB from Ptch1+/� mice was isolated, minced and
pipetted to obtain a single-cell suspension. Equal volumes of cells
(2 × 10⁶) were injected s.c. at the posterior flank of female BALB/c
nude mice (nu/nu) (Charles River Laboratories, Lecco, Italy).
Tumors were grown until a median size of ~100 mm3. Animals were
randomly divided into two groups (n = 6) and treated with solvent
only (2-hydroxypropyl-b-cyclodextrin:ethanol, 3:1) or GlaB in
solvent (75 lmol/kg) for 18 days. 2 × 10⁶ ASZ001 BCC cells were
resuspended in an equal volume of 154CF medium and Matrigel
(BD Biosciences, Heidelberg, Germany) and injected s.c. at the
posterior flank of female NOD/SCID mice (Charles River Laborato-
ries, Lecco, Italy), as previously described (Eberl et al, 2012).
Tumors were grown until a median size of ~200 mm3. Animals were
randomly divided into two groups (n = 6) and treated with solvent
only (2-hydroxypropyl-b-cyclodextrin:ethanol, 3:1) or GlaB in
solvent (100 lmol/kg) for 18 days. Tumor growth was monitored
by measuring the size by caliper. Tumor volumes change was calcu-
lated by the formula length × width × 0.5 × (length + width) (Lauth
et al, 2007). All animal experiments were approved by local ethics
authorities.
Intracerebral tumor cell implantation
Adult female NOD/SCID mice were obtained from Charles River
Laboratories. Briefly, mice were anesthetized by i.p. injection of
ketamine (10 mg/kg) and xylazine (100 mg/kg). The posterior
cranial region was shaved and placed in a stereotaxic head frame.
Daoy cells (prepared from fresh culture to ensure optimal viability
of cells during tumor inoculation) were stereotaxically implanted
into the cerebellum (0.2 × 10⁶/3 ll) at an infusion rate of 1 ll/min
by using the following coordinates according to the atlas of Franklin
and Paxinos: 6.6 mm posterior to the bregma; 1 mm lateral to the
midline; and 2 mm ventral from the surface of the skull. After injec-
tion, the cannula was kept in place for about 5 min for equilibration
of pressures within the cranial vault. The skin was closed over the
cranioplastic assembly using metallic clips. After 10 days following
tumor implantation, the animals were randomly divided into two
groups (n = 6) and treated i.p with solvent only (2-hydroxypropyl-
b-cyclodextrin:ethanol, 3:1) or GlaB in solvent (75 lmol/kg) every
second day. After 25 days of treatment, animals were sacrificed and
in vivo perfused and brains were fixed in 4% formaldehyde in 0.1 M
phosphate buffer (pH 7.2) and paraffin embedded. For brain tumor
volume calculation, serial thick coronal sections (2 lm) starting
from the mesencephalon to the end of cerebellum were performed.
The analysis was performed on 40 sections of 2 lm, sampled every
40 lm on the horizontal plan of the cerebellum, in which the
The EMBO Journal Vol 34 | No 2 | 2015 ª 2014 The Authors
The EMBO Journal Gli1/DNA complex as a drug target Paola Infante et al
214
Published online: December 4, 2014
cerebellum was identified and outlined at 2.5× magnification. Every
40 lm of brain slice H&E staining was performed. Tumor area of
every slice was evaluated with a microscope (Axio Imager M1
microscope; Leica Microsystems GmbH, Wetzlar, Germany)
equipped with a motorized stage and Image Pro Plus 6.2 software.
The following formula was used to calculate brain tumor volume:
tumor volume = sum of measured area for each slice × slice thick-
ness × sampling frequency. All animal experiments were approved
by local ethics authorities.
Statistical analysis
Statistical analysis was performed using StatView 4.1 software (Aba-
cus Concepts). Statistical differences were analyzed with the Mann–
Whitney U-test for nonparametric values, and a P < 0.05 was
considered significant. Results are expressed as mean � SD from an
appropriate number of experiments (at least three biological repli-
cas), as indicated in the figure legends.
Supplementary information for this article is available online:
http://emboj.embopress.org
AcknowledgementsWe thank M. P. Scott for the gift of Ptch1�/� MEF cells, R. Toftgard for SuFu�/�
MEF and Smo�/� MEF cells and S. Minucci for ASZ001 cells. This work was
supported by Associazione Italiana Ricerca Cancro (AIRC) Grant #IG10610,
AIRC 5XMILLE, Ministry of University and Research (FIRB and PRIN projects),
Fondazione Roma, Pasteur Institute/Cenci Bolognetti Foundation and Italian
Institute of Technology (IIT). Dr. Alberto Gulino passed away after acceptance
of this paper for publication. Having lost an outstanding scientist and an
invaluable person, all coworkers and the EMBO Press editorial team offer their
condolences and sympathies to family and friends on his untimely death.
Author contributionsPI, MM and RA designed and performed experiments, analyzed data and
performed in silico studies. BB provided the natural products library. BB, FG, ST
and CI isolated, purified and characterized organic molecules, performed
analytic studies and analyzed data. FA and GUB performed NMR measure-
ments of proton relaxation rates. MS, AP, EM, DD and DC performed experi-
ments and contributed to stem cells maintenance. GC, EDS, EF, IS and MB
helped to interpret data. BB, AG and LDM designed experiments, interpreted
data and wrote the manuscript.
Conflict of interestThe authors declare that they have no conflict of interest.
References
Aberger F, Ruiz I Altaba A (2014) Context-dependent signal integration by the
GLI code: the oncogenic load, pathways, modifiers and implications for
cancer therapy. Semin Cell Dev Biol 33: 93 – 104
Amakye D, Jagani Z, Dorsch M (2013) Unraveling the therapeutic potential of
the Hedgehog pathway in cancer. Nat Med 19: 1410 – 1422
Aszterbaum M, Epstein J, Oro A, Douglas V, LeBoit PE, Scott MP, Epstein EH Jr
(1999) Ultraviolet and ionizing radiation enhance the growth of BCCs and
trichoblastomas in patched heterozygous knockout mice. Nat Med 5:
1285 – 1291
Atwood SX, Li M, Lee A, Tang JY, Oro AE (2013) GLI activation by atypical
protein kinase C ι/k regulates the growth of basal cell carcinomas. Nature
494: 484 – 488
Beauchamp EM, Ringer L, Bulut G, Sajwan KP, Hall MD, Lee YC, Peaceman D,
Ozdemirli M, Rodriguez O, Macdonald TJ, Albanese C, Toretsky JA, Uren A
(2011) Arsenic trioxide inhibits human cancer cell growth and tumor
development in mice by blocking Hedgehog/Gli pathway. J Clin Invest 121:
148 – 160
Berman DM, Karhadkar SS, Hallahan AR, Pritchard JI, Eberhart CG, Watkins
DN, Chen JK, Cooper MK, Taipale J, Olson JM, Beachy PA (2002)
Medulloblastoma growth inhibition by hedgehog pathway blockade.
Science 297: 1559 – 1561
Bosco-Clément G, Zhang F, Chen Z, Zhou HM, Li H, Mikami I, Hirata T,
Yagui-Beltran A, Lui N, Do HT, Cheng T, Tseng HH, Choi H, Fang LT, Kim IJ,
Yue D, Wang C, Zheng Q, Fujii N, Mann M et al (2013) Targeting Gli
transcription activation by small molecule suppresses tumor growth.
Oncogene 33: 2087 – 2097
Briscoe J, Thèrond PP (2013) The mechanisms of Hedgehog signalling and its
roles in development and disease. Nat Rev Mol Biol 14: 416 – 429
Buonamici S, Williams J, Morrissey M, Wang A, Guo R, Vattay A, Hsiao K,
Yuan J, Green J, Ospina B, Yu Q, Ostrom L, Fordjour P, Anderson DL,
Monahan JE, Kelleher JF, Peukert S, Pan S, Wu X, Maira SM et al (2010)
Interfering with resistance to smoothened antagonists by inhibition of the
PI3K pathway in medulloblastoma. Sci Transl Med 2: 51ra70
Canettieri G, Di Marcotullio L, Greco A, Coni S, Antonucci L, Infante P,
Pietrosanti L, De Smaele E, Ferretti E, Miele E, Pelloni M, De Simone G,
Pedone EM, Gallinari P, Giorgi A, Steinkühler C, Vitagliano L, Pedone C,
Schinin ME, Screpanti I et al (2010) Histone deacetylase and Cullin3-REN
(KCTD11) ubiquitin ligase interplay regulates Hedgehog signalling through
Gli acetylation. Nat Cell Biol 12: 132 – 142
Clement V, Sanchez P, de Tribolet N, Radovanovic I, Ruiz I Altaba A (2007)
Hedgehog-Gli1 signaling regulates human glioma growth, cancer stem
cell self-renewal, and tumorigenicity. Curr Biol 17: 165 – 172
Coni S, Antonucci L, D’Amico D, Di Magno L, Infante P, De Smaele E, Giannini
G, Di Marcotullio L, Screpanti I, Gulino A, Canettieri G (2013b) Gli2
acetylation at lysine 757 regulates hedgehog-dependent transcriptional
output by preventing its promoter occupancy. PLoS ONE 8: e65718
Coni S, Infante P, Gulino A (2013a) Control of stem cells and cancer stem
cells by Hedgehog signaling: pharmacologic clues from pathway
dissection. Biochem Pharmacol 85: 623 – 628
Dahlén A, Fletcher CD, Mertens F, Fletcher JA, Perez-Atayde AR, Hicks MJ,
Debiec-Rychter M, Sciot R, Wejde J, Wedin R, Mandahl N, Panagopoulos I
(2004) Activation of the Gli oncogene through fusion with the beta-actin
gene (ACTB) in a group of distinctive pericytic neoplasms: pericytoma with
t(7;12). Am J Pathol 164: 1645 – 1653
De Smaele E, Fragomeli C, Ferretti E, Pelloni M, Po A, Canettieri G, Coni S, Di
Marcotullio L, Greco A, Moretti M, Di Rocco C, Pazzaglia S, Maroder M,
Screpanti I, Giannini G, Gulino A (2008) An integrated approach identifies
Nhlh1 and Insm1 as Sonic Hedgehog–regulated genes in developing
cerebellum and medulloblastoma. Neoplasia 10: 89 – 98
Delle Monache F, Cairo Valeira G, Sialer de Zapata D, Marini-Bettolo GB
(1977) 3-Aryl-4-methoxycoumarins and isoflavones from Derris
glabrescens. Gazz Chim Ital 107: 403 – 407
Delle Monache F (1985) Chemistry and biological activity of the secondary
metabolites of Vismieae. Rev Latinoamer Quim 16-1: 5 – 15
Di Marcotullio L, Ferretti E, De Smaele E, Screpanti I, Gulino A (2006b)
Suppressors of Hedgehog signaling: linking aberrant development
of neural progenitors and tumorigenesis. Mol Neurobiol 34: 193 – 204
ª 2014 The Authors The EMBO Journal Vol 34 | No 2 | 2015
Paola Infante et al Gli1/DNA complex as a drug target The EMBO Journal
215
Published online: December 4, 2014
Di Marcotullio L, Ferretti E, Greco A, De Smaele E, Po A, Sico MA, Alimandi M,
Giannini G, Maroder M, Screpanti I, Gulino A (2006a) Numb is a
suppressor of Hedgehog signalling and targets Gli1 for Itch-dependent
ubiquitination. Nat Cell Biol 8: 1415 – 1423
Di Marcotullio L, Greco A, Mazzà D, Canettieri G, Pietrosanti L, Infante P, Coni
S, Moretti M, De Smaele E, Ferretti E, Screpanti I, Gulino A (2011) Numb
activates the E3 ligase Itch to control Gli1 function through a novel
degradation signal. Oncogene 30: 65 – 76
Eberl M, Klingler S, Mangelberger D, Loipetzberger A, Damhofer H, Zoidl K,
Schnidar H, Hache H, Bauer HC, Solca F, Hauser-Kronberger C, Ermilov
AN, Verhaegen ME, Bichakjian CK, Dlugosz AA, Nietfeld W, Sibilia M,
Lehrach H, Wierling C, Aberger F (2012) Hedgehog-EGFR cooperation
response genes determine the oncogenic phenotype of basal cell
carcinoma and tumour-initiating pancreatic cancer cells. EMBO Mol Med
4: 218 – 233
Galimberti F, Busch AM, Chinyengetere F, Ma T, Sekula D, Memoli VA,
Dragnev KH, Liu F, Johnson KC, Guo Y, Freemantle SJ, Andrew AS,
Greninger P, Robbins DJ, Settleman J, Benes C, Dmitrovsky E (2012)
Response to inhibition of Smoothened in diverse epithelial cancer cells
that lack Smoothened or Patched 1 mutations. Int J Oncol 41: 1751 – 1761
Garg N, Po A, Miele E, Campeseq A, Begalli F, Silvano M, Infante P, Capalbo C,
De Smaele E, Canettieri G, Di Marcotullio L, Screpanti I, Ferretti E, Gulino
A (2013) microRNA-17-92 cluster is a direct Nanog target and controls
neural stem cell through Trp53inp1. EMBO J 32: 2819 – 2832
Goodrich L, Milenkovic L, Higgins KM, Scott MP (1997) Altered neural cell
fates and medulloblastoma in mouse Patched mutants. Science 277:
1109 – 1113
Gulino A, Di Marcotullio L, Canettieri G, De Smaele E, Screpanti I (2012) Gli
control by ubiquitination/acetylation interplay. Vitam Horm 88: 211 – 227
Hahn H, Wojnowski L, Specht K, Kappler R, Calzada-Wack J, Potter D, Zimmer
A, Müller U, Samson E, Quintanilla-Martinez L, Zimmer A (2000) Patched
target Igf2 is indispensable for the formation of medulloblastoma and
rhabdomyosarcoma. J Biol Chem 275: 28341 – 28344
Hatten ME, Roussel MF (2011) Development and cancer of the cerebellum.
Trends Neurosci 34: 134 – 142
He X, Zhang L, Chen Y, Remke M, Shih D, Lu F, Wang H, Deng Y, Yu Y, Xia Y, Wu X,
Ramaswamy V, Hu T, Wang F, Zhou W, Burns DK, Kim SH, Kool M, Pfister SM,
Weinstein LS et al (2014) The G protein a subunit Gas is a tumor suppressor
in Sonic hedgehog-driven medulloblastoma. Nat Med 20: 1035 – 1042
Huntzicker EG, Estay IS, Zhen H, Lokteva LA, Jackson PK, Oro AE (2006) Dual
degradation signals control Gli protein stability and tumor formation.
Genes Dev 20: 276 – 281
Hyman JM, Firestone AJ, Heine VM, Zhao Y, Ocasio CA, Han K, Sun M, Rack
PG, Sinha S, Wu JJ, Solow-Cordero DE, Jiang J, Rowitch DH, Chen JK (2009)
Small-molecule inhibitors reveal multiple strategies for Hedgehog
pathway blockade. Proc Natl Acad Sci USA 106: 14132 – 14137
Jagani Z, Mora-Blanco EL, Sansam CG, McKenna ES, Wilson B, Chen D, Klekota
J, Tamayo P, Nguyen PT, Tolstorukov M, Park PJ, Cho YJ, Hsiao K, Buonamici
S, Pomeroy SL, Mesirov JP, Ruffner H, Bouwmeester T, Luchansky SJ, Murtie
J et al (2010) Loss of the tumor suppressor Snf5 leads to aberrant activation
of the Hedgehog-Gli pathway. Nat Med 16: 1429– 1433
Kim J, Lee JJ, Kim J, Gardner D, Beachy PA (2010) Arsenic antagonizes the
Hedgehog pathway by preventing ciliary accumulation and reducing
stability of the Gli2 transcriptional effector. Proc Natl Acad Sci USA 107:
13432 – 13437
Kinzler KW, Bigner SH, Bigner DD, Trent JM, Law ML, O’Brien SJ, Wong AJ,
Vogelstein B (1987) Identification of an amplified, highly expressed gene in
a human glioma. Science 236: 70 – 73
Kinzler KW, Vogelstein B (1990) The GLI gene encodes a nuclear protein
which binds specific sequences in the human genome. Mol Cell Biol 10:
634 – 642
Kool M, Jones DT, Jäger N, Northcott PA, Pugh TJ, Hovestadt V, Piro RM,
Esparza LA, Markant SL, Remke M, Milde T, Bourdeaut F, Ryzhova M, Sturm
D, Pfaff E, Stark S, Hutter S, Seker-Cin H, Johann P, Bender S et al (2014)
Genome sequencing of Shh medulloblastoma predicts genotype-related
response to smoothened inhibition. Cancer Cell 25: 393 –405
Laner-Plamberger S, Kaser A, Paulischta M, Hauser-Kronberger C, Eichberger T,
Frischauf AM (2009) Cooperation between GLI and JUN enhances
transcription of JUN and selected GLI target genes. Oncogene 28: 1639 – 1651
Lauth M, Bergström A, Shimokawa T, Toftgård R (2007) Inhibition of
Gli-mediated transcription and tumor cell growth by small-molecule
antagonists. Proc Natl Acad Sci USA 104: 8455 – 8460
Malatesta M, Steinhauer C, Mohammad F, Pandey DP, Squatrito M, Helin K
(2013) Histone acetyltransferase PCAF is required for
Hedgehog-Gli-dependent transcription and cancer cell proliferation.
Cancer Res 73: 6323 – 6333
Manoranjan B, Venugopal C, McFarlane N, Doble BW, Dunn SE, Scheinemann
K, Singh SK (2013) Medulloblastoma stem cells: modeling tumor
heterogeneity. Cancer Lett 338: 23 – 31
Mas C, Ruiz I Altaba A (2010) Small molecule modulation of HH-Gli signaling:
current leads, trials and tribulations. Biochem Pharmacol 80: 712 – 723
Mazzà D, Infante P, Colicchia V, Greco A, Alfonsi R, Siler M, Antonucci L, Po A,
De Smaele E, Ferretti E, Capalbo C, Bellavia D, Canettieri G, Giannini G,
Screpanti I, Gulino A, Di Marcotullio L (2013) PCAF ubiquitin ligase activity
inhibits Hedgehog/Gli1 signaling in p53-dependent response to genotoxic
stress. Cell Death Differ 20: 1688 – 1697
Mori M, Dietrich U, Manetti F, Botta M (2010) Molecular dynamics and DFT
study on HIV-1 nucleocapsid protein-7 in complex with viral genome. J
Chem Inf Model 50: 638 – 650
Mori M, Manetti F, Botta M (2011) Predicting the binding mode of known
NCp7 inhibitors to facilitate the design of novel modulators. J Chem Inf
Model 51: 446 – 454
Neuhaus D, Williamson M (1989) The Nuclear Overhauser Effect in Structural
and Conformational Analysis. New York, NY, USA: VCH Publisher
Northcott PA, Jones DT, Kool M, Robinson GW, Gilbertson RJ, Cho YJ, Pomeroy
SL, Korshunov A, Lichter P, Taylor MD, Pfister SM (2012)
Medulloblastomics: the end of the beginning. Nat Rev Cancer 12: 818 – 834
Pavletich NP, Pabo CO (1993) Crystal structure of a five-finger Gli-DNA
complex: new perspectives on zinc fingers. Science 261: 1701 – 1707
Po A, Ferretti E, Miele E, De Smaele E, Paganelli A, Canettieri G, Coni S, Di
Marcotullio L, Biffoni M, Massimi L, Di Rocco C, Screpanti I, Gulino A
(2010) Hedgehog controls neural stem cells through p53-independent
regulation of Nanog. EMBO J 29: 2646 – 2658
Roussel MF, Robinson GW (2013) Role of MYC in Medulloblastoma. Cold
Spring Harb Perspect Med 3: a014308
Sasai K, Romer JT, Lee Y, Finkelstein D, Fuller C, McKinnon PJ, Curran T (2006)
Shh pathway activity is down-regulated in cultured medulloblastoma
cells: implications for preclinical studies. Cancer Res 66: 4215 – 4222
Schnidar H, Eberl M, Klingler S, Mangelberger D, Kasper M,
Hauser-Kronberger C, Regl G, Kroismayr R, Moriggl R, Sibilia M, Aberger F
(2009) Epidermal growth factor receptor signaling synergizes with
Hedgehog/GLI in oncogenic transformation via activation of the MEK/ERK/
JUN pathway. Cancer Res 69: 1284 – 1292
Schuller U, Heine VM, Mao J, Kho AT, Dillon AK, Han YG, Huillard E, Sun T,
Ligon AH, Qian Y, Ma Q, Alvarez-Buylla A, McMahon AP, Rowitch DH,
Ligon KL (2008) Acquisition of granule neuron precursor identity is a
The EMBO Journal Vol 34 | No 2 | 2015 ª 2014 The Authors
The EMBO Journal Gli1/DNA complex as a drug target Paola Infante et al
216
Published online: December 4, 2014
critical determinant of progenitor cell competence to form Shh-induced
medulloblastoma. Cancer Cell 14: 123 – 134
Sheng T, Chi S, Zhang X, Xie J (2006) Regulation of Gli1 localization by the
cAMP/protein kinase A signaling axis through a site near the nuclear
localization signal. J Biol Chem 281: 9 – 12
Svard J, Heby-Henricson K, Persson-Lek M, Rozell B, Lauth M,
Bergström A, Ericson J, Toftgård R, Teglund S (2006) Genetic
elimination of suppressor of Fused reveals an essential repressor
function in the mammalian Hedgehog signaling pathway. Dev Cell 10:
187 – 197
Tang Y, Gholamin S, Schubert S, Willardson MI, Lee A, Bandopadhayay P,
Bergthold G, Masoud S, Nguyen B, Vue N, Balansay B, Yu F, Oh S,
Woo P, Chen S, Ponnuswami A, Monje M, Atwood SX, Whitson RJ,
Mitra S et al (2014) Epigenetic targeting of Hedgehog pathway
transcriptional output through BET bromodomain inhibition. Nat Med
20: 732 – 740
Taylor MD, Liu L, Raffel C, Hui CC, Mainprize TG, Zhang X, Agatep R,
Chiappa S, Gao L, Lowrance A, Hao A, Goldstein AM, Stavrou T, Scherer
SW, Dura WT, Wainwright B, Squire JA, Rutka JT, Hogg D (2002)
Mutations in SuFu predispose to medulloblastoma. Nat Genet 31:
306 – 310
Triscott J, Lee C, Foster C, Manoranjan B, Pambid MR, Berns R, Fotovati A,
Venugopal C, O’Halloran K, Narendran A, Hawkins C, Ramaswamy V,
Bouffet E, Taylor MD, Singhal A, Hukin J, Rassekh R, Yip S, Northcott P,
Singh SK et al (2013) Personalizing the treatment of pediatric
medulloblastoma: polo-like kinase 1 as a molecular target in high-risk
children. Cancer Res 73: 6734 – 6744
Valensin G, Sabatini G, Tiezzi E (1986) Advanced Magnetic resonance
techniques in systems of high molecular complexity. 69 – 76
Verdonk ML, Cole JC, Hartshorn MJ, Murray CW, Taylor RD (2003) Improved
protein-ligand docking using GOLD. Proteins 52: 609 – 623
Wang R, Lai L, Wang S (2002) Further development and validation of
empirical scoring functions for structure-based binding affinity prediction.
J Comput Aided Mol Des 16: 11 – 26
Wang R, Lu Y, Wang S (2003) Comparative evaluation of 11 scoring functions
for molecular docking. J Med Chem 46: 2287 – 2303
Wang Y, Ding Q, Yen CJ, Xia W, Izzo JG, Lang JY, Li CW, Hsu JL, Miller SA,
Wang X, Lee DF, Hsu JM, Huo L, Labaff AM, Liu D, Huang TH, Lai CC, Tsai
FJ, Chang WC, Chen CH et al (2012) The crosstalk of mTOR/S6K1 and
Hedgehog pathways. Cancer Cell 21: 374 – 387
Wechsler-Reya R, Scott MP (2001) The developmental biology of brain
tumors. Annu Rev Neurosci 24: 385 – 428
Yang ZJ, Ellis T, Markant SL, Read TA, Kessler JD, Bourboulas M, Schuller U,
Machold R, Fishell G, Rowitch DH, Wainwright BJ, Wechsler-Reya RJ (2008)
Medulloblastoma can be initiated by deletion of Patched
in lineage-restricted progenitors or stem cells. Cancer Cell 14: 135 – 145
Yauch R, Gerrit L, Dijkgraaf JP, de Sauvage FJ (2009) Smoothened mutation
confers resistance to a Hedgehog pathway inhibitor in medulloblastoma.
Science 326: 572 – 574
Yoon JW, Liu CZ, Yang JT, Swart R, Iannaccone P, Walterhouse D (1998) GLI
activates transcription through a herpes simplex viral protein 16-like
activation domain. J Biol Chem 273: 3496 – 3501
Zhan X, Shi X, Zhang Z, Chen Y, Wu JI (2011) Dual role of Brg chromatin
remodeling factor in sonic Hedgehog signaling during neural
development. Proc Natl Acad Sci USA 108: 12758 – 12763
License: This is an open access article under the
terms of the Creative Commons Attribution-NonCom-
mercial-NoDerivs 4.0 License, which permits use and
distribution in any medium, provided the original
work is properly cited, the use is non-commercial and
no modifications or adaptations are made.
ª 2014 The Authors The EMBO Journal Vol 34 | No 2 | 2015
Paola Infante et al Gli1/DNA complex as a drug target The EMBO Journal
217
Published online: December 4, 2014

Published online: December 4, 2014
Top Related
Copyright © 2022 FDOKUMEN

