


Bahasa
Halaman
Hukum

Citation: Huang, S.; Ning, S.; Xiong,
R. First-Principles Study of Silicon–
Tin Alloys as a High-Temperature
Thermoelectric Material. Materials
2022, 15, 4107. https://doi.org/
10.3390/ma15124107
Academic Editors: Amir Pakdel
and David Berthebaud
Received: 6 May 2022
Accepted: 7 June 2022
Published: 9 June 2022
Publisher’s Note: MDPI stays neutral
with regard to jurisdictional claims in
published maps and institutional affil-
iations.
Copyright: © 2022 by the authors.
Licensee MDPI, Basel, Switzerland.
This article is an open access article
distributed under the terms and
conditions of the Creative Commons
Attribution (CC BY) license (https://
creativecommons.org/licenses/by/
4.0/).
materials
Article
First-Principles Study of Silicon–Tin Alloys as a High-TemperatureThermoelectric MaterialShan Huang, Suiting Ning and Rui Xiong *
Key Laboratory of Artificial Micro- and Nano-Structures of Ministry of Education, School of Physics and Technology,Wuhan University, Wuhan 430072, China; [email protected] (S.H.); [email protected] (S.N.)* Correspondence: [email protected]
Abstract: Silicon–germanium (SiGe) alloys have sparked a great deal of attention due to their ex-ceptional high-temperature thermoelectric properties. Significant effort has been expended in thequest for high-temperature thermoelectric materials. Combining density functional theory andelectron–phonon coupling theory, it was discovered that silicon–tin (SiSn) alloys have remarkablehigh-temperature thermoelectric performance. SiSn alloys have a figure of merit above 2.0 at 800 K,resulting from their high conduction band convergence and low lattice thermal conductivity. Furtherevaluations reveal that Si0.75Sn0.25 is the best choice for developing the optimum ratio as a thermo-electric material. These findings will provide a basis for further studies on SiSn alloys as a potentialnew class of high-performance thermoelectric materials.
Keywords: thermoelectrics; silicon–tin alloy; density functional theory; electron–phonon coupling
1. Introduction
Thermal energy may be readily converted into electric energy using thermoelectricmaterials, without the need for complex devices. The figure of merit (ZT) is a thermoelectricmaterial criterion that is expressed as
ZT =S2σ
κT (1)
where S is the Seebeck coefficient, σ is the electrical conductivity, κ is the total thermalconductivity, and S2σ is the power factor (PF). Thermoelectric materials, such as SiGe [1,2],Bi2Te3 [3–5], and SnSe [6–9], have been extensively explored since they have been demon-strated to exhibit good electron and thermal transport properties. As is widely known,SiGe, as a traditional high-temperature thermoelectric material, is extensively investigated.However, owing to its poor electrical properties, the ZT peak value of SiGe is not veryhigh (1.3 at 1200 K) [10]. Given this, further research into alternative high-temperaturethermoelectric material candidates is imperative.
In this work, the thermoelectric properties of alloys from the carbon family (C, Si,Ge, Sn, and Pb) are systematically evaluated. Density functional theory (DFT) [11,12] isapplied to investigate the electronic energy band structures of all possible group 14 alloys.Electron–phonon coupling theory is used to determine the electronic relaxation time of thematerials. SiSn is found to be a superior thermoelectric candidate compared to SiGe. Atpresent, SiGe alloys are a traditional thermoelectric material [13–16]. However, Ge is ratherrare in the Earth and much more expensive than Sn, and Ge is toxic but Sn is not. Mostimportantly, SiSn is predicted to have lower lattice thermal conductivity than SiGe, whichsuggests that SiSn has a greater advantage over SiGe for thermoelectrics [17]. Moreover, themechanical, optical, thermal, and electrical properties of SiSn are also predicted by manytheoretical scientists [18,19]. According to our theoretical predictions, the ZT peak value ofSiSn can exceed 2.0 at 800 K.
Materials 2022, 15, 4107. https://doi.org/10.3390/ma15124107 https://www.mdpi.com/journal/materials
Materials 2022, 15, 4107 2 of 12
2. Computational Methods
In this study, all electrical properties are calculated based on a 12 × 12 × 12 k meshwithin the DFT framework. The Perdew–Burke–Ernzerhof (PBE) with the generalizedgradient approximation (GGA) [20] is used for exchange and correlation energy in structuraloptimization and band structure computations. In the Vienna Ab-initio Simulation Package(VASP) [21–24], the hybrid Heyd–Scuseria–Ernzerhof (HSE06) functional [25,26] is furtherutilized to estimate the energy band. The cutoff energy for the wave function is 450 eV.Furthermore, the quasiparticle GW approximation [27], which is implemented in theQuantum ESPRESSO (QE) [28] and Yambo [29,30] packages, is also applied to calculate theelectronic energy band. The corresponding cutoff energy is 50 Ry.
Based on electron Boltzmann transport theory, the electron transport parametersinvolved in the thermoelectric euphoria calculations can be accurately computed. Theelectrical conductivity and Seebeck coefficient are determined by the transport distributionfunction Ξ = ∑
kvkvkτe,k, where vk is the group velocity and τe,k is the electron relaxation
time of the wave vector k.
σ = e2∫
Ξ(ε)(−∂ f0
∂ε
)dε (2)
S =ekBσ
∫Ξ(ε)
(−∂ f0
∂ε
)ε− µ
kBTdε (3)
where kB is the Boltzmann constant, ε is the electronic energy, µ is the chemical potential,and f0 is the Fermi distribution function.
The electron relaxation time τe in the electron transport is an important parameter.Based on Fermi’s golden rule [31,32], the τe is given by
τ−1e
∣∣∣nk→mk+q
=2π
} |gnm(k, q)|2δ(εnk − εmk+q
)(4)
where gnm(k, q) is the electron–phonon coupling matrix element of electron wave vector kand phonon wave vector q, and εnk is the electron eigenvalue energy of the band n andwave vector k. In the electron–phonon coupling, the electron–phonon coupling matrixelement is defined as
gmn(k, q) =1√2ωq
⟨ψmk+q
∣∣∂qV∣∣ψnk〉 (5)
where ωq is the phonon frequency of wave vector q, ψnk is the wavefunction of the bandn and wave vector k, and V is the self-consistent potential. Acoustic phonon scatter-ing (APS) and polar optical phonon scattering (POPS) are the two primary scatteringmechanisms in electron–phonon coupling, and the electron relaxation time is generallydetermined by APS. To determine which scattering mechanism dominates in the dia-mond system, the electron relaxation time of APS and POPS is roughly estimated usinga 33 × 33 × 33 k mesh. The electron–phonon Wannier (EPW) [31,32] method is used todetermine the electron transport properties more accurately. This method must accountfor all types of phonons (acoustic and optical phonons) in electron scattering, which ne-cessitates a dense electron–phonon mesh in the Brillouin zone, as well as high computingcosts [31]. The electron–phonon coupling has been extensively studied and shown to beuseful in determining the electrical transport properties of diamond-like structures [33–35].The electron and thermal transport in the electron–phonon coupling are calculated using a12 × 12 × 12 k mesh and 6 × 6 × 6 q mesh, respectively. By using the maximally localizedWannier functions interpolation method [36], the electrical and phonon properties of finemeshes of 60 × 60 × 60 k mesh and 60 × 60 × 60 q mesh can be obtained.
The special quasi-random structure (SQS) [37,38] method is applied to simulate thedisordered structure of SiGeSn alloys. Here, 2 × 2 × 2 supercells are constructed byextending the two-atom primitive cell along with the directions of three basis vectors.The objective function of the established randomness of SiGeSn alloys is close to −1.0,
Materials 2022, 15, 4107 3 of 12
indicating that the disordered structures established by SQS may accurately reflect theactual alloy structure. The energy band is also calculated using the HSE06 functional.
The minimum lattice thermal conductivity of SiGeSn alloys can be estimated usingCahill’s model [39], i.e.,
κmin =(π
6
)1/3kBρ2/3
3
∑i=1
vi
(TΘi
)2 ∫ Θi/T
0
x3ex
(ex − 1)2 dx (6)
Here, ρ is the number density of atoms, vi is the sound velocity of different phononmodes, and Θ is the Debye temperature. This formula is based on the amorphous limit;however, the vibration behavior of atoms in disordered alloys is comparable to that ofatoms in amorphous solids; therefore, the model is well suited for predicting disorderedSiGeSn alloys.
3. Results and Discussion
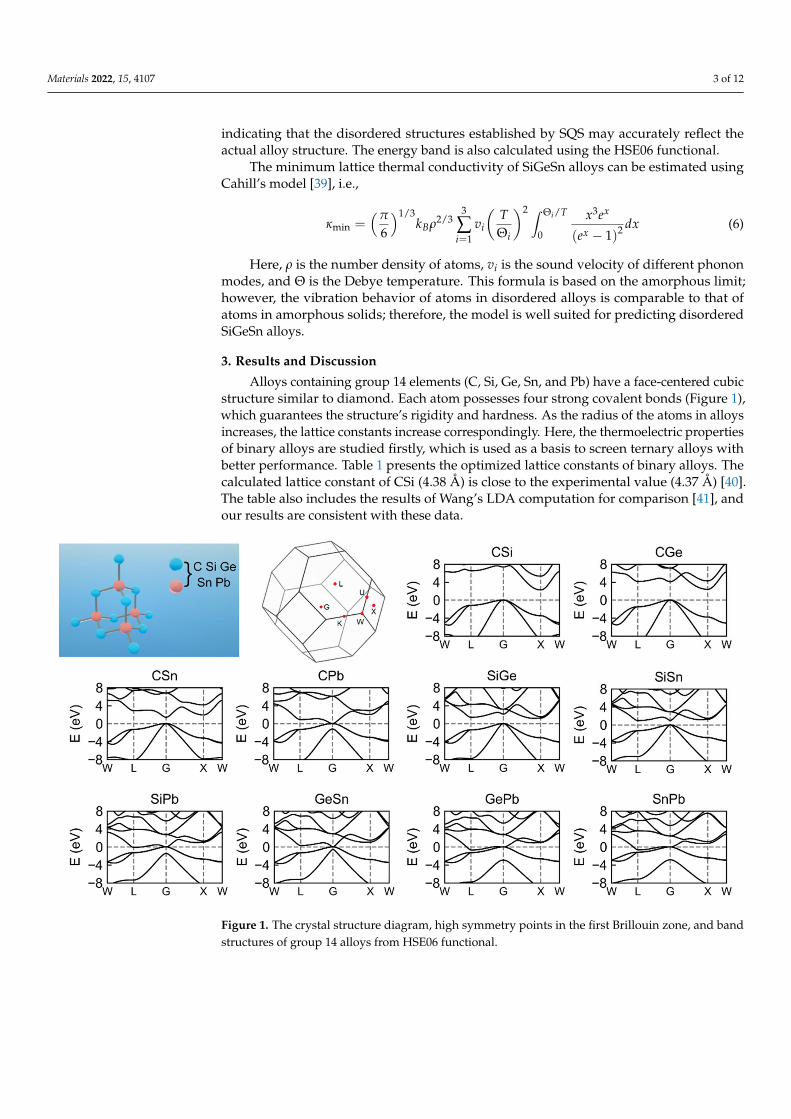
Alloys containing group 14 elements (C, Si, Ge, Sn, and Pb) have a face-centered cubicstructure similar to diamond. Each atom possesses four strong covalent bonds (Figure 1),which guarantees the structure’s rigidity and hardness. As the radius of the atoms in alloysincreases, the lattice constants increase correspondingly. Here, the thermoelectric propertiesof binary alloys are studied firstly, which is used as a basis to screen ternary alloys withbetter performance. Table 1 presents the optimized lattice constants of binary alloys. Thecalculated lattice constant of CSi (4.38 Å) is close to the experimental value (4.37 Å) [40].The table also includes the results of Wang’s LDA computation for comparison [41], andour results are consistent with these data.
Figure 1. The crystal structure diagram, high symmetry points in the first Brillouin zone, and bandstructures of group 14 alloys from HSE06 functional.
Materials 2022, 15, 4107 4 of 12
Table 1. The lattice parameters of group 14 alloys, and the band gaps Eg from PBE and HSE06calculation. Lattice parameters from another ab initio calculation [41] (Reprinted with permissionfrom Ref. [41]. Copyright 2002, American Physical Society) and experimental data [41,42] are listedfor comparison.
a fromQE (Å)
a fromVASP (Å)
a from [41](Å)
a fromExp. (Å)
Eg ofPBE (eV)
Eg ofHSE06 (eV)
CSi 4.38 4.38 4.314 4.360 [41] 1.37 2.26CGe 4.63 4.63 4.500 1.62 2.40CSn 5.09 5.10 4.961 0.64 1.38CPb 5.27 5.38 5.139 0.00 0.00SiGe 5.61 5.62 5.472 5.537 [42] 0.61 1.17SiSn 5.99 6.08 5.914 0.40 0.97SiPb 6.29 6.32 6.047 0.00 0.00GeSn 6.22 6.22 6.004 0.00 0.14GePb 6.42 6.46 6.154 0.00 0.00SnPb 6.80 6.86 6.539 0.00 0.00
The energy band gap Eg plays an important role in predicting thermoelectric perfor-mance, since thermoelectric materials need a sufficiently wide band gap to maintain asuitably high electrical conductivity and Seebeck coefficient. For C-based alloys (CSi, CGe,CSn, and CPb), the band energy of the G point decreases as the average molecular massincreases. This modification transforms C-based alloys from indirect semiconductors (CSiand CGe) to direct semiconductors (CSn) to semimetals (CPb). The top of the valence bandof these compounds’ energy bands is at the position of the G point. The conduction bandbottom of CSi and Cge is situated at high symmetry point X, whereas that of CSn and CPbis positioned at the G point. The PBE and HSE06 calculations predict that the band gaps ofCSi are 1.37 and 2.26 eV, respectively, while the experimental measurement is 7.34 eV [43].Even in the calculation of the HSE06 hybrid functional, the band gap is still underestimated,implying that the actual gap of the material should be considerably larger than our calculatedvalue. Since the calculated gap of CGe is larger than that of CSi, CGe should be an insulator.Among the other group 14 alloys, SiPb, GePb, SnPb, and GeSn are semimetals or metals; thus,further investigation into their thermoelectric properties is superfluous. Therefore, only thethree semiconductor materials CSn, SiGe, and SiSn merit further investigation.
To further screen candidates for n-type thermoelectric materials better than SiGe fromthese three materials, a type of dimensionless material parameter β is introduced to assessthe performance [44]. The larger the β value, the better the thermoelectric performance.The material parameter β can be expressed as
β =Nv
3π2
(2m∗dkBT
}2
) 32 k2
BTτe
m∗c kl(7)
where Nv is the band degeneracy, m∗d is the effective mass of density of states, } is thereduced Planck constant, τe is the relaxation time of an electron, and m∗c is the conductivityeffective mass. The m∗d and m∗c are defined as
m∗d = (m∗xm∗ym∗z )1/3 (8)
1m∗c
=13
(1
mx+
1my
+1
mz
)(9)
where m∗i (i = x, y, and z) is the electron effective mass in different directions. In general, theAPS is dominant in electron transport, and thus the relaxation time τe is [45]
τe =π}4C
√2E2
(m∗dkBT
)3/2 (10)
Materials 2022, 15, 4107 5 of 12
Here, C is the elastic modulus, and E is the deformation potential constant. Then, theβ is simplified to
β =2k2
BT}CNv
3πm∗c E2kl. (11)
According to the formula, larger band degeneracy and lower conductivity effectivemass imply better thermoelectric performance.
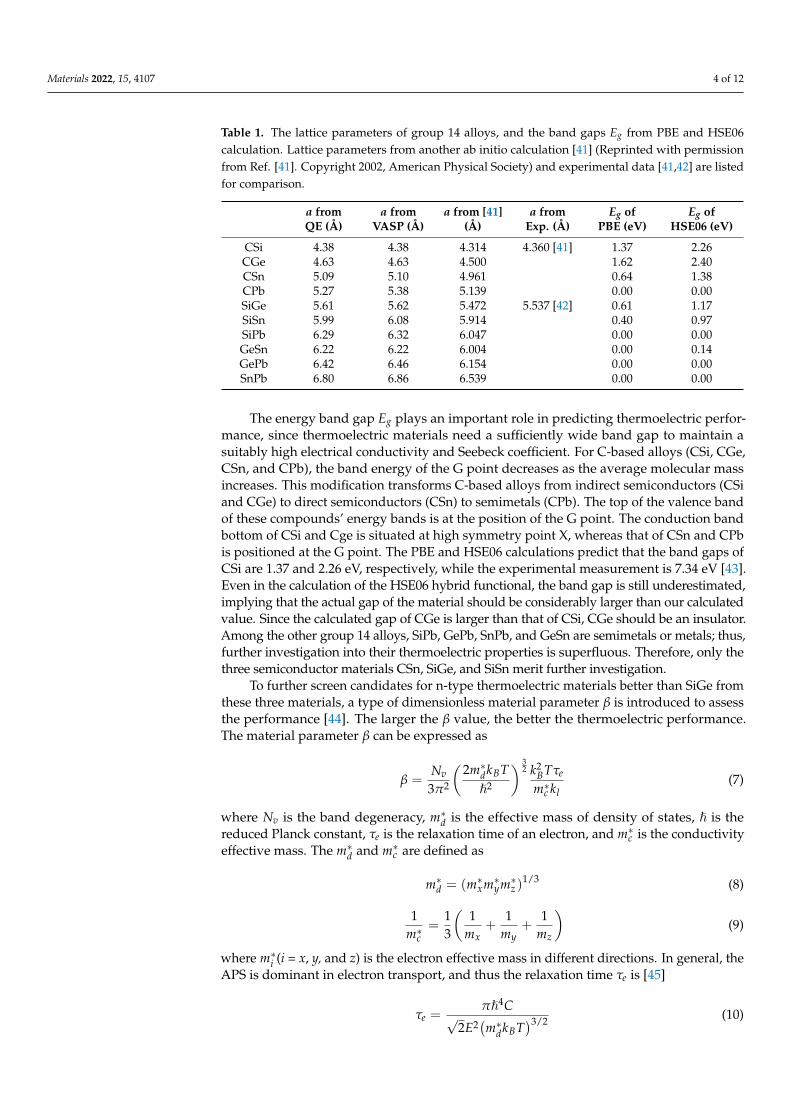
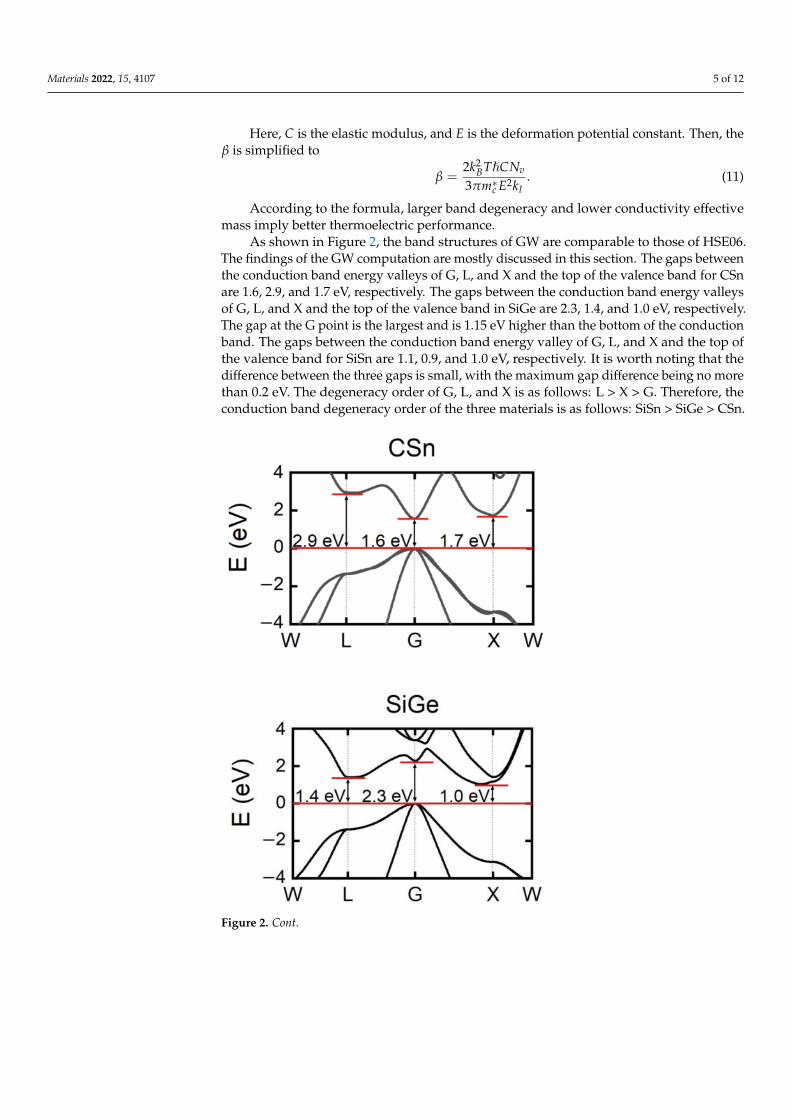
As shown in Figure 2, the band structures of GW are comparable to those of HSE06.The findings of the GW computation are mostly discussed in this section. The gaps betweenthe conduction band energy valleys of G, L, and X and the top of the valence band for CSnare 1.6, 2.9, and 1.7 eV, respectively. The gaps between the conduction band energy valleysof G, L, and X and the top of the valence band in SiGe are 2.3, 1.4, and 1.0 eV, respectively.The gap at the G point is the largest and is 1.15 eV higher than the bottom of the conductionband. The gaps between the conduction band energy valley of G, L, and X and the top ofthe valence band for SiSn are 1.1, 0.9, and 1.0 eV, respectively. It is worth noting that thedifference between the three gaps is small, with the maximum gap difference being no morethan 0.2 eV. The degeneracy order of G, L, and X is as follows: L > X > G. Therefore, theconduction band degeneracy order of the three materials is as follows: SiSn > SiGe > CSn.
Figure 2. Cont.
Materials 2022, 15, 4107 6 of 12
Figure 2. The band structures of CSn, SiGe, and SiSn from GW approximation.
Table 2 shows the effective masses of CSn, SiGe, and SiSn. Due to the strong isotropyof the conduction bands at the G point, m∗d and m∗c are found to be equal. The conductionbands of the L and X points are anisotropic, resulting in a discrepancy between m∗d andm∗c . When comparing β values, m∗c is more significant. It can be seen that m∗c is sortedas follows: CSn > SiGe > SiSn. When combined with conduction band degeneracy andconductivity effective mass, it is seen that SiSn has superior thermoelectric properties toSiGe, and therefore SiSn merits further investigation.
Table 2. The effective mass of CSn, SiGe, and SiSn.
m*d(me) m*
c(me)
G L X G L X
CSn 0.08 0.40 0.37 0.08 0.26 0.32SiGe 0.08 0.18 0.32 0.08 0.14 0.28SiSn 0.04 0.16 0.27 0.04 0.13 0.26
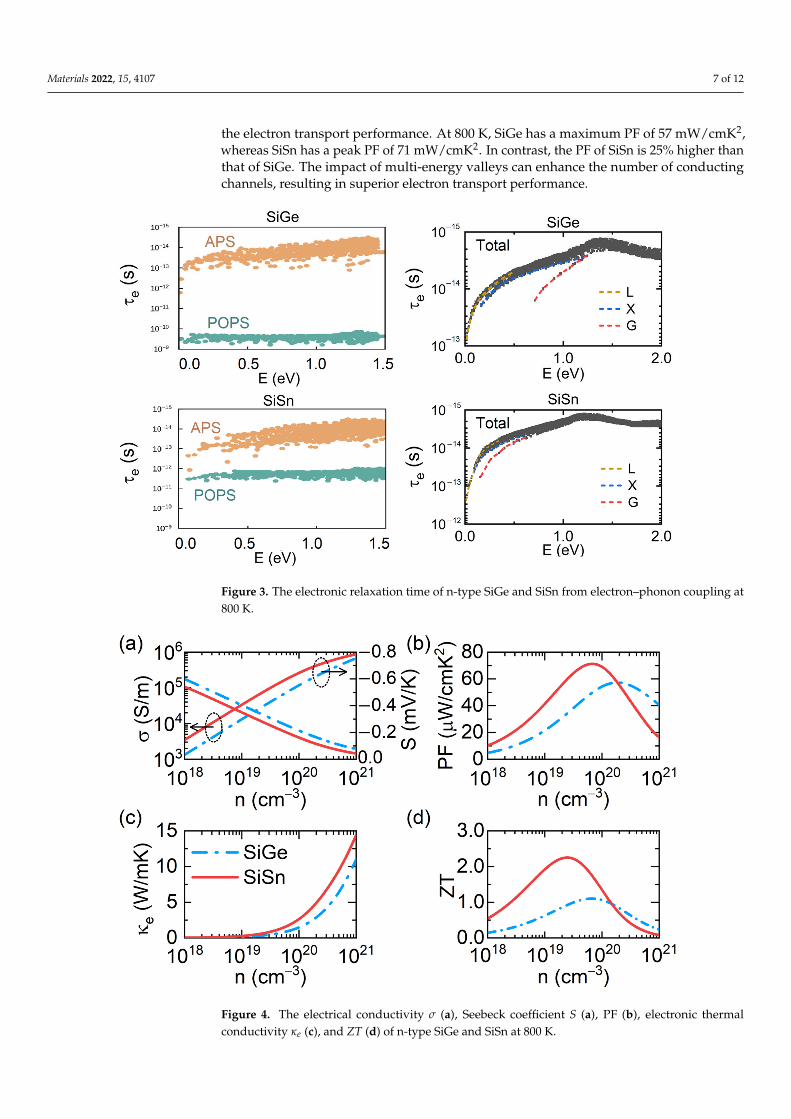
Figure 3 depicts the n-type SiGe and SiSn electron relaxation time from various scat-tering mechanisms; where the energy is zero, this represents the conduction band’s bottom.At high temperatures, electron–phonon coupling often dominates electron scattering, andthus 800 K is used as a reference. Because the relaxation time of APS is much shorter thanthat of POPS, APS is stronger than POPS for these two materials. Total relaxation time canbe obtained by combining the two scattering mechanisms. Each of the energy valleys isobserved to have a distinct relaxation time. The L energy valley has the lowest energy andtherefore contributes the most to electron transport. SiSn has a lower electronic effectivemass at the G point conduction band energy than SiGe, and thus the relaxation time at theG point increases from 10−14 s for SiGe to 10−13 s for SiSn. This difference is significant,indicating that SiSn should have an excellent electron transport performance comparedto SiGe.
The electron transport properties of n-type SiGe and SiSn at 800 K at carrier con-centrations ranging from 1018 to 1021 cm−3 are shown in Figure 4. Many experimentson the thermoelectric properties of Si0.8Ge0.2 [46–51] have been extensively performed.Because Si0.8Ge0.2 contains more silicon than Si0.5Ge0.5, it has a much wider energy bandgap. Comparatively, Si0.8Ge0.2 has a higher Seebeck coefficient and smaller electrical con-ductivity. Si0.8Ge0.2 has a Seebeck coefficient of 0.25 mV/K at 800 K and conductivity of5 × 104 S/m at an electron carrier concentration of 2.2 × 1020 cm−3 [10]. Furthermore, atdonors of 2.5 × 1020 cm−3, the Seebeck coefficient of Si0.7Ge0.3 is 0.21 mV/K [52]. At the2.2 × 1020 cm−3 carrier concentration, the two parameters for Si0.5Ge0.5 are 0.16 mV/K and2.3 × 105 S/m, respectively. These findings are consistent with our predictions, and ourcomputations are accurate. The PF peak value, on the other hand, is a useful indicator of
Materials 2022, 15, 4107 7 of 12
the electron transport performance. At 800 K, SiGe has a maximum PF of 57 mW/cmK2,whereas SiSn has a peak PF of 71 mW/cmK2. In contrast, the PF of SiSn is 25% higher thanthat of SiGe. The impact of multi-energy valleys can enhance the number of conductingchannels, resulting in superior electron transport performance.
Figure 3. The electronic relaxation time of n-type SiGe and SiSn from electron–phonon coupling at800 K.
Figure 4. The electrical conductivity σ (a), Seebeck coefficient S (a), PF (b), electronic thermalconductivity κe (c), and ZT (d) of n-type SiGe and SiSn at 800 K.
Materials 2022, 15, 4107 8 of 12
Thermal conductivity is mainly composed of the contributions from electrons andphonons. According to the Wiedemann–Franz law [53], electronic thermal conductivity isκe = L0σT. However, the relationship between κe and carrier concentration is not linear,indicating that the Lorentz number L0 is not constant and varies depending on the carrierconcentration. The Lorentz number L0 is given by
Lo =
(kBe
)2(r + 7
2)
Fr+5/2(r + 3
2)
Fr+1/2−[(
r + 52)
Fr+3/2(r + 3
2)
Fr+1/2
]2 (12)
Here, r is the scattering parameter, and the Fermi integral Fs is defined as
Fs =∫ ∞
0
εs/kBTe(ε−εF)/kBT + 1
d(ε/kBT) (13)
where εF is the Fermi energy. The Lorentz constant is very sensitive to the scattering mecha-nism. According to the previous analysis, APS dominates the electron transport mechanismin SiGe and SiSn; therefore, r is −1/2. The calculated electron thermal conductivity of SiGeand SiSn is illustrated in Figure 4c.
The calculation of the lattice thermal conductivity of group 14 alloys is complex owingto the numerous phonon scattering mechanisms: phonon–phonon, isotope, mass disorder,impurity [54], electron–phonon coupling [34], and nanoparticles [10,55]. There is an alloydisorder (a combination of mass and interatomic local strain field variation), and the effectenhances phonon scattering while significantly reducing lattice thermal conductivity. Thereare numerous theoretical [17,52,54,56–58] and experimental [51,59,60] studies about thelattice thermal conductivity of group IVA alloys. The experimental measurement resultsshow that the lattice thermal conductivity of SiGe at 800 K is approximately 3.8 W/mK [59],while that of nano SiGe is approximately 2.6 W/mK [10]. Furthermore, Khatami andAksamija computed the thermal transport properties of SiGe and SiSn by using the phononBoltzmann transport theory [17]. Their calculations fit well with the experiment results, andthey claimed that the lattice thermal conductivity of SiSn would be around half of that ofSiGe under the same grain scale, and thus the lattice thermal conductivity of SiSn at 800 Kis cautiously estimated to be 1.3~1.9 W/mK. Our computed phonon dispersion curves areshown in Figure S1, which suggests that SiSn is as thermodynamically stable as SiGe. Ourlattice thermal conductivity of SiGe and SiSn at the amorphous limit at 800 K is 2.6 and1.4 W/mK, respectively, which is in excellent agreement with the previous theoretical andexperimental data.
The ZT values of SiGe and SiSn at 800 K can be calculated using Formula (1). Themaximum ZT value for SiGe is 1.1, which is consistent with the experimental data [10].This is sufficient to demonstrate the accuracy of our calculations, which are reliable. Atthe optimum carrier concentration, the lattice thermal conductivity of SiSn is considerablylower, and the ZT can reach 2.2 for SiSn. SiSn had a ZT value that was approximately100% more than SiGe. This incredible finding offers new possibilities for group 14 alloyswith diamond-like structures, and SiSn may be a potential thermoelectric material toreplace SiGe.
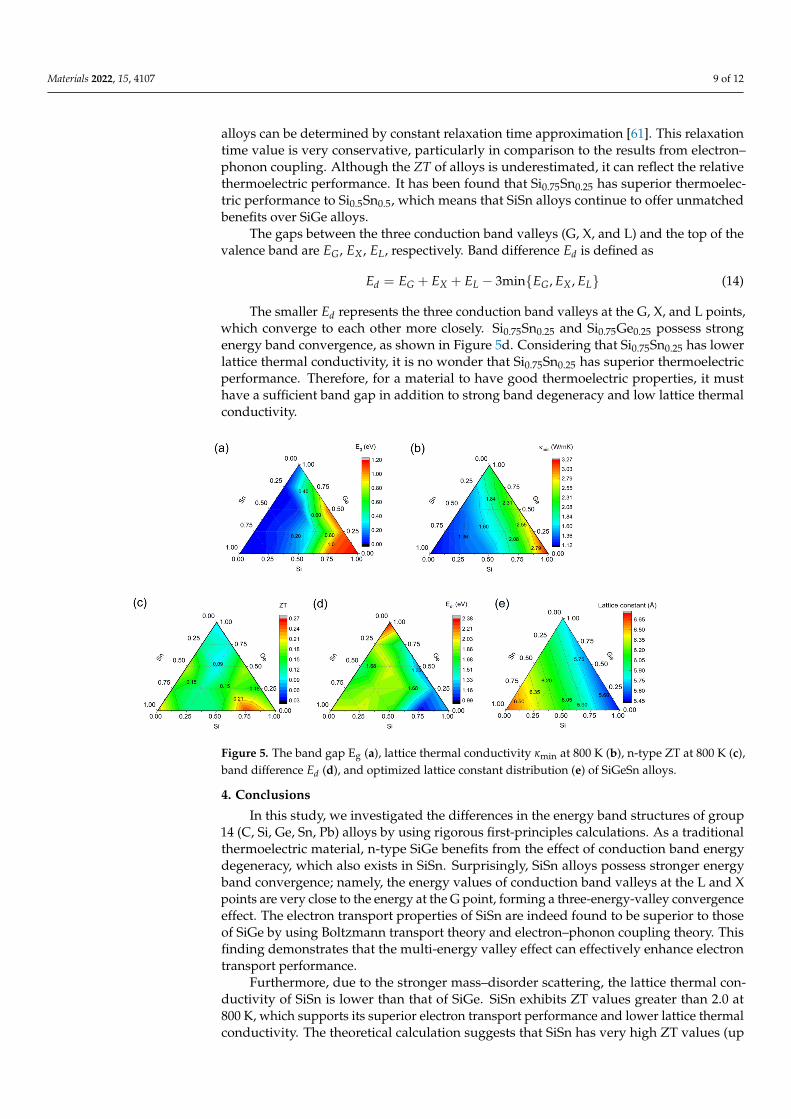
However, alloys include not only binary alloys with the same ratios of two composi-tions, but also binary alloys with different proportions, ternary alloys, and so on. SiGeSnalloys are chosen for a further search for high-performance alloys with additional compo-nents based on the appropriate energy gap and relatively low lattice thermal conductivity.Figure 5e depicts the optimal lattice constant distribution of SiGeSn alloys. The latticeconstants at different ratios establish a linear relationship, which is in line with Vegard’slaw. Figure 5a depicts the band gaps of each alloy based on the calculation of the HSE06functional, and Figure 5b shows the lattice thermal conductivity at the amorphous limit.The greater the Sn component, the narrower the band gap, and the lower the lattice thermalconductivity. Assuming that the electron relaxation time is 10−15 s, the ZT of SiGeSn
Materials 2022, 15, 4107 9 of 12
alloys can be determined by constant relaxation time approximation [61]. This relaxationtime value is very conservative, particularly in comparison to the results from electron–phonon coupling. Although the ZT of alloys is underestimated, it can reflect the relativethermoelectric performance. It has been found that Si0.75Sn0.25 has superior thermoelec-tric performance to Si0.5Sn0.5, which means that SiSn alloys continue to offer unmatchedbenefits over SiGe alloys.
The gaps between the three conduction band valleys (G, X, and L) and the top of thevalence band are EG, EX , EL, respectively. Band difference Ed is defined as
Ed = EG + EX + EL − 3min{EG, EX , EL} (14)
The smaller Ed represents the three conduction band valleys at the G, X, and L points,which converge to each other more closely. Si0.75Sn0.25 and Si0.75Ge0.25 possess strongenergy band convergence, as shown in Figure 5d. Considering that Si0.75Sn0.25 has lowerlattice thermal conductivity, it is no wonder that Si0.75Sn0.25 has superior thermoelectricperformance. Therefore, for a material to have good thermoelectric properties, it musthave a sufficient band gap in addition to strong band degeneracy and low lattice thermalconductivity.
Figure 5. The band gap Eg (a), lattice thermal conductivity κmin at 800 K (b), n-type ZT at 800 K (c),band difference Ed (d), and optimized lattice constant distribution (e) of SiGeSn alloys.
4. Conclusions
In this study, we investigated the differences in the energy band structures of group14 (C, Si, Ge, Sn, Pb) alloys by using rigorous first-principles calculations. As a traditionalthermoelectric material, n-type SiGe benefits from the effect of conduction band energydegeneracy, which also exists in SiSn. Surprisingly, SiSn alloys possess stronger energyband convergence; namely, the energy values of conduction band valleys at the L and Xpoints are very close to the energy at the G point, forming a three-energy-valley convergenceeffect. The electron transport properties of SiSn are indeed found to be superior to thoseof SiGe by using Boltzmann transport theory and electron–phonon coupling theory. Thisfinding demonstrates that the multi-energy valley effect can effectively enhance electrontransport performance.
Furthermore, due to the stronger mass–disorder scattering, the lattice thermal con-ductivity of SiSn is lower than that of SiGe. SiSn exhibits ZT values greater than 2.0 at800 K, which supports its superior electron transport performance and lower lattice thermalconductivity. The theoretical calculation suggests that SiSn has very high ZT values (up
Materials 2022, 15, 4107 10 of 12
to 2.2 at 800 K), implying that SiSn may be a potential new candidate for thermoelectricmaterials. A further in-depth investigation reveals that the best thermoelectric componentof SiSn alloys is Si0.75Sn0.25, which is enhanced by strong band degeneracy and low latticethermal conductivity.
Supplementary Materials: The following supporting information can be downloaded at: https://www.mdpi.com/article/10.3390/ma15124107/s1, Figure S1: Phonon dispersion curves of SiSnand SiGe.
Author Contributions: Methodology, S.N. and S.H.; Writing—original draft, S.H.; Writing—review& editing, S.H. and R.X. All authors have read and agreed to the published version of the manuscript.
Funding: This work was financially supported by the National Natural Science Foundation of China(Grant No. 11774270, 11774271 and 91963207), Suzhou key industrial technology innovation project(Grant No. SYG201921) and Hubei Provincial Natural Science Fund for Distinguished Young Scholars(Grant No. 2019CFA083).
Conflicts of Interest: The authors declare no conflict of interest.
References1. Possanzini, C.; Fletcher, R.; Coleridge, P.T.; Feng, Y.; Williams, R.L.; Maan, J.C. Diffusion Thermopower of a Two-Dimensional
Hole Gas in SiGe in a Quantum Hall Insulating State. Phys. Rev. Lett. 2003, 90, 176601. [CrossRef] [PubMed]2. Garg, J.; Bonini, N.; Kozinsky, B.; Marzari, N. Role of Disorder and Anharmonicity in the Thermal Conductivity of Silicon-
Germanium Alloys: A First-Principles Study. Phys. Rev. Lett. 2011, 106, 045901. [CrossRef] [PubMed]3. Ghaemi, P.; Mong, R.S.K.; Moore, J.E. In-Plane Transport and Enhanced Thermoelectric Performance in Thin Films of the
Topological Insulators Bi2Te3 and Bi2Se3. Phys. Rev. Lett. 2010, 105, 166603. [CrossRef]4. Shi, H.; Parker, D.; Du, M.-H.; Singh, D.J. Connecting Thermoelectric Performance and Topological-Insulator Behavior: Bi2Te3
and Bi2Te2Se from First Principles. Phys. Rev. Appl. 2015, 3, 014004. [CrossRef]5. Li, G.; Aydemir, U.; Morozov, S.I.; Wood, M.; An, Q.; Zhai, P.; Zhang, Q.; Goddard, W.A.; Snyder, G.J. Superstrengthening Bi2Te3
through Nanotwinning. Phys. Rev. Lett. 2017, 119, 085501. [CrossRef] [PubMed]6. Dewandre, A.; Hellman, O.; Bhattacharya, S.; Romero, A.H.; Madsen, G.K.H.; Verstraete, M.J. Two-Step Phase Transition in SnSe
and the Origins of Its High Power Factor from First Principles. Phys. Rev. Lett. 2016, 117, 276601. [CrossRef] [PubMed]7. Skelton, J.M.; Burton, L.A.; Parker, S.C.; Walsh, A.; Kim, C.-E.; Soon, A.; Buckeridge, J.; Sokol, A.A.; Catlow, C.R.A.; Togo, A.; et al.
Anharmonicity in the High-Temperature Cmcm Phase of SnSe: Soft Modes and Three-Phonon Interactions. Phys. Rev. Lett. 2016,117, 075502. [CrossRef]
8. Aseginolaza, U.; Bianco, R.; Monacelli, L.; Paulatto, L.; Calandra, M.; Mauri, F.; Bergara, A.; Errea, I. Phonon Collapse andSecond-Order Phase Transition in Thermoelectric SnSe. Phys. Rev. Lett. 2019, 122, 075901. [CrossRef]
9. Nishimura, T.; Sakai, H.; Mori, H.; Akiba, K.; Usui, H.; Ochi, M.; Kuroki, K.; Miyake, A.; Tokunaga, M.; Uwatoko, Y.; et al.Large Enhancement of Thermoelectric Efficiency Due to a Pressure-Induced Lifshitz Transition in SnSe. Phys. Rev. Lett. 2019,122, 226601. [CrossRef]
10. Wang, X.W.; Lee, H.; Lan, Y.C.; Zhu, G.H.; Joshi, G.; Wang, D.Z.; Yang, J.; Muto, A.J.; Tang, M.Y.; Klatsky, J.; et al. EnhancedThermoelectric Figure of Merit in Nanostructured N-Type Silicon Germanium Bulk Alloy. Appl. Phys. Lett. 2008, 93, 193121.[CrossRef]
11. Hohenberg, P.; Kohn, W. Inhomogeneous Electron Gas. Phys. Rev. 1964, 136, B864–B871. [CrossRef]12. Kohn, W.; Sham, L.J. Self-Consistent Equations Including Exchange and Correlation Effects. Phys. Rev. 1965, 140, A1133–A1138.
[CrossRef]13. Donmez Noyan, I.; Gadea, G.; Salleras, M.; Pacios, M.; Calaza, C.; Stranz, A.; Dolcet, M.; Morata, A.; Tarancon, A.; Fonseca, L.
SiGe Nanowire Arrays Based Thermoelectric Microgenerator. Nano Energy 2019, 57, 492–499. [CrossRef]14. Liu, N.; Rezaei, S.E.; Jensen, W.A.; Song, S.; Ren, Z.; Esfarjani, K.; Zebarjadi, M.; Floro, J.A. Improved Thermoelectric Performance
of Eco-Friendly β-FeSi2–SiGe Nanocomposite via Synergistic Hierarchical Structuring, Phase Percolation, and Selective Doping.Adv. Funct. Mater. 2019, 29, 1903157. [CrossRef]
15. Murugasami, R.; Vivekanandhan, P.; Kumaran, S.; Suresh Kumar, R.; John Tharakan, T. Simultaneous Enhancement in Thermo-electric Performance and Mechanical Stability of P-Type SiGe Alloy Doped with Boron Prepared by Mechanical Alloying andSpark Plasma Sintering. J. Alloy Compd. 2019, 773, 752–761. [CrossRef]
16. Taniguchi, T.; Ishibe, T.; Naruse, N.; Mera, Y.; Alam, M.M.; Sawano, K.; Nakamura, Y. High Thermoelectric Power FactorRealization in Si-Rich SiGe/Si Superlattices by Super-Controlled Interfaces. ACS Appl. Mater. Interfaces 2020, 12, 25428–25434.[CrossRef]
17. Khatami, S.N.; Aksamija, Z. Lattice Thermal Conductivity of the Binary and Ternary Group-IV Alloys Si-Sn, Ge-Sn, and Si-Ge-Sn.Phys. Rev. Appl. 2016, 6, 014015. [CrossRef]
Materials 2022, 15, 4107 11 of 12
18. Zhang, X.; Wen, S.; Zhao, C.; Zhang, H. Study on the Mechanical and Optical Properties of SiSn Alloy by First Principles. Mater.Today Commun. 2021, 28, 102543. [CrossRef]
19. Kurosawa, M.; Nakatsuka, O. (Invited) Thermoelectric Properties of Tin-Incorporated Group-IV Thin Films. ECS Trans. 2021,104, 183. [CrossRef]
20. Perdew, J.P.; Burke, K.; Ernzerhof, M. Generalized Gradient Approximation Made Simple. Phys. Rev. Lett. 1996, 77, 3865–3868.[CrossRef]
21. Kresse, G.; Hafner, J. Ab Initio Molecular Dynamics for Liquid Metals. Phys. Rev. B 1993, 47, 558–561. [CrossRef] [PubMed]22. Kresse, G.; Hafner, J. Norm-Conserving and Ultrasoft Pseudopotentials for First-Row and Transition Elements. J. Phys. Condens.
Matter. 1994, 6, 8245–8257. [CrossRef]23. Kresse, G.; Furthmüller, J. Efficiency of Ab-Initio Total Energy Calculations for Metals and Semiconductors Using a Plane-Wave
Basis Set. Comput. Mater. Sci. 1996, 6, 15–50. [CrossRef]24. Kresse, G.; Furthmüller, J. Efficient Iterative Schemes for Ab Initio Total-Energy Calculations Using a Plane-Wave Basis Set. Phys.
Rev. B 1996, 54, 11169–11186. [CrossRef] [PubMed]25. Heyd, J.; Scuseria, G.E.; Ernzerhof, M. Hybrid Functionals Based on a Screened Coulomb Potential. J. Chem. Phys. 2003, 118,
8207–8215. [CrossRef]26. Heyd, J.; Scuseria, G.E. Efficient Hybrid Density Functional Calculations in Solids: Assessment of the Heyd–Scuseria–Ernzerhof
Screened Coulomb Hybrid Functional. J. Chem. Phys. 2004, 121, 1187–1192. [CrossRef]27. Rangel, T.; Del Ben, M.; Varsano, D.; Antonius, G.; Bruneval, F.; da Jornada, F.H.; van Setten, M.J.; Orhan, O.K.; O’Regan, D.D.;
Canning, A.; et al. Reproducibility in G0W0 Calculations for Solids. Comput. Phys. Commun. 2020, 255, 107242. [CrossRef]28. Giannozzi, P.; Baroni, S.; Bonini, N.; Calandra, M.; Car, R.; Cavazzoni, C.; Ceresoli, D.; Chiarotti, G.L.; Cococcioni, M.; Dabo, I.;
et al. QUANTUM ESPRESSO: A Modular and Open-Source Software Project for Quantum Simulations of Materials. J. Phys.Condens. Matter 2009, 21, 395502. [CrossRef]
29. Marini, A.; Hogan, C.; Grüning, M.; Varsano, D. Yambo: An Ab Initio Tool for Excited State Calculations. Comput. Phys. Commun.2009, 180, 1392–1403. [CrossRef]
30. Sangalli, D.; Ferretti, A.; Miranda, H.; Attaccalite, C.; Marri, I.; Cannuccia, E.; Melo, P.; Marsili, M.; Paleari, F.; Marrazzo, A.; et al.Many-Body Perturbation Theory Calculations Using the Yambo Code. J. Phys. Condens. Matter 2019, 31, 325902. [CrossRef]
31. Noffsinger, J.; Giustino, F.; Malone, B.D.; Park, C.-H.; Louie, S.G.; Cohen, M.L. EPW: A Program for Calculating the Electron–Phonon Coupling Using Maximally Localized Wannier Functions. Comput. Phys. Commun. 2010, 181, 2140–2148. [CrossRef]
32. Poncé, S.; Margine, E.R.; Verdi, C.; Giustino, F. EPW: Electron–Phonon Coupling, Transport and Superconducting PropertiesUsing Maximally Localized Wannier Functions. Comput. Phys. Commun. 2016, 209, 116–133. [CrossRef]
33. Li, W. Electrical Transport Limited by Electron-Phonon Coupling from Boltzmann Transport Equation: An Ab Initio Study of Si,Al, and MoS2. Phys. Rev. B 2015, 92, 075405. [CrossRef]
34. Fan, D.D.; Liu, H.J.; Cheng, L.; Liang, J.H.; Jiang, P.H. A First-Principles Study of the Effects of Electron–Phonon Coupling on theThermoelectric Properties: A Case Study of the SiGe Compound. J. Mater. Chem. A 2018, 6, 12125–12131. [CrossRef]
35. Murphy-Armando, F.; Fahy, S. First Principles Calculation of Electron-Phonon and Alloy Scattering in Strained SiGe. J. Appl.Phys. 2011, 110, 123706. [CrossRef]
36. Marzari, N.; Vanderbilt, D. Maximally Localized Generalized Wannier Functions for Composite Energy Bands. Phys. Rev. B 1997,56, 12847–12865. [CrossRef]
37. Zunger, A.; Wei, S.-H.; Ferreira, L.G.; Bernard, J.E. Special Quasirandom Structures. Phys. Rev. Lett. 1990, 65, 353–356. [CrossRef]38. Van de Walle, A.; Tiwary, P.; de Jong, M.; Olmsted, D.L.; Asta, M.; Dick, A.; Shin, D.; Wang, Y.; Chen, L.-Q.; Liu, Z.-K. Efficient
Stochastic Generation of Special Quasirandom Structures. Calphad 2013, 42, 13–18. [CrossRef]39. Cahill, D.G.; Watson, S.K.; Pohl, R.O. Lower Limit to the Thermal Conductivity of Disordered Crystals. Phys. Rev. B 1992, 46,
6131–6140. [CrossRef]40. Kaiser, U.; Saitoh, K.; Tsuda, K.; Tanaka, M. Application of the CBED Method for the Determination of Lattice Parameters of
Cubic Sic Films on 6H SiC Substrates. J. Electron. Microsc. 1999, 48, 221–233. [CrossRef]41. Wang, S.Q.; Ye, H.Q. Plane-Wave Pseudopotential Study on Mechanical and Electronic Properties for IV and III-V Crystalline
Phases with Zinc-Blende Structure. Phys. Rev. B 2002, 66, 235111. [CrossRef]42. Dismukes, J.P.; Ekstrom, L.; Paff, R.J. Lattice Parameter and Density in Germanium-Silicon Alloys1. J. Phys. Chem. 1964, 68,
3021–3027. [CrossRef]43. Lambrecht, W.R.L.; Segall, B.; Yoganathan, M.; Suttrop, W.; Devaty, R.P.; Choyke, W.J.; Edmond, J.A.; Powell, J.A.; Alouani, M.
Calculated and Measured Uv Reflectivity of SiC Polytypes. Phys. Rev. B 1994, 50, 10722–10726. [CrossRef] [PubMed]44. Chasmar, R.P.; Stratton, R. The Thermoelectric Figure of Merit and Its Relation to Thermoelectric Generators. J. Adv. Sci. 1959, 7,
52–72. [CrossRef]45. Bardeen, J.; Shockley, W. Deformation Potentials and Mobilities in Non-Polar Crystals. Phys. Rev. 1950, 80, 72–80. [CrossRef]46. Hüe, F.; Hÿtch, M.; Bender, H.; Houdellier, F.; Claverie, A. Direct Mapping of Strain in a Strained Silicon Transistor by High-
Resolution Electron Microscopy. Phys. Rev. Lett. 2008, 100, 156602. [CrossRef]47. Yu, B.; Zebarjadi, M.; Wang, H.; Lukas, K.; Wang, H.; Wang, D.; Opeil, C.; Dresselhaus, M.; Chen, G.; Ren, Z. Enhancement of
Thermoelectric Properties by Modulation-Doping in Silicon Germanium Alloy Nanocomposites. Nano Lett. 2012, 12, 2077–2082.[CrossRef]
Materials 2022, 15, 4107 12 of 12
48. Snedaker, M.L.; Zhang, Y.; Birkel, C.S.; Wang, H.; Day, T.; Shi, Y.; Ji, X.; Kraemer, S.; Mills, C.E.; Moosazadeh, A.; et al. Silicon-BasedThermoelectrics Made from a Boron-Doped Silicon Dioxide Nanocomposite. Chem. Mater. 2013, 25, 4867–4873. [CrossRef]
49. Bathula, S.; Jayasimhadri, M.; Gahtori, B.; Kumar, S.N.; Tyagi, K.; Srivastava, A.; Dhar, A. The Role of Nanoscale Defect Featuresin Enhancing the Thermoelectric Performance of P-Type Nanostructured SiGe Alloys. Nanoscale 2015, 7, 12474–12483. [CrossRef]
50. Basu, R.; Bhattacharya, S.; Bhatt, R.; Roy, M.; Ahmad, S.; Singh, A.; Navaneethan, M.; Hayakawa, Y.; Aswal, D.K.; Gupta, S.K.Improved Thermoelectric Performance of Hot Pressed Nanostructured N-Type SiGe Bulk Alloys. J. Mater. Chem. A 2014, 2,6922–6930. [CrossRef]
51. Lahwal, A.; Bhattacharya, S.; He, J.; Wu, D.; Peterson, A.; Poon, S.J.; Williams, L.; Dehkordi, A.M.; Tritt, T.M. Impact of YttriaStabilized Zirconia Nanoinclusions on the Thermal Conductivity of N-Type Si80Ge20 Alloys Prepared by Spark Plasma Sintering.J. Appl. Phys. 2015, 117, 145101. [CrossRef]
52. Slack, G.; Hussain, M. The Maximum Possible Conversion Efficiency of Silicon-Germanium Thermoelectric Generators. J. Appl.Phys. 1991, 70, 2694–2718. [CrossRef]
53. Kittel, C. Introduction to Solid State Physics. Am. J. Phys. 1967, 35, 547–548. [CrossRef]54. Upadhyaya, M.; Khatami, S.N.; Aksamija, Z. Engineering Thermal Transport in SiGe-Based Nanostructures for Thermoelectric
Applications. J. Mater. Res. 2015, 30, 2649–2662. [CrossRef]55. Mingo, N.; Hauser, D.; Kobayashi, N.P.; Plissonnier, M.; Shakouri, A. “Nanoparticle-in-Alloy” Approach to Efficient Thermo-
electrics: Silicides in SiGe. Nano Lett. 2009, 9, 711–715. [CrossRef] [PubMed]56. Xue, D.; Myles, C.W. First-Principles Analysis of Vibrational Properties of Type II SiGe Alloy Clathrates. Nanomaterials 2019,
9, 723. [CrossRef]57. He, Y.; Savic, I.; Donadio, D.; Galli, G. Lattice Thermal Conductivity of Semiconducting Bulk Materials: Atomistic Simulations.
Phys. Chem. Chem. Phys. 2012, 14, 16209–16222. [CrossRef]58. Kandemir, A.; Ozden, A.; Cagin, T.; Sevik, C. Thermal Conductivity Engineering of Bulk and One-Dimensional Si-Ge Nanoarchi-
tectures. Sci. Technol. Adv. Mater. 2017, 18, 187–196. [CrossRef]59. Dismukes, J.P.; Ekstrom, L.; Steigmeier, E.F.; Kudman, I.; Beers, D.S. Thermal and Electrical Properties of Heavily Doped Ge-Si
Alloys up to 1300 ◦K. J. Appl. Phys. 1964, 35, 2899–2907. [CrossRef]60. Bera, C.; Soulier, M.; Navone, C.; Roux, G.; Simon, J.; Volz, S.; Mingo, N. Thermoelectric Properties of Nanostructured Si1−xGex
and Potential for Further Improvement. J. Appl. Phys. 2010, 108, 124306. [CrossRef]61. Singh, D.J.; Mazin, I.I. Calculated Thermoelectric Properties of La-Filled Skutterudites. Phys. Rev. B 1997, 56, R1650–R1653.
[CrossRef]
Top Related
Copyright © 2022 FDOKUMEN

