


Bahasa
Halaman
Hukum

University of Montana University of Montana
ScholarWorks at University of Montana ScholarWorks at University of Montana
Graduate Student Theses, Dissertations, & Professional Papers Graduate School
1962
Factors influencing the motivation of band programs in Montana Factors influencing the motivation of band programs in Montana
C and D schools C and D schools
Melvin Joseph Gaudin The University of Montana
Follow this and additional works at: https://scholarworks.umt.edu/etd
Let us know how access to this document benefits you.
Recommended Citation Recommended Citation Gaudin, Melvin Joseph, "Factors influencing the motivation of band programs in Montana C and D schools" (1962). Graduate Student Theses, Dissertations, & Professional Papers. 2313. https://scholarworks.umt.edu/etd/2313
This Thesis is brought to you for free and open access by the Graduate School at ScholarWorks at University of Montana. It has been accepted for inclusion in Graduate Student Theses, Dissertations, & Professional Papers by an authorized administrator of ScholarWorks at University of Montana. For more information, please contact [email protected].
FACTORS INFLUENCING THE MOTIVATION OF BAND PROGRAMS IN MONTANA C AND D SCHOOLS
by
MELVIN J. GAUDIN
B. M. Montana State University, 1950
Presented in partial fulfillment of the requirementsfor the degree of
Master of Music Education
MONTANA STATE UNIVERSITY
1962
Approved by:
Chairman, Board of ExajEiners
Dean, Graduate School
AUG 1 7 1962 Date
UMI Number: EP35314
All rights reserved
INFORMATION TO ALL U SER S The quality of this reproduction is d ep en d en t upon the quality of the copy subm itted.
In the unlikely even t that the au thor did not sen d a com plete m anuscript and there a re m issing pages, th ese will be noted. Also, if m aterial had to be rem oved,
a note will indicate the deletion.
UMTUMI EP35314
Published by ProQ uest LLC (2012). Copyright in th e D issertation held by the Author.
Microform Edition © P roQ uest LLC.All rights reserved. This work is protected aga inst
unauthorized copying under Title 17, United S ta te s C ode
ProQ uest LLC.789 E ast E isenhow er Parkw ay
P.O . Box 1346 Ann Arbor, Ml 48106 - 1346
ACKNOWLEDGMENTS
The author wishes to express his thanks and appreci-ation to the late Dean John Crowder and to Dr. Lloyd Co Oakland of Montana State University^ for their assistance in the early preparation of this study; to Dr. Gerald Ho Doty, Chairman of Graduate Studies in Music, Montana State Uni- versity, for his encouragement and timely suggestions while this study was in progress; and to my wife Earlene, whose cooperative silence and considerable amount of typing made this work possible.
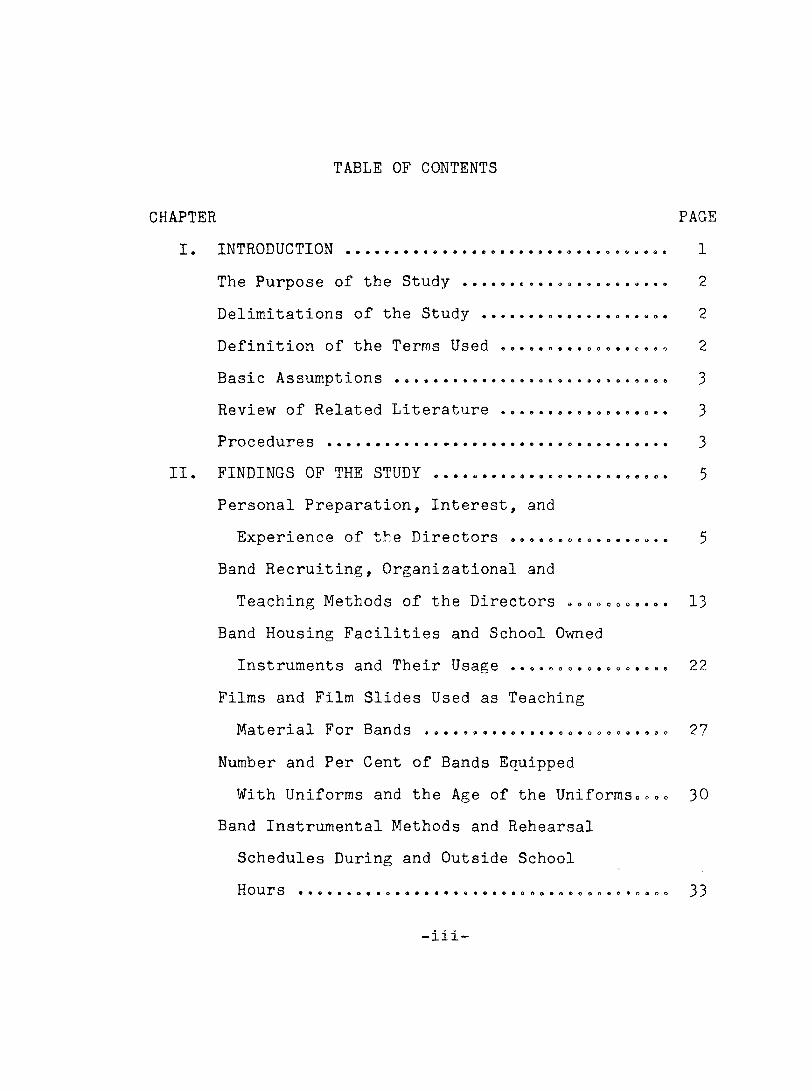
TABLE OF CONTENTS
CHAPTER PAGEI. INTRODUCTION ................. I
The Purpose of the Study ...... 2DeIimitâtXoris of the Study .................... 2Definition of the Terms Used .................. 2
Besxc Assumptxons 3Review of Related Literature .......... 3Procedures .......................... 3
II. FINDINGS OF THE STUDY ...................____ 5Personal Preparation, Interest, and
Experience of the Directors ................. 5Band Recruiting, Organizational and
Teaching Methods of the Directors ........... 13Band Housing Facilities and School Owned
Instruments and Their Usage ................. 22Films and Film Slides Used as TeachingMaterial For Bands ..... 27
Number and Per Cent of Bands EquippedWith Uniforms and the Age of the Uniforms.... 30
Band Instrumental Methods and Rehearsal Schedules During and Outside SchoolHours ........ ........ .a.«»ft.oooo..o9..o»o«oo 33
-iii-
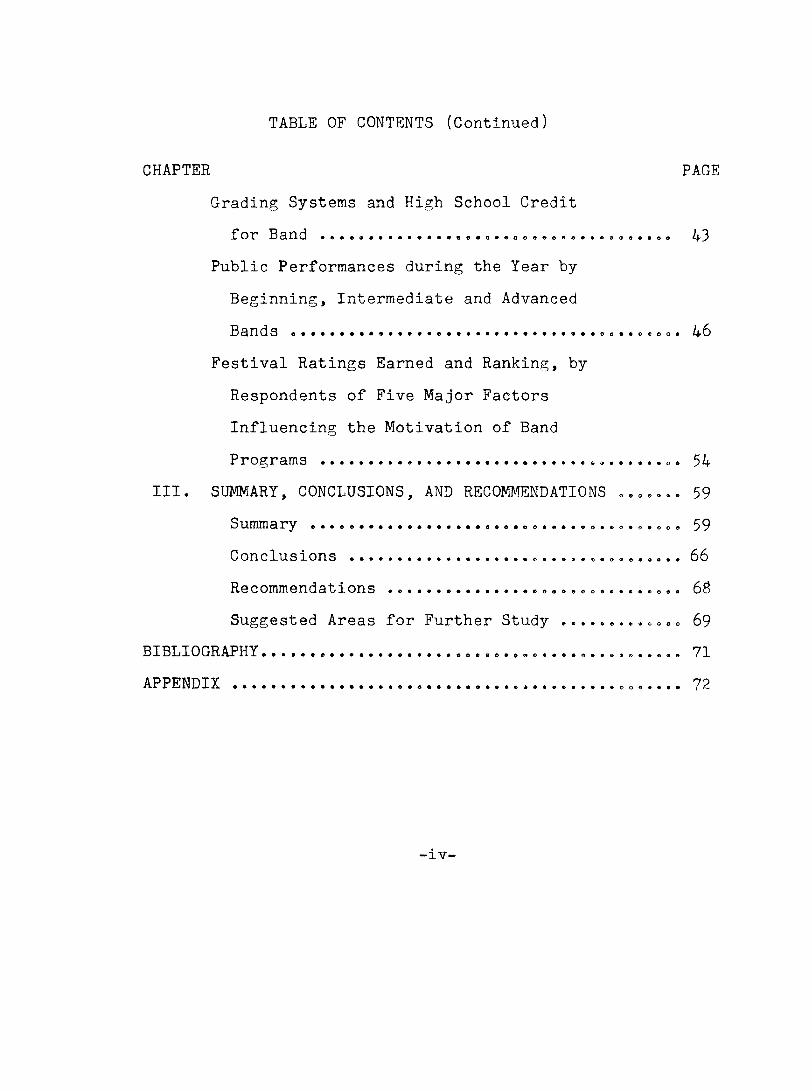
TABLE OF CONTENTS (Continued)
CHAPTER PAGEGrading Systems and High School Credit
Tor Band *̂3Public Performances during the Year by
Beginning, Intermediate and Advanced
BandsFestival Ratings Earned and Ranking, by
Respondents of Five Major Factors Influencing the Motivation of BandPrograms .............................. 54
III. SUMMARY, CONCLUSIONS, AND RECOMMENDATIONS ....... 59Summary .......................o............... 59Conclusions ................................... bbRecommendations ...................... 68Suggested Areas for Further S t u d y ........... 69
BIBLIOGRAPHY ......................... 71APPENDIX.................................. 72
-IV-
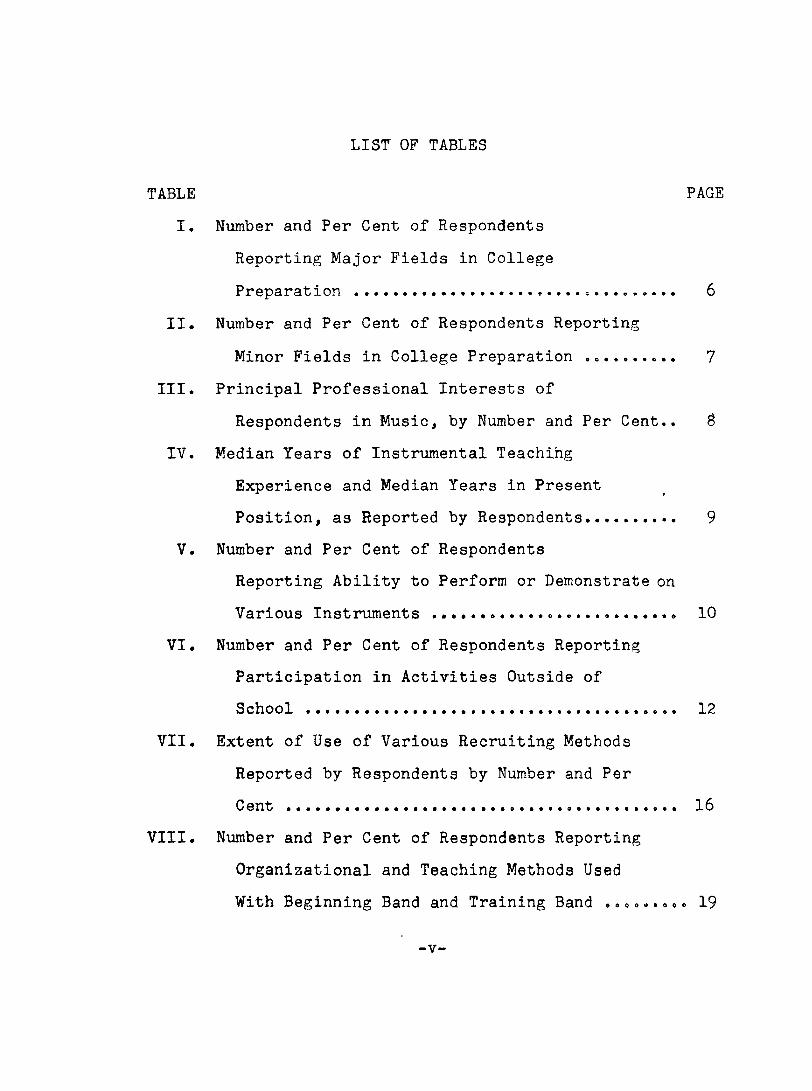
LIST OF TABLES
TABLE PAGEI. Number and Per Cent of Respondents
Reporting Major Fields in CollegePreparation ....................... »... 6
11. Number and Per Cent of Respondents Reporting
Minor Fields in College Preparation ....... 7111. Principal Professional Interests of
Respondents in Music, by Number and Per Cent.. SIV. Median Years of Instrumental Teaching
Experience and Median Years in PresentPosition, as Reported by Respondents......... 9
V. Number and Per Cent of RespondentsReporting Ability to Perform or Demonstrate on
Various Instruments ............ 10VI. Number and Per Cent of Respondents Reporting
Participation in Activities Outside ofSchool ........................................ 12
VII. Extent of Use of Various Recruiting Methods Reported by Respondents by Number and PerCent .......................................... 16
Vlll. Number and Per Cent of Respondents Reporting Organizational and Teaching Methods Used With Beginning Band and Training Band ..... 19
• m ^ tm
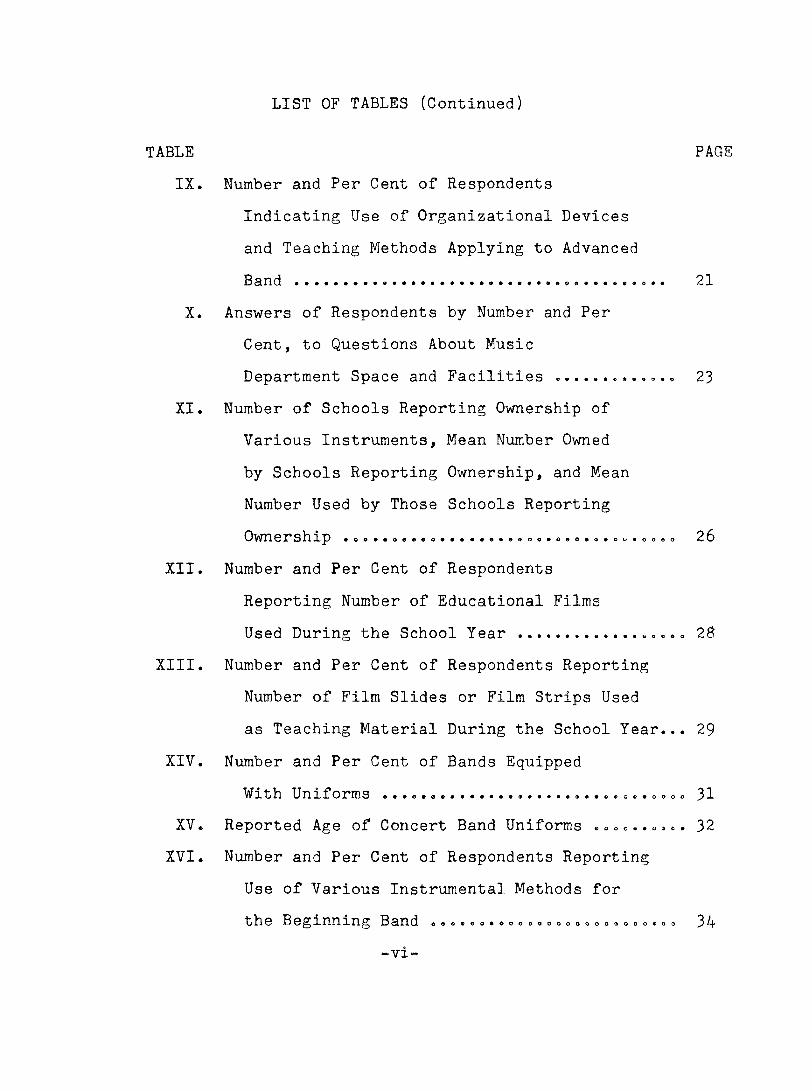
LIST OF TABLES (Continued)
TABLE PAGEIX. Number and Per Cent of Respondents
Indicating Use of Organizational Devicesand Teaching Methods Applying to AdvancedBand . . . . . . . . . . . . . . . . . . . . . . . . . . . m . . 2I
X. Answers of Respondents by Number and Per Cent, to Questions About MusicDepartment Space and Facilities .......... 23
XI. Number of Schools Reporting Ownership of Various Instruments, Mean Number Owned by Schools Reporting Ownership, and Mean Number Used by Those Schools Reporting Ownership .o...o...o........e.o.o.o...oo.oo.o 2b
XII. Number and Per Cent of RespondentsReporting Number of Educational FilmsUsed During the School Y e a r ............. 20
XIII. Number and Per Cent of Respondents Reporting Number of Film Slides or Film Strips Used as Teaching Material During the School Year... 29
XIV. Number and Per Cent of Bands Equipped1/̂ xth Uniforms ..............................o. 31
XV. Reported Age of Concert Band Uniforms . . . . . . . 32XVI. Number and Per Cent of Respondents Reporting
Use of Various Instrumental Methods for the Beginning Band oo..©..................... 3A*
-vi-
LIST OF TABLES (Continued)
TABLE PAGE
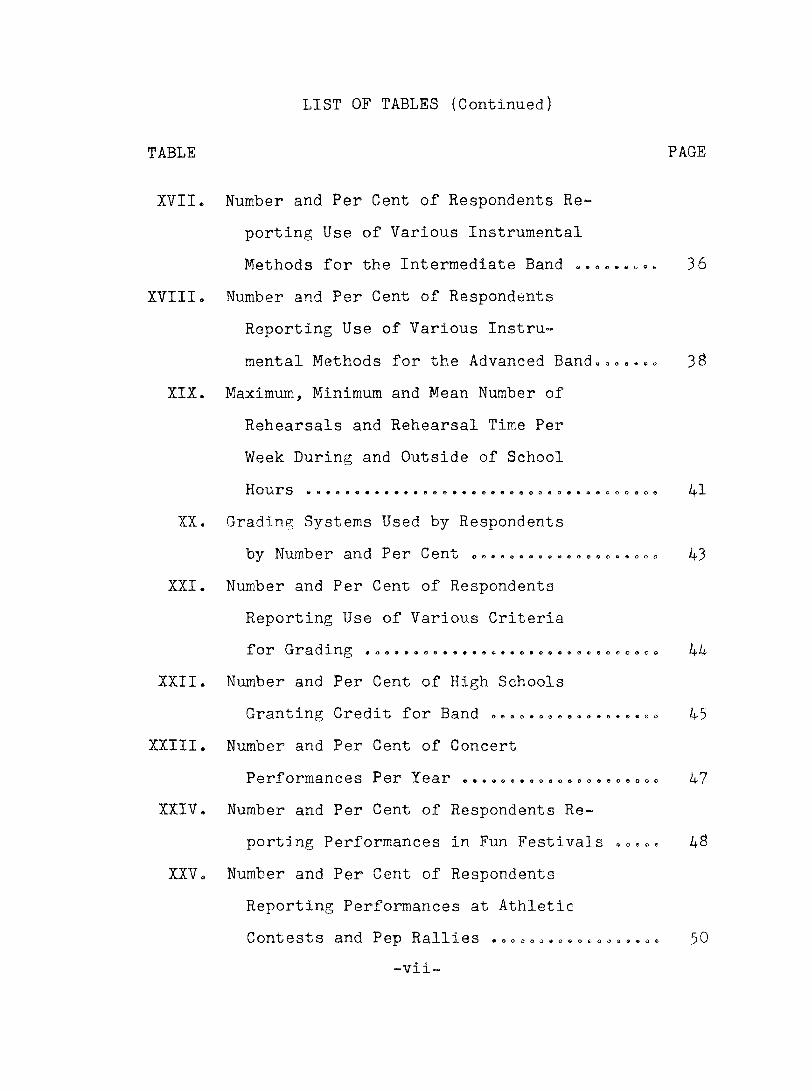
XYII. Number and Per Cent of Respondents Reporting Use of Various Instrumental Methods for the Intermediate Band ....
XVIII. Number and Per Cent of Respondents Reporting Use of Various Instru
mental Methods for the Advanced Band..XIX. Maximum, Minimum and Mean Number of
Rehearsals and Rehearsal Time Per Week During and Outside of School
XX.
XXI
Hours o *
Grading Systems Used by Respondents by Number and Per Cent
Number and Per Cent of Respondents Reporting Use of Various Criteria for Grading
XXII. Number and Per Cent of High Schools Granting Credit for Band
XXIII. Number and Per Cent of Concert Performances Per Year
XXIV. Number and Per Cent of Respondents Reporting Performances in Fun Festivals
XXV. Number and Per Cent of RespondentsReporting Performances at Athletic
e # # @ @ # * a o e o o @ o o e o o o o c
Contests and Pep Rallies-vii-
o o o o a * 0 9 o e o o @ « e o
36
38
41
43
44
45
47
48
50
LIST OF TABLES (Continued)
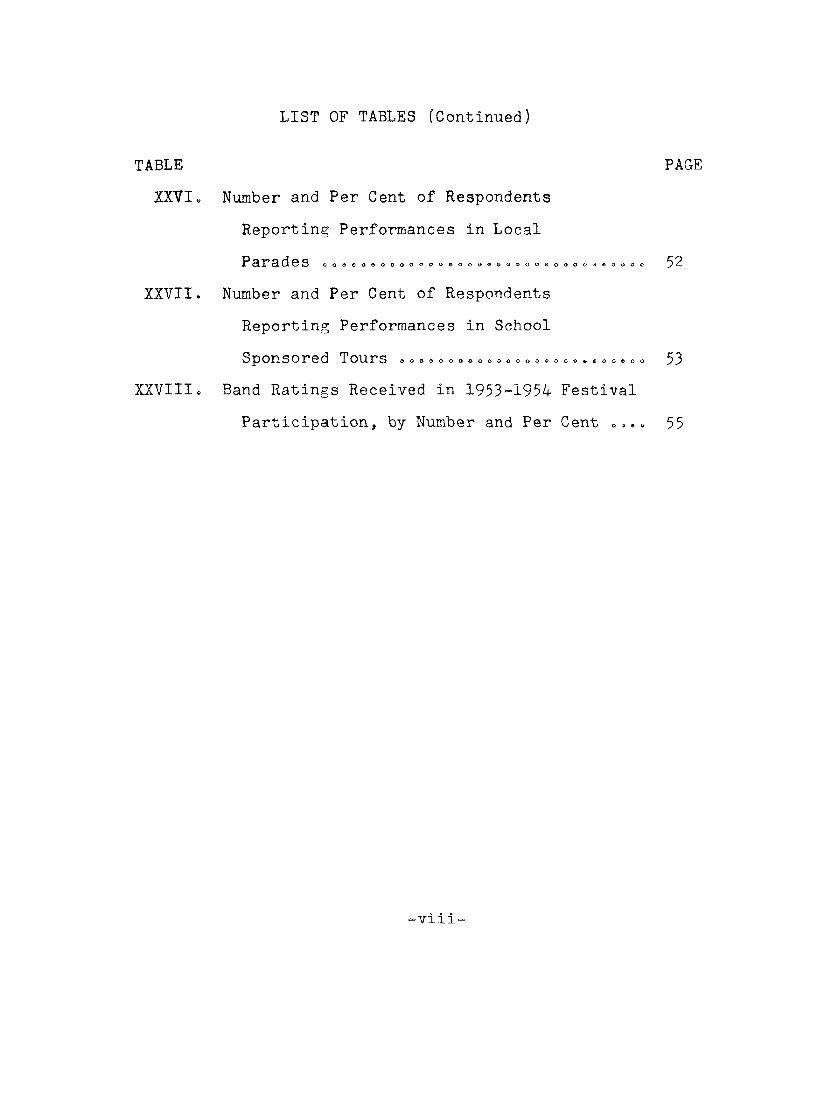
TABLE PAGEXXVI» Number and Per Cent of Respondents
Reporting Performances in LocalP a r a d e s © o O O O Ô O O O O O O O G O O » 0 O a ® O O O O O O O S « O O O ® ^ 2
XXVII. Number and Per Cent of Respondents Reporting Performances in School
Sponsored Tours o o o o o o o o o o o o g o o o o®&*«oo®oo 53 XXVIII. Band Ratings Received in 1953-1954 Festival
Participation, by Number and Per Cent .».. 55
- V l l l -
LIST OF FIGURES
FIGURE PAGE
Io Frequency of Rankings by 36 Respondents of Five Major Factors Influencing the Motivation of Band Programs, in Order of theirImportance 0O0GO0ooooo@oooo0**@,B@o@@*iD«@#@ 3S
IX
CHAPTER I
INTRODUCTION
Motivation in ordinary experience is generally recognized to occupy a very important place in human affairs.Factors which influence the motivation of band programs where- ever a school band program exists will constantly receive a great deal of attention by the music director concerned.
With reference to the director of a band program, motivation at once affects everything he does. His management of rehearsals, his approach to problems of techniques, his
choice of music, the way he deals with it, the use he makes of public occasions, his disciplinary procedures — in fact, his whole influence upon the pupils — all these are factors which influence the motivation of his groups.
The facts about usefulness of a motive in a certain learning situation will be furnished by educational psychology, but proper application of the incentive in a given situation depends upon the insight of the teacher. The effectiveness or worth of a teacher depends upon his ability to make adequate use of motivation.!
The purpose of the band program, as one of the very important parts of the music curriculum, is to foster musical and emotional growth in the individual.
In view of the tremendous importance of our instrumental
Benjamin Brenner, Effect of Immediate and Delayed Praise and Blame Upon Learning and Recall (New York: Bureau of Publications, Teachers College, Columbia University, 1934), p. $0.
-2-
programs in the public schools today, much emphasis should be placed on the factors which influence the motivation of band groups.
THE PURPOSE OF THE STUDY
This study was undertaken as a means of determining some of the factors and practices which influence the motivation of prospective instrumental students as well as students who are actively taking part in the band programs.
DELIMITATIONS OF THE STUDY
This study included only those public high schools in Montana which have an enrollment of from 50 to I50 students.It also included, in connection with the band program of the high school, instrumental groups or other ensembles which were present in the junior high schools and elementary grades. Preband organizations, involving students prior to their enrollment in beginning instrumental or band classes, were not included.
DEFINITION OF THE TERMS USED
Training band. The term "training band" as used in this study refers to that group of band students who have been promoted from the beginning band to an intermediate group which usually consists of 6th. 7th, and 8th grade students.
-3»
BASIC ASSUMPTIONS
The study was based on the following basic assumptions;lo Certain factors which influence motivation of band
programs are more important than others»2a The questionnaire, in spite of its limitations in
gathering precise information, will provide data which are reasonably valid for the purpose of the study.
3. The investigator is qualified by education and experience to make useful judgments based on the data.
REVIEW OF RELATED LITERATURE
2Ward Ro Smith made a survey of certain practices in the organization and continuation of elementary and junior high school bands in the state of Washington, "nre purposes of hisstudy were (1) to compare basic instrumental programs in the larger schools of Washington and to formulate a concept of the situation on a state-wide basis; (2) to draw conclusions as to the importance of and the place assigned to grade school
instrumental music in Washington; and (3) to build a basis for future planning.
PROCEDURES
Data obtained for the present study were gathered by a
^Ward R. Smith, The Status of Grade School Bands in Washington (unpublished Master*s Thesis, Montana State University 1953)7
questionnaire^ survey, conducted in the fall of 1955, among music directors in the class C and D schools in Montana having an enrollment of 50 to 150 students in high school.
The problem, "Factors Influencing The Motivation of Band Programs," was submitted in outline form, and approved by the late Dean John Crowder who was at that time teaching the graduate course. The Methodology of Educational Research, The outline of this study was a culmination of this course. The questionnaire was drafted during the 1954 summer session at Montana State University and approved by Dr, Lloyd Oakland.
The names and enrollments of the schools to be included in this survey were obtained from the State Department of Public Instruction, There were 36 second class districts, 2Ê third class districts, and 5 county high schools, A letter and questionnaire were sent to each music director. Approximately two weeks after the questionnaires were mailed, another short personal letter was sent to each of the music directors who had not responded. Data were arranged in tables for purposes of analysis and conclusions and recommendations were made.
^See Appendix,
CHAPTER II
FINDINGS OF THE STUDY
Of the 69 questionnaires sent to music directors, 43» or 62.3 per cent, were returned.
PERSONAL PREPARATION, INTEREST, AND EXPERIENCE OF THE DIRECTORS
Table I shows the number and per cent of respondents reporting major fields in college preparation. Twenty-one, or 4Ô08 per cent, had instrumental majors in college preparation; 4» or 9=3 per cent, had choral majors; three, or 7 per cent, indicated that they had composite majors in vocal and instrumental music; 2, or 4=6 per cent, had music education majors; 1, or 2.3 per cent, indicated a theory major; and 2 , or 4=6 per cent, reported having a major outside the music field. Two, or 4.6 per cent re- ported they did not have any major field in college pre- paration. Eight, or IS.6 per cent, did not answer.
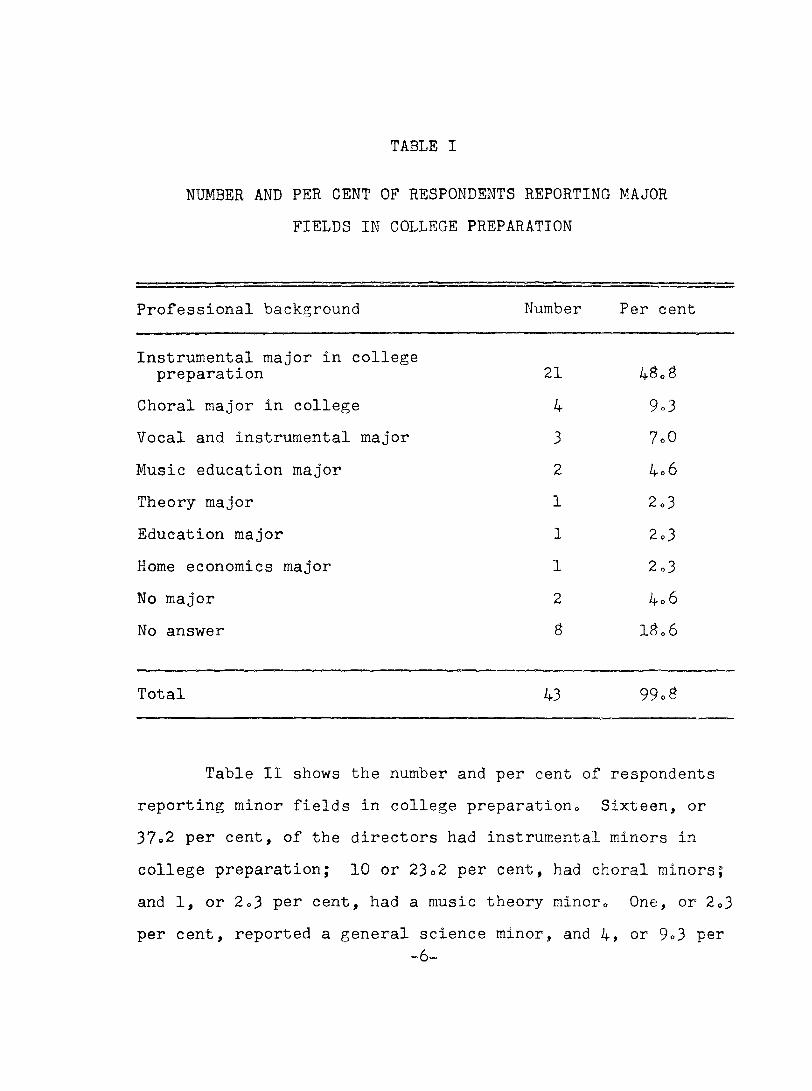
TABLE I
NUMBER AND PER CENT OF RESPONDENTS REPORTING MAJOR FIELDS IN COLLEGE PREPARATION
Professional background Number Per cent
Instrumental major in collegepreparation 21 48.8
Choral major in college 4 9.3Vocal and instrumental major 3 7.0Music education major 2 4.6Theory major 1 2.3Education major 1 2.3Home economics major 1 2.3No major 2 4.6No answer S 18.6
Total 43 99.8
Table II shows the number and per cent of respondentsreporting minor fields in college preparationo Sixteen, or37o2 per cent, of the directors had instrumental minors incollege preparation; 10 or 23o2 per cent, had choral minors;and 1, or 2.3 per cent, had a music theory minor* One, or 2*3per cent, reported a general science minor, and 4, or 9«3 per
- 6-
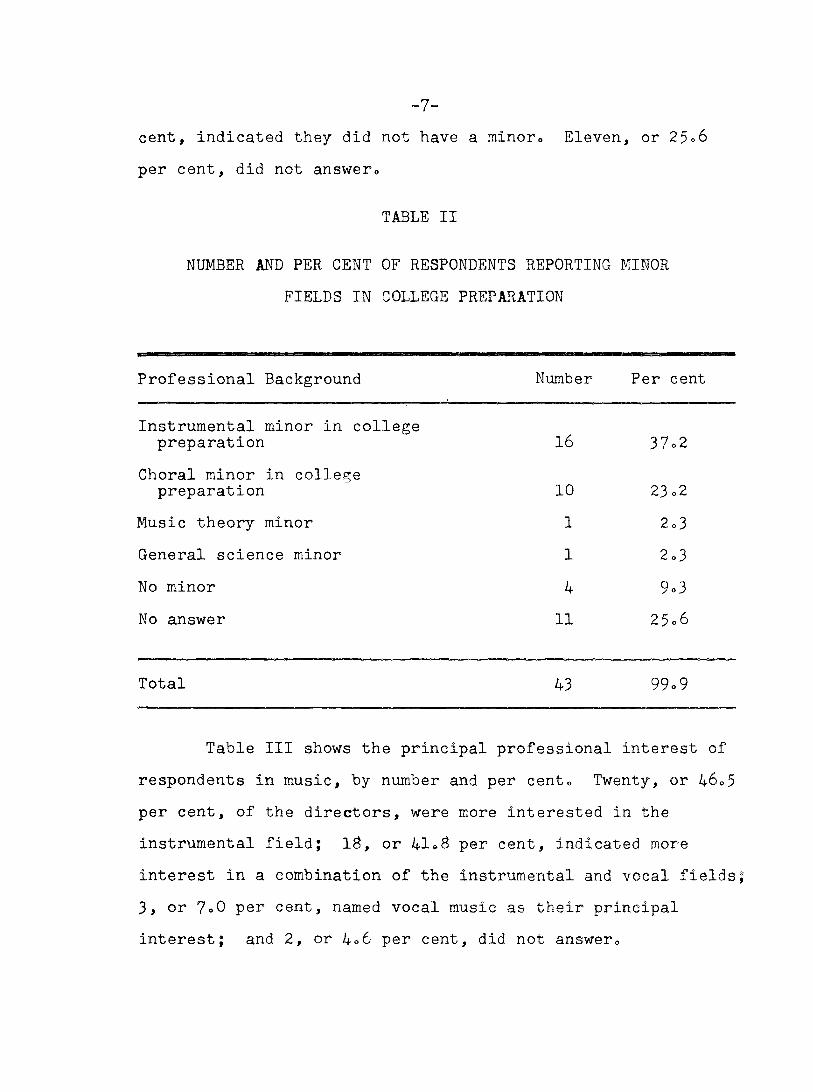
-7-cent, indicated they did not have a minor. Eleven, or 25.6 per cent, did not answer,
TABLE II
NUMBER AND PER CENT OF RESPONDENTS REPORTING MINOR FIELDS IN COLLEGE PREPARATION
Professional Background Number Per cent
Instrumental minor in college preparation 16 37.2
Choral minor in college preparation 10 23.2
Music theory minor 1 2.3General science minor 1 2.3No minor 4 9.3No answer 11 25.6
Total 43 99.9
Table III shows the principal professional interest of respondents in music, by number and per cent. Twenty, or 46,5 per cent, of the directors, were more interested in the instrumental field; IB, or 41«B per cent, indicated more interest in a combination of the instrumental and vocal fields; 3, or 7oO per cent, named vocal music as their principal interest; and 2, or 4°6 per cent, did not answer.
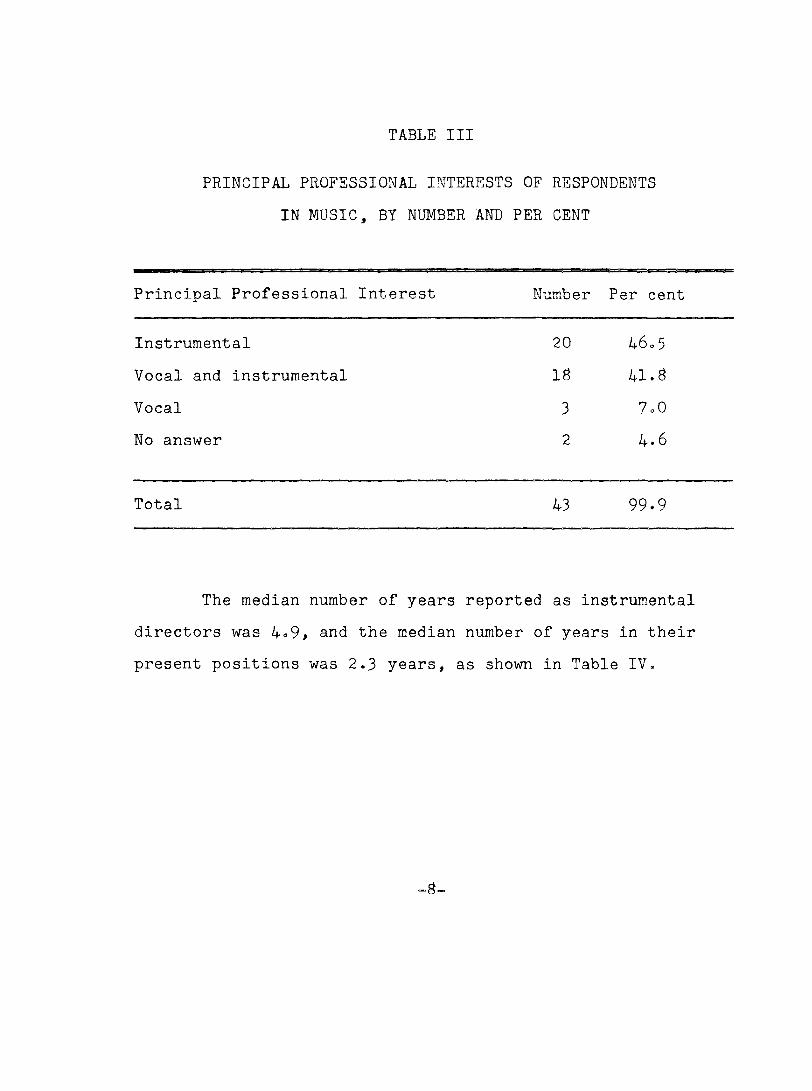
TABLE III
PRINCIPAL PROFESSIONAL INTERESTS OF RESPONDENTSIN MUSIC, BY NUMBER AND PER CENT
Per centPrincipal Professional Interest Number
Instrumental 20 460 5Vocal and instrumental IS 41.8Vocal 3 7.0No answer 2 4.6
Total 43 99.9
The median number of years reported as instrumental directors was 4°9, and the median number of years in their present positions was 2.3 years, as shown in Table IV.
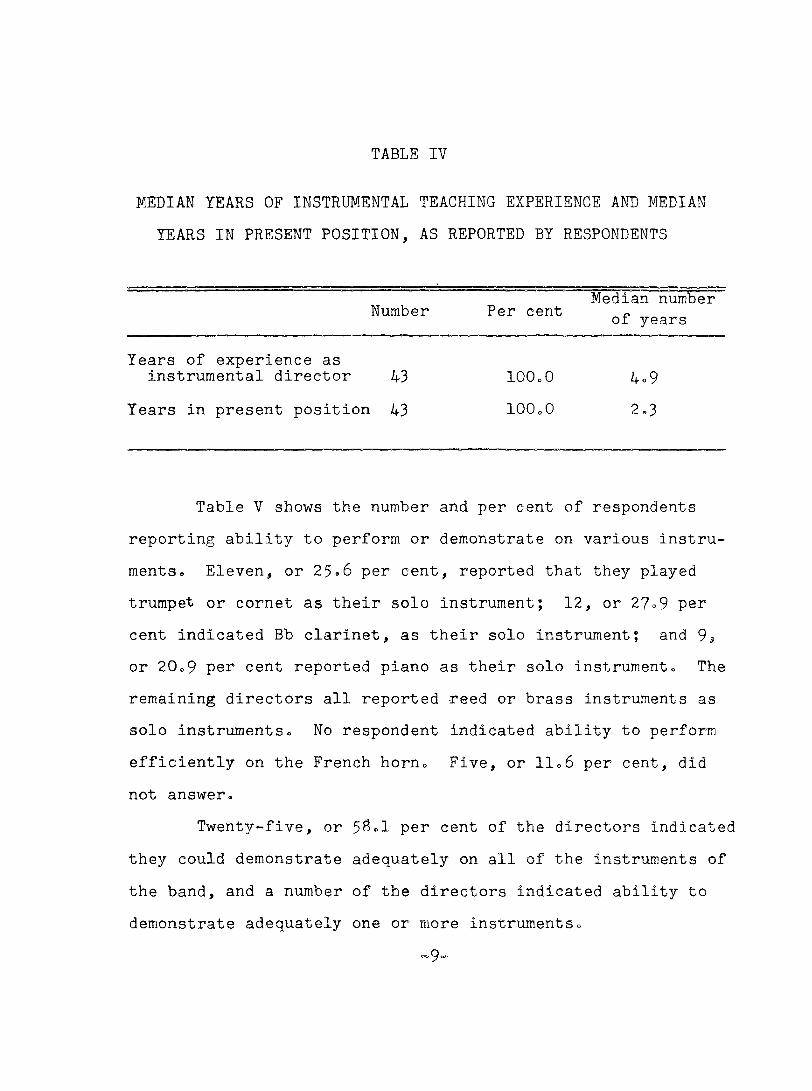
TABLE IV
MEDIAN TEARS OF INSTRUMENTAL TEACHING EXPERIENCE AND MEDIAN TEARS IN PRESENT POSITION, AS REPORTED BT RESPONDENTS
Number Per centMedian number
of years
Tears of experience asinstrumental director 43 100.0 4.9
Tears in present position 43 100.0 2.3
Table V shows the number and per cent of respondents reporting ability to perform or demonstrate on various instruments. Eleven, or 25.6 per cent, reported that they played trumpet or cornet as their solo instrument; 12, or 27°9 per cent indicated Bb clarinet, as their solo instrument ; and 9» or 20.9 per cent reported piano as their solo instrument. The remaining directors all reported reed or brass instruments as solo instruments. No respondent indicated ability to perform efficiently on the French horn. Five, or 11.6 per cent, did not answer.
Twenty-five, or 58.1 per cent of the directors indicated they could demonstrate adequately on all of the instruments of the band, and a number of the directors indicated ability to demonstrate adequately one or more instruments.
-9-
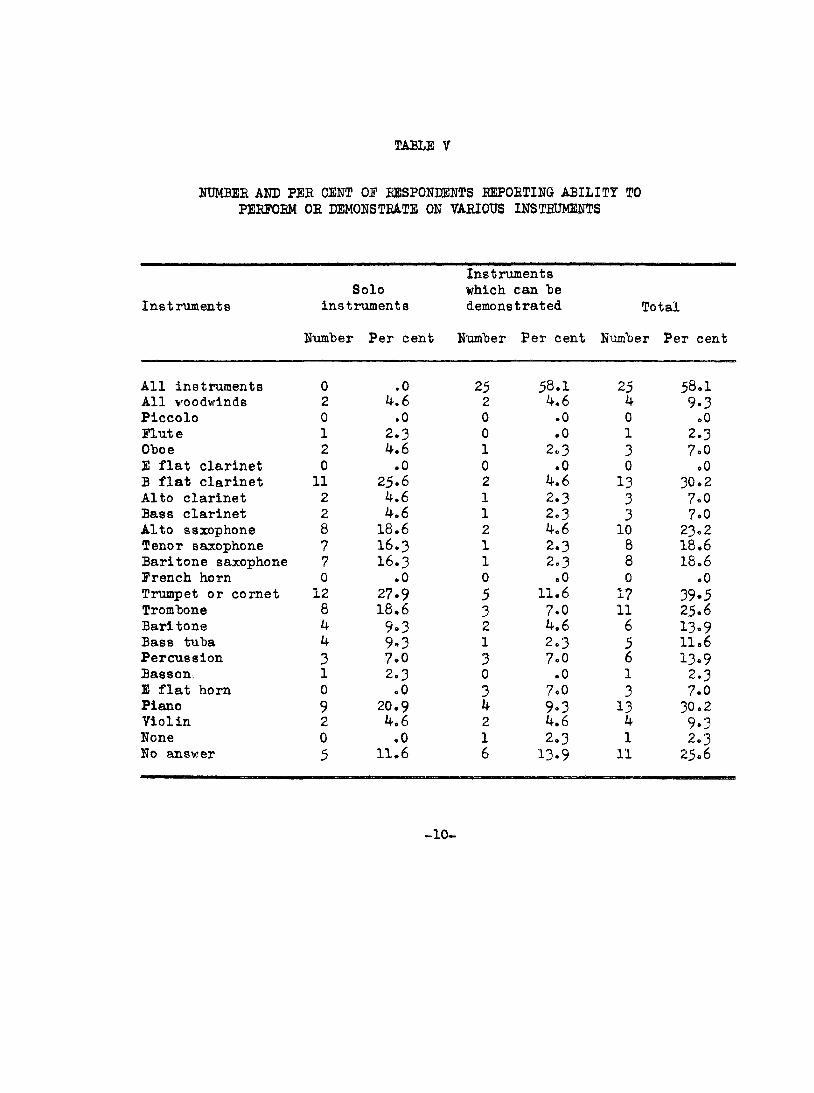
TABLE V
HUMBEE AND PEE CENT 01 EESPONDENTS EEPOETING ABILITY TO PEEPOEM OE DEMONSTEATE ON VAEIOUS INSTEDMENTS
InstrumentsSolo
instrumentsInstruments which can he demonstrated Total
Number Per cent Number Per cent Number Per cej
All instruments 0 .0 25 58.1 25 58.1All woodwinds 2 4.6 2 4.6 4 9 .3Piccolo 0 .0 0 .0 0 .0Elute 1 2.3 0 .0 1 2 .3Ohoe 2 4.6 1 2.3 3 7 .0E flat clarinet 0 .0 0 .0 0 .0B flat clarinet 11 25 .6 2 4.6 13 30 .2Alto clarinet 2 4.6 1 2.3 3 7.0Bass clarinet 2 4.6 1 2.3 3 7.0Alto saxophone 8 1 8 .6 2 4.6 10 23 .2Tenor saxophone 7 1 6 .3 1 2.3 B 18.6Baritone saxophone 7 1 6 .3 1 2.3 8 18.6French horn 0 .0 0 .0 0 .0Trumpet or cornet 12 27.9 5 11 .6 17 39 .3Trombone 8 18.6 3 7.0 11 25.6Baritone 4 9.3 2 4.6 6 13 .9Bass tuha 4 9.3 1 2.3 5 11.6Percussion 3 7.0 3 7.0 6 13 .9Basson 1 2.3 0 .0 1 2 .3E flat horn 0 .0 3 7.0 3 7.0Piano 9 20.9 4 9.3 13 30.2Violin 2 4.6 2 4.6 4 9 .3None 0 .0 1 2.3 1 2 .3No answer 5 11.6 6 1 3 .9 11 25.6
-10-
-11-
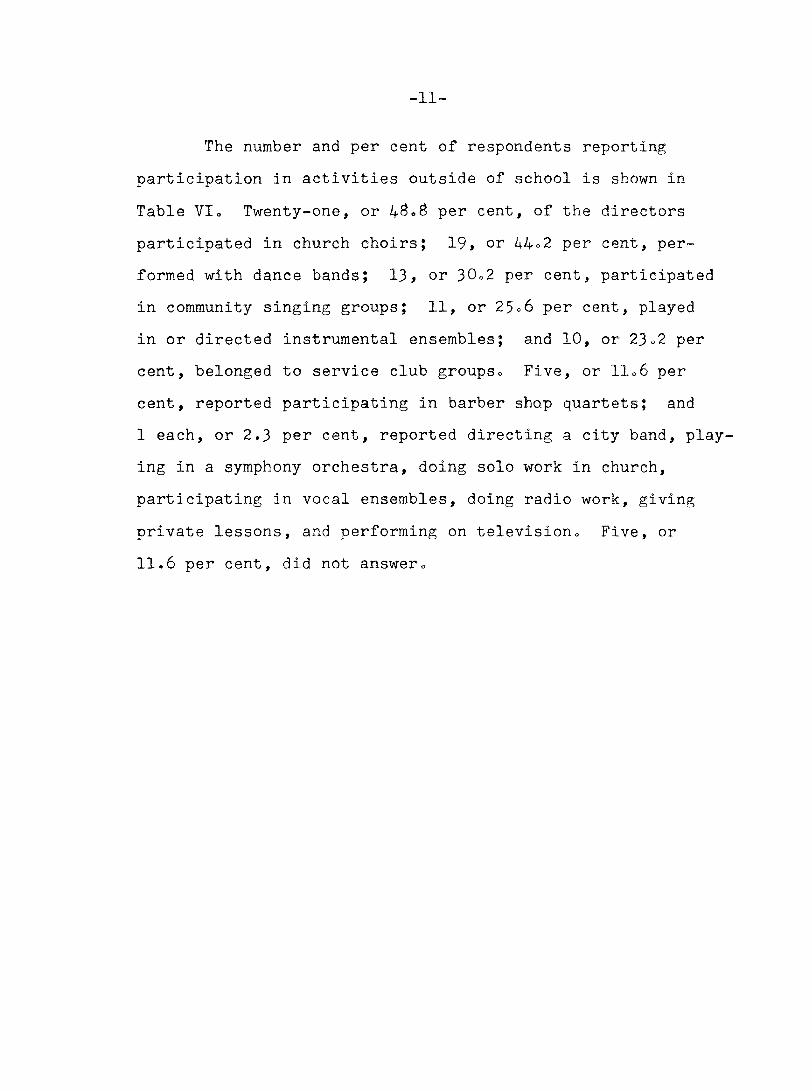
The number and per cent of respondents reporting participation in activities outside of school is shown in
Table VI. Twenty-one, or 48.8 per cent, of the directors participated in church choirs; 19, or 44°2 per cent, performed with dance bands; 13, or 30o2 per cent, participated in community singing groups; 11, or 2506 per cent, played in or directed instrumental ensembles; and 10, or 23°2 per cent, belonged to service club groups» Five, or 11.6 per cent, reported participating in barber shop quartets; and 1 each, or 2.3 per cent, reported directing a city band, playing in a symphony orchestra, doing solo work in church, participating in vocal ensembles, doing radio work, giving private lessons, and performing on television» Five, or11.6 per cent, did not answer»
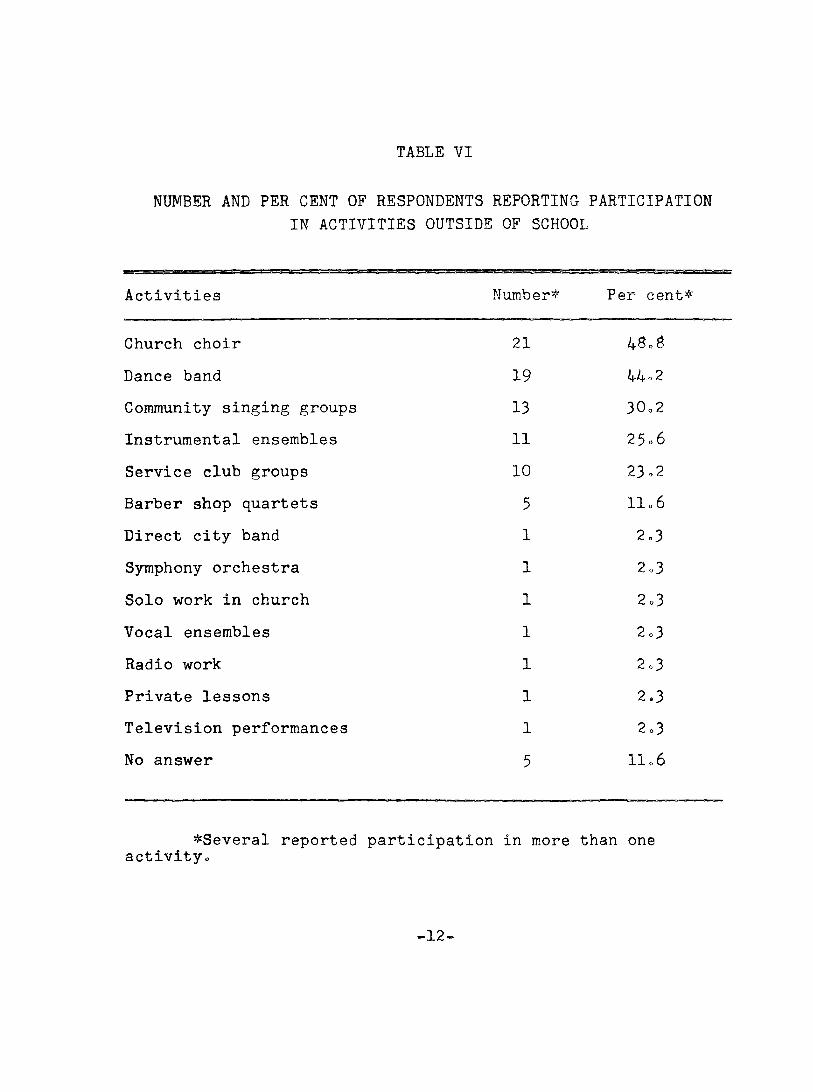
TABLE VI
NUMBER AND PER CENT OF RESPONDENTS REPORTING PARTICIPATION IN ACTIVITIES OUTSIDE OF SCHOOL
Activities Number* Per cent*
Church choir 21 48.8Dance band 19 44.2Community singing groups 13 30.2Instrumental ensembles 11 25.6Service club groups 10 23.2Barber shop quartets 5 11.6Direct city band I 2.3Symphony orchestra 1 2.3Solo work in church 1 2.3Vocal ensembles 1 2.3Radio work 1 2.3Private lessons 1 2.3Television performances 1 2.3No answer 5 11.6
^Several reported participation in more than oneactivity»
.12.
BAND RECRUITING, ORGANIZATIONAL, AND TEACHING METHODSOF THE DIRECTORS
Twelve different recruiting methods were listed on
the questionnaires and directors were asked to rate the extent to which each method was used. The ratings called for were (1) a great deal, (2) some, and (3) none. Table VII show that 15, or 34°9 per cent, used personal interviews with parents a great deal; 25, or 5&.1 per cent, some; and 1, or 2.3 per cent, none. Seventeen, or 39»5 per cent, used special programs and concerts a great deal; 20, or 46.5 per cent, some; and 4, or 9°3 per cent, none. Fourteen, or 32.5 per cent, used instrumental demonstrations for parents a great deal; 16, or 37.2 per cent, some; and 11 or 25°6 per cent, none. Fourteen, or 32.5 per cent, used letters to parents following an aptitude test a great deal; 7, or 16.3 per cent, some; and IS, or 41°S per cent none.
Thirteen, or 30.2 per cent, used a display of instruments by local music companies a great deal; 15, or 34°9 per cent, some; and 10, or 23.2 per cent, none. Nine, or 20.9 per cent, used music aptitude tests a great deal; 12, or 27.9 per cent, some; and IS, or 41.S per cent, none. Nine, or 20.9 per cent, used novelty groups a great deal; 20, or46.5 per cent, some; and 9, or 20.9 per cent, none. Seven, or 16.3 per cent, used films for motivation and demonstration
-13-
-14-a great deal; 11, or 25°6 per cent, some; and 20, or 46=5 per cent, none° Seven, or l6o3 per cent, used special assemblies a great deal; 10, or 23,2 per cent, some; and 21, or 4&°8 per cent, none. Six, or 13.9 per cent used local newspaper advertising a great deal; 19 or 44.2 per cent, some; and 15, or 34°9 per cent, none. Four, or 9.3 per cent, used the film projector for instrument showing a great deal; 12, or 27.9 per cent, some; and 23, or 53°5 per cent, none. Three, or 7 per cent used the tape recorder for demonstrating instruments a great deal; 10, or 23.2 per cent, some; and 27, or 62,7 per cent, none.
The total number and per cent of respondents using the various recruiting devices, ranked by frequency of use, were as follows: 40, or 93.0 per cent, personal interviews withparents; 37, or #6,0 per cent, special programs and concerts; 30, or 69.7 per cent, instrumental demonstrations for parents; 29, or 67.4 per cent, novelty groups for motivation; 2#, or61.5 per cent, display of instruments by local music companies; 25, or 5#.l per cent, local newspaper advertising; 21, or 4#.# per cent, aptitude test; 21, or 4#.# per cent, letters to parents following aptitude tests; 1#, or 41.8 per cent, films for motivation and demonstration; 17, or 39.5 per cent, special assemblies; 16, or 37.2 per cent, film projector for instrumental showing; 13, or 30.2 per cent, tape recorder for demonstrating instruments.
-15-The names of two recruiting devices were written in
with no indication of the extent of their use. Thirteen, or 30.2 per cent, reported demonstrating instruments to classes, and 5, or 11.6 per cent reported interviews and talks with students.
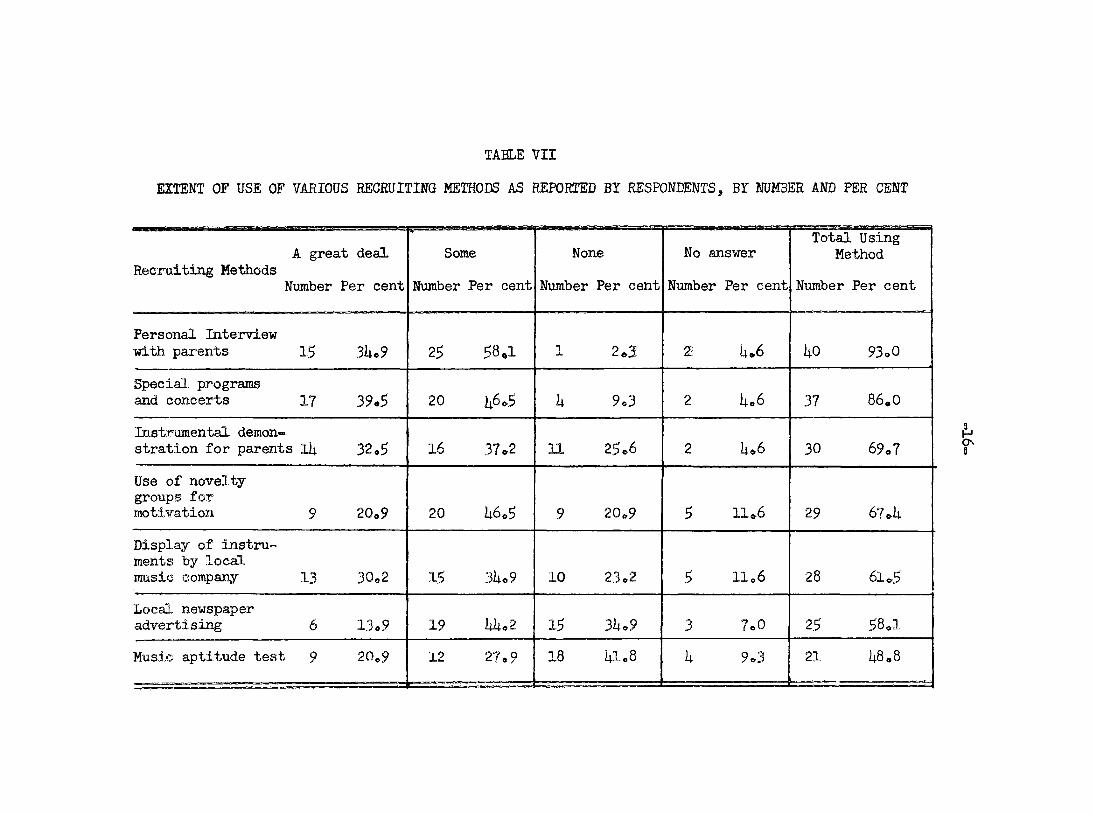
TABLE VIIEXTENT OF USE OF VARIOUS RECRUITING METHODS AS REPORTED BY RESPONDENTS, BY NUMBER AND PER CENT
A great dealRecruiting Methods
Number Per cent
Some
Number Per cent
None
Number Per cent
No answer
Number Per cent
Total Using Method
Number Per cent
Personal Interview with parents IS 3b.9 25 58.1 1 2.3 2' L.6 I4O 93.0Special programs and concerts 17 39.5 20 I16.5 L 9.3 2 L.6 37 86.0Instrumental demonstration for parents II4 32.5 16 37.2 11 25.6 2 L.6 30 69.7Use of novelty groups for motivation 9 20.9 20 I1.6.5 9 20.9 5 11.6 29Display of instruments by local music company 13 30.2 15 3b.9 10 23.2 5 11.6 28 61.5Local newspaper advertising 6 13.9 19 W1.2 15 3k.9 3 7.0 25 58.1Music aptitude test 9 20.9 12 27.9 18 m.8 U 9.3 21 idU8
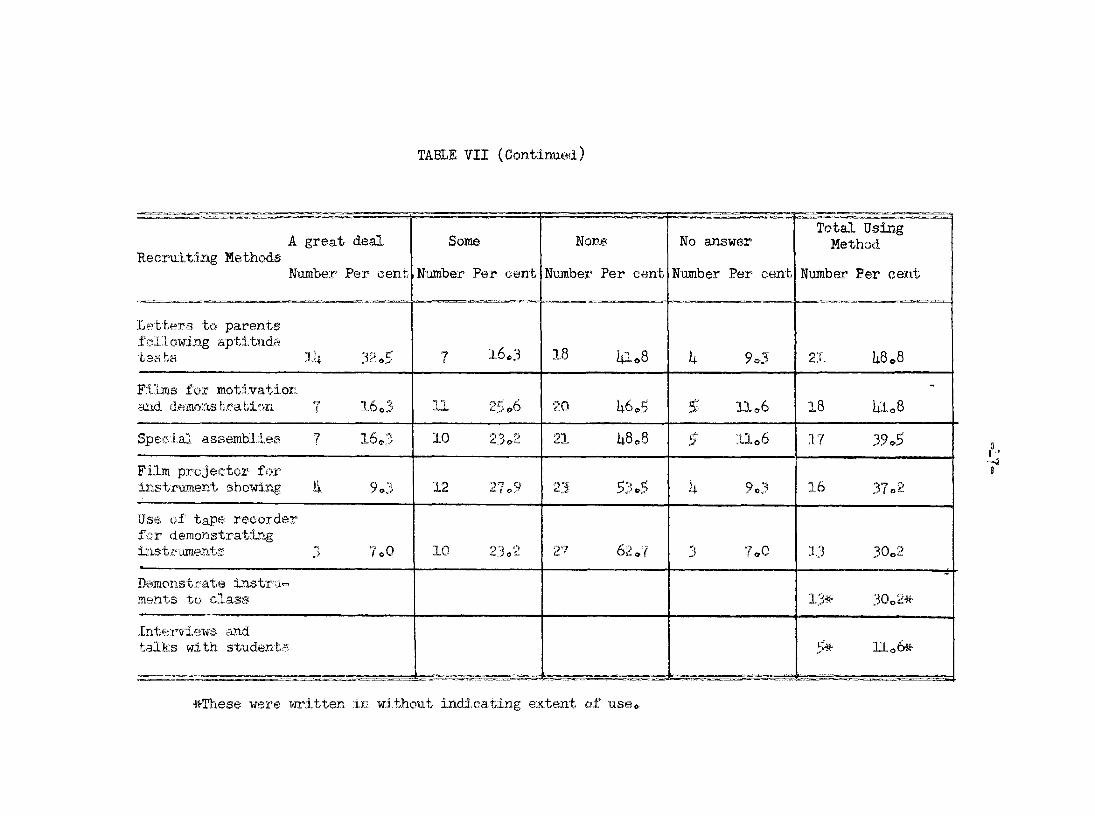
TABLE VII (Continued)
A great dealRecruiting Methods
Number Per centSome
Number Per centNone
Number Per centNo answer Number Per cent
Total Using Method
Number Per cent
Letters to parents following aptitude tests lit 32.^ 7 16.3 18 1*1 #8 1* 9.3 21 1*8.8Films for motivation and demonstration 7 l6o3 11 2$ .6 20 1*6.5 11.6 18 1*1.8Special assemblies 7 16.3 10 23.2 21 1*8.8 11.6 17 39.SFilm projector for instrument showing % 9.3 12 27.9 23 S3.g 1* 9.3 16 37.2Use of tape recorder for demonstrating instruments 3 7.0 10 23.2 27 62.7 3 7.0 13 30.2Demonstrate instru- ments to class 13* 30.2*Interviews and talks with students 5* Ho6#
*These were written in without indicating extent of uae,
-18-The number and per cent of respondents reporting use
various organizational and teaching methods with beginning and training band are shown in Table VIIIo Thirty-three, or76.7 per cent, of the respondents accepted all interested students in band; 6, or 13 «9 per cent, indicated limiting their choice to those students making satisfactory grades on special aptitude tests ; 22, or $1»1 per cent, reportedconferring with classroom teachers for prospective band students; while 4, or 9»3 per cent, took only those with a C average or better. Thirty two, or 74 = 4 per cent, rehearsed the beginning band as a class ; 15, or 34» 9 per cent, dividedthe beginning students in classes of like instruments ; and 11, or 25.6 per cent, required them to meet as sections (brass, reeds, and percussion). Twenty-five, or 5^.1 per cent, required beginning or training band students to play solos during the year. Twenty-two, or 51.1 per cent, indicated that they taught their students in beginning or training band individually; while 18, or 41»8 per cent, had advanced band students teach beginners.
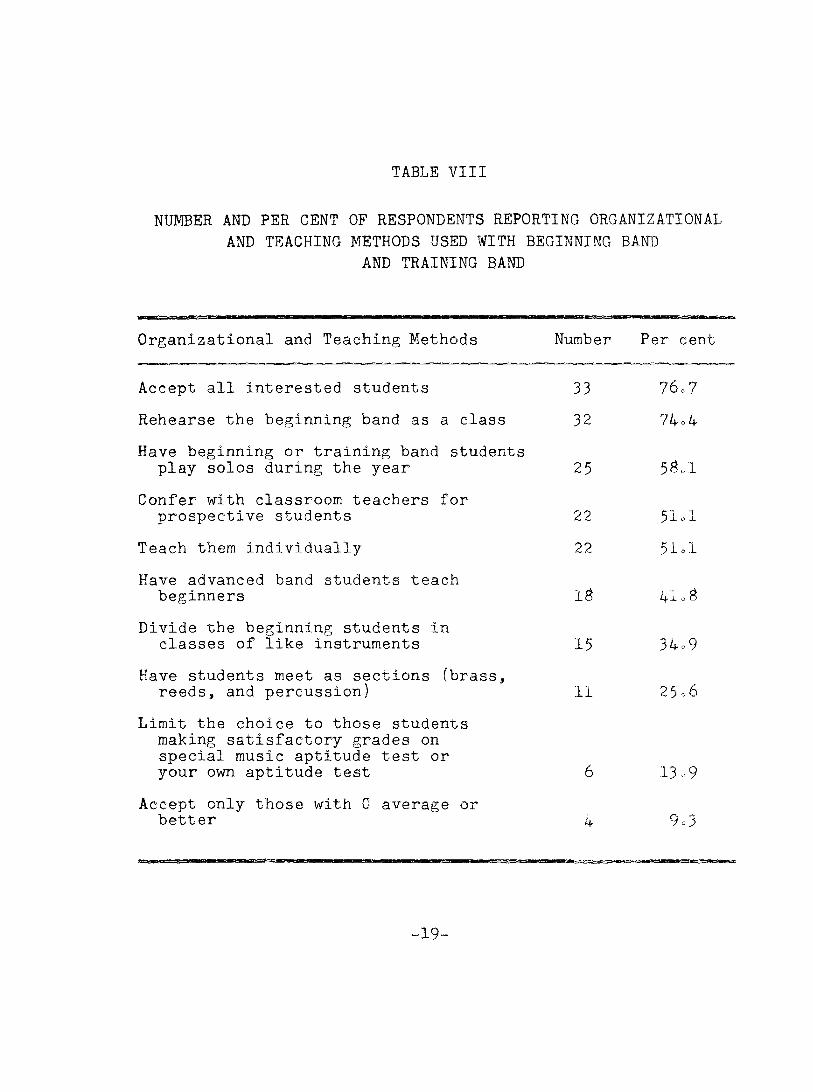
TABLE VIII
NUMBER AND PER CENT OF RESPONDENTS REPORTING ORGANIZATIONAL AND TEACHING METHODS USED WITH BEGINNING BAND
AND TRAINING BAND
Organizational and Teaching Methods Number Per cent
Accept all interested studentsRehearse the beginning band as a classHave beginning or training band students
play solos during the yearConfer with classroom teachers for
prospective studentsTeach them individuallyHave advanced band students teach
beginnersDivide the beginning students in
classes of like instrumentsHave students meet as sections (brass,
reeds, and percussion)Limit the choice to those students
making satisfactory grades on special music aptitude test or your own aptitude test
Accept only those with C average orbetter
3332
25
2222
IB
15
11
4
76.774.4
5B.1
51.151.1
41.B
34.9
25.6
13.9
9.3
,19.
-20-
Table IX shows the number and per cent of respondents indicating use of organizational devices and teaching methods applying to advanced band. Thirty-one, or 72 per cent, reported using their own individual award system;9, or 20o9 per cent, indicated use of a point system; and 2, or 4°6 per cent, used a published award system (i.e., the Prescott Technic S y s t e m ) T w e n t y six, or 60.4 per cent, placed band members according to their ability, without use of the challenge system; 16, or 37°2 per cent, made use of the challenge system for seating band members ; and 6, or 13.9 per cent, placed the older members in first chairs. Twenty three, or 53 <>5 per cent, had an active corps of majorettes ; and 3 # or 7 per cent, had an active corps of flag twirlera. Twenty six, or 60.4 per cent, of the directors indicated that they taught instrumental students privately. Twenty four, or 55»S per cent, indicated that they used regularly elected band officers; 19, or 44°2 per cent, reported that band officers took part in making plans for the organization of the band; and 14, or 32.5 per cent of the respondents, indicated that they had student directors.
^Gerald R. Prescott and Lawrence W. Chidester,Results With School Bands (New York: Carl Fischer, Inc., and Minneapolis: Paul A. Schmitt Music Co., 1938), p. 47.
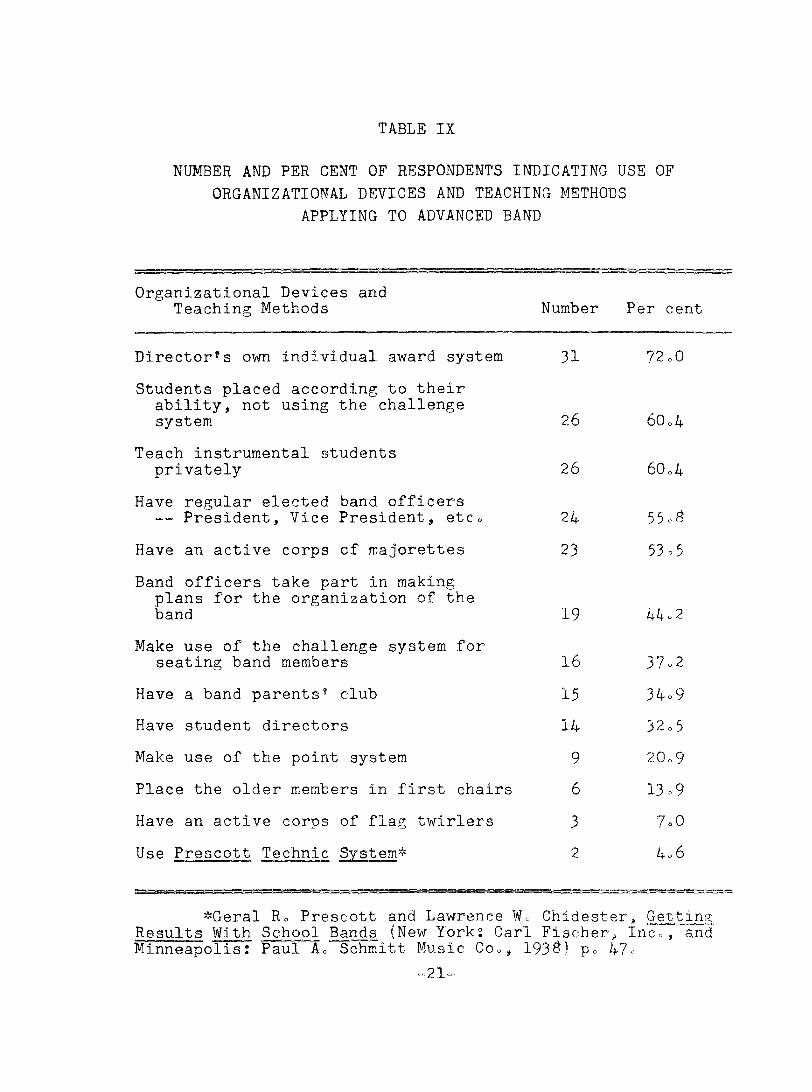
TABLE IX
NUMBER AND PER CENT OF RESPONDENTS INDICATING USE OF ORGANIZATIONAL DEVICES AND TEACHING METHODS
APPLYING TO ADVANCED BAND
Organizational Devices and Teaching Methods Number Per cent
Director*s own individual award systemStudents placed according to their
ability, not using the challenge system
Teach instrumental students privately
Have regular elected band officers -- President, Vice President, etc.
Have an active corps of majorettesBand officers take part in making
plans for the organization of the
31
26
26
2423
72.0
60.4
60.4
53.5
band 19 44.2Make use of the challenge system
seating band membersfor
16 37.2Have a band parents’ club 15 34.9Have student directors 14 32.5Make use of the point system 9 20.9Place the older members in first chairs 6 13.9Have an active corps of flag twirlers 3 7.0Use Prescott Technic System* 2 4.6
*Geral R. Prescott and Lawrence W. Chidester, Getting Results With School Bands (New York: Carl Fischer, Inc., and Minneapolis: Paul A. Schmitt Music Co., 193^) p. 47.
-21-
BAND HOUSING FACILITIES AND SCHOOL-OWNED INSTRUMENTS AND THEIR USAGE
Table X shows the number and per cent of answers by respondents to questions about the music department''s space and facilities. Twenty-six, or 60.4 per cent, of the directors reported having a room used exclusively for music, while 16, or 37=2 per cent, indicated they did not have a room used exclusively for music, and 1, or 2.3 per cent did not answer. Twenty-two, or 51.1 per cent, of the respondents used the school gymnasium or auditorium for rehearsal purposes, while 15, or 34°9 per cent, did not; and 6, or 13.9 per cent, did not answer. Fifteen, or 34.9 per cent, of the directors reported having adequate storage racks for instruments; 27, or 62.7 per cent, did not; and 1, or 2.3 per cent, did not answer. Sixteen, or 37.2 per cent, of the directors considered their housing for band adequate; 26, or 60.4 per cent, considered it inadequate; and 1, or 2.3 per cent, did not answer.
-22-
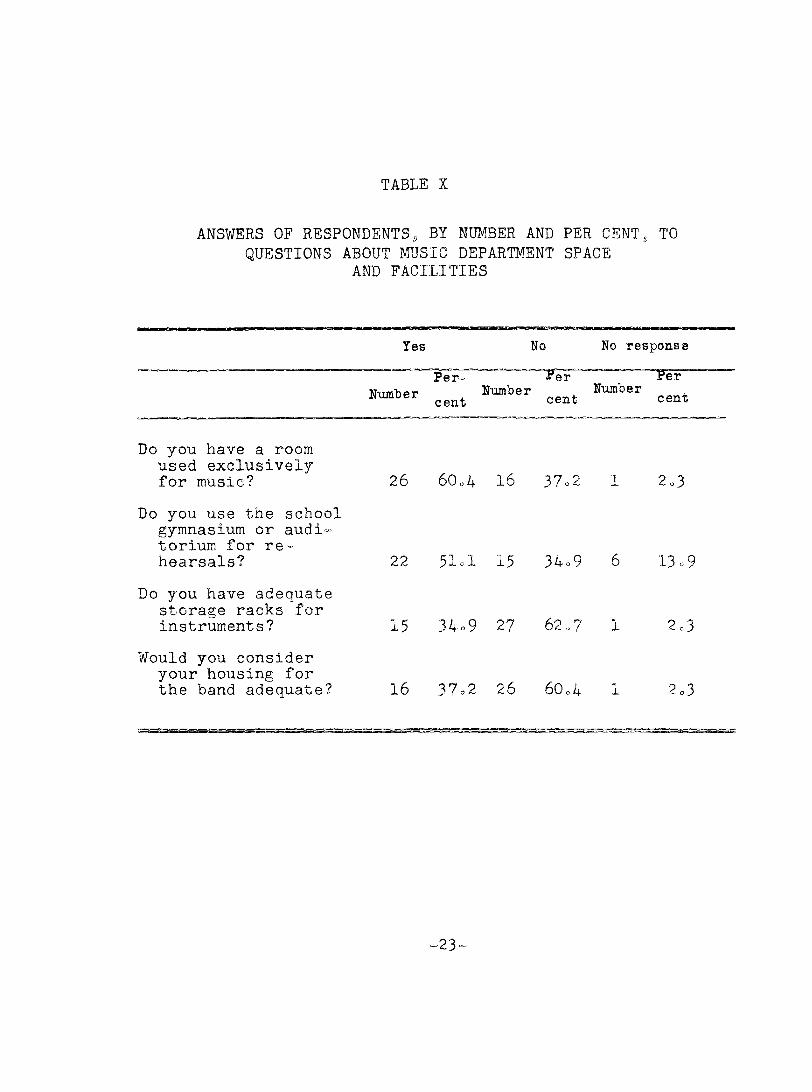
TABLE X
ANSWERS OF RESPONDENTS, BY NUMBER AND PER CENT, TO QUESTIONS ABOUT MUSIC DEPARTMENT SPACE
AND FACILITIES
Yes NoPer-
Numter Number
No response
Number cent
Do you have a roomused exclusively for music?
Do you use the schoolgymnasium or auditorium for rehearsals?
Do you have adequate storage racks for instruments?
Would you consider your housing for the band adequate?
26 60u4 16 37.2 1 2.3
22 51.1 15 34.9 6 13.9
15 34.9 27 62.7 1 2.3
16 37.2 26 60.4 1 2.3
.23'
The results of the survey on the number of schools owning band instruments, and the mean number of instruments owned and used by schools reporting ownership, are shown in Table XIo Twenty-three schools owned clarinets ; 24schools owned cornets or trumpets; and 42 schools owned snare drums. The mean numbers of these instruments owned were clarinets, 5.2; cornets or trumpets, 2o5; and snare drums, 3 «7.
Thirty-eight schools reported owning alto horns;29 schools, trombones; and 40 schools, baritone horns. The mean numbers of these instruments owned were as follows:
alto horns, 2.9; trombones, 2.3 ; and baritones, 2.1. Thirty-one schools indicated owning sousaphones; 20 schools, French horns; 18 schools, flutes; 40 schools, bass drums;25 schools, tubas, 32 schools, record players; 12 schools, alto saxophones; 4 schools, E^ clarinets; 40 schools, cymbals (sets); 17 schools, tenor saxophones; 11 schools, bass clarinet ; and 10 schools, piccolos. The mean number of these instruments owned were as follows: sousaphones, 1.9;French horns, 1.8; flutes, 1.5; bass drums, 1.4; tubas,2.8; record player, 1.3; alto saxophones, 1,3; clarinets,1.2; cymbals, 1.2; tenor saxophones, 1.1; bass clarinets, 1.1; and piccolos, 1.1.
Eight schools reported owning oboes; 3 schools, alto clarinets; 1 school, bassoon; 20 schools, baritone saxophones; 10 schools, timpani; 24 schools, bells; 26 schools.
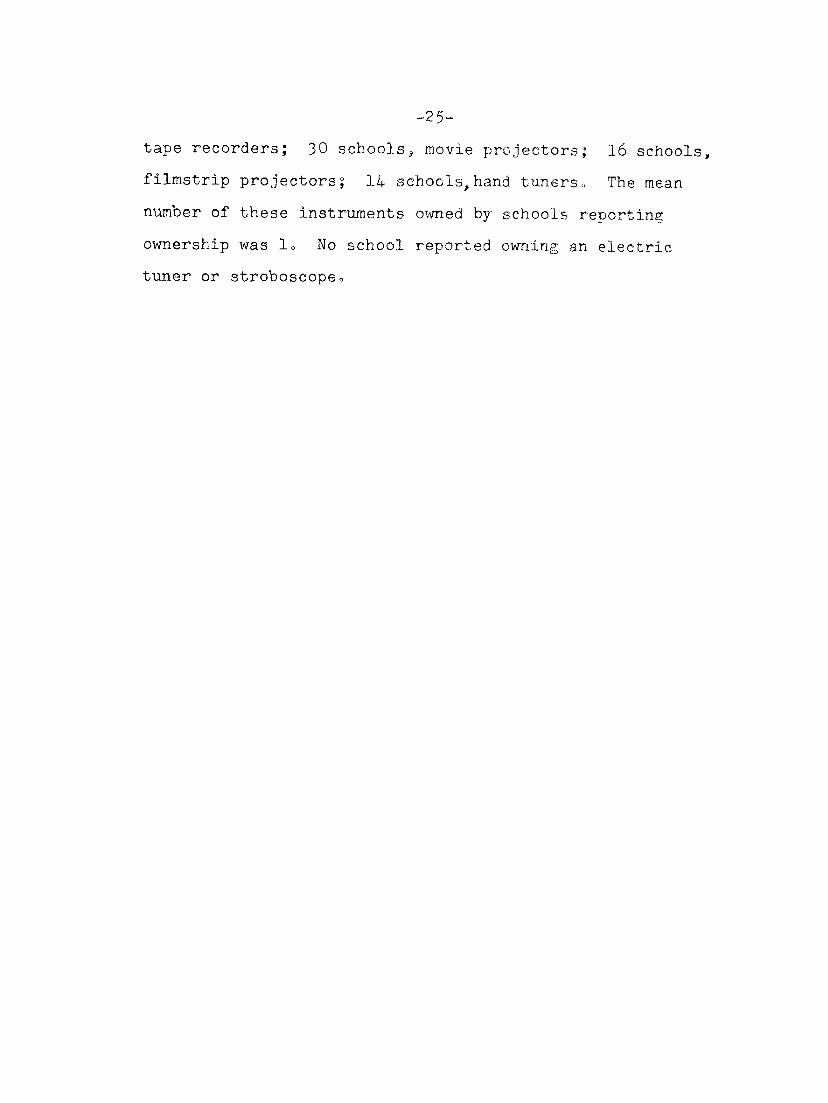
-25-tape recorders; 30 schools^ movie projectors; 16 schools filmstrip projectors; 14 schools,hand tuners. The mean number of these instruments owned by schools reporting ownership was 1. No school reported owning an electric tuner or stroboscope.
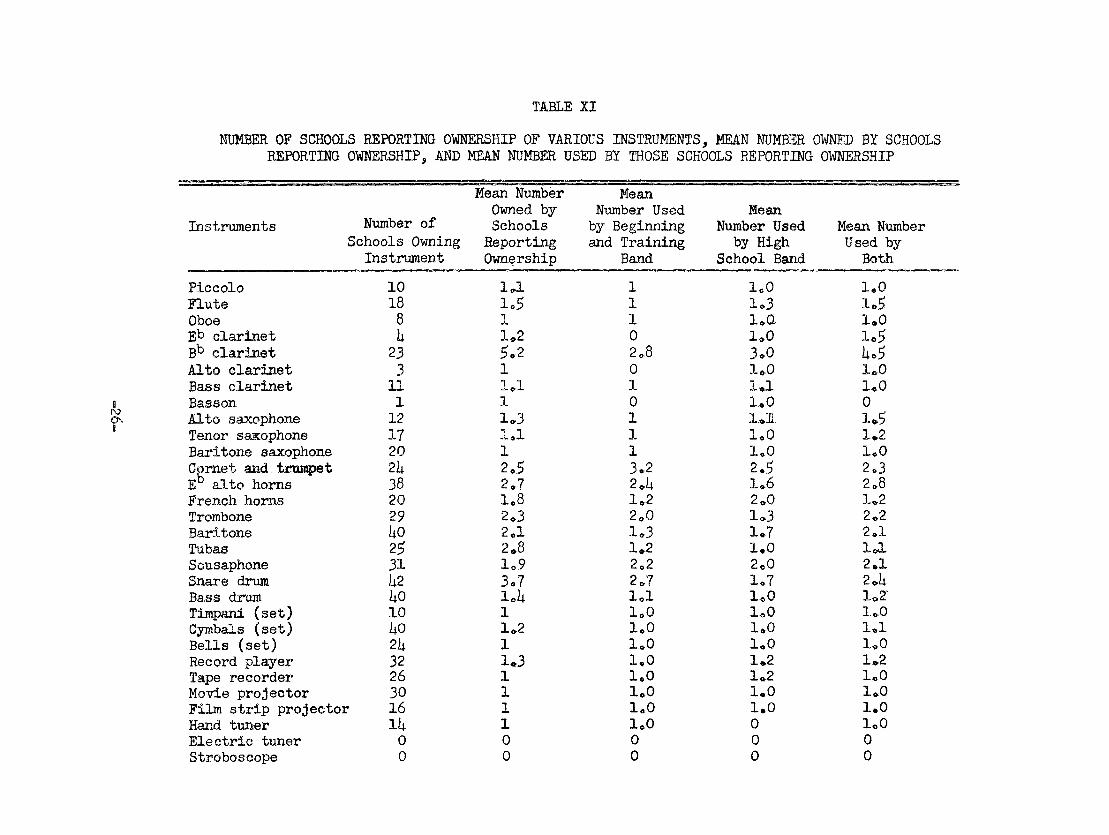
TABLE XINUMBER OF SCHOOLS REPORTING OWNERSHIP OF VARIOUS INSTRUMENTS, MEAN NUMBER OWNED BY SCHOOLS
REPORTING OWNERSHIP, AND MEAN NUMBER USED BY THOSE SCHOOLS REPORTING OWNERSHIP
Instruments Number of Schools Owning
Instrument
Mean Number Owned by Schools Reporting Ownership
Mean Number Used by Beginning and Training
Band
Mean Number Used
by High School Band
Mean Number Used by
Both
ror
Piccolo 10 IJ. 1 1.0 1.0Flute 18 l.s 1 1.3 1.5Oboe 8 1 1 l.GL 1 .0Eb clarinet h 1.2 0 1.0 1.5
clarinet 23 ^.2 2.8 3.0 14.5Alto clarinet 3 1 0 1.0 1 .0Bass clarinet 11 l a 1 1.1 1 .0Basson 1 1 0 1.0 0Alto saxophone 12 1.3 1 1.1- 1.5Tenor saxophone 17 1.1 1 1.0 1 .2Baritone saxophone 20 1 1 1.0 1 .0Comet and truaçjet 2)4 2.5 3.2 2.5 2 .3E^ alto horns 38 2.7 2 .1). 1.6 2 .8French horns 20 1.8 1.2 2.0 1 .2Trombone 29 2.3 2.0 1.3 2 .2Baritone ho 2.1 1.3 1.7 2 .1Tubas 2^ 2.8 1.2 1.0 1 .1Sousaphone 31 1.9 2.2 2.0 2 .1Snare drum 1:2 3.7 2.7 1.7 2.14Bass drum 1:0 IJ4 1.1 1.0 1.2Timpani (set) 10 1 1.0 1.0 1.0Cymbals (set) iiO 1.2 1.0 1.0 1.1Bells (set) 2k 1 1.0 1.0 1.0Record player 32 1.3 1.0 1.2 1.2Tape recorder 26 1 1.0 1*2 1.0Movie projector 30 1 1.0 1.0 1.^Film strip projector 16 1 1.0 1.0 1.0Hand tuner lli 1 1.0 0 1.0Electric tuner 0 0 0 0 0Stroboscope 0 0 0 0 0
FILMS AND FILM SLIDES USED AS TEACHING MATERIAL FOR BANDS
The use of films and film-slides as teaching materials by the director of bands is shown in Table XII and Table XIII on pages 2S and 29» Twenty, or 46»5 per cent of the directors used no educational films for intermediate band, and 1Ô, or 41 »^ per cent, of the directors did not use educational films as teaching material for the beginning or
advanced band » Sixteen, or 37.2 per cent, of the respondents indicated using from 1 to 6 educational films per year for the beginning, intermediate, and advanced bands. Nine, or 20.9 per cent, did not answer.
Twenty-four, or 55.S per cent, of the respondents did not use film slides or filmstrips as teaching materials for the beginning, intermediate, or advanced band. Ten, or 23.1 per cent, of the directors indicated using from 1 to 6 film slides, or filmstrips per year, as teaching material for the beginning, intermediate, and advanced bands. Nine, or 20.9 per cent, did not answer.
-27-
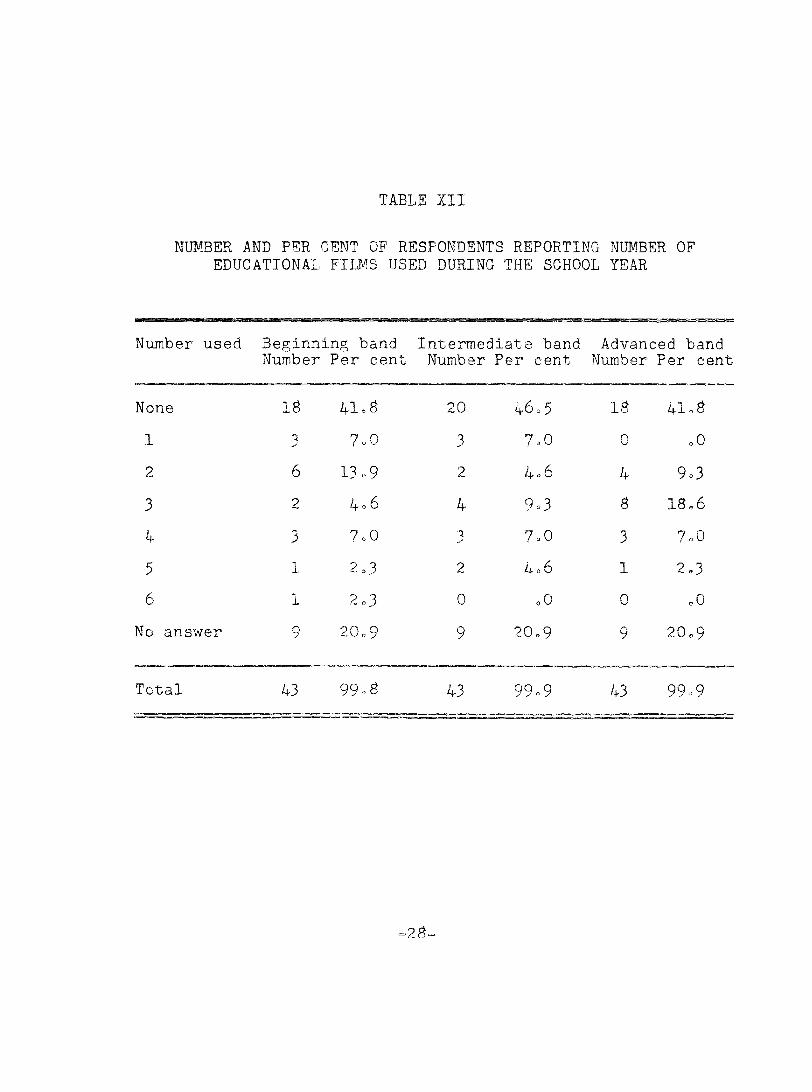
TABLE III
NUMBER AND PER CENT OF RESPONDENTS REPORTING NUMBER OF EDUCATIONAL FILMS USED DURING THE SCHOOL TEAR
Number used Beginning band Intermediate band Advanced bandNumber Per cent Number Per cent Number Per cent
None IS 41.S 20 46.5 IS 41.s1 3 7.0 3 7.0 0 .02 6 13.9 2 4.6 4 9.33 2 4.6 4 9.3 S IS.6k 3 7.0 7.0 3 7.05 1 2.3 2 4.6 1 2.36 1 2.3 0 .0 0 .0
No answer 9 20.9 9 20.9 9 20.9
Total 43 99.8 43 99.9 43 99.9
-2 S.
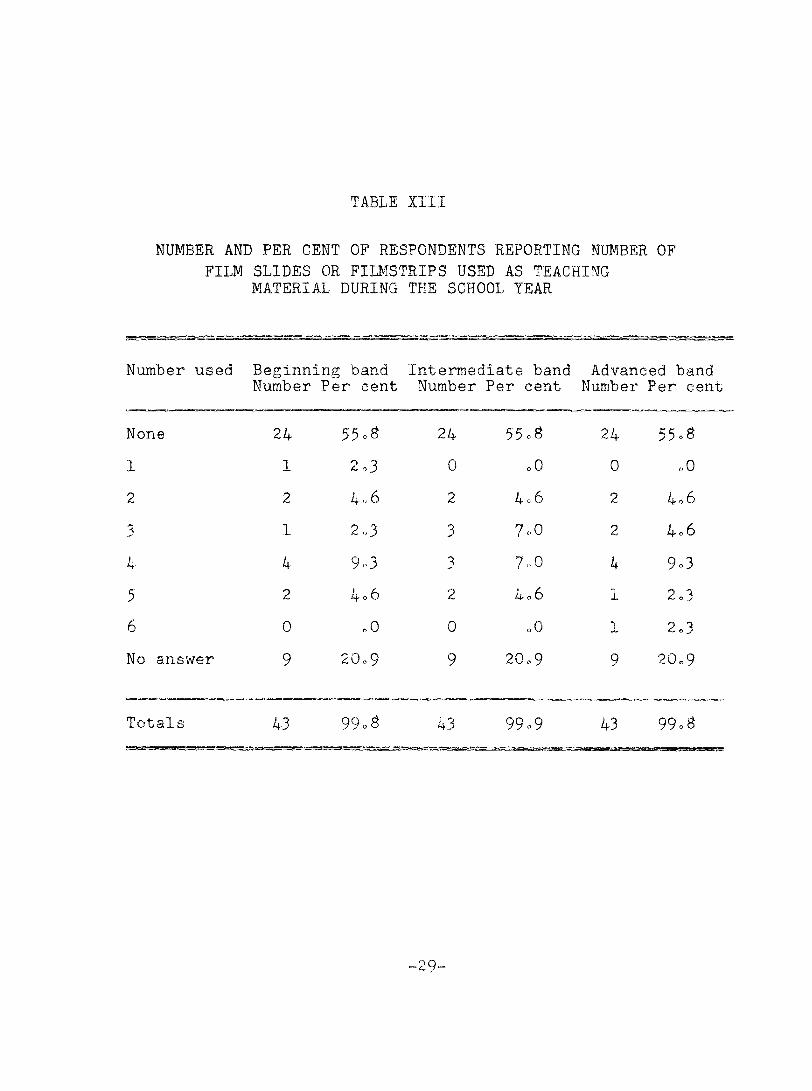
TABLE IIII
NUMBER AND PER CENT OF RESPONDENTS REPORTING NUMBER OFFILM SLIDES OR FILMSTRIPS USED AS TEACHING
MATERIAL DURING THE SCHOOL YEAR
Number used Beginning band Intermediate band Advanced bandNumber Per cent Number Per cent Number Per cen
None 24 55.8 24 55.8 24 55.81 1 2o3 0 .0 0 .02 2 4.6 2 4.6 2 4.63 1 2.3 3 7.0 2 4.64. 4 9.3 3 7.0 4 9.35 2 4.6 2 4.6 1 2.36 0 o 0 0 .0 1 2.3No answer 9 20.9 9 20.9 9 20.9
Totals 43 99.8 43 99.9 43 99.8
-29-
NUMBER AND PER CENT OF BANDS EQUIPPED WITH UNIFORMS AND THE AGE OF THE UNIFORMS
The number and per cent of banda equipped with uniforms are shown in Table XIV. Thirty-five, or Sl.3 per cent, of the respondents reported having uniforms for advanced bands, and S, or IS.6 per cent, reported having no uniforms. Six, or 13.9 per cent, of the respondents reported having uniforms for the intermediate band, and 37, or S6.0 per cent, did not have uniforms for the intermediate band. Two, or 4"6 per cent, of the directors reported having uniforms for the beginning band, and 41, or 95.3 per cent, did not have uniforms.
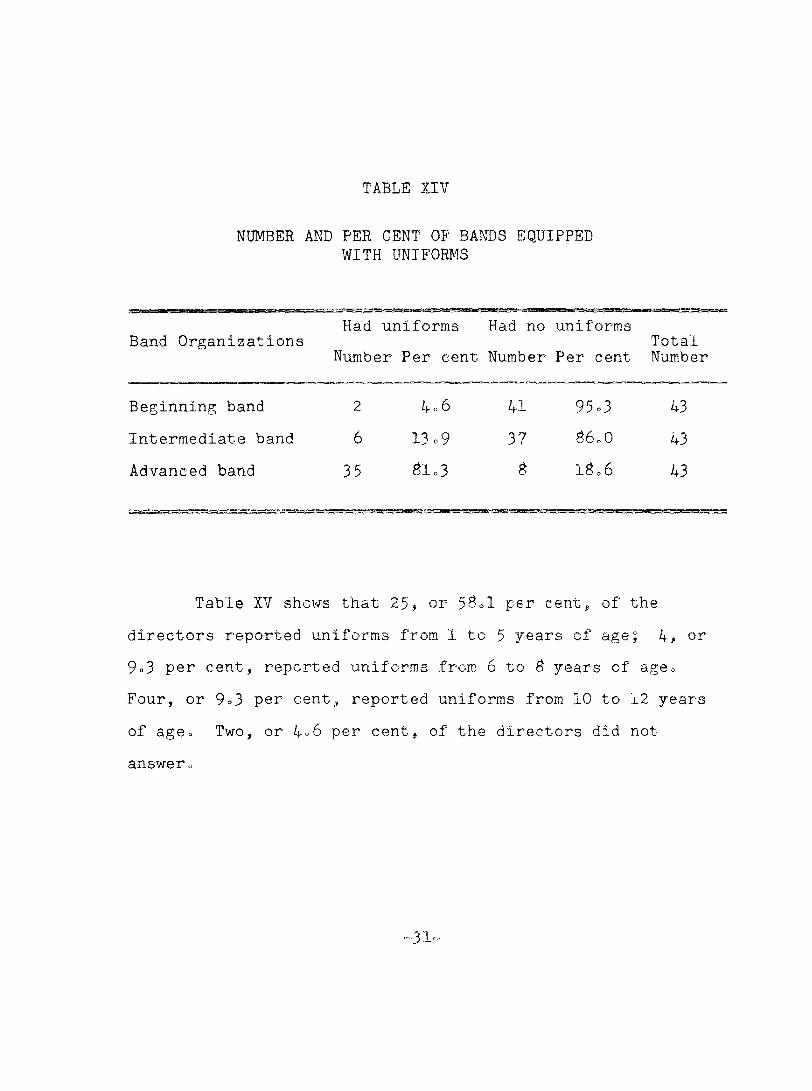
TABLE XIV
NUMBER AND PER CENT OF BANDS EQUIPPED WITH UNIFORMS
Band OrganizationsHadNumb
uniforms Had no er Per cent Number
uniforms Per cent
TotalNumber
Beginning band 2 4.6 41 95.3 43Intermediate band 6 13.9 37 S6.0 43Advanced band 35 Si.3 S IS.6 43
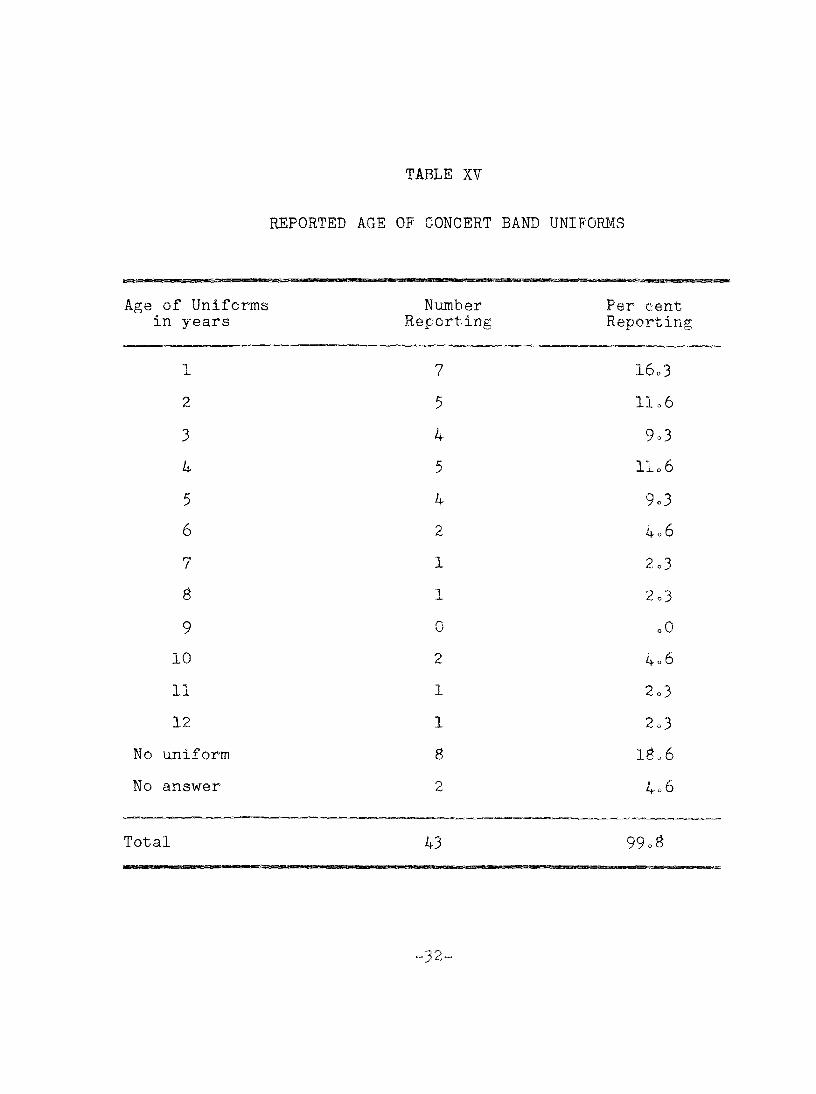
Table XV shows that 25, or 58=1 per cent, of the directors reported uniforms from 1 to 5 years of age; 4, or 9o3 per cent, reported uniforms from 6 to S years of ageo Four, or 9=3 per cent, reported uniforms from 10 to 12 years of age. Two, or per cent, of the directors did not answero
3̂1'
REPORTED
TABLE IV
AGE OF CONCERT BAND UNIFORMS
Age of Uniforms Number Per centin years Reporting Reporting
1 7 16.32 5 11.63 4 9.34 5 11.65 4 9.36 2 4.67 1 2.3g 1 2.39 0 .0
10 2 4.611 1 2.312 1 2.3
No uniform 8 18.6No answer 2 4.6
Total 43 99.^
—3
BAND INSTRUMENTAL METHODS AND REHEARSAL SCHEDULES DURING AND OUTSIDE OF SCHOOL HOURS
The number and per cent of music directors reporting use of various instrumental methods^ as shown in Tables XVI, XVII, and XVIII indicated the use of many different method books for beginning, intermediate, and advanced bando
Table XVI shows the number and per cent of respondents reporting use of various instrumental methods in the beginning bando Eighteen, or 41°^ per cent, reported using Easy Steps to The Band; S, or lSo6 per cent, the Belwin Elementaiir Method; 4, or 9o3 per cent, the Smith Yoder Bachman Method;3, or 7"0 per cent, the Rubank Elementary Method; 3, or 7oO per cent, the Robins Beginners Method; 2, or 4"6 per cent, the Prep Band Method; 2, or 4o6 per cent, Belwin Band Builders : 2, or 4°6 per cent, Boosey-Hawkes Beginning Band:and 2, or 4=6 per cent, the Haskell Harr Drum Method; 1, or 2o3 per cent, each reported Birchard Beginning Series, Fillmore Short Cut Method, Haryey=Edwards Method, the Step-By-Step- Method, Starti^ The Band, and the Tune a Day Method. Two, or 4»6 per cent, reported none, and 1, or 2.3 per cent, did not answer.
-33-
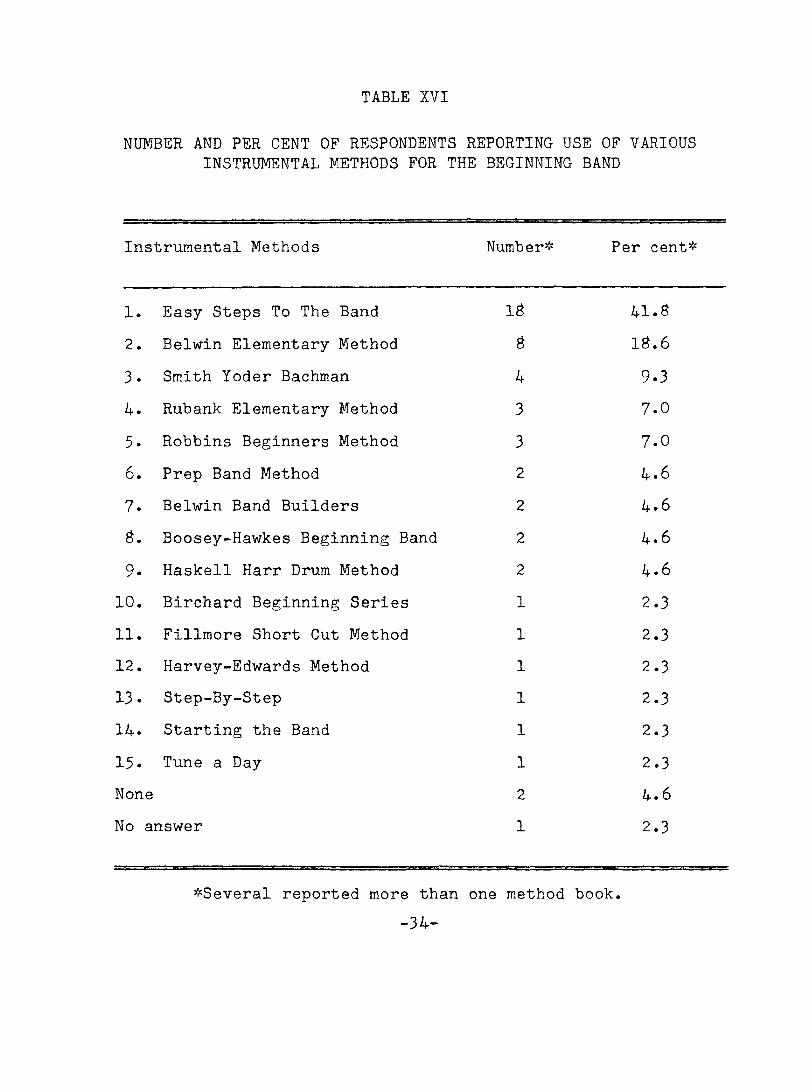
TABLE XVI
NUMBER AND PER CENT OF RESPONDENTS REPORTING USE OF VARIOUS INSTRUMENTAL METHODS FOR THE BEGINNING BAND
Instrumental Methods Number* Per cent*
1. Easy Steps To The Band IS 41.S2. Belwin Elementary Method s IS.63. Smith Yoder Bachman 4 9.34. Rubank Elementary Method 3 7.05. Robbins Beginners Method 3 7.06. Prep Band Method 2 4.67. Belwin Band Builders 2 4.6S. Boosey-Hawkes Beginning Band 2 4.69. Haskell Harr Drum Method 2 4.6
10. Birchard Beginning Series 1 2.311. Fillmore Short Cut Method 1 2.312. Harvey-Edwards Method 1 2.313. Step-By-Step 1 2.314 • Starting the Band 1 2.315. Tune a Day 1 2.3None 2 4.6No answer 1 2.3
^Several reported more than-3 4-
one method book.
“3 5“
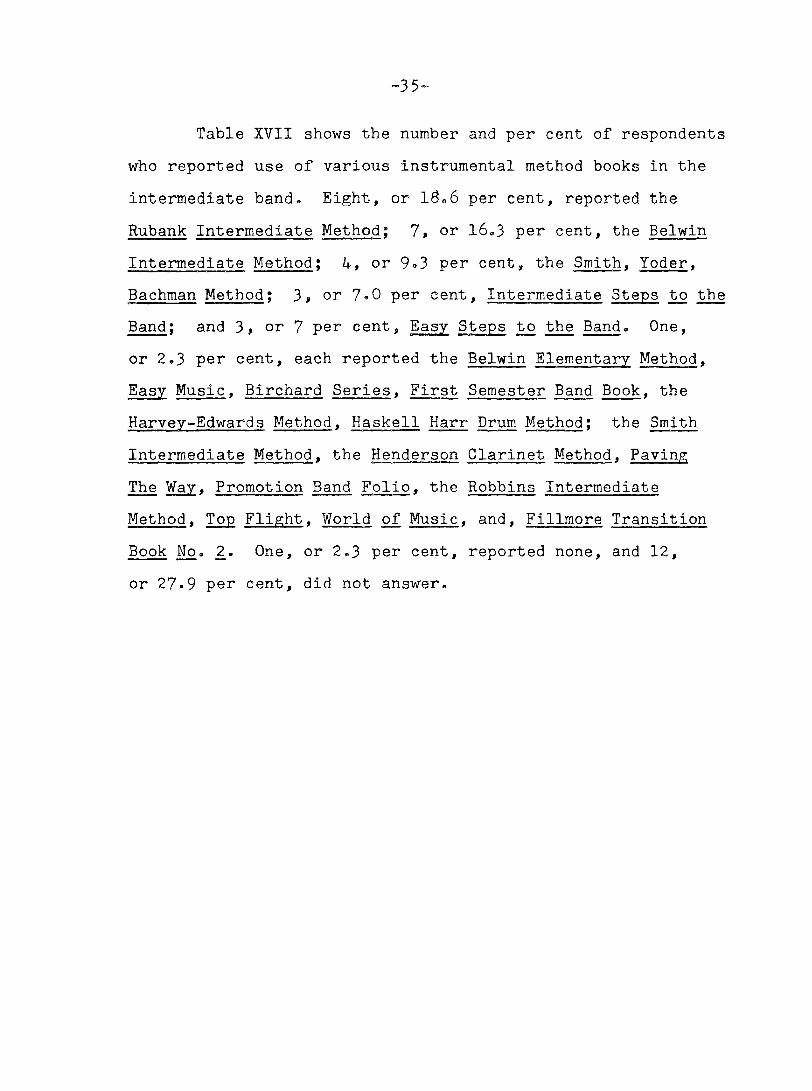
Table XVII shows the number and per cent of respondents who reported use of various instrumental method books in the intermediate band. Eight, or 18.6 per cent, reported the Rubank Intermediate Method ; 7, or 16.3 per cent, the BelwinIntermediate Method ; 4, or 9.3 per cent, the Smith. Yoder.Bachman Method ; 3 , or 7.0 per cent. Intermediate Steps to theBand; and 3 » or 7 per cent. Easy Steps to the Band. One, or 2.3 per cent, each reported the Belwin Elementary Method. Easy Music, Birchard Series, First Semester Band Book, the Harvey-Edwards Method. Haskell Harr Drum Method ; the Smith Intermediate Method. the Henderson Clarinet Method. Paving The Way, Promotion Band Folio. the Robbins Intermediate Method. Top Flight. World of Music, and, Fillmore Transition Book No. 2. One, or 2,3 per cent, reported none, and 12, or 27*9 per cent, did not answer.
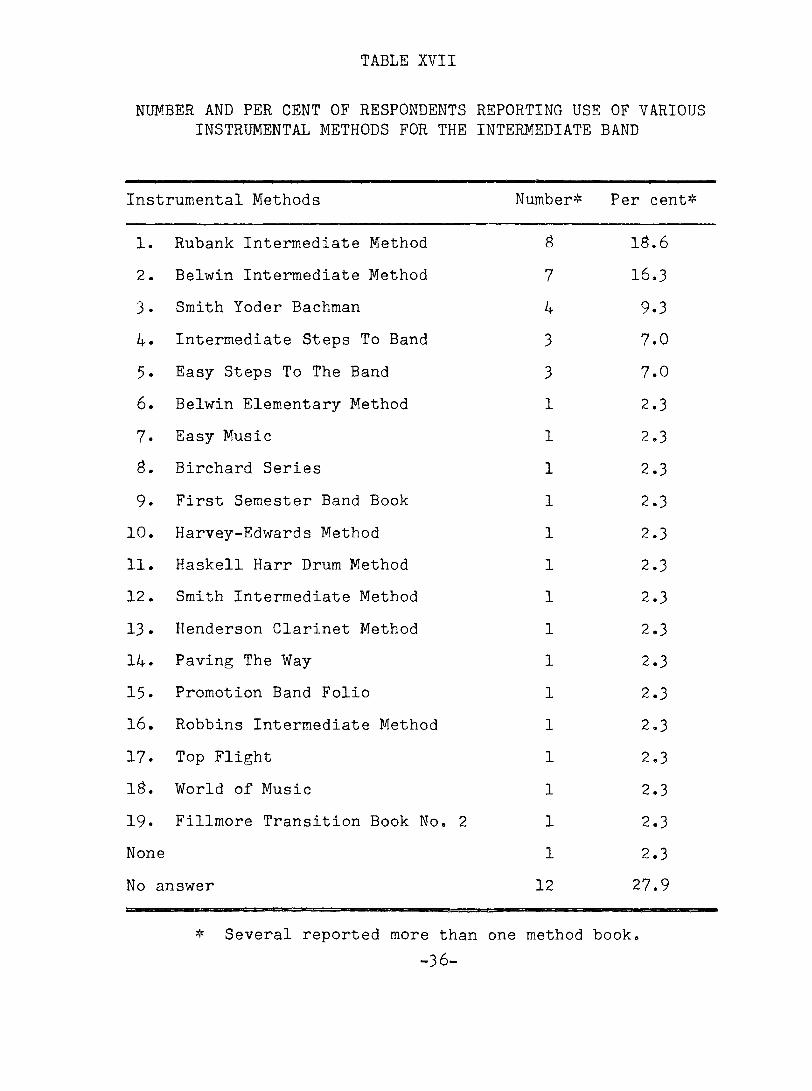
TABLE XVII
NUMBER AND PER CENT OF RESPONDENTS REPORTING USE OF VARIOUSINSTRUMENTAL METHODS FOR THE INTERMEDIATE BAND
Instrumental Methods Number* Per cent*
I. Rubank Intermediate Method S IS.62. Belwin Intermediate Method 7 16.33. Smith Yoder Bachman 4 9.34. Intermediate Steps To Band 3 7.05. Easy Steps To The Band 3 7.06. Belwin Elementary Method I 2.37. Easy Music I 2.3Ô. Birchard Series I 2.39. First Semester Band Book I 2.3
10. Harvey-Edwards Method I 2.3II. Haskell Harr Drum Method 1 2.312. Smith Intermediate Method I 2.313. Henderson Clarinet Method I 2.314. Paving The Way I 2.315. Promotion Band Folio I 2.316. Robbins Intermediate Method I 2.317. Top Flight I 2.3IS. World of Music I 2.319. Fillmore Transition Book No. 2 I 2.3None I 2.3No answer 12 27.9
* Several reported more than—3 6—
one method book.
-37-
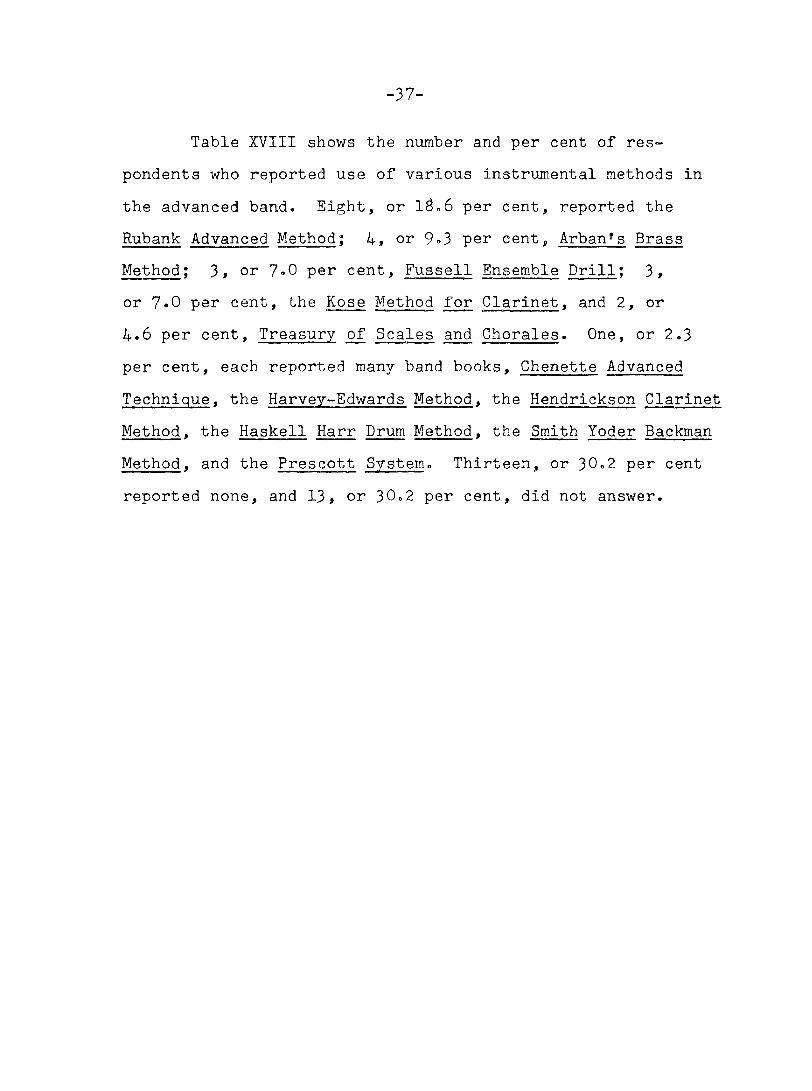
Table XVIII shows the number and per cent of respondents who reported use of various instrumental methods in the advanced band. Eight, or 1^.6 per cent, reported the Rubank Advanced Method ; 4, or 9.3 per cent, Arban* s BrassMethod ; 3, or 7.0 per cent, Fussell Ensemble Drill; 3,or 7.0 per cent, the Rose Method for Clarinet, and 2, or4.6 per cent. Treasury of Scales and Chorales. One, or 2.3 per cent, each reported many band books, Chenette Advanced
Technique. the Harvey-Edwards Method, the Hendrickson Clarinet Method. the Haskell Harr Drum Method. the Smith Yoder Backman Method. and the Prescott System. Thirteen, or 30.2 per cent reported none, and 13, or 30.2 per cent, did not answer.
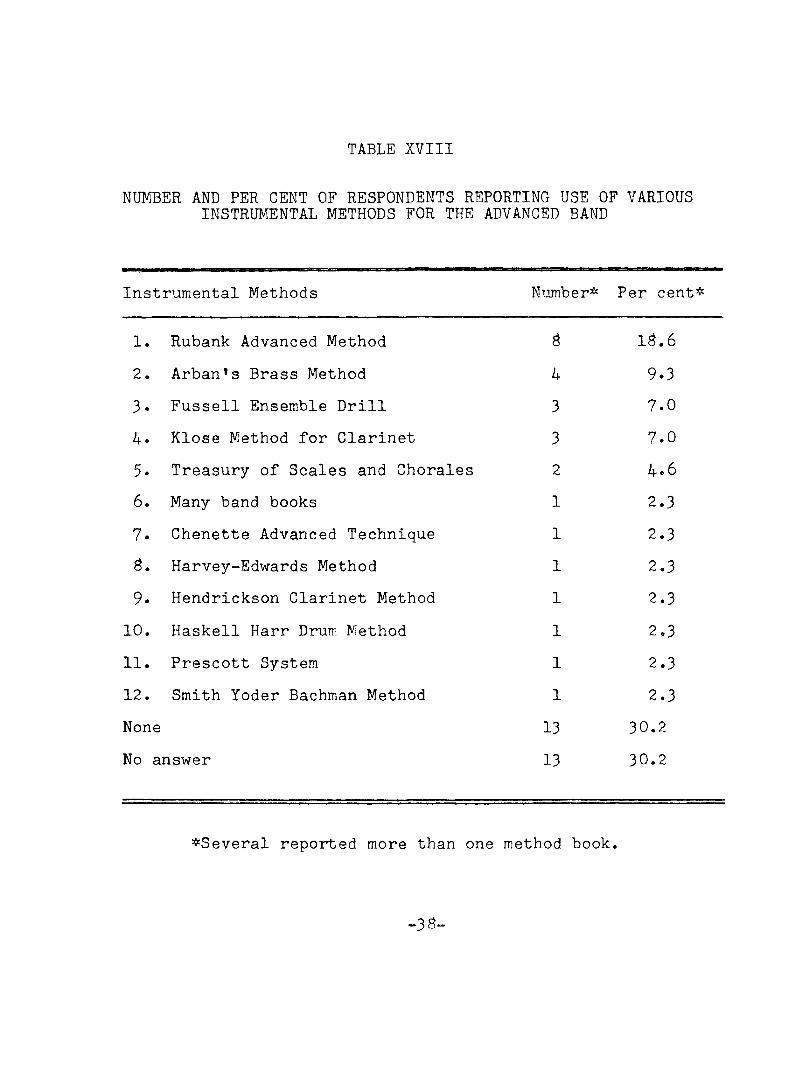
TABLE XVIII
NUMBER AND PER CENT OF RESPONDENTS REPORTING USE OF VARIOUS INSTRUMENTAL METHODS FOR THE ADVANCED BAND
Instrumental Methods Number* Per cent*
1. Rubank Advanced Method é 1^.62. Arban* s Brass Method 4 9.33. Fussell Ensemble Drill 3 7.04. Klose Method for Clarinet 3 7.05. Treasury of Scales and Chorales 2 4.66. Many band books 1 2.37. Chenette Advanced Technique 1 2.3S. Harvey-Edwards Method 1 2.39. Hendrickson Clarinet Method 1 2.3
10. Haskell Harr Drum Method 1 2.311. Prescott System 1 2.312. Smith Yoder Bachman Method 1 2.3None 13 30.2No answer 13 30.2
^Several reported more than one method book
-3 S.
“39-
Table XIX shows the maximum, minimum, and mean number of rehearsals and minutes of rehearsal time during and outside of school hours. Thirty-five, or 81.3 per cent, of the directors reported having rehearsals for beginning band during school hours ; 23, or 53*5 per cent, indicated havingrehearsals for intermediate band during school hours ; and 36, or 83.7 per cent, indicated having rehearsals for advanced band during school hours. The maximum number of
rehearsals reported was 4 for beginning bands, 4 for intermediate bands, and 5 for advanced bands. The minimum number of rehearsals reported was one for each of the bands. The mean number of rehearsals per week for the beginning band was 2.5; for the intermediate band, 2.5; and for the advanced band, 3»
For all beginning bands reporting, the maximum, minimum, and mean number of minutes per rehearsal during school hours were 60, 25, and 42.5 minutes respectively.
For all intermediate bands, the maximum, minimum, and mean number of minutes per rehearsal during school hours were 60, 20, and 40 minutes respectively.
For all advanced bands, the maximum, minimum, and mean number of minutes per rehearsal during school hours
were 60, 30, and 45 minutes respectively.
-40-Ten, or 23.2 per cent, of the beginning bands; Ô, or
18.6 per cent of the intermediate bands; and 15, or 34»9 per cent, of the advanced bands, were reported to have rehearsals outside of school hours.
For all beginning and intermediate bands reported, the maximum, minimum, and mean number of rehearsals per week
outside of school hours were 3> 1, and 2 rehearsals, respectively.
For all advanced bands reported, the maximum, minimum, and mean number of rehearsals per week outside of school
hours were 5» 1, and 3 rehearsals, respectively.
For all intermediate bands reported, the maximum, minimum, and mean number of minutes per rehearsal outside of school hours were 90, 30, and 60 minutes, respectively.
For all advanced bands reported, the maximum, minimum, and mean number of minutes per rehearsal outside of school hours were 90, 20, and 55 minutes, respectively.
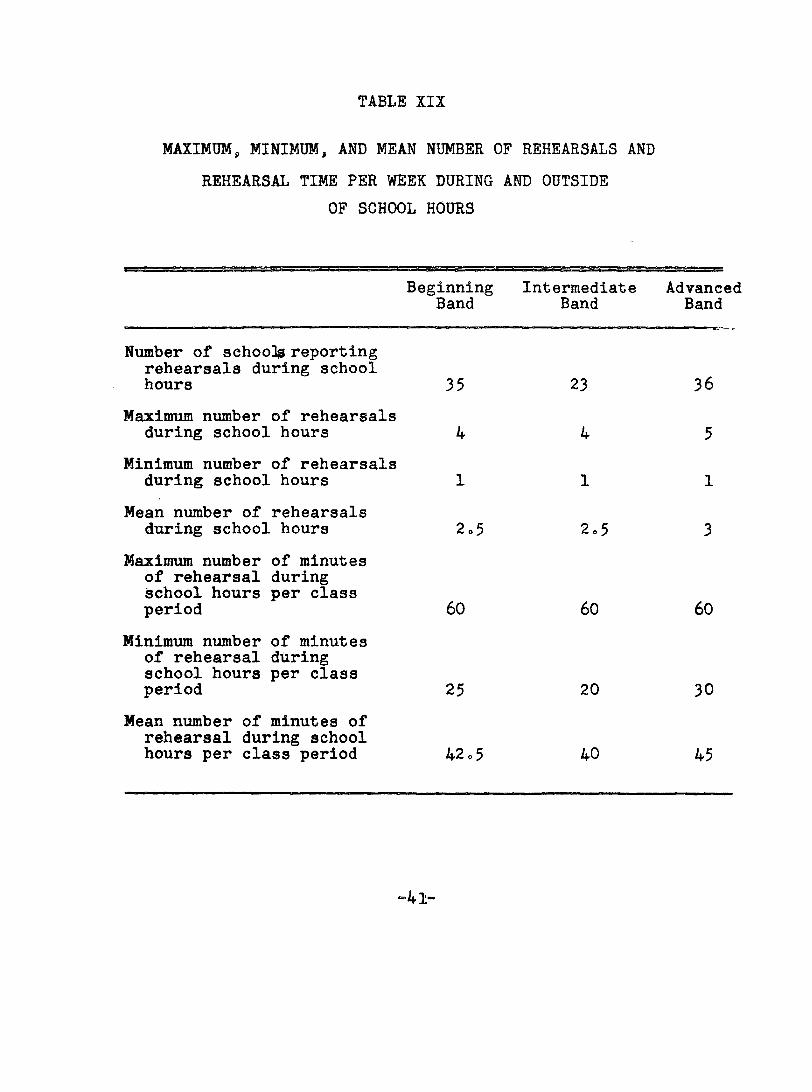
TABLE XIX
MAXIMUM, MINIMUM, AND MEAN NUMBER OF REHEARSALS ANDREHEARSAL TIME PER WEEK DURING AND OUTSIDE
OF SCHOOL HOURS
BeginningBand
IntermediateBand
AdvancecBand
Number of schools reporting rehearsals during school hours 35 23 36
Maximum number of rehearsals during school hours 4 4 5
Minimum number of rehearsals during school hours 1 1 1
Mean number of rehearsals during school hours 2.5 2.5 3
Maximum number of minutes of rehearsal during school hours per class period 60 60 60
Minimum number of minutes of rehearsal during school hours per class period 25 20 30
Mean number of minutes of rehearsal during school hours per class period 42.5 40 45
-41-
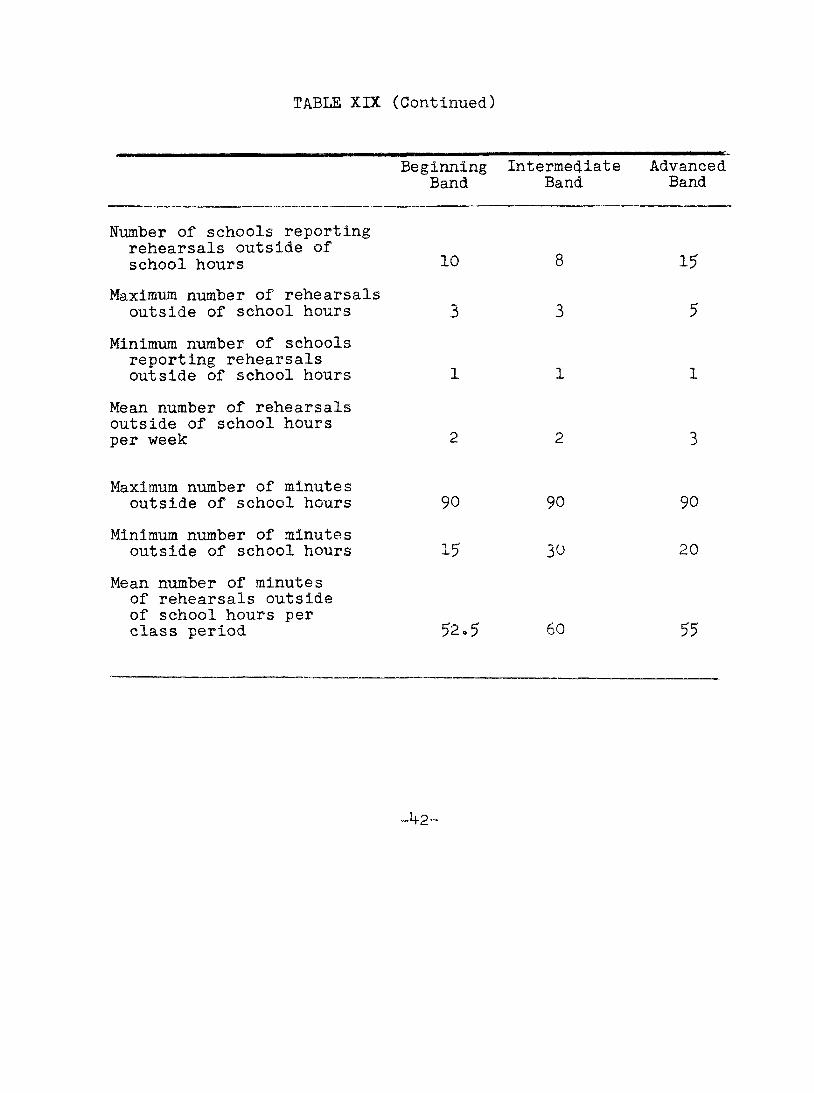
TABLE XIX (Continued)
Beginning Intermediate AdvancedBand Band Band
Number of schools reporting rehearsals outside ofschool hours 10 ° 15
Maximum number of rehearsalsoutside of school hours 3 3 5
Minimum number of schools reporting rehearsalsoutside of school hours 1 1 1
Mean number of rehearsals outside of school hoursper week 2 2 3
Maximum number of minutesoutside of school hours 90 90 90
Minimum number of minutesoutside of school hours 15 30 20
Mean number of minutes of rehearsals outside of school hours perclass period 52.5 60 55
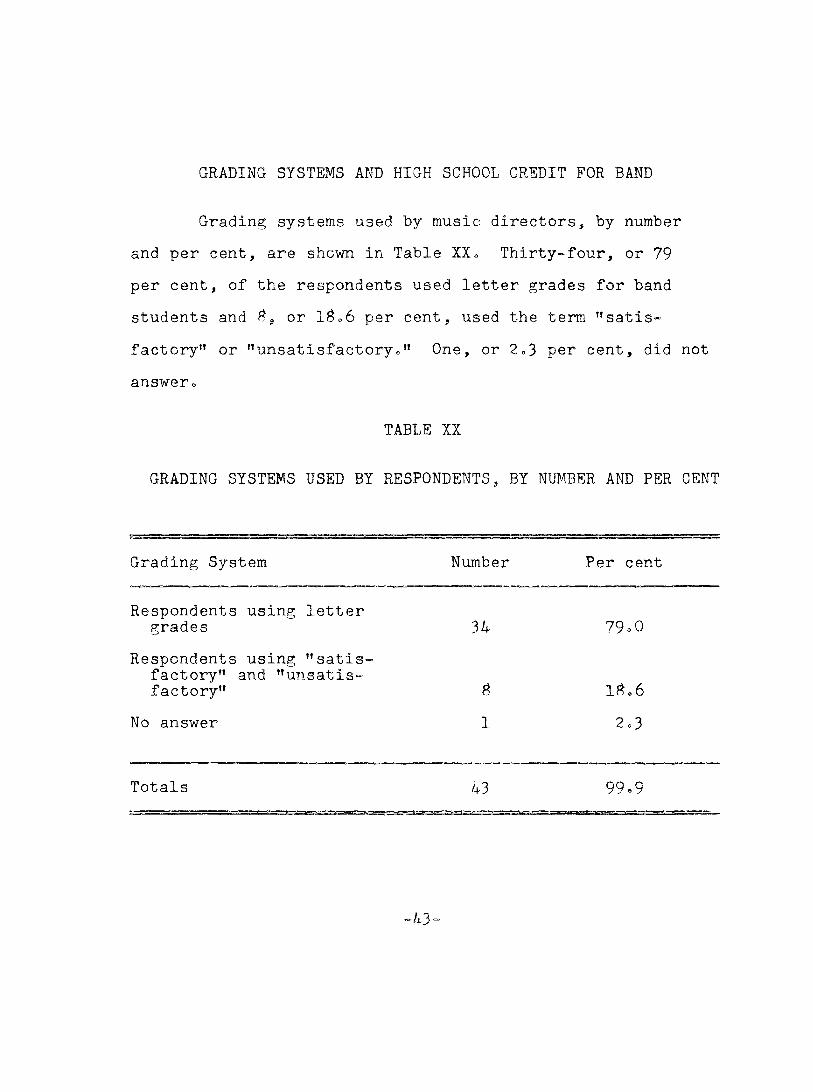
GRADING SYSTEMS AND HIGH SCHOOL CREDIT FOR B M m
Grading systems used by music directors, by number and per cent, are shown in Table XXo Thirty-four, or 79 per cent, of the respondents used letter grades for band students and ^, or IS.6 per cent, used the term "satisfactory" or "unsatisfactoryc" One, or 2.3 per cent, did not answer.
TABLE XX
GRADING SYSTEMS USED BY RESPONDENTS. BY NUMBER AND PER CENT
Grading System
Respondents using letter grades
Respondents using "satisfactory" and "unsatisfactory"
No answer
Number
34
ê
1
Per cent
79.0
IS.6 2.3
Totals 43 99.9
-43-
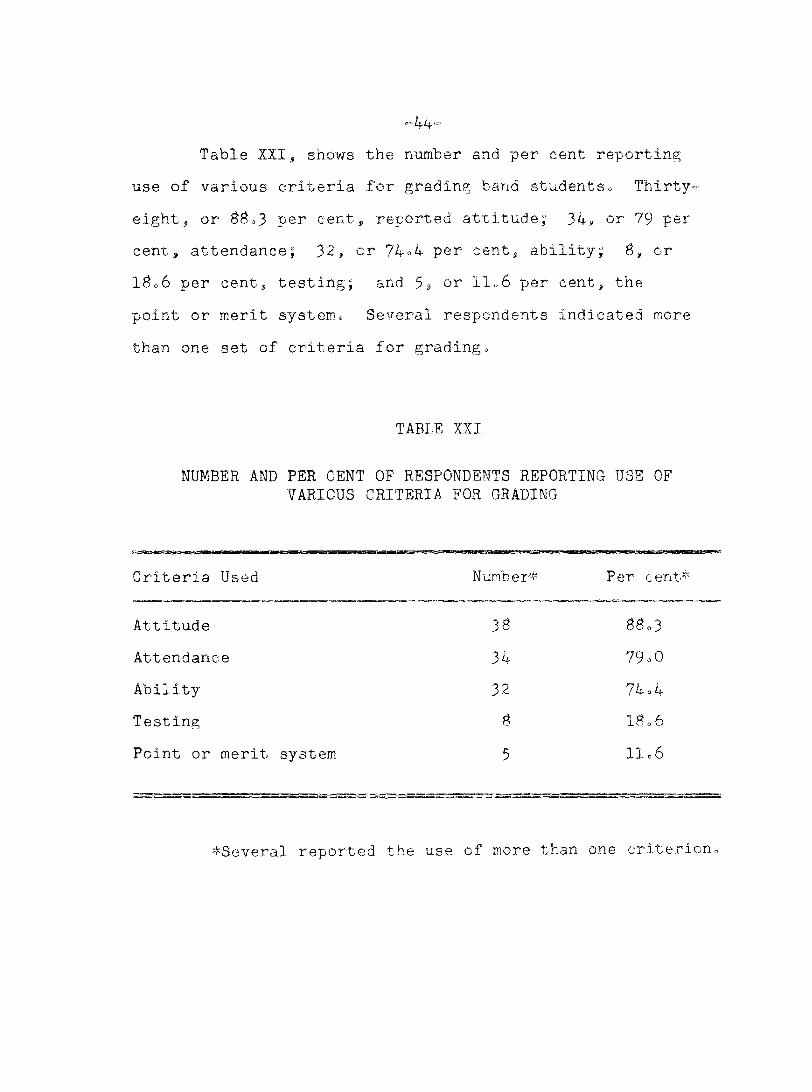
Table XZI, shows the number and per cent reporting use of various criteria for grading band students^ Thirty* eight, or 88o3 per cent, reported attitude; 34, or 79 per cent, attendance; 32, or 74=4 per cent, ability; 8, or l8o6 per cent, testing; and 5, or 11,6 per cent, the point or merit system. Several respondents indicated more than one set of criteria for grading.
TABLE XXI
NUMBER AND PER CENT OF RESPONDENTS REPORTING USE OF VARIOUS CRITERIA FOR GRADING
Criteria Used Number* Per cent*
Attitude 3^ 88.3Attendance 34 79 = 0Ability 32 74 = 4Testing 8 18.6Point or merit system 5 11.6
(Several reported the use of more than one criterion,
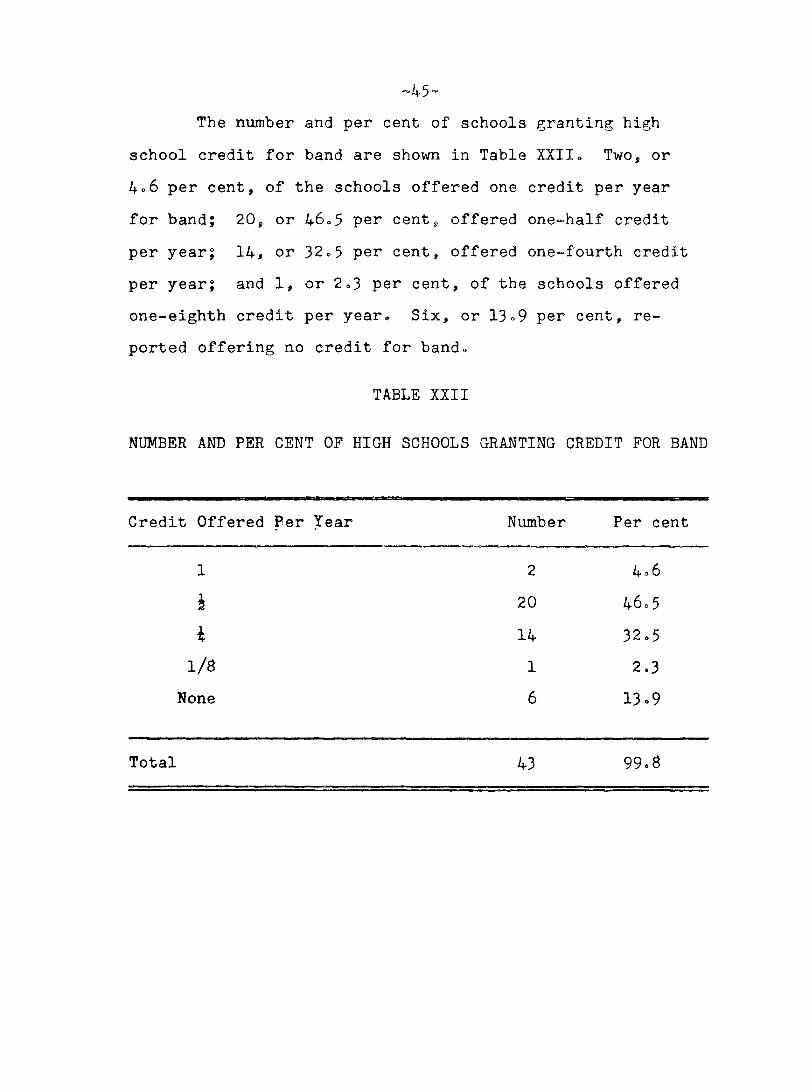
-45-The number and per cent of schools granting high
school credit for band are shown in Table XXII„ Two, or 4o6 per cent, of the schools offered one credit per year for band; 20, or 46*5 per cent, offered one-half credit per year; 14, or 32»5 per cent, offered one-fourth credit per year; and 1, or 2.3 per cent, of the schools offered one-eighth credit per year. Six, or 13»9 per cent, reported offering no credit for band»
TABLE XXII
NUMBER AND PER CENT OF HIGH SCHOOLS GRANTING CREDIT FOR BAND
Credit Offered Per Year Number Per cent
1 2 4.6h 20 46.5i 14 32.51/8 1 2.3
None 6 13.9
Total 43 99.8
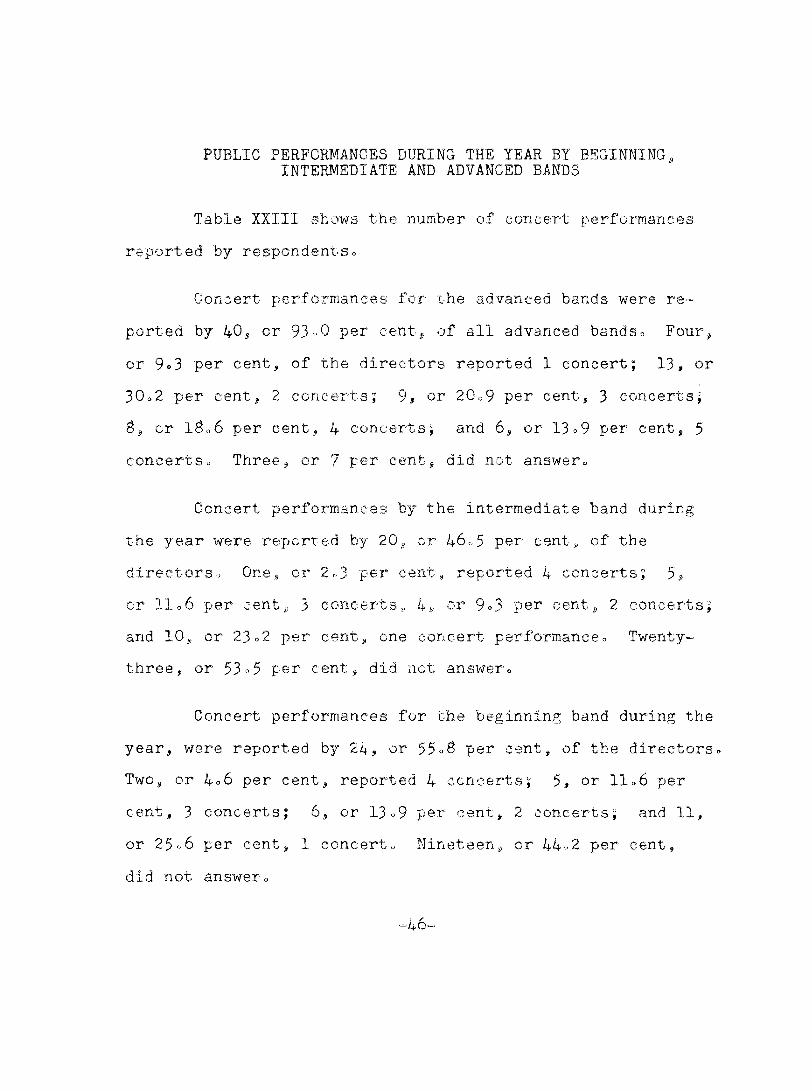
PUBLIC PERFORMANCES DURING THE TEAR BY BEGINNING, INTERMEDIATE AND ADVANCED BANDS
Table XXIII shows the number of concert performances reported by respondents°
Concert performances for the advanced bands were reported by 40, or 93tO per cent, of all advanced bands. Four, or 9«3 per cent, of the directors reported 1 concert; 13, or 30,2 per cent, 2 concerts; 9, or 20,9 per cent, 3 concerts;S, or IS06 per cent, 4 concerts; and 6, or 13°9 per cent, $ concerts. Three, or 7 per cent, did not answer.
Concert performances by the intermediate band during the year were reported by 20, or 46°$ per cent, of the directors. One, or 2,3 per cent, reported 4 concerts; 5, or 11,6 per cent, 3 concerts, 4» or 9,3 per cent, 2 concerts;and 10, or 23,2 per cent, one concert performance. Twenty-three, or 53,5 per cent, did not answer.
Concert performances for the beginning band during the year, were reported by 24, or $5.S per cent, of the directors, Two, or 4,6 per cent, reported 4 concerts; 5, or 11,6 per cent, 3 concerts; 6, or 13,9 per cent, 2 concerts; and 11,or 25,6 per cent, 1 concert. Nineteen, or 44°2 per cent,did not answer,
—4o—
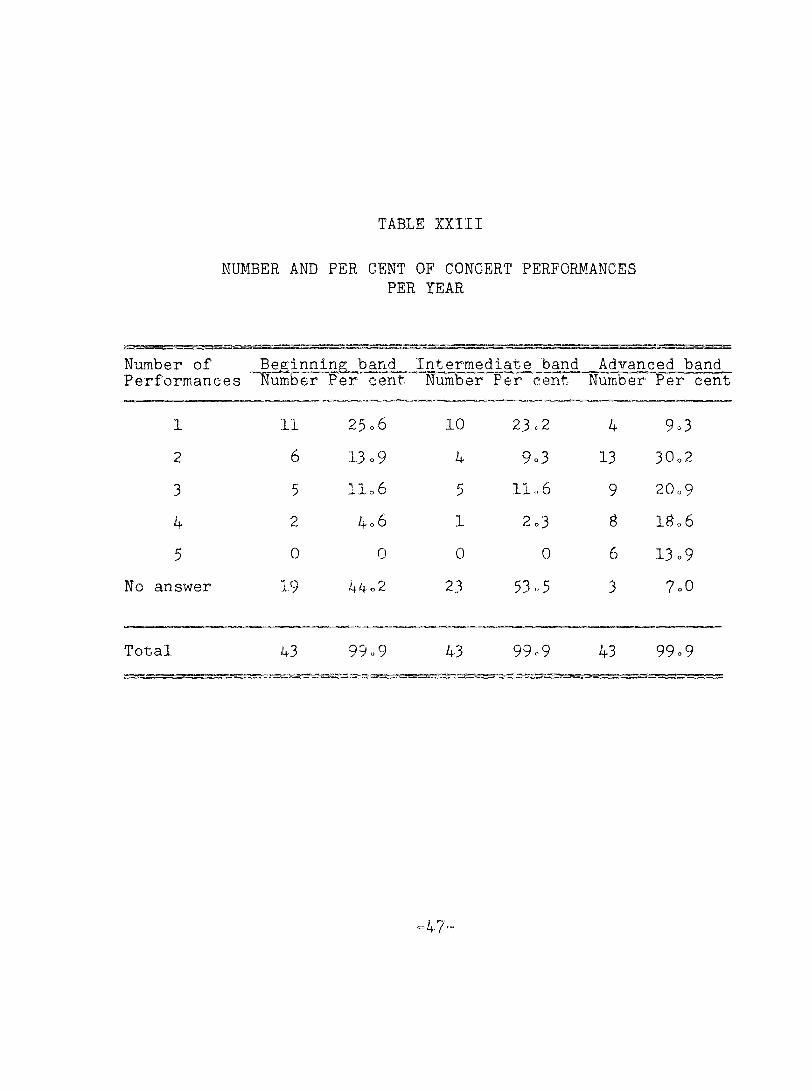
TABLE %XIII
NUMBER AND PER CENT OF CONCERT PERFORMANCESPER TEAR
Number ofPerformances Number Per cent Number Per cent Number Per 1
1 11 25.6 10 23.2 4 9.32 6 13.9 4 9.3 13 30.23 5 llo6 5 11.6 9 20.94 2 4.6 1 2.3 ê 18.65 0 0 0 0 6 13.9
No answer 19 44.2 23 53.5 3 7.0
Total 43 99.9 43 99°9 43 99.9
-47̂
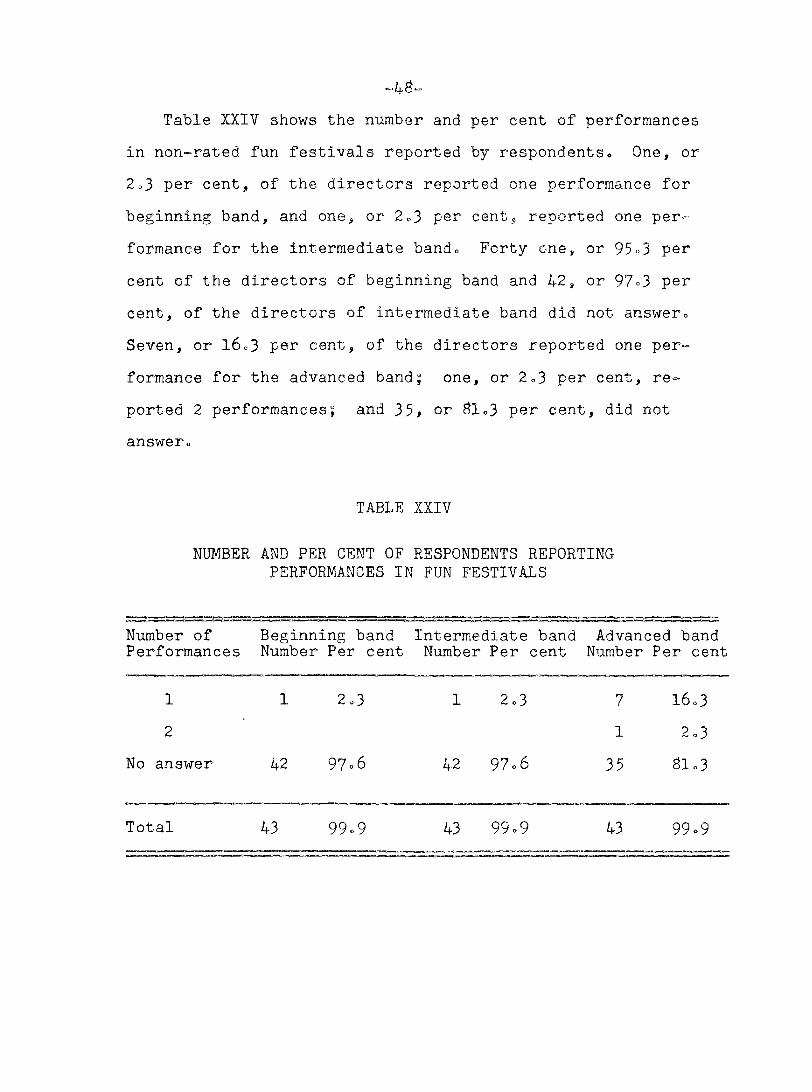
Table XXIV shows the number and per cent of performances in non-rated fun festivals reported by respondents. One, or 2.3 per cent, of the directors reported one performance for beginning band, and one, or 2.3 per cent, reported one performance for the intermediate band. Forty one, or 95°3 per cent of the directors of beginning band and 42, or 97=3 per cent, of the directors of intermediate band did not answer. Seven, or 16.3 per cent, of the directors reported one performance for the advanced band; one, or 2.3 per cent, reported 2 performances; and 35» or 81.3 per cent, did not answer.
TABLE XXIV
NUMBER AND PER CENT OF RESPONDENTS REPORTING PERFORMANCES IN FUN FESTIVALS
Number of Beginning band Intermediate band Advanced band Performances Number Per cent Number Per cent Number Per cent
1 1 2.3 1 2.3 7 16.32 1 2.3
No answer 42 97°6 42 97.6 35 81.3
Total 43 99.9 43 99.9 43 99.9
Table XXV shows the number and per cent of respondents reporting band performances at athletic contests and pep rallieso One, or 2*3 per cent, of the respondents indicated using a beginning band for 1 to 5 performances, and 2, or 4o6 per cent, reported using an intermediate band for 1 to 5 performanceso Of directors of advanced bands, 12, or 27w9 per cent, reported 1 to 5 performances; 4, or 9*3 per cent, 6 to 10 performances; 10, or 23*2 per cent, 16 to 20 performances; 3, or 7°0 per cent, 21 to 2$ performances; 2, or 4w& per cent, 26 to 30 performances; and 1, or 2o3 per cent, reported 30 to 32 performanceso Three, or 7»0 per cent, did not answer.
-49-
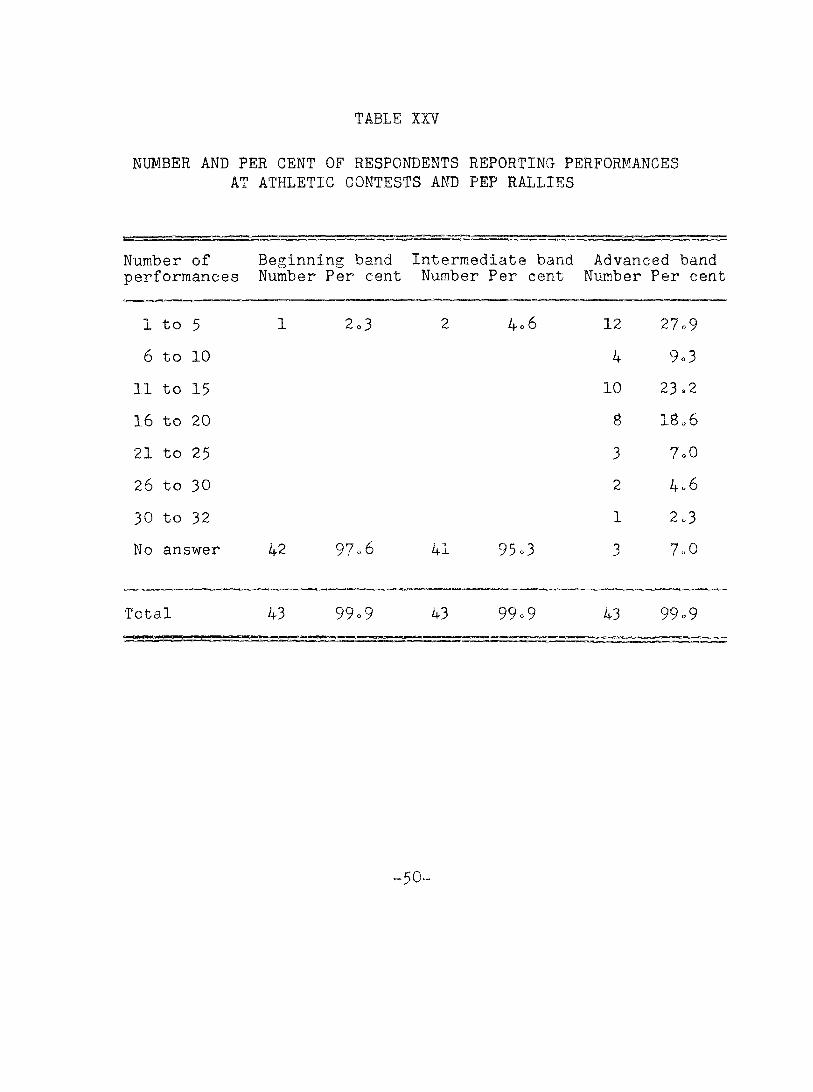
TABLE %%V
NUMBER AND PER CENT OF RESPONDENTS REPORTING PERFORMANCESAT ATHLETIC CONTESTS AND PEP RALLIES
Number of performances
Beginning band Intermediate bandNumber Per cent Number Per cent
Advanced bandNumber Per cent
1 to 5 1 2o3 2 4.6 12 27.96 to 10 4 9.3
11 to 15 10 23.2
16 to 20 B 18.621 to 25 3 7.026 to 30 2 4.630 to 32 1 2.3No answer 42 97.6 41 95.3 -i 7.0
Total 43 99.9 43 99.9 43 99.9
.$0.
“51“
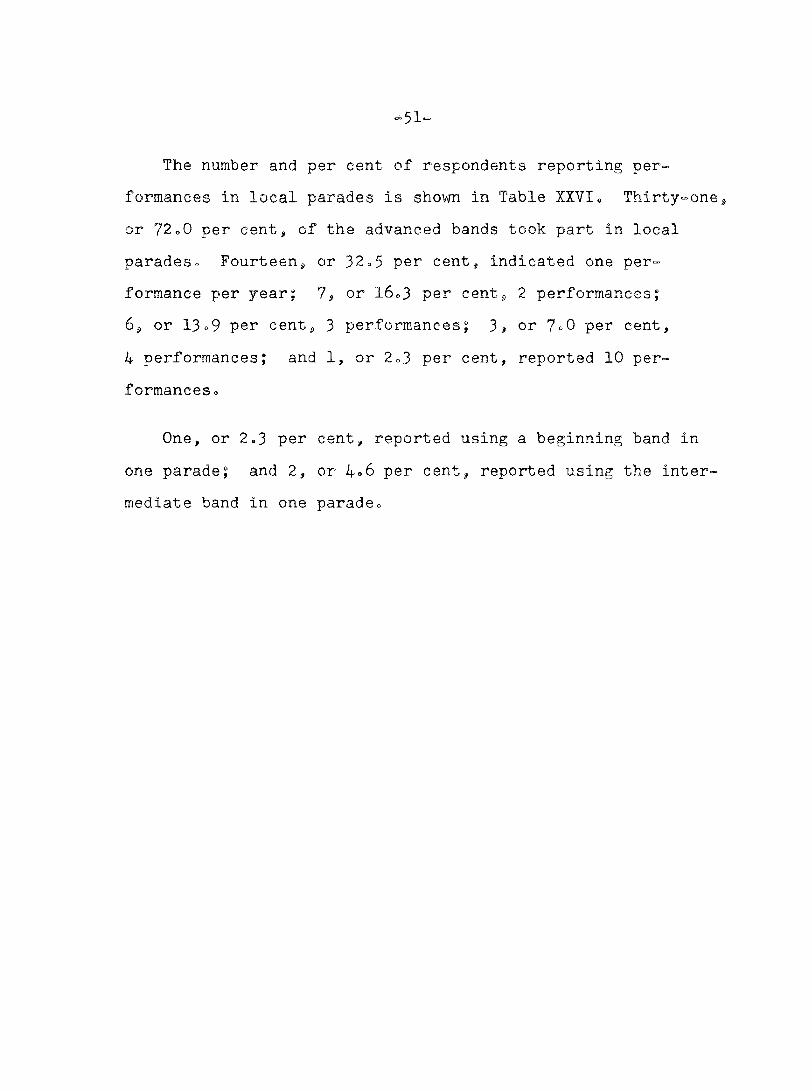
The number and per cent of respondents reporting performances in local parades is shown in Table XXVI <, Thirty-one or 72«0 per cent, of the advanced bands took part in local parades. Fourteen, or 32,5 per cent, indicated one per- formance per year; 7, or 16,3 per cent, 2 performances;6, or 13,9 per cent, 3 performances; 3, or 7,0 per cent,4 performances; and 1, or 2,3 per cent, reported 10 performances.
One, or 2.3 per cent, reported using a beginning band in one parade; and 2, or 4»6 per cent, reported using the intermediate band in one parade.
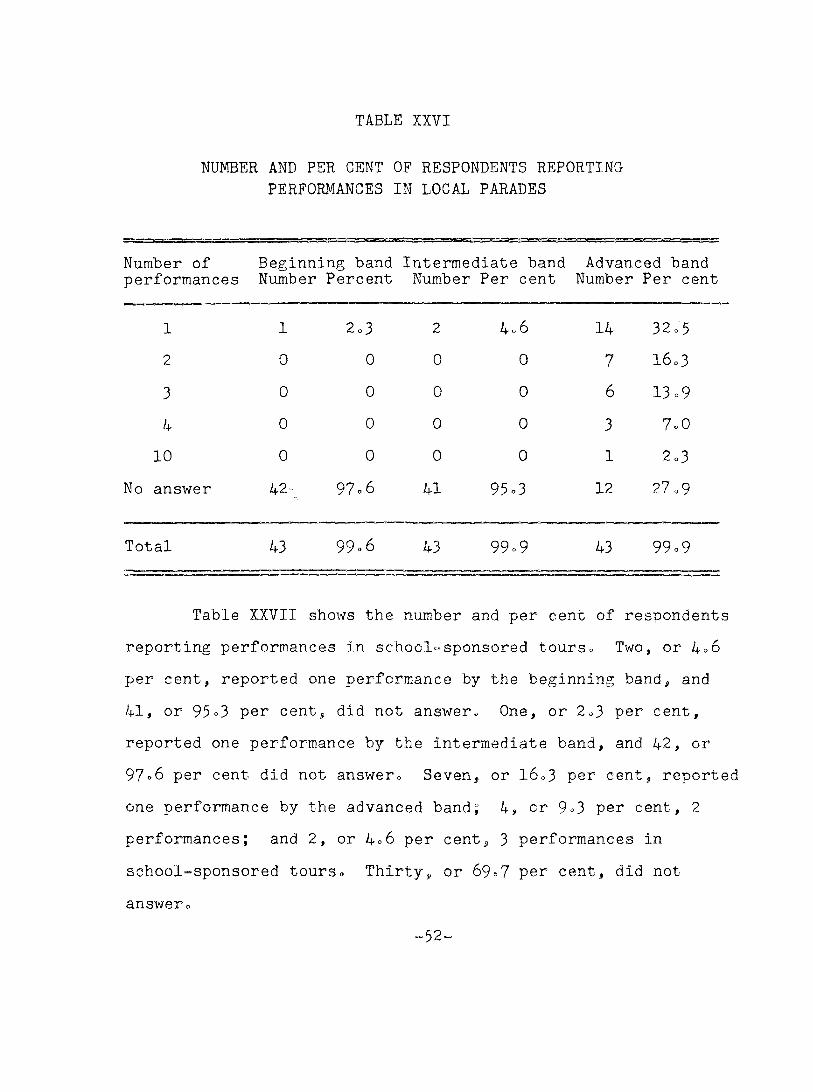
TABLE XXVI
NUMBER AND PER CENT OF RESPONDENTS REPORTING PERFORMANCES IN LOCAL PARADES
Number of Beginning band Intermediate band Advanced band performances Number Percent Number Per cent Number Per cent
1 1 2.3 2 4.6 14 32.52 0 0 0 0 7 16.33 0 0 0 0 6 13.94 0 0 0 0 3 7.0
10 0 0 0 0 1 2.3No answer 42- 97.6 41 95.3 12 27.9
Total 43 99.6 43 99.9 43 99.9
Table XXVII shows the number and per cent of respondents reporting performances in school-sponsored tours. Two, or 4.6 per cent, reported one performance by the beginning band, and 41, or 95o3 per cent, did not answer. One, or 2.3 per cent, reported one performance by the intermediate band, and 42, or97.6 per cent did not answer. Seven, or l6.3 per cent, reported one performance by the advanced band; 4, or 9.3 per cent, 2 performances; and 2, or 4.6 per cent, 3 performances in school-sponsored tours» Thirty, or 69»7 per cent, did not answer»
-52-
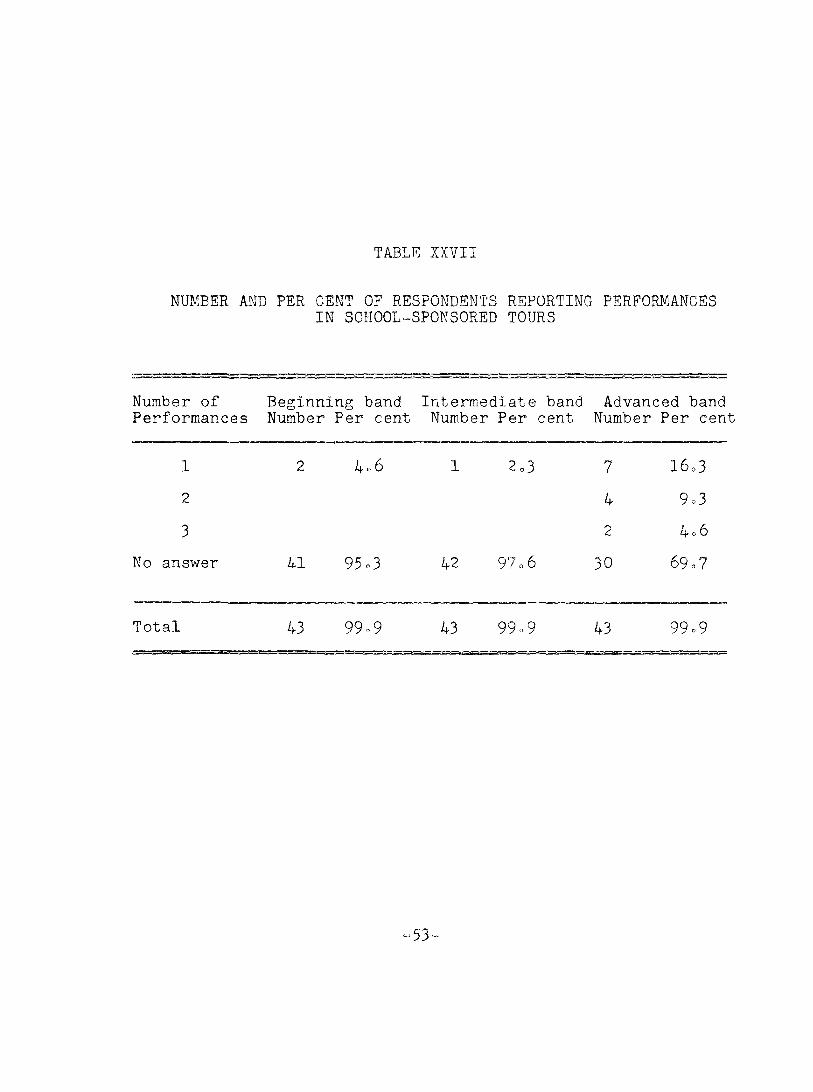
TABLE ZXVII
NUMBER AND PER CENT OF RESPONDENTS REPORTING PERFORMANCESIN SCHOOL-SPONSORED TOURS
Number of Beginning band Intermediate band Advanced bandPerformances Number Per cent Number Per cent Number Per cen1
1 2 4.3 6 1 2.3 7 16.32 4 9.33 2 4.6
No answer 41 95..3 42 97.6 30 69.7
Total 43 99..9 43 99.9 43 99.9
53'
FESTIVAL RATINGS EARNED AND RANKINGS, BY RESPONDENTS,OF FIVE MAJOR FACTORS INFLUENCING THE
MOTIVATION OF BAND PROGRAMS
Band ratings received in festival participation in 1953 and 1954 are shown in Table XXVIIIo In 1953, Division I ratings were earned by 3, or 7°0 per cent, of the respondents; Division II ratings, by I6, or 37*2 per cent; Division III ratings by 5, or II06 per cent; and Division IV ratings by 1, or 2«3 per cento Three, or 7»0 per cent, reported that festivals were not rated in 1953°
In 1954, Division I ratings were earned by 7, or l6o3 per cent of the respondents; Division II ratings by IS, or 41°# per cent; Division III ratings by 7, or l6o3 per cent; and Division IV ratings by 1, or 2.3 per cent. Two, or 4°6 per cent, reported that festivals were not rated in 1954°
Nine, or 20.9 per cent, of the respondents, reported they did not enter festivals in 1953, and 5, or 11.6 per cent, did not enter in 1954°
Three, or 7 per cent, of the respondents, reported that they did not know what the ratings were for the 1953 school year. Three, or 7 per cent, of the directors did not answer for 1953, and 3, or 7 per cent, did not answer for1954°
-54"
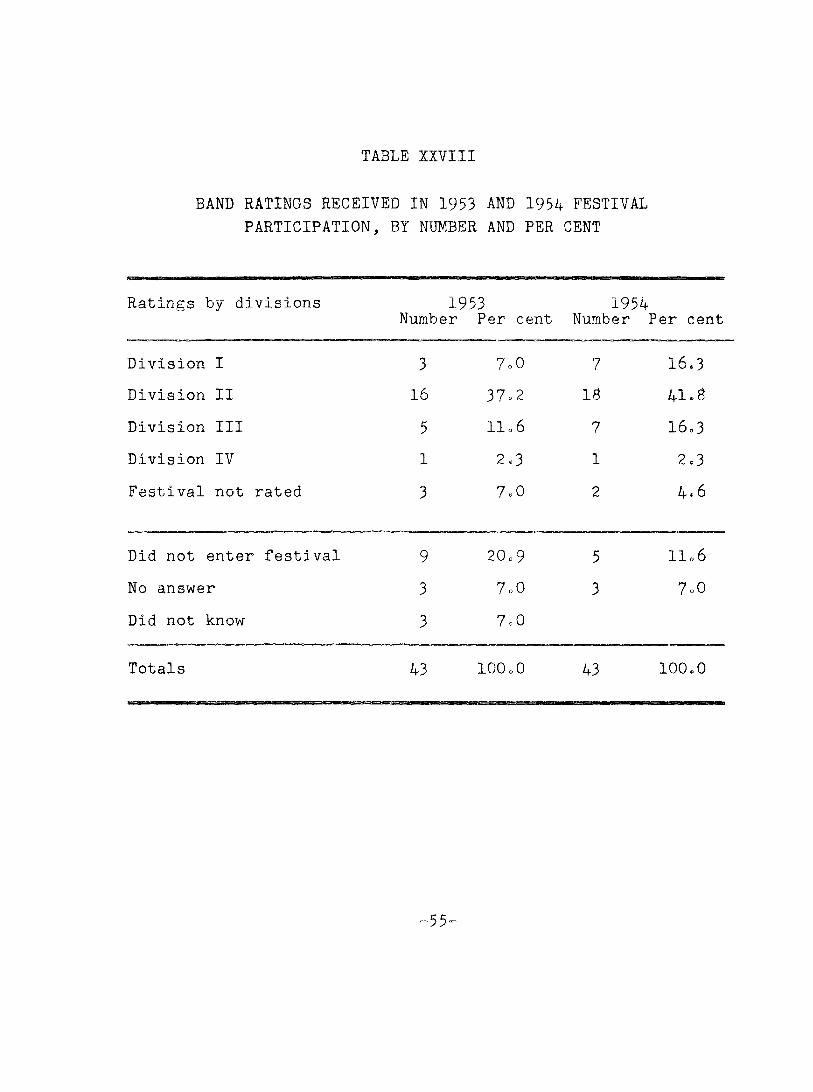
TABLE ZIVIII
BAND RATINGS RECEIVED IN 1953 AND 1954 FESTIVAL PARTICIPATION, BY NUMBER AND PER CENT
Ratings by divisions 1953Number Per cent
1954Number Per cent
Division I 3 7.0 7 16.3Division II 16 37.2 IS 41.aDivision III 5 11.6 7 16.3Division IV 1 2.3 1 2.3Festival not rated 3 7.0 2 4.6
Did not enter festival 9 20.9 5 11.6No answer 3 7.0 3 7.0Did not know 3 7.0
Totals 43 100.0 43 100.0
-55-
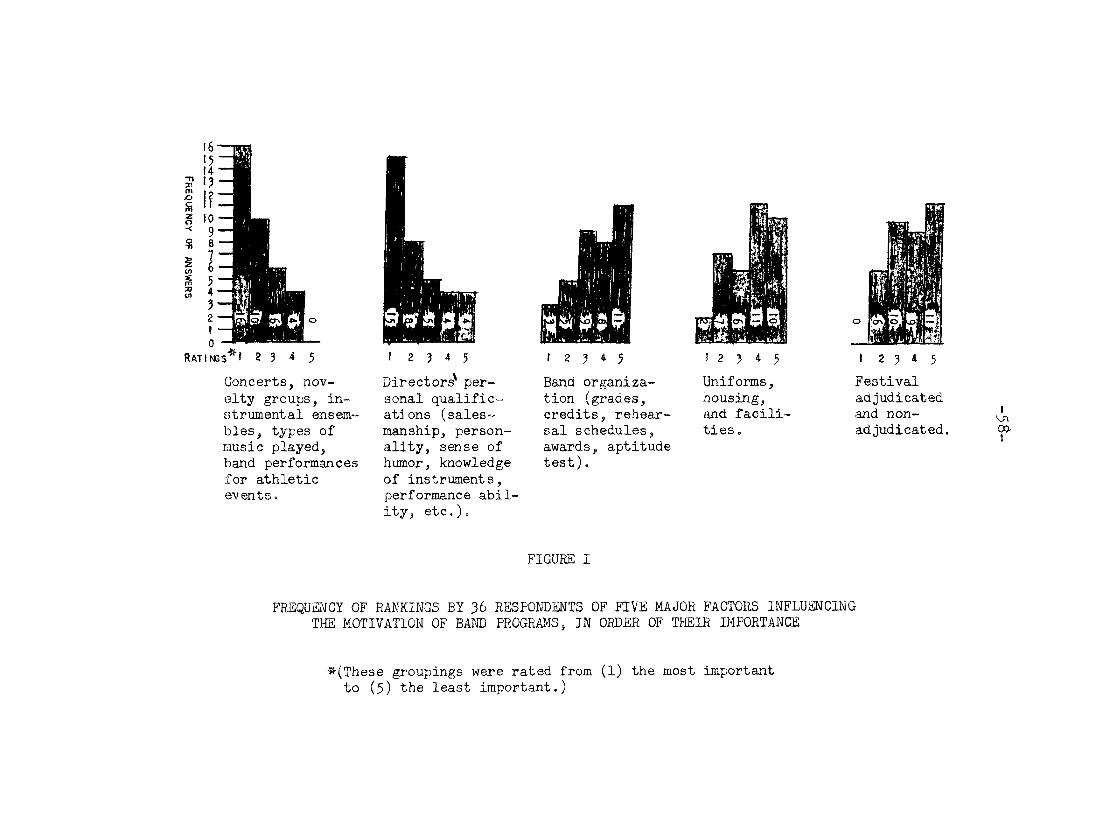
“ 5 6—Figure 1 shows the frequency of rankings by 36
respondents of five major factors which influence the motivation of band programs, in order of their importance. The
ratings used were (1) the most important to (5) the least important.
Sixteen respondents, or 37.2 per cent, gave a rating
of 1 to factor number 1 (concerts, novelty groups, instru
mental ensembles, types of music played, and band performances for athletic events); 10, or 23.2 per cent, gave a rating of 2; 6, or 13.9 per cent, gave a rating of 3; k, or 9.3 percent, gave a rating of 4; and no respondents gave a rating
of 5.Fifteen respondents, or 34.9 per cent, gave a rating
of 1 to factor number 2 (the director’s personal qualifications — salesmanship, personality, sense of humor, knowledge of instruments, and performance ability) -- S, orIS.6 per cent, gave a rating of 2; 5, or 11.6 per cent gavea rating of 3; 4# or 9.3 per cent, gave a rating of 4; and4, or 9.3 per cent, gave a rating of 5.
Three respondents, or 7 per cent, gave a rating of 1 to factor number 3 (band organization -- grades credits, rehearsal schedules, awards, and aptitude tests); 5, or 11,6 per cent, gave a rating of 2; 9, or 20.9 per cent, gave arating of 3; S, or IS.6 per cent, gave a rating of 4; and 11, or 25.6 per cent, gave a rating of 5*
-57-Two respondents, or 4*6 per cent, gave a rating of 1
to factor number 4 (uniforms, housing and facilities); 7, or 16.3 per cent, gave a rating of 2; 6, or 1].9 per cent,gave a rating of 3; 11, or 25.6 per cent, gave a ratingof 4; and 10, or 23*2 per cent, gave a rating of
No respondents rated number 5 (adjudicated and nonadjudicated festivals); 6, or 13.9 per cent, gave a rating of 2 to this factor; 10, or 23.2 per cent, gave a rating of 3; 9, or 20.9 per cent, gave a rating of 4; and 11, or25.6 per cent, gave a rating of 5.
s-<
£70
ÎO —
R a t i n g s î 2 3 4 5
Concerts, novelty groups, instrumental ensembles, types of music played, band performances for athletic events.
If 2 3 4 ;Directors' personal qualifications (salesmanship, personality, sense of humor, knowledge of instruments, performance ability, etc.).
Band organization (grades, credits, rehearsal schedules, awards, aptitude test).
1 2 3 4 3Uniforms, housing, and facilities .
1 2 3 4 3Festival adjudicated and nonadjudicated.
IvnOQ.I
FIGURE I
FREQUENCY OF RANKINGS BY ]6 RESPONDENTS OF FIVE MAJOR FACTORS INFLUENCING THE MOTIVATION OF BAND PROGRAMS, IN ORDER OF THEIR IMPORTANCE
«■(These groupings were rated from (1) the most important to (5) the least important.)
CHAPTER III
SUMMARY, CONCLUSIONS, AND RECOMMENDATIONS
SUMMARY
This study was made to determine some of the factors and practices which influence the motivation of prospective instrumental students and students who are actively taking part in school band programs.
A survey was made by the author by means of a questionnaire sent to sixty-nine Class C and D public schools in Montana. Approximately two weeks after the questionnaires were mailed, a short, personal follow-up letter was sent to each director who had not responded. Of the 69 questionnaires sent to music directors, 43, or 62.3 per cent, were returned.
Data were arranged in tabular form, for the purpose of analysis, evaluation, conclusions, and recommendations.
About 49 per cent of the directors had instrumental majors in college preparation, 9 per cent had choral majors, and 7 per cent had a combination of vocal and instrumental majors. The remaining few had various kinds of other majors. About 37 per cent of the directors had instrumental minors. About 23 per cent had choral minors.
-59-
-60“Approximately 47 per cent were more interested in the
instrumental field, and 42 per cent were more interested in a
combination vocal and instrumental field.
The median number of years as instrumental director was 4.9 and the median number of years in present positions was 2.3. For recruiting purposes, about 93 per cent of the directors used personal interviews with parents and approximately S6 per cent performed special programs and concerts. Various other recruiting methods were reported by other directors.
About 85 per cent of the respondents reported that they could demonstrate all instruments of the band. Approximately 26 per cent reported that the clarinet was their solo instrument, 2ê per cent, trumpet or cornet, and 20 per cent piano. Other directors reported being able to play various instruments and also indicated the various instruments they could demonstrate.
About 49 per cent of the directors participated in church choirs; approximately 44 per cent had their own dance bands or played in one, and the remaining directors took part in other civic activities.
Approximately 77 per cent of the respondents accepted all interested students in the instrumental program. Seventy four per cent rehearsed the beginning band as a class. Other
“ 6l—organizational and teaching methods were used by directors in varying amounts.
Seventy-two per cent of the directors used their own individual award system. About 60 per cent placed their students according to ability, and did not use the challenge system. Approximately 60 per cent taught instrumental students privately, in addition to regularly scheduled class instruction. Approximately 56 per cent had regularly elected band officers. The remaining directors used various organizational devices and teaching methods in varying degrees.
About 60 per cent of the directors had rooms used exclusively for music classes. Approximately 51 per cent used the school gymnasium or auditorium for band rehearsals.About 63 per cent did not have adequate storage racks for instruments and approximately 60 per cent considered their housing for band inadequate.
Forty-two schools owned snare drums, tubas, or sousa- phones; 40 schools owned bass drums, cymbals, and baritones. Thirty-eight schools owned Eb alto horns; 32 schools owned record players; and 30 schools owned movie projectors. The rest of the instruments of the band were owned by the remaining schools in varying numbers. These instruments and equipment were used by the high school band as well as the beginning or training bands.
“62 “Educational film and film slides were used in varying
degrees by the respondentso The percentage of schools indicating no film usage for the beginning, intermediate, and advanced bands, were 42, 47, and 42, respectively.
About 8l per cent of the advanced bands, approximately 14 per cent of the intermediate bands, and about 5 per cent of the beginning bands were equipped with band uniforms. Approximately $8 per cent of the uniforms for advanced bands were from 1 to 5 years of age, 9 per cent from 6 to 8 years old; and 9 per cent from 10 to 12 years of age.
Attitudes, attendance, and ability were the criteriamost used for band grading purposes. About 88 per cent usedattitude, 79 per cent used attendance, and 74 per cent used ability. Other criteria, testing, and a point or merit system, were used to a lesser degree.
Seventy-nine per cent of the directors responding used letter grades for their grading system. Others used "satisfactory,” or "unsatisfactory.”
Approximately 47 per cent of the schools granted one- half credit per year for band work and 33 per cent granted one-fourth credit. A smaller number of schools granted varying amounts of credit for band.
The method book for beginning band Easy Steps to TheBand. was used by approximately 42 per cent of the directors.
“■63 —About nineteen per cent used the Eubank Method for the intermediate band and approximately 19 per cent of the respondents used the Eubank Advanced Method for advanced band instruction.
Of a total of 43 directors who answered the questionnaire, 35 had rehearsals for the beginning band, 23 for the intermediate band, and 36 for the advanced band during school hours. The mean number of rehearsals per week during school hours, for the beginning and intermediate band was 2.5» The mean number of rehearsals for the advanced bands was 3»
The mean number of minutes per rehearsal for the beginning, intermediate, and advanced bands was 42»5, 40, and 45 respectively.
Ten schools had rehearsals for the beginning band, 8 schools had rehearsals for the intermediate band, and 15 schools had rehearsals for the advanced band outside of school hours. The mean number of rehearsals outside of school was 2 for beginning band, 2 for the intermediate band, and 3 for the advanced band. The mean number of minutes was 52.5, 60, and 55, respectively.
Concert performances for the advanced bands reportedby 93 per cent of the respondents varied from 1 to 5 per year.Intermediate band concerts reported by about 46 per cent ofthe respondents varied from 1 to 4 per year; and beginningband concerts reported by approximately 56 per cent of the directors varied from 1 to 4 per year.
=■64“About 28 per cent of the respondents reported from 1
to 5 performances at athletic contests and pep rallies during the year* Approximately 9 per cent reported 6 to 10 performances; 23 per cent, 11 to 1$ performances; about 19 per cent, 16 to 20 performances; 7 per cent, 21 to 25 performances; about 5 per cent, 26 to 30 performances; and approximately 2 per cent reported 30 to 32 performances.About 2 per cent of the respondents reported using beginning bands at athletic contests and about 5 per cent reported using intermediate bands.
For advanced band performances in local parades, about 33 per cent of the respondents reported participating in one parade annually; about 16 per cent reported 2 parades; approximately 14 per cent, 3 parades; 7 per cent, 4 parades, and about 2 per cent, 10 performances in local parades annually, Approximately 2 per cent of the respondents reported using a beginning band in parades and 5 per cent reported using intermediate bands in local parades.
Seven per cent of the respondents reported receiving Division I ratings; about 37 per cent received Division II ratings; and approximately 12 per cent received Division III ratings in the 1953 festival. Approximately 16 per cent of the respondents received Division I ratings; about 49 per cent received Division II ratings; and approximately 16 per cent received Division III ratings in the 1954 festival.
-65-Directors were asked to rank groupings of five major
factors which influence the motivation of school band
programs in order of their importanceo The following ratings were used: (1) the most important to (5) the least important*The following rankings were reported:
lo Concerts, novelty groups, instrumental ensembles, types of music played, and band performances for athletic events.
2. Directors* personal qualifications (salesmanship, personality, sense of humor, knowledge of instruments, and performance ability)*
3» Band organization (grades, credits, rehearsal schedules, awards and aptitude test).
4. Uniforms, housing, and facilities.5. Festivals, adjudicated and non-adjudicated.
CONCLUSIONS
Although one could wish that all band directors had instrumental majors, the qualifications of the respondents were generally adequateo
The reported ability to play or demonstrate various instruments of the band was satisfactory.
The percentage of music directors who reported participation in community activities outside of school hours appeared to be small, with one-half or less of the respondents taking part in church choirs, dance bands, community singing groups, instrumental ensembles, or service club groups.
Since recruiting practices depend a great deal upon the personality of the director, and upon his ability to use certain recruiting methods more efficiently than others, many practices were reported. The most prevalent, however, was personal contact or interviews with the parents of prospective band students.
There seemed to be a general tendency toward accepting all interested students in the instrumental program.
There was a great deal of similarity in most schools in the director’s use of his own individual award system and the practice of seating band students according to ability without using the challenge system,
—66—
.67-
Most of the schools owned instruments that are generally needed to insure basic instrumentation for band and were equipped with relatively new uniforms, indicating that the small communities provide excellent support for the band program.
Considering the availability of educational film and filmstrips for use in schools, a relatively small percentage of directors took advantage of these materials.
A majority of the bands which took part in competitive festivals received ratings in the first two divisions. If competitive festivals are rated according to a national standard, the ratings of bands in the smaller schools must be considered good. A smaller number of schools, however, did not enter festivals.
RECOMMENDATIONS
Since the success of school band programs in Class G and D schools in Montana depends a great deal upon the support given by the community, more directors should take an active part in community activities, where music can play such a vital role.
Better housing and facilities for bands, more instrumental instruction scheduled during school hours, and a rehearsal room other than the school gymnasium would greatly enhance the progress of the band and of the music programs.
More directors should take advantage of educational film and filmstrips which are available for use in schools.
It is the opinion of the investigator that the one unit given for participation in the music program in high school should be applicable to the graduation requirement.
A large majority of the public performances reported by directors consisted of "service performances," performances which tend to be of a supporting nature or incidental in function. It is the opinion of the author that more "concert performances," which display the band as an entity in and of itself, apart from support, would be desirable.
Since competitive festivals are generally recognized as being an important influence in the motivation of band
students, more band directors in Class C and D schools shouldtake part in the competitive festivals.
-68=
Suggested Areas for Further Study
In view of the limitations of this study, the following suggestions for further studies of factors which influence the motivation of band programs are made:
lo A study to determine the relative importance of the type of performance which influences the motivation of band programs.
2. A study to determine the importance of the director's personal qualifications as factors which influence the motivation of band programs,
3o A study of the musical accomplishments of the band in relation to the tenure of the music teacher.
.69.

BIBLIOGRAPHY
BIBLIOGRAPHY
Brenner, Benjamin. Effect of Immediate and Delayed Praise and Blame Upon Learning and Recall (New York: Bureau of Publications, Teachers College, Columbia University, 1934), p. 50.
Campbell, William Giles. Form and Style in Thesis Writing. New York: Houghton Mifflin Co., 195A^ II4 pp°
Good, Carter V ., Barr, A. S., Scales, Douglas E. TheMethodology of Educational Research (New York: Appleton- Century-Crofts., Inc., 1935)« 890 pp.
Prescott, Gerald R., and Lawrence W. Chidester. Getting Results With School Bands (New York: Carl Fischer Inc., and Minneapolis: Paul A. Schmitt Music Co., 193&), p. 47*
Rummel, J. Francis413 pp.
An Introduction To _______________(New York; Harper and Brothers, 195&)°
Smith, Ward R. The Status of Grade School Bands in Washington,(unpublished Masters Thesis: Montana State University, 1953). 39 pp.
-71'

APPENDIX
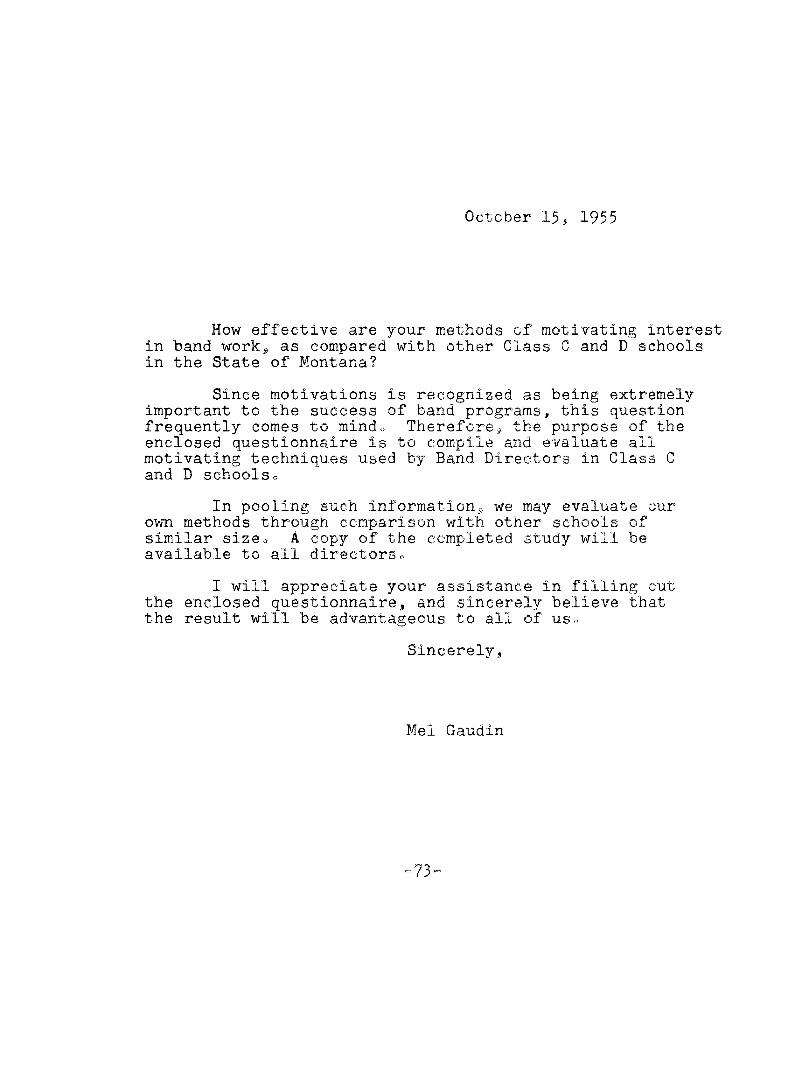
October 1$, 1955
How effective are your methods of motivating interest in band work, as compared with other Class C and D schools in the State of Montana?
Since motivations is recognized as being extremely important to the success of band programs, this question frequently comes to mindo Therefore, the purpose of the enclosed questionnaire is to compile and evaluate all motivating techniques used by Band Directors in Class C and D schools.
In pooling such information, we may evaluate our own methods through comparison with other schools of similar size. A copy of the completed study will be available to all directors.
I will appreciate your assistance in filling out the enclosed questionnaire, and sincerely believe that the result will be advantageous to all of us.
Sincerely,
Mel Gaudin
=73-
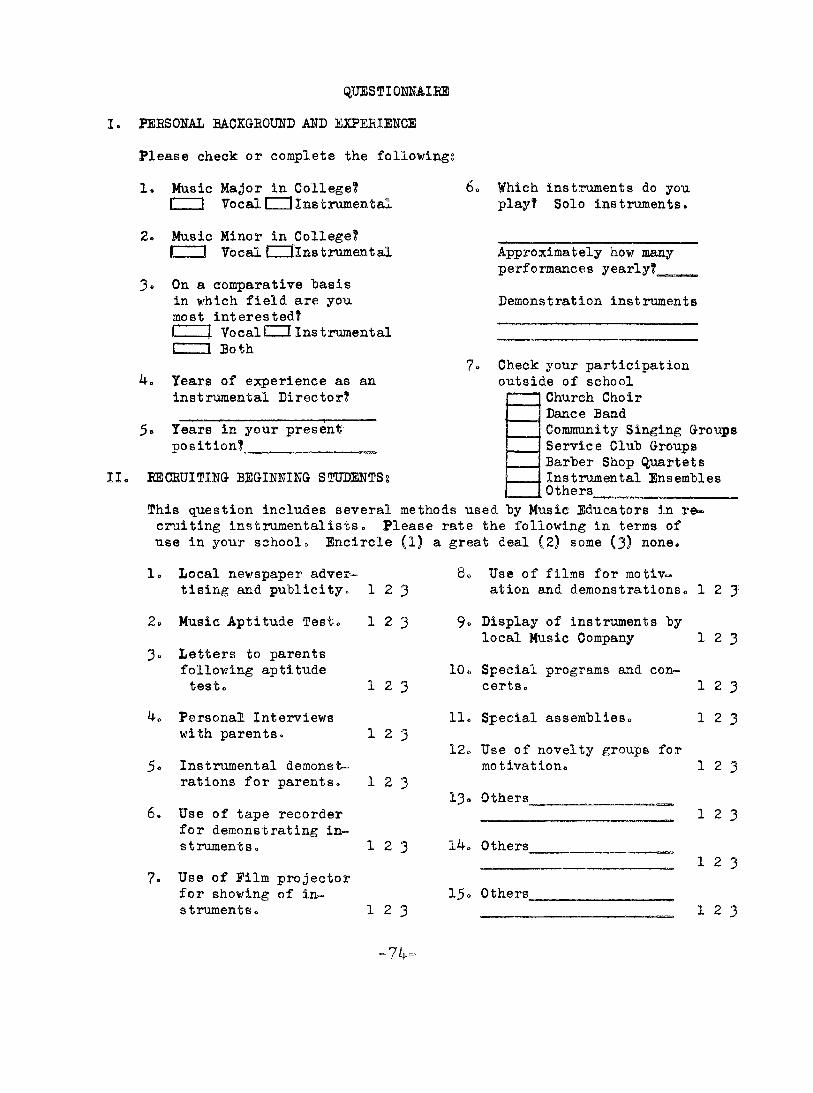
qUïîSTIOMAIEEI. PERSONAL MCKGEOUND M D EXPERIENCE
Please check or complete the followings1. Music Major in College?
I I Tocal CZH Instrumental2o Music Minor in College?
I I Vocalt JInstrumental3» On a comparative hasis
in which field are you most interested?I— I Vocal I 1 Instrumentalc m Both
4o Years of experience as an instrumental Director?
5o Years in your present position?_____ _
II, RECRUITING BEGINNING STUDENTS»,
6, Which instruments do you play? Solo instruments.
Approximately how many performances yearly?Demonstration instruments
Check your participation outside of school
Church Choir Dance BandCommunity Singing Groups Service Cluh Groups Barter Shop %uartets Instrumental Ensembles Others___
This question includes several methods used by Music Educators in re» cruiting instrumentalists. Please rate the following in terms of use in your school. Encircle (1) a great deal (2) some (3) none.1, Local newspaper adver
tising and publicity, 1 2 32» Music Aptitude Test, 1 2 33" Letters to parents
following aptitude test, 1 2 3
4, Personal Interviewswith parents, 1 2 3
5® Instrumental demonstrations for parents, 1 2 3
6. Use of tape recorderfor demonstrating instruments, 1 2 3
7, Use of Film projectorfor showing of instruments, 1 2 3
8c Use of films for motivation and demonstrations, 1 2 3
9. Display of instruments by local Music Company
10. Special programs and concerts,
11, Special assemblies,12. Use of novelty groups for
motivation,13, Others_
14, Others
15 o Others_
1 2 3
1231 2 3
123
123
123
1 2 3
74.
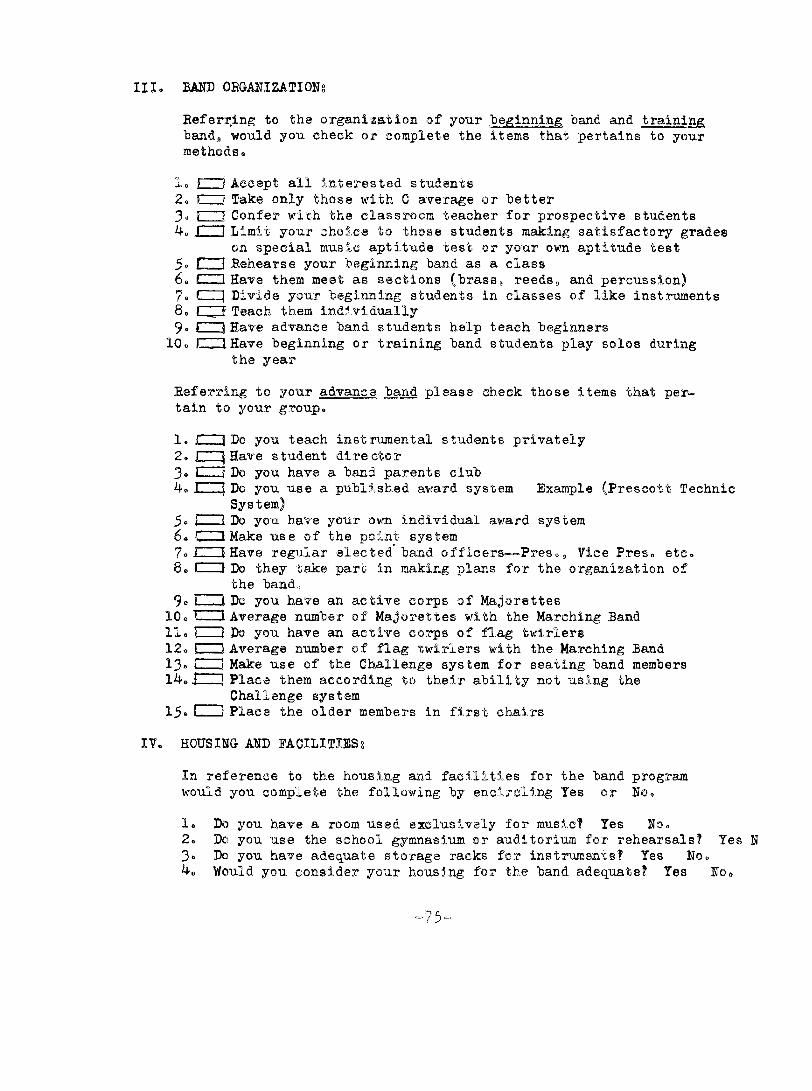
III. B M D ORGANIZATION;
Referring to the organisation of ycur beginning band and band, would you check or complete the items that pertains to your methods.
1. r~ I Accept all Interested students2. f 1 Take only those with C average or better3» i ! Confer with the classroom teacher for prospective students 4. rZTT Limit- your choice to these students making satisfactory grades
on special music aptitude test or your own aptitude test 5» f I Rehearse your beginning band as a class6. C- I Have them meet as sections (brass, reeds, and percussion)7. t . 1 Divide your beginning students in classes of like instruments8. I _ i Teach them individually9» > jHave advance band students help teach beginners10. fmUHave beginning or training band students play solos during
the yearReferring to your advance band please check those items that pertain to your group.1. I I Do you teach instrumental students privately2. 1 {Have student director3» I I Do you have a band parents club4. L Do you use a published award system Example (Prescott Technic
System)5» j I "ho you have your own individual award system6. L t Make use of the point system7. > j Have regular elected band officers— Pres., Vice Pres. etc.8. i— I Do they take part in making plans for the organization of
the band.,9o t. - tDo you have an active corps of Majorettes
10. Î 1 Average number of Majorettes with the Marching Band11. i I Do you have an active corps of flag twirlers12. I i Average number of flag twirlers with the Marching Band13.( I Make use of the Challenge system for seating band members14. i . ] Place them according to their ability not using the
Challenge system15» ! - I Place the older members in first chairs
IV. HOUSING AND FACILITIES;In reference to the housing and facilities for the band program would you complete the following by encircling Yes or No.1. Do you have a room used exclusively for music? Yes No.2. Do you use the school gymnasium or auditorium for rehearsals? Yes N3. Do you have adequate storage racks for Instruments? Yes No.4. Would you consider your housing for the band adequate? Yes No.
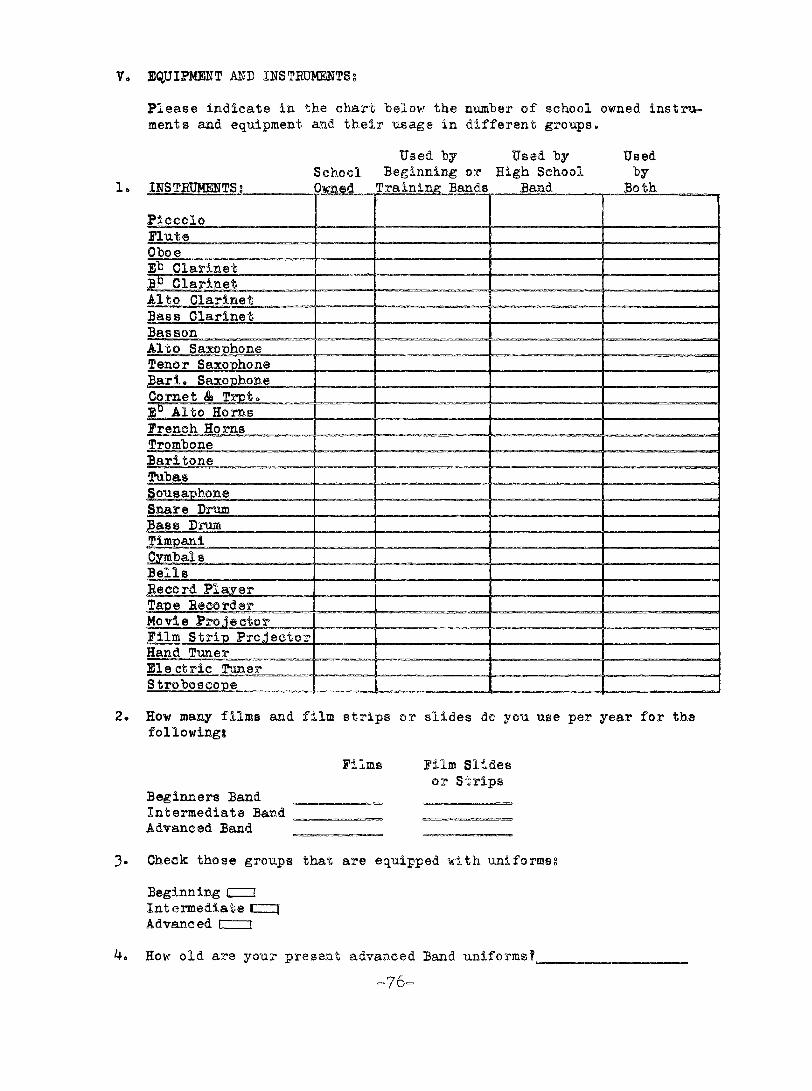
V. EQUIPMMT MD îïïSTEDMENTSs
2.
Please indicate in the chart helow the number of school owned instruments and equipment and their usage in different groups.
1. INSTRUMENTSUsed hy Used "by
School Beginning or High School Training Bands Band Both
PiccoloFluteOboeEh ClarinetAlto Clarinet Bass Clarinet BassonTenor Saxophone Bari. SaxophoneCornet & TFrench Horns Trombone Baritone TubasSousaphone Snare Drum Bass PromTimpaniBellsRecord PlayerTape RecorderFilm Strip ProjectorHand Tuner Electric Tuner StroboscopeHow many films and film strips or slides do you use per year for the following*
FilmsBeginners Band Intermediate Band Advanced Band
Film Slidesor Strips
3. Check those groups that are equipped with uniforms*Beginning Intermediate C Advanced ! 1
4. How old are your present advanced Band uniforms?,“7 6“
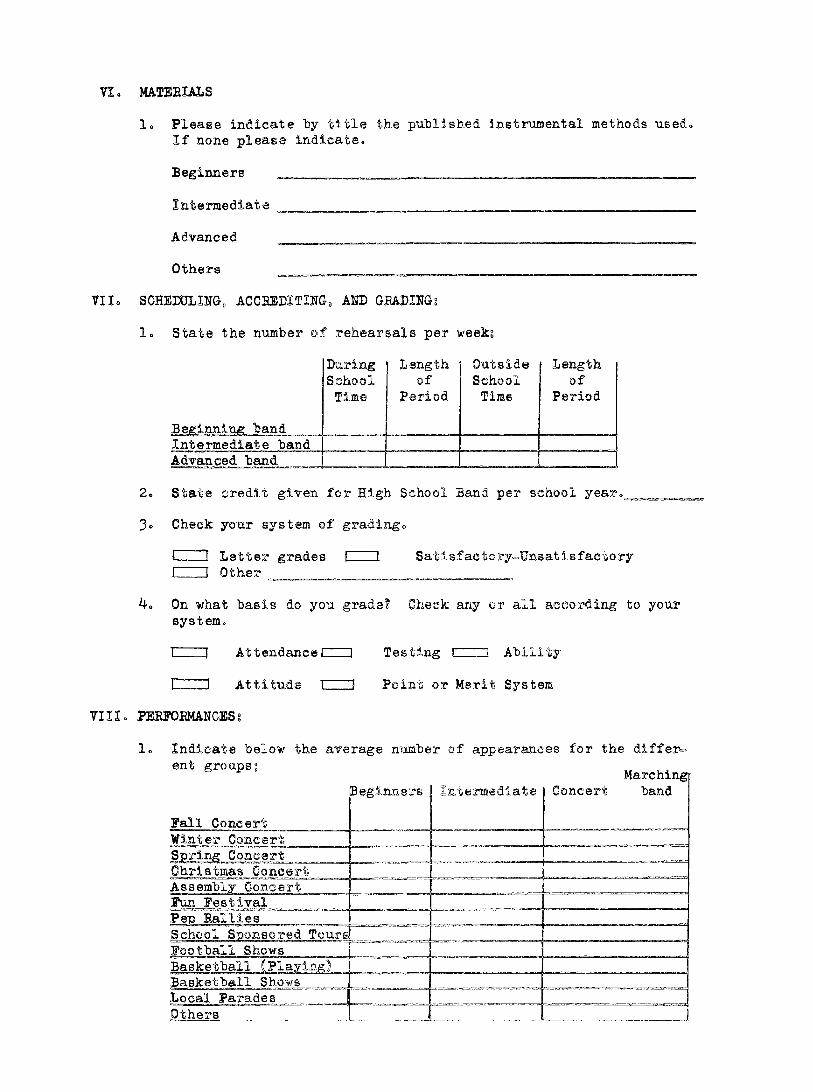
71. MATERIALS
711.
1. Please indicate "by title the published instrumental methods used. If none please indicate.Beginners _________________________________________________IntermediateAdvanced Others
SCHEDDIIHS, ACCREDITING, AND GRADING:1. State the number of rehearsals per weeks
During Length Outside LengthSchool of School ofTime Period Time Period
Beginning bandIntermediate band Advanced band
2.3»
State credit given for High School Band per school year. Check your system of grading.L.. I Letter grades I. 1 Other
Satisfactory-Unsatisfactory
4. On what basis do you grade? Check any or all according to your system.
AttendanceC Testing I i Abilityr I Attitude I I Point or Merit System
Till. PERFORMANCES:1. Indicate below the average number of appearances for the differ-
'■'* Marchingrmedlatei Concert bandBeginners
Fall ConcertWinter Concert Spring ConcertChristmas ConcertAssembly ConcertFun FestivalPep RalliesSchool Sponsored ToursFootball ShowsBasketball (Playing)Basketball ShowsLocal ParadesOthers
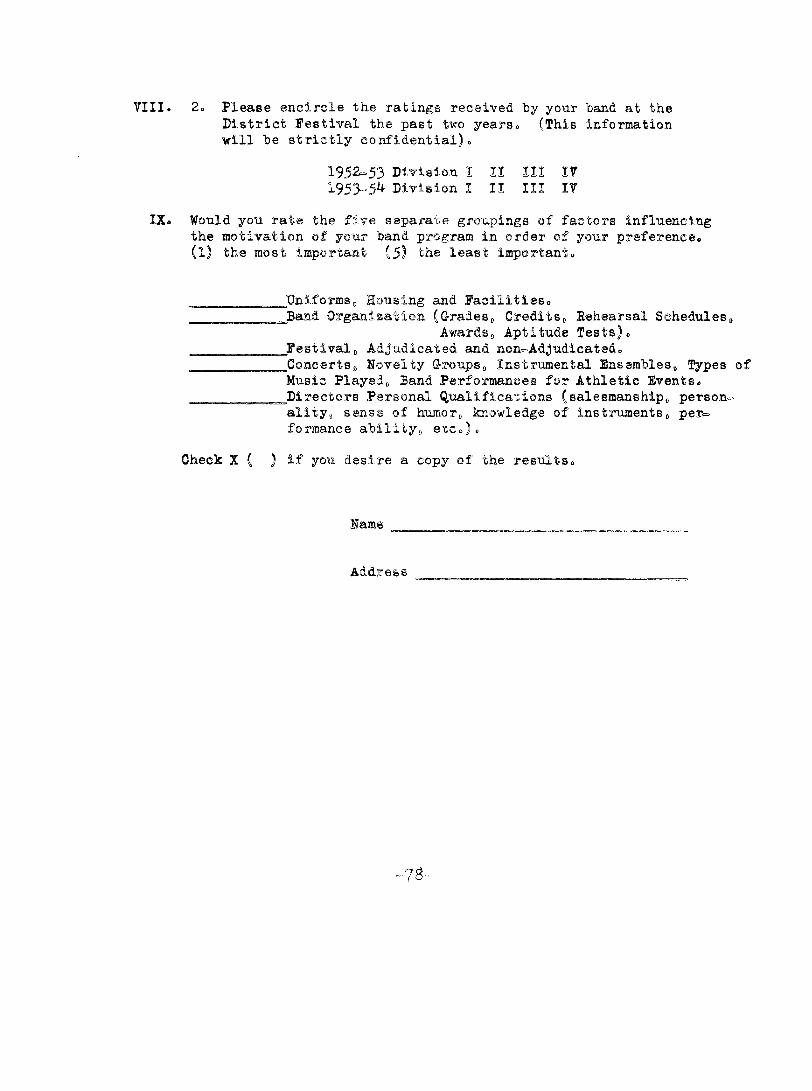
VIII o 2o Please encircle the ratings received by your band at the District Festival the past two years. (This information will be strictly confidential).
1952 .53 Division I II III IT 1953=54 Division I II III PT
IX. Would you rate the five separate groupings of factors influencing the motivation of your band program in order of your preference. (1) the most important (5) the least important.
JJniforms, Housing and Facilities.JBand Organization (Grades. Credits, Behearsal Schedules,
Awards, Aptitude Tests),^Festival, Adjudicated and non.Adjudicated.^Concerts, Novelty Groups, Instrumental Ensembles, Types of Music Played, Band Performances for Athletic Events._Directors Personal Qualifications (salesmanship, person. ality, sense of humor, knowledge of instruments, pen= fonuance ability, etc.).
Check X ( ) if you desire a copy of the results.
Address
Copyright © 2022 FDOKUMEN

