


Bahasa
Halaman
Hukum

Proceedings of 8th Windsor Conference: Counting the Cost of Comfort in a changing world Cumberland Lodge, Windsor, UK, 10-13 April 2014. London: Network for Comfort and Energy Use in Buildings, http://nceub.org.uk
Exploring the Dynamic Aspect of Natural Air flow on Occupants
Thermal Perception and Comfort
Harimi Djamila1, Chi Chu Ming
1, Sivakumar Kumaresan
1
1 Universiti Malaysia Sabah, School of Engineering and Information Technology
[email protected], Fax: +6088320348
Abstract
The main purpose of this paper is to review the effect of the dynamic aspect of natural air movement on
occupants’ thermal comfort. Recent advanced investigations addressed the dynamic aspect of air
movement in terms of turbulence intensity, probability distribution and power spectrum. This paper is
not only about providing a thorough description and discussion on the underlying physical mechanisms
of these factors, it is also about reviewing the effect of these parameters on occupants’ thermal
sensation, perception and comfort under different thermal conditions. Understanding the theoretical
aspect of the fluctuating air movement and how it affects occupant thermal comfort specifically under
hot-humid climatic conditions may yield to potential long-term savings and may reduce our demands
for fossil fuels.
Keywords: Review, thermal comfort, fluctuating air movement, turbulence intensity
Several researches have been carried out on reducing energy consumption in air-
conditioned spaces, but most of the investigations did not bring practical sustainable
solutions. Additionally, many negative effects were reported when using air-
conditioning such as “Non-adaptability of air conditioning”, “Sick building
syndrome” (Zhaoa et al., 2004). It has also been reported that the lack of stimulation
due to a constant air flow such in air-conditioned spaces may induce the workers to
become mentally disorientated and thereby decreasing their performance. Can some
negative effects be avoided? This question has been raised by some investigators in
building sector. Hara et al. (1997) stated that occupants do not usually feel well as
they feel when exposed to natural breeze. This is because the sudden enhancement of
heat flux movement from the human body causes a state of over-sense in thermal
sensation and relaxes the discomfort (EL-Bezri, 2011). Kang et al. (2013) elaborates
on this, fluctuating airflow brings more cooling effect to the human bodies, especially
the fluctuating airflow with a frequency similar to that of natural wind. This will
definitively helps in reducing energy consumption in air-conditioned buildings. In
short, this also should lead to better adaptability toward air-conditioning. This is
crucial in the humid tropics and in any location subjected to higher indoor air
temperatures. This is even more important when we just consider the effect of the
fluctuating air movement for passive cooling.
Several parameters were suggested and used to characterize natural and mechanical
air flow. The parameters that are widely recognised include the turbulence intensity,
probability distribution of air flow, in addition to spectral characteristics (Fanger et
al., 1998, Zhaoa et al., 2004; Hara et al., 1997; Arens et al. 1998; Kang et al., 2013)
and many others. However, little is known about how natural air movement affects
occupants’ thermal perception. Till today we still do not know the true nature of
natural air movement, and this precisely why several investigations over the world
were conducted in the first place and still carried out today. What are the most crucial
parameters that affect human desirability toward a specific natural air movement
compared to another natural air movement when most of the parameters hold
constants?
1 The Nature of the wind
In a macro-scale level, wind is the flow of a large body of air masses from the higher
to the lower pressure area due to a difference in atmospheric pressure. It is mainly
originated by temperature differences. The atmosphere has two distinct states of
motion: laminar (Flow in a parallel direction) and turbulent (No specific dominant
direction). Mixing occurs only in turbulent flow by dynamic mixing called turbulent
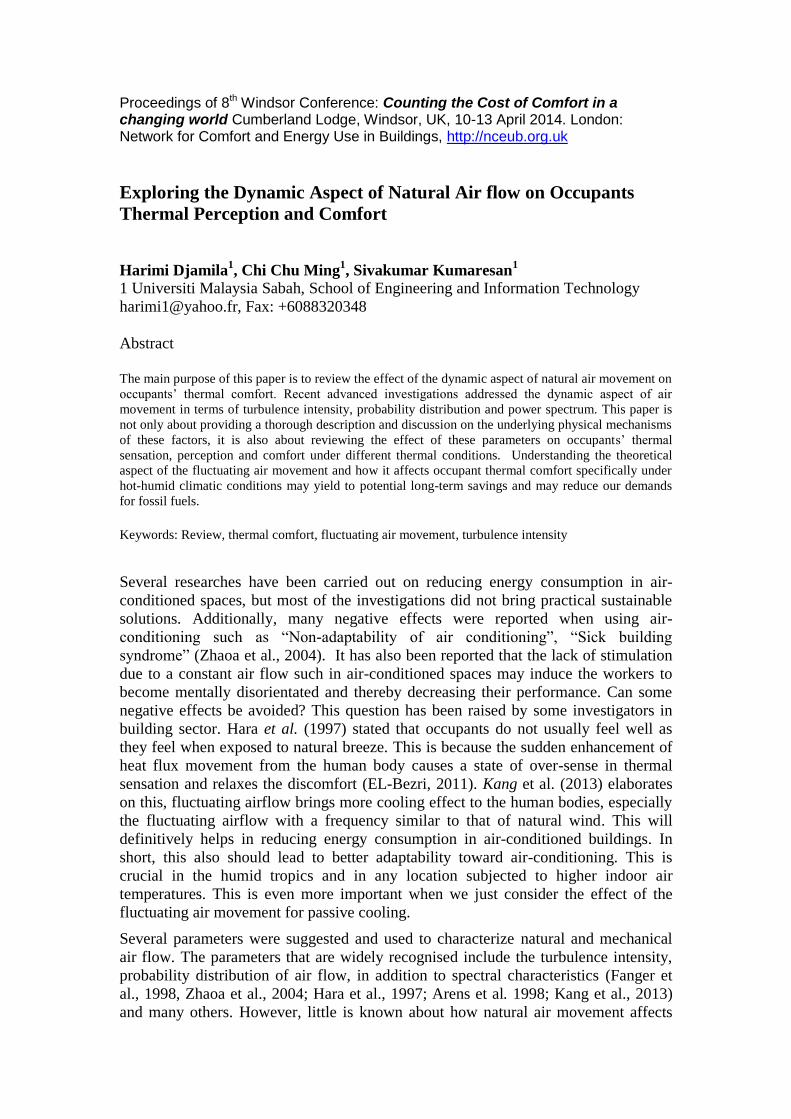
eddies. Figure 1 shows a drawing of turbulence flow by Leonardo da Vinci. Note that
part of the drawing has been removed for clarity.
Figure 1. Turbulent flow by Leonardo da Vinci (Storm)
On the surface of the Earth, the bulk movement of the air generates various winds
speeds which change frequently in direction (Youm et al., 2005). It can be spatially
and temporally described. Temporally, wind is characterized by long term and short
term fluctuations. Long term fluctuations include hourly, daily, seasonal, annual and
diurnal records. This will be discussed in section 4. Spatially, it is characterized by a
three dimensional vectors (Gavriluta et al., 2012). Two-dimensional vectors are for
describing the surface horizontal wind (i.e., East, West, North and South) and the
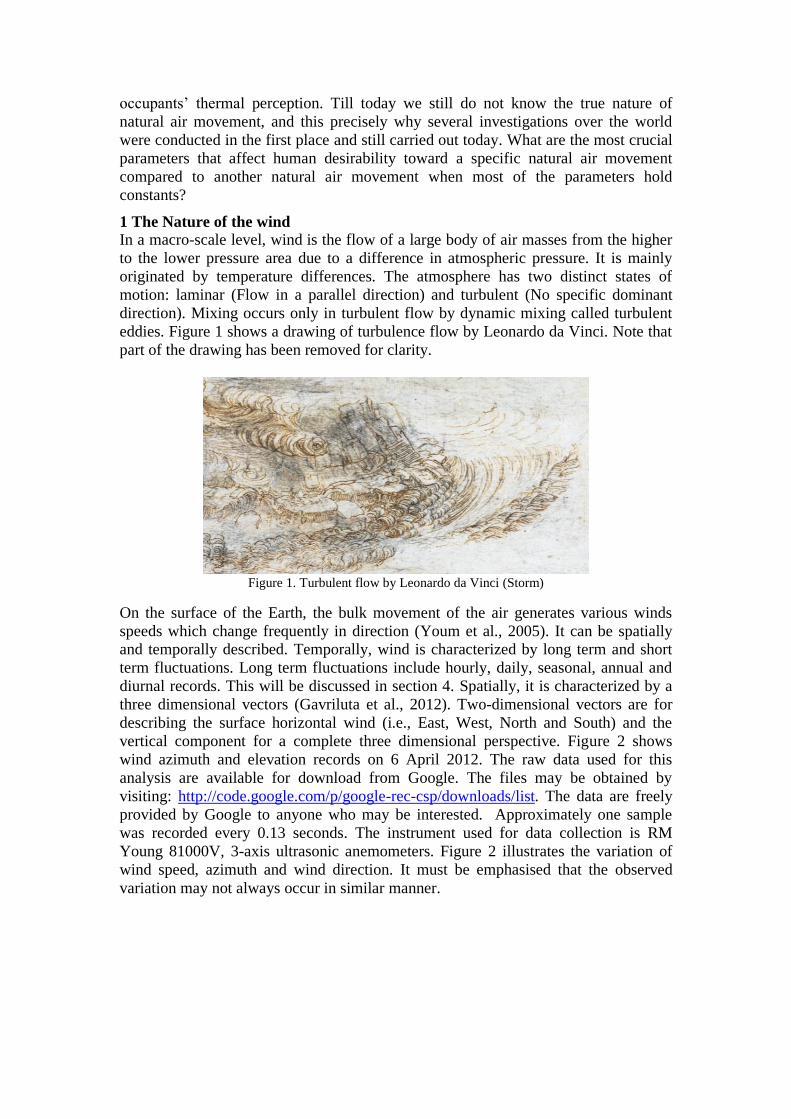
vertical component for a complete three dimensional perspective. Figure 2 shows
wind azimuth and elevation records on 6 April 2012. The raw data used for this
analysis are available for download from Google. The files may be obtained by
visiting: http://code.google.com/p/google-rec-csp/downloads/list. The data are freely
provided by Google to anyone who may be interested. Approximately one sample
was recorded every 0.13 seconds. The instrument used for data collection is RM
Young 81000V, 3-axis ultrasonic anemometers. Figure 2 illustrates the variation of
wind speed, azimuth and wind direction. It must be emphasised that the observed
variation may not always occur in similar manner.
Figure 2. Variation of wind speed, azimuth and elevation Sampling Interval is about 0.13s.
Wind Azimuth
Win
d E
leva
tion
Perc
en
t (%)
Wind Elevation
Wind Elevation
Win
d S
pee
d (m
/s)
Wind Elevation
Win
d S
pee
d (m
/s)
Elevation Azimuth
Win
d S
pee
d (m
/s)
Azimuth
(a) 657717 records (b) 657717 records
(c) 65772 records (d) 657717 records
) W
ind
Sp
ee
d (m
/s)
Elevation
(e) 65772 records
)
(f) 657717 records
(g) 65772 records
)
Azimuth
Win
d S
pe
ed
(m/s
)
(H) 657717 records
Azimuth
Win
d S
pe
ed
(m/s
)
The most striking feature of the observed variation in Figure 2 is the emerged
patterns. A close look at Figure 2(a) reveals a specific symmetrical shape. Figure 2(b)
provides further insight about the wind elevation. The variation of wind elevation was
within a narrow range. The highest probability record was observed for the wind
elevation of -12 degree. Data analysis revealed that the wind elevation was not
normally distributed. About 439 low and 2095 high outliers were found. This might
be occurred due to the presence of temporary objects which could distribute the wind
pattern or for other factors. When the wind elevation was plotted versus wind speed in
Figures (2c) and (2d), the obvious similarities between the two triangular shapes
related to the first 10 minutes and the 60 minutes records were observed. This
occurred despite the considerable differences in wind speed. For instance, the wind
speed records in the first ten minutes were far below 3m/s, whereas for the 60 minutes
records, the wind speed reached above 14m/s. Differences were also observed for the
wind elevation. The higher is the wind speed, the more is close to the horizontal
direction.
Fractals and chaos might provide a better interpretation of the results. Figure 2 (e)
reveals the similarities of the 3D scatter plot between azimuth, elevation and wind
speed. It is apparent that there are two grouped data which might exhibit similar
patterns. This was noted for the short record of the first 10 minutes, whereas the
situation is not the same for the one hour records. The same holds for Figures 2 (g)
and (h).
The effect of the wind speed; direction and elevation on humans’ thermal comfort
may need further investigations for better understanding of the effect of the dynamic
aspect of natural air movement on thermal comfort. This might be supported by
Fanger et al. (1988) statement:
“As in the studies by Fanger and Christensen a flow direction from behind the subject
was provided. This seems to be the direction at which humans are most sensitive...”
This also means that air movement may be perceived differently according to the
wind direction. Earlier, Fanger et al. (1974) found no influence of the direction of air
flow on creating thermal comfort. However, they found that the heat loss measured by
the thermal manikin was higher when the air motion was from front (Simone and
Olesen, 2013). One should be very careful for the conclusions made from experiments
carried out in a controlled environment. This is because; it might not be similar to the
field observation. In a nutshell external validation from field investigation is required.
Air movement as shown in Figure 2, can have several directions. It can be horizontal
or from bottom to top, or top to bottom. According to a literature related to leave
response to air movement in a controlled environment, it has been found that top to
bottom air in controlled-environment rooms will more closely mimic humidity and
temperature profiles found under field conditions (Robert et al., 1997).
It seems to be more interesting in thermal comfort research studies to mimic all the
known climatic parameters that may provide pleasant thermal sensation in a
controlled environment. This is because human being did not perceive air movement
separate from other climatic parameters. For instance wind might be perceived
draught in a cold environment but pleasant under hot environment. Figure 3 shows the
fast variation of wind direction for the selected short record.
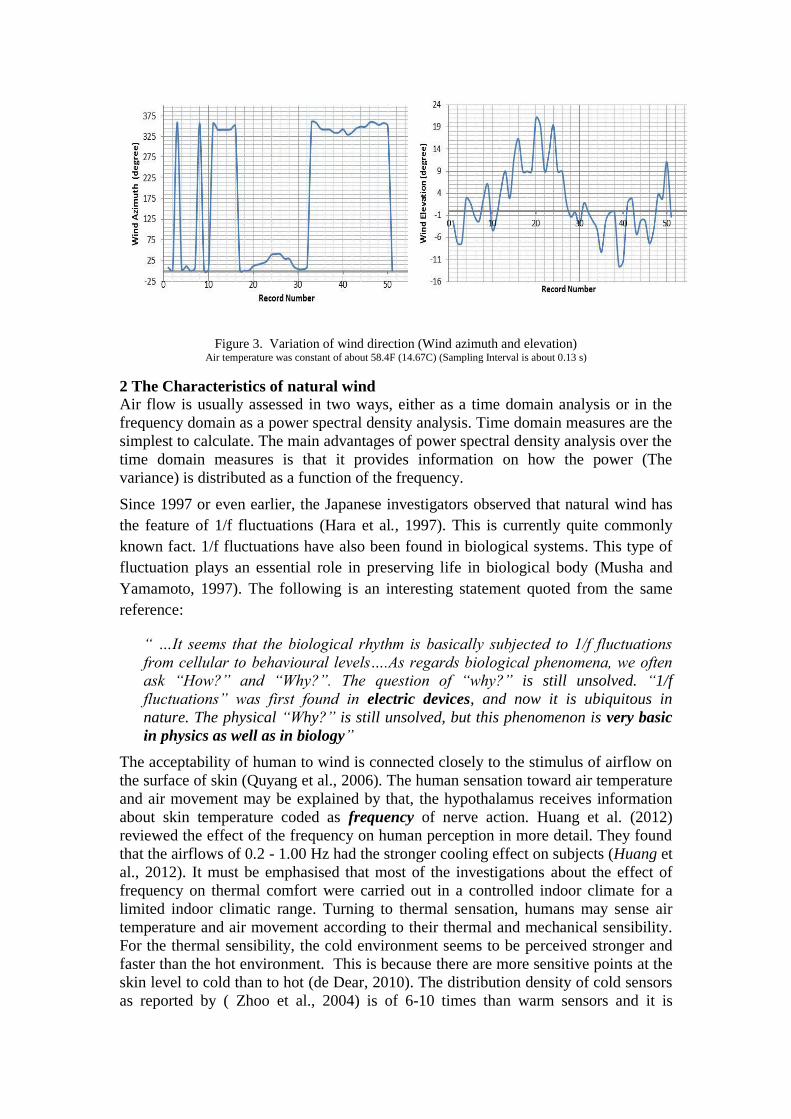
Figure 3. Variation of wind direction (Wind azimuth and elevation) Air temperature was constant of about 58.4F (14.67C) (Sampling Interval is about 0.13 s)
2 The Characteristics of natural wind
Air flow is usually assessed in two ways, either as a time domain analysis or in the
frequency domain as a power spectral density analysis. Time domain measures are the
simplest to calculate. The main advantages of power spectral density analysis over the
time domain measures is that it provides information on how the power (The
variance) is distributed as a function of the frequency.
Since 1997 or even earlier, the Japanese investigators observed that natural wind has
the feature of 1/f fluctuations (Hara et al., 1997). This is currently quite commonly
known fact. 1/f fluctuations have also been found in biological systems. This type of
fluctuation plays an essential role in preserving life in biological body (Musha and
Yamamoto, 1997). The following is an interesting statement quoted from the same
reference:
“ …It seems that the biological rhythm is basically subjected to 1/f fluctuations
from cellular to behavioural levels….As regards biological phenomena, we often
ask “How?” and “Why?”. The question of “why?” is still unsolved. “1/f
fluctuations” was first found in electric devices, and now it is ubiquitous in
nature. The physical “Why?” is still unsolved, but this phenomenon is very basic
in physics as well as in biology”
The acceptability of human to wind is connected closely to the stimulus of airflow on
the surface of skin (Quyang et al., 2006). The human sensation toward air temperature
and air movement may be explained by that, the hypothalamus receives information
about skin temperature coded as frequency of nerve action. Huang et al. (2012)
reviewed the effect of the frequency on human perception in more detail. They found
that the airflows of 0.2 - 1.00 Hz had the stronger cooling effect on subjects (Huang et
al., 2012). It must be emphasised that most of the investigations about the effect of
frequency on thermal comfort were carried out in a controlled indoor climate for a
limited indoor climatic range. Turning to thermal sensation, humans may sense air
temperature and air movement according to their thermal and mechanical sensibility.
For the thermal sensibility, the cold environment seems to be perceived stronger and
faster than the hot environment. This is because there are more sensitive points at the
skin level to cold than to hot (de Dear, 2010). The distribution density of cold sensors
as reported by ( Zhoo et al., 2004) is of 6-10 times than warm sensors and it is
unevenly distributed throughout the skin (Schacher et al., 2011). According to
Schacher et al. (2011), mechanical sensibility depends on numerous parameters such
as shape, surface, duration and intensity of the stimulus. Mechanical sensibility
toward air movement might correspond to the human response to pressure (Wind
speed), touch (might be related to our perception toward the fluctuating air
movement) and as well as to vibration solicitations (might be connected to frequency).
Natural phenomena as described by Francesc (2010) usually have variability that is
frequency dependent. The analysis of spectrum provides insight about the physical
mechanisms that are behind (Francesc, 2010). Power spectral analysis is widely used
in understanding the dynamic characteristics of airflow (Hara et al., 1997). It is
inversely proportional to the frequency. In fact, Kang et al. (2013) added further
insight about the term “1/f fluctuation”. It seems that (1/f) is also wisely used to
describe the mechanical air flow. They explained that
“Within the scientific literature, the term “1/f fluctuation” is sometimes used
more loosely to refer to any fluctuation with a power spectral density of the
form E(f) α 1/fβ, where f is the frequency and o<β<2, with β usually close to
one”
Wind spectrum breaks sample variance of time series up into pieces, each of which is
associated with a particular frequency. The function that describes turbulence as a
function of frequency is known as a “spectral density function”. It is defined as the
Fourier Transform of the autocorrelation sequence of the time series (Latawa, 2010).
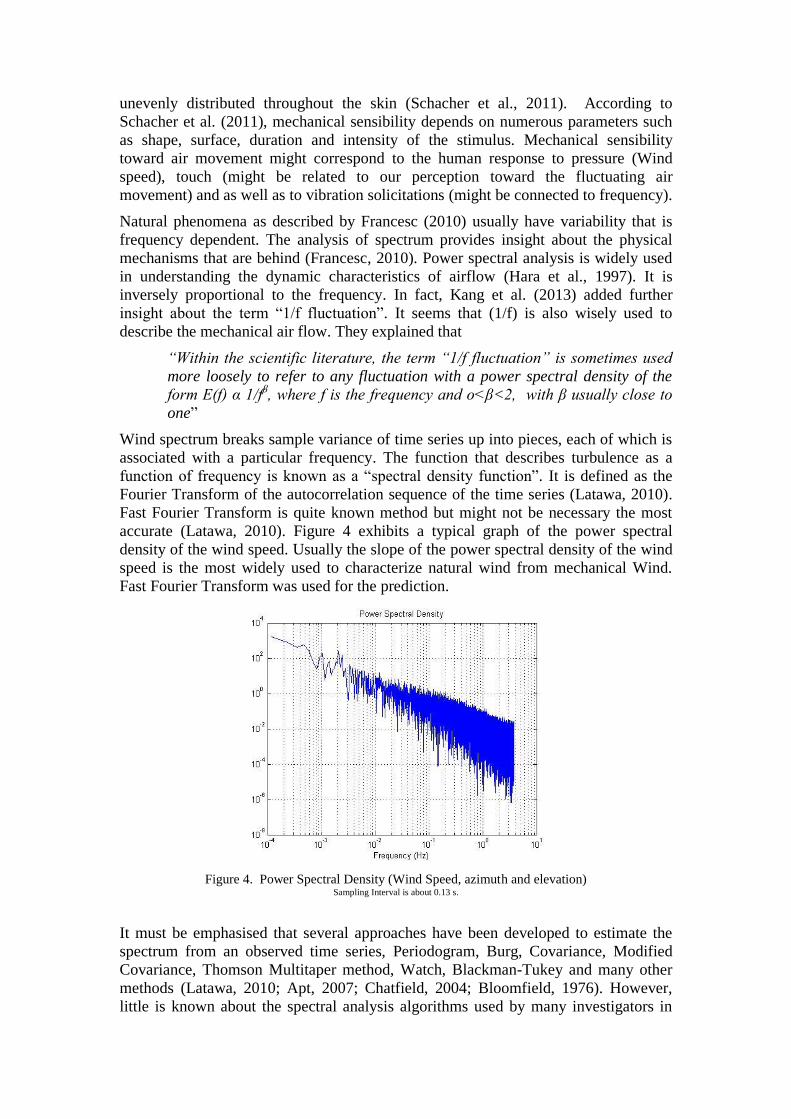
Fast Fourier Transform is quite known method but might not be necessary the most
accurate (Latawa, 2010). Figure 4 exhibits a typical graph of the power spectral
density of the wind speed. Usually the slope of the power spectral density of the wind
speed is the most widely used to characterize natural wind from mechanical Wind.
Fast Fourier Transform was used for the prediction.
Figure 4. Power Spectral Density (Wind Speed, azimuth and elevation) Sampling Interval is about 0.13 s.
It must be emphasised that several approaches have been developed to estimate the
spectrum from an observed time series, Periodogram, Burg, Covariance, Modified
Covariance, Thomson Multitaper method, Watch, Blackman-Tukey and many other
methods (Latawa, 2010; Apt, 2007; Chatfield, 2004; Bloomfield, 1976). However,
little is known about the spectral analysis algorithms used by many investigators in
characterising air movement. Therefore, it is hoped that this observation will be
considered so that comparison among studies will be meaningful. A clear systematic
accurate approach will certainly help to concentrate in solving other issues and
therefore advancing faster and better in thermal comfort science.
Returning back to the discussion about the differences and similarities between
natural and mechanical wind in built environment; Quyang et al. (2006) found that the
slope of the curves for natural wind was steeper than that of mechanical wind.
Further, Kang et al. (2013) also observed from their field investigation in a mountain
subjected to a hot and humid environment that comfortable wind has a steeper slope
compared to uncomfortable natural wind or mechanical wind (Beta comfortable>beta
uncomfortable). Thus we may assume that under hot humid conditions, the steeper is
the slope of the curve of the logarithmic power spectrum of the wind, the more is
desirable. It is necessary to highlight that the present assumption should not be
generalised for lack of validation. Quyang et al. (2006) observed that the slope of the
power spectral density (beta value) of the wind speed increased with the elevation of
the mean velocity. This is for the seashore case study only, but the two parameters
were not correlated for the following cases: outdoor open area, on the roof of the
building, around the building and indoors. The reasons of discrepancies were not
reported and seem to be unknown. Additionally, wind speed records for the
investigation carried out by Kang et al. (2013) were not normally distributed. Here,
we may raise an interesting question: How far such deviation from normality might
affect the estimated mean and therefore the conclusions made by the investigators?
Before passing to the next section, it must be emphasised that fractals, wavelet
transformations, phase reconstruction map and other complex methods for the
characterisation of the wind speed have been used by some investigators (Dear et al.
2013). However, due to the limitation of the space and the availability of the time
such complex methods will be reviewed in the future mostly from the available
English publications.
3 Mean Wind Speed versus Fluctuating Wind Speed
The wind speed at a fixed point can be divided in two components: the mean speed
and the fluctuating wind speed. The mean velocity is insufficient to describe
accurately humans’ thermal perceptions, specifically when subjected to a fluctuating
air movement. Earlier in 1973, Fanger stated the following:
“The mean air velocity and the air temperature are, of course, of importance for
convective heat transfer and they should be balanced according to the comfort
equation. But the mean velocity is not sufficient to explain the draught phenomenon.
Man can be comfortable at quite substantial air velocities (i.e., 1m/s) provided that
the ambient temperature is adjusted to a suitable level…. Other aerodynamic
magnitudes might be important….”
We may add the mean velocity is not also sufficient to explain the desirability
toward fluctuating air movement. Figure 5(a) shows the high variation of the mean
wind speed records for the selected sampling interval of one second. The selected
duration is one minute. Figure 5(b) depicts the smooth variation of the mean wind
speed for the selected sampling interval of ten minutes. The graph portrays the wind
variation during one hour.
The variation of the wind when considering the extreme lowest and highest values
(The height of the wave) reached up to 0.5 m/s within an interval of 40 seconds. This
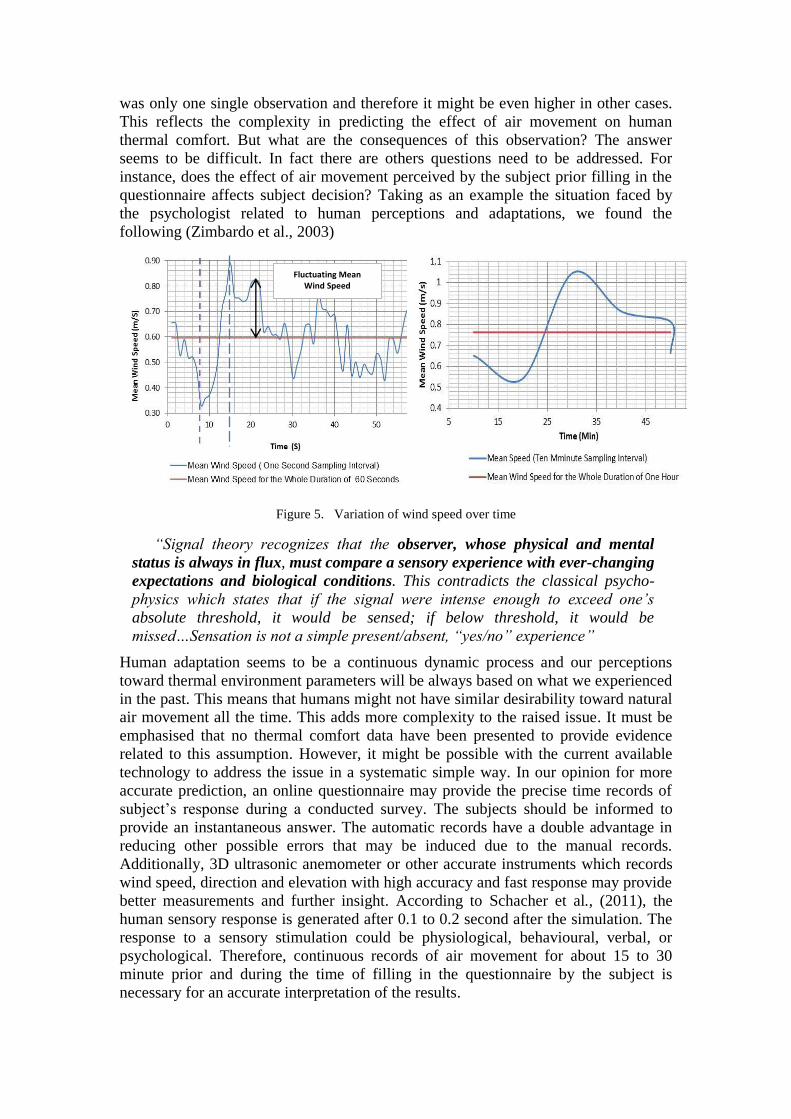
was only one single observation and therefore it might be even higher in other cases.
This reflects the complexity in predicting the effect of air movement on human
thermal comfort. But what are the consequences of this observation? The answer
seems to be difficult. In fact there are others questions need to be addressed. For
instance, does the effect of air movement perceived by the subject prior filling in the
questionnaire affects subject decision? Taking as an example the situation faced by
the psychologist related to human perceptions and adaptations, we found the
following (Zimbardo et al., 2003)
Figure 5. Variation of wind speed over time
“Signal theory recognizes that the observer, whose physical and mental
status is always in flux, must compare a sensory experience with ever-changing
expectations and biological conditions. This contradicts the classical psycho-
physics which states that if the signal were intense enough to exceed one’s
absolute threshold, it would be sensed; if below threshold, it would be
missed…Sensation is not a simple present/absent, “yes/no” experience”
Human adaptation seems to be a continuous dynamic process and our perceptions
toward thermal environment parameters will be always based on what we experienced
in the past. This means that humans might not have similar desirability toward natural
air movement all the time. This adds more complexity to the raised issue. It must be
emphasised that no thermal comfort data have been presented to provide evidence
related to this assumption. However, it might be possible with the current available
technology to address the issue in a systematic simple way. In our opinion for more
accurate prediction, an online questionnaire may provide the precise time records of
subject’s response during a conducted survey. The subjects should be informed to
provide an instantaneous answer. The automatic records have a double advantage in
reducing other possible errors that may be induced due to the manual records.
Additionally, 3D ultrasonic anemometer or other accurate instruments which records
wind speed, direction and elevation with high accuracy and fast response may provide
better measurements and further insight. According to Schacher et al., (2011), the
human sensory response is generated after 0.1 to 0.2 second after the simulation. The
response to a sensory stimulation could be physiological, behavioural, verbal, or
psychological. Therefore, continuous records of air movement for about 15 to 30
minute prior and during the time of filling in the questionnaire by the subject is
necessary for an accurate interpretation of the results.
Fluctuating Mean Wind Speed
Many anemometers are also available for instantaneous air movement measurements.
However the main limitation of most of them is that they do not necessary records air
movement accurately from all directions. The measurement error can reach up to 50%
according to the orientation of the hot-wire (Robert et al.,1997). The instrument
may interface with air movement which will affect the records.
Several crucial recommendations were provided in the reference by Robert et al.,
(1997) for the selection of the anemometers and therefore we will not repeat most of
the recommendations here. However, the calibration when using wind tunnels must be
addressed. It is widely accepted in thermal comfort investigations that wind tunnel
provide better calibration. Unfortunately, this is not always true. According to the
same reference, most wind tunnels operate poorly below 1 ms-1
. The reader may refer
to the authors’ publication (Open Access) for further insight about the why and also
for the selection of the most appropriate method for the calibration. A laser Doppler
anemometer can also be used to measure the velocity at a point in a flow using light
beams which does not disturb the flow being measured. This instrument provides
accurate measurements. Ultrasonic anemometer is also widely used device to evaluate
turbulent parameters such as mean air velocity, turbulence intensity and integral
length scale (López et al., 2011). The advantage of using an ultrasonic anemometer is
that, it can also test both the mean wind speed and the fluctuating component (Yin et
al., 2013). It allows also the measurement of very low air velocities as well.
3.1 Mean wind speed
The arithmetic mean value of wind speed has been widely used for investigating the
effect of air movement on occupants’ thermal comfort. In fact turbulence intensity
requires knowledge of the mean value for the selected period. However, a mean value
may not be the prevalent air movement. In addition, air movement in many cases is
not normally distributed. It is mostly skewed and therefore the predominant wind
speed might be lower than the mean value. The median estimate is preferred for non-
symmetrical distributions. However, transformation of the data might help in
correcting the degree of skewers prior estimation of the mean. The Weibull
distribution is well accepted and widely used for wind data analysis. Robin Roche
(2013) developed a Matlab script to compute the Weibull distribution parameters from
a wind speed time series. Some important recommendations and references can also
be found in the script. Therefore a preliminary data analysis might help to get better
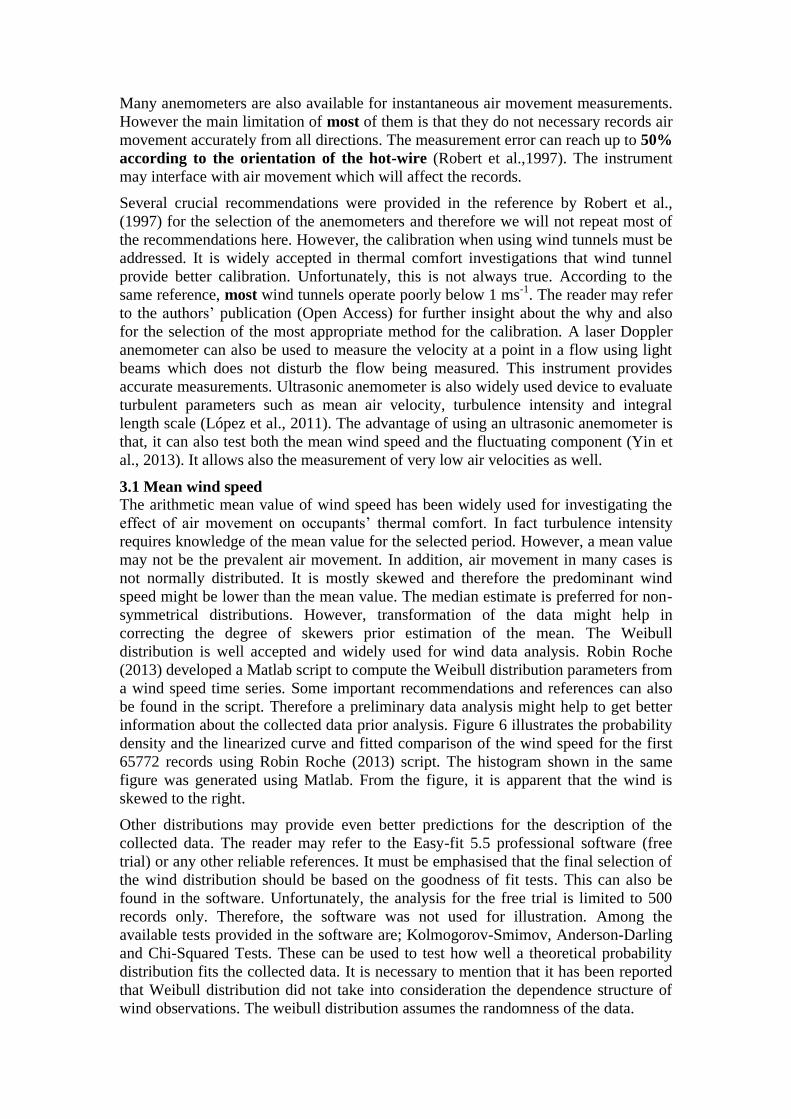
information about the collected data prior analysis. Figure 6 illustrates the probability
density and the linearized curve and fitted comparison of the wind speed for the first
65772 records using Robin Roche (2013) script. The histogram shown in the same
figure was generated using Matlab. From the figure, it is apparent that the wind is
skewed to the right.
Other distributions may provide even better predictions for the description of the
collected data. The reader may refer to the Easy-fit 5.5 professional software (free
trial) or any other reliable references. It must be emphasised that the final selection of
the wind distribution should be based on the goodness of fit tests. This can also be
found in the software. Unfortunately, the analysis for the free trial is limited to 500
records only. Therefore, the software was not used for illustration. Among the
available tests provided in the software are; Kolmogorov-Smimov, Anderson-Darling
and Chi-Squared Tests. These can be used to test how well a theoretical probability
distribution fits the collected data. It is necessary to mention that it has been reported
that Weibull distribution did not take into consideration the dependence structure of
wind observations. The weibull distribution assumes the randomness of the data.
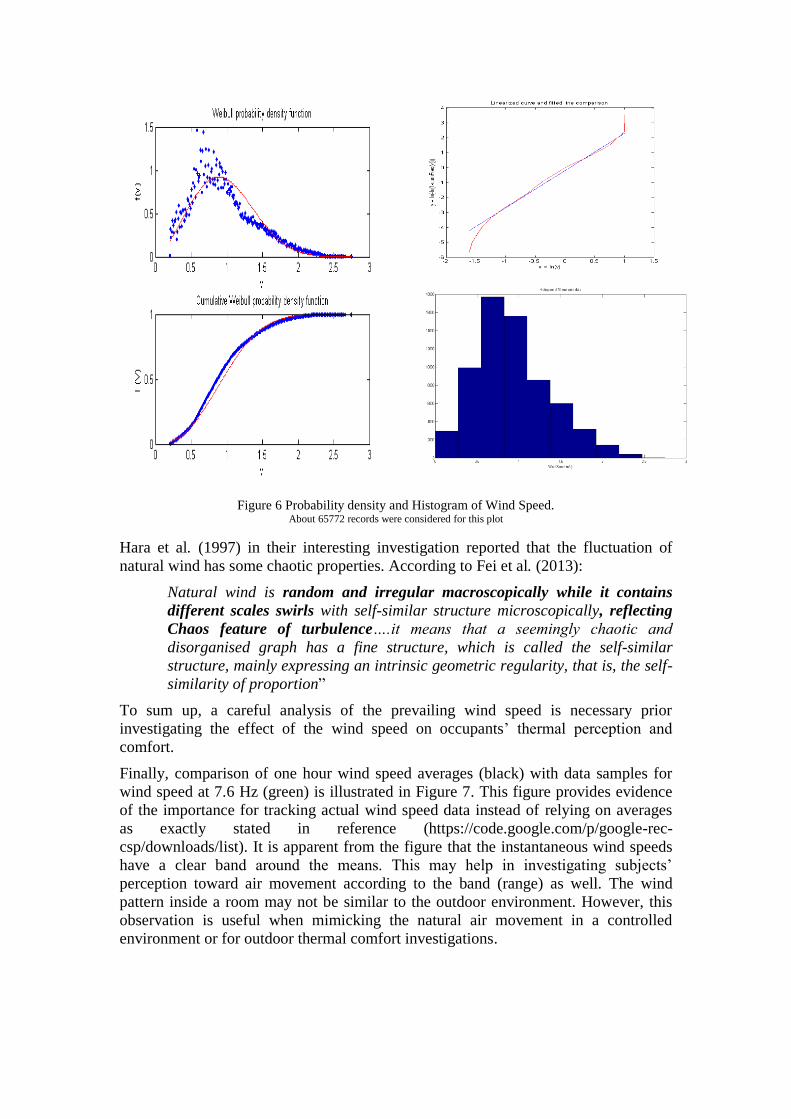
Figure 6 Probability density and Histogram of Wind Speed. About 65772 records were considered for this plot
Hara et al. (1997) in their interesting investigation reported that the fluctuation of
natural wind has some chaotic properties. According to Fei et al. (2013):
Natural wind is random and irregular macroscopically while it contains
different scales swirls with self-similar structure microscopically, reflecting
Chaos feature of turbulence….it means that a seemingly chaotic and
disorganised graph has a fine structure, which is called the self-similar
structure, mainly expressing an intrinsic geometric regularity, that is, the self-
similarity of proportion”
To sum up, a careful analysis of the prevailing wind speed is necessary prior
investigating the effect of the wind speed on occupants’ thermal perception and
comfort.
Finally, comparison of one hour wind speed averages (black) with data samples for
wind speed at 7.6 Hz (green) is illustrated in Figure 7. This figure provides evidence
of the importance for tracking actual wind speed data instead of relying on averages
as exactly stated in reference (https://code.google.com/p/google-rec-
csp/downloads/list). It is apparent from the figure that the instantaneous wind speeds
have a clear band around the means. This may help in investigating subjects’
perception toward air movement according to the band (range) as well. The wind
pattern inside a room may not be similar to the outdoor environment. However, this
observation is useful when mimicking the natural air movement in a controlled
environment or for outdoor thermal comfort investigations.
Figure 7 Sampled wind data at 7.6 hz (Green) vs 1-hour averages
(Source of this plot: https://code.google.com/p/google-rec-csp/downloads/list)
3.2 Turbulence intensity
Mean speed is often referred to as quasi-steady mean speed. Short term fluctuation is
mostly used for the description of the turbulence and wind gust over a short period of
time. It is typically less than 10 minutes (Francesc, 2010). Gust factor is referred to a
rapid increase in the strength of the wind relative to the mean strength at the time. It is
defined as the ratio between a peak wind gust and mean wind speed over a period of
time (Paulsen and Schroeder, 2005) which depends on gust duration. The longer is the
duration, the smaller will be the gust coefficient (Yin et al., 2013). It has been
reported that greater turbulence intensity is associated with the larger gust factor. It is
considered an important factor in addition to other statistical wind parameters to
describe the structure of the wind. Gust is highly reliant on the terrain characteristics
(Paulsen, Schroeder, 2005). However, it is the least considered in describing the
dynamic aspect of air flow in thermal comfort studies. The gust speed and direction
are defined by the maximum three second average wind speed occurring in any period
(NMLA, 2013). It is sampled at high frequency (0.25sec) to catch the intensity of
gusts which are described as short-lived peaks in speed. These cause greatest damage
in storm. Wind direction, speed and gustiness are generally determined
instrumentally. According to U.S. weather observing practice, gusts are reported
when the peak wind speed reaches at least 16 knots (8.2 m/s) and the variation in wind
speed between the peaks and lulls (lulls means calm: a period without waves or wind)
is at least 9 knots (4.6 m/s). The duration of a gust is usually less than 20 seconds
according to the same source. However, such wind intensity is of no interest in
thermal comfort field investigations.
A turbulence flow is mostly defined as a continuous three dimensional flow of many
dynamic moving eddies (vortices) of different sizes and strengths reflecting chaos
feature of turbulence (Yin et al., 2013). Turbulence occurs due to wind shear which
arises in the boundary between air volumes with different velocity. Turbulence may
also occur due to mechanical forces between the moving air and an obstacle (i.e.
friction with the ground surface, barrier such building and forest, topography of the
site, water). This results in deflection of the flow of the air (Nicole, 2011). Convection
affects the turbulence of air flow (Hoven, 1957) due to the thermal effects that causes
air to move vertically. The fluctuations occur in all the three directions (Francesc,
2010).
Turbulence intensity is also defined as the ratio of the standard deviation of velocity
to the mean velocity for a given time history of air velocity (Aynsley 2008). It is often
multiplied by 100 to give a percentage expression (Marcel, 1998). An idealized flow
of air with absolutely no fluctuations in air speed or direction would have a
Turbulence Intensity value of 0%. Because the turbulent motions associated with
eddies are approximately random, we can characterize them using statistical concepts.
Statistically, the turbulence intensity is defined as the standard deviation by the mean
velocity (Fanger et al., 1988)
√
Where
is the standard deviation.
v’ is the instantaneous air velocity
is the mean wind speed
Looking at this equation, it can be seen that the larger the mean air movement is, the
larger the denominator will be and therefore the turbulence intensity will be smaller.
So what sample size would be recommended in thermal comfort field investigations?
So, it depends on the effect that is being investigated, however ten minutes are widely
used in estimating turbulence intensity. Hara et al. (1997) made an important
conclusion from their research investigation which was that the rapid increasing wind
velocity was found to be more comfortable than slowly increasing one. Of course, this
seems to be in agreement with common sense as well. One may need just to drive a
car in a windy hot day to understand how rapid increase in air movement provides a
desirable sensation. The sudden or rapid variation in air movement (from extreme
minimum to extreme maximum in a very short period of time) probably might not be
well described by turbulence intensity. This is because the standard deviation provides
an average fluctuation above or below the mean. Further investigation in that direction
is worth pursuing in a more focussed study
4. Conclusions
Many observational studies have been conducted for exploring the characteristics of
air flow based on short and long term observations. Exploring the characteristics of air
flow on human thermal perception is of interest of thermal comfort field
investigations and was the main objective of this review. The following are the main
conclusions:
(1) The mean velocity is not sufficient to explain the desirability of subjects’
thermal perceptions toward natural air movement.
(2) The arithmetic mean value of wind speed has been widely in thermal comfort
studies. Air movement might not be normally distributed. The knowledge of
the distribution of the data is important before data analysis.
(3) Wind direction and elevation were very seldom considered in thermal comfort
field investigations. Those parameters require further investigation.
(1)
(4) Turbulence intensity may not describe fully the sudden increase of the
fluctuating air movement on humans’ thermal perceptions. Further
investigation in that direction is worth pursuing in a more focussed study.
Acknowledgements
The authors wish to thank google.org for making the wind speed records available
from which Figures 2 to 6 were made.
The work of this paper is financially supported by the Universiti Malaysisa Sabah
(SBK0083-TK-2013)
References
Arens, E., Xu, T., Miura, K., Hui Z., Fountain, M. and Bauman, F., 1998. A Study of
Occupant Cooling by Personally Controlled Air Movement. Energy and Buildings,
27, pp 45-59.
Aynsley, R. 2008. Air Movement for Energy-Efficient Summer Comfort: GreenCE,
Inc.
Apt, J., 2007. The Spectrum of Power from Wind Turbines. Journal of Power Sources,
169, pp 369-374.
Bloomfield., 1976. Fourier Analysis of Time Series. Canada: John Wiley & Sons.
Chatfield, C., 2004. The Analysis of Time Series, sixth edition: New York, Chapman
& Hall/CRC.
Chiang, H.C, Pan, C. S., Wu, H.S. and Yang, B.C., 2007. Measurement of Flow
Characteristics of a ceiling Fan with Varying Rotational Speed. Proceedings of Clima
2007 WellBeing Indoor, Helsinki, Finland.
de Dear, R. 2010. Thermal Comfort in Natural Ventilation - A Neurophysiological
Hypothesis. Windsor Conference: Adapting to Change: New Thinking on Comfort.
London, Cumberland Lodge, Windsor, UK, 9-11 April 2010, Network for Comfort
and Energy Use in Buildings..
EL-Bezri, M. O., 2011. The influence of Wind on Outdoor Thermal Comfort in the
City of Beirut: A theoretical and Field Study. Msc. American University of Beirut.
Fanger, P.O., 1973. Assessment of Man’s Thermal Comfort in Practice. British
Journal of Industrial Medecine, 30, pp 313-324.
Fanger, P.O., Ostergaard, J., Olesen, S., Lund Madsen, T.H., 1974. The effect on
Man´s Comfort of a Uniform Air Flow from Different Directions. ASHRAE
Transaction, 2, pp142-157
Fanger, P.O, Melikov, A.K., Hanzawa, H. and Ring, J., 1988. Air Turbulence and
Sensation of Draught. Energy and Building, PP 21-39.
Francesc, A. J., 2010. Wind Power Emulator for Energy Storage. Master Thesis
Report, Aalborg Universitet, Denmark.
Gavriluta, S., Spataru, I., Mosincat, C., Citro, I., Candela, P., Rodriguez, 2012.
Complete Methodology on Generating Realistic Wind Speed Profiles Based on
Measurements. International Conference on Renewable Energies and Power Quality,
Santiago de Compostela, Spain, 28-30 March, 2012. European Association for the
Development of Renewable Energies, Environment and Power Quality
Hara, T., Shimizu, M., Iguchi, K. and Odagiri, G., 1997. Chaotic Fluctuation in
Natural Wind and its Application to Thermal Amenity. Nonlinear Analysis, Theory,
Methods and Applications, 30, pp 2803-2813
Hoven, I.V.D., 1957. Power Spectrum of Horizontal Wind Speed in the Frequency
Range from 0.0007 to 900 Cycles per Hour. Journal of Meteorology, 14, pp 160-164
Huang, L., Quyang, Q. and Zhu, Y., 2012. Perceptible Airflow Fluctuation Frequency
and Human Thermal Response. Building and Environment , 54, pp, 14-19
Kang, K., Song, D. and Shiavon, S. 2013. Correlations in Thermal Comfort and
Natural Wind. Journal of Thermal Biology , 38, pp 419-426
Latawa Anchali, 2010 . Estimation of Power Spectral Density in Different Frequency
Bands. MSc, THAPAR University.
López A., Valera D. L., and Molina-Aiz F., 2011. Sonic Anemometry to Measure
Natural Ventilation in Greenhouses. Sensors , 11, 9820-9838
Marcel L. 1998. The Measurement and Simulation of Indoor Air Flow. PhD Thesis.
Eindhoven University of Technology.
Musha, T., and Yamamoto, M., 1997. 1/f Fluctuations in Biological Systems.
Proceedings – 9th International Conference –IEEE/EMBS. Chicago, 30 Oct-2 Nov
1997. Engineering in Medicine and Biology Society.
Nicole C., 2011. Turbulence Intensity in Complex Environments and its Influence on
Small and Wind Turbines. Sweden: Nicole Carpman and the Department of Earth
Sciences, Uppsala University.
NMLA (The National Meteorological Library and Archive). Weather Observations
over Land (Vertion 01). WWW.Metoffice.gov.uk/learning/library. Retrieved from
Internet Dec 2013.
Paulsen, B. M., Schroeder, 2005. An Examination of Tropical and Extra-tropical Gust
Factors and the Associated Wind Speed Histograms. J. Appl. Meteor., 44, pp 270–
280.
Quyang, Q., Dai, W., Li, H. and Zhu, Y. 2006. Study on Dynamic Characteristics of
Natural and Mechanical Wind in Built Environment using Spectral Analysis. Building
and Environment, 41, PP 418-426
Robert, J.D., and Donald, T.K. 1997. Air Movement, In: Plant Growth Chamber
Handbook, Langhans and Tibbitts (Ed.), IOWA State University of Science and
Technology.
Robin Roche., 2013. Computing Weibull Distribution Parameters from a Wind Speed
Time series: Matlab Central,
http://www.mathworks.com/matlabcentral/fileexchange/41996-computing-weibull-
distribution-parameters-from-a-wind-speed-time-series/content/weibull_distrib.m
Schacher, L., Bensaid, S., Jeguirim, S.E., Adophe, D., 2011. Sensory and
Physiological Issues, Advances in Modern Woven Fabrics Technology, Dr. Savvas
Vassliadis (Ed.), In Tech.
Simone and Olesen, 2013. Preferred Air Velocity on Local Cooling Effect of desk
Fans in Warm environment. Proceedings of 3th AIVC- 4th TightVent- 2nd venticool
Joint Conference, Athens, 25-26 September.

Yin, F., Zhou, J., S., Zhang, G., 2013. Study on Unsteady Characteristics and Field
Measurement of Natural Wind. APEC Conference on Low-carbon Towns and
Physical Energy Storage Changsha, China, 25-26 May 2013. ACLE
Youm, J., Sarr, M., Sall, A., Ndiaye and Kane, 2005. Analyses of Wind Energy along
the Northern Coast of Senegal. Rev.Energ. Ren, 8 pp 95-108.
Zhaoa, R., Sunb, S., Dingc, R., 2004. Conditioning Strategies of Indoor Thermal
Environment in Warm Climates. Energy and Buildings, 36, pp 1281–1286.
Zimbardo, P.G., Weber, A.L. and Johnson, R.L., 2003. Psychology Core Concepts.
Boston: Philip Zimbardo.
Top Related
Copyright © 2022 FDOKUMEN

