


Bahasa
Halaman
Hukum

1
Tourism Analysis, Vol. 17, pp. 1–000 1083-5423/12 $60.00 + .00Printed in the USA. All rights reserved. DOI: http://dx.doi.org/10.3727/108354212X13485873913921Copyright © 2012 Cognizant Comm. Corp. www.cognizantcommunication.com
ExpEriEncE quality in thE diffErEnt phasEs of a
tourist vacation: a casE of northErn norway
NINA K. PrebeNSeN,* eUNjU WOO,† jOSePh S. CheN,‡ AND MUzAffer UySAl†
*Tromsø University business School, University of Tromso, breivika, Norway†Department of hospitality and Tourism Management, Pamplin College of business,
Virginia Polytechnic Institute & State University, blacksburg, VA, USA‡Department of recreation, Park and Tourism Studies, Indiana University at bloomington,
bloomington, IN, USA
The overall goal of this study is to explore the relative importance different groups of tourists give to the vacation experience phases (pretrip, en-route, and on-site experiences). by clustering the tourist by their motivation and subsequently testing the relative importance given to the various trip phases, the idea is to get new knowledge in terms of quality perceptions of the different phases of a journey, not only on-site experiences for different tourist segments. The tourist journey is divided into three phases: pretrip experience, en-route trip experience, and destination on-site experiences. factor anal-ysis of motivation items resulted in four groupings of motivation factors: “Personal enrichment,” “escape,” “Socialization,” and “family togetherness.” Cluster analysis based on factor scores of the motivation items identified two segments. Segment I included 161 respondents (28% of the sampled visitors); Segment II contained 418 (72% of the sampled visitors). The two motivation-based seg-ments were then examined and profiled with quality elements of the three trip phases, visitor’s demo-graphic, and behavior variables. The results show that tourists value the various phases of the journey differently based on their motivation to travel. The study results are discussed in terms practical implication for the tourism industry to enhance the total experience quality of a journey by including all the phases of a vacation trip.
Key words: Motivation; Pretrip experience; en-route experience; Destination on-site experience; factor analysis; Cluster analysis
Address correspondence to Nina K. Prebensen, Ph.D., Tromsø University business School, University of Tromso, breivika, Norway. e-mail: [email protected]
Introduction
When a tourist is motivated to take a vacation trip, the process of deciding, planning, and organiz-ing the trip starts, followed by the transportation to
the destination where the vacation is enjoyed; obvi-ously, the tourist vacation experiences include more than the on-site experience (Clawson & Knetsch, 1966; Killion, 1992). Dependent on their motivation, the pretrip and en-route phases of a
TA17-5_671.indd 1 10/17/2012 9:35:47 AM
2 PrebeNSeN eT Al.
vacation trip are often seen by tourists as a way of enhancing the perceived quality of the on-site expe-rience, even though these phases might have their own merits for contributing to the enjoyment of the trip process. Others prefer less planning, due to various elements such as lack of time, previous experiences and travel skills, or/and they do not mind taking risks. however, most tourists need to cope with various on-site situations in order to enhance the quality of their vacation experience, even though they have planned the trip beforehand (Prebensen & foss, 2011). Despite the recognition of the various phases of a vacation trip in time and space, more research on the various phases (i.e., pretrip, on-route, on-site) of tourist experiences linked to their travel motivation would help to bet-ter understand the process of experience quality for the tourists. This knowledge would provide insights for research in terms of pinpointing quality-enhanc-ing elements as part of all the phases of a vacation trip and subsequently enhance knowledge about tourist quality perceptions as an integrated con-struct in tourism behavior. for tourism manage-ment, this knowledge will help identify the relative importance of the various phases of a journey for various tourist groups and to provide or accommo-date quality-enhancing elements on the various phases of the journey in order to meet the custom-ers’ needs and wants in a satisfying way. hence, the present work aims to include the whole vaca-tion experience, by including pretrip, en-route, and on-site phases of tourist experiences, and to test the relative importance given to the different phases based on the motivation segment. Thus, the per-ceived importance of the aforementioned phases of vacation experiences based on travel motivation needs to be linked to the nature of existing possible segments of the travel market.
A variety of descriptors have been employed to segment and understand similarities and differ-ences between different market segments (Dolnicar, 2008). These descriptors include demographic vari-ables (e.g., gender, age), socioeconomic variables, travel variables (e.g., motivation, benefit sought), psychographic variables (e.g., personality types), and situational variables (e.g., seasonality of visita-tion patterns and origin of visitors) (Sirakaya, Uysal, & yoshioka, 2003). however, such descrip-tors as evaluation of tourism experience with
respect to pretrip experience, en-route trip experi-ence, and destination on-site experience are not typically included in profiling segments.
It is commonly accepted and substantiated that the tourism industry greatly benefits from market segmentation based on motivation (Crompton, 1979). The scholarly tourism literature is replete with such studies that support the notion. The rea-son is that motivation as part of travel behavior pro-vides insights that destination marketers can use in developing and promoting unique tourism experi-ences. It is considered the “driving force behind all behavior” (fodness, 1994). Therefore, understand-ing consumers’ motives is a key prerequisite to cre-ating and offering tourism experiences to particular target markets (Park, reisinger, & Kang, 2008). On the other hand, the notion of quality tourism experi-ence as a construct is also part of travel behavior, which is defined as the tourist’s perception of the degree of quality of their tourism experience related to products and service received during different phases of the entire vacation process (jennings & Nickerson, 2006). In a similar way Meng (2006) defines quality of tourism as the tourists’ percep-tion of the degree of the pleasantness or satisfaction of their experience related to the product and ser-vices received during different phases of the entire vacation process. further, tourism experience has been approached from the chronological perspec-tive and is seen as a multiphase phenomenon: pretrip planning, en-route phase (travel to the desti-nation and return travel), and destination on-site phase (jennings & Weiler, 2006; Meng, 2006). Quality elements regarding the different phases of a journey can be utilized in order to acknowledge the whole value process of a trip. Accordingly, both definitions are useful for the approach in this par-ticular work.
Although a number of studies on segmentation have been conducted and profiled tourist character-istics based on motivation, little research has focused on the perceived quality of all the phases of a tourist journey across different segments. There-fore, the objectives of this study are to understand the underlying dimension of motivation; to cluster visitors based on motivation; and to investigate their characteristics and quality-enhancing ele-ments of the various phases of a journey. Thus, the following section presents related arguments
TA17-5_671.indd 2 10/17/2012 9:35:47 AM
QUAlITy Of VACATION eXPerIeNCe PhASeS 3
and discussions on segmentation and quality of trip experience.
literature reviewsSegmentation
Market segmentation is a management market-ing tool and strategy to divide a heterogeneous market into homogeneous subgroups and to profile attendees (Allen, O’Toole, harris, & McDonnell, 2008; Getz, 2007; W. Smith, 1956) in order to understand how each subgroup has different spe-cial needs and wants (Mok & Iverson, 2000). Therefore, segmentation is a very useful process of dividing a total market into subgroup or segments for meeting management purpose (Middleton, 1994). Market segmentation is usually distinguished by different consumer needs, characteristics, or behav-ior; therefore, it allows organizers to define visi-tors’ needs and wants more precisely. Moreover, it also maximizes return on investment by targeting the most profitable attendees (Dolnicar, 2008; Getz, 2007). In other words, segmentation is an effective way to meet identified demand and to increase cost effectiveness in the marketing process.
Various methods of tourist segmentation have been applied, including a posteriori or factor-clus-ter segmentation, a priori or criterion segmentation, and neural network models (Mazanec, 1992). Traditionally, researchers use either the a priori ora posteriori segmentation approach when segment-ing groups among the general population (Calantone & Mazanec, 1991). A priori segmentation is based on attributes (descriptors) selected based on the researcher’s prior knowledge of the existing seg-ments. That is, when the segments were already known, a segmentation basis (such as gender or in-state visitors vs. out of state visitors) is selected as a descriptor manifesting the similarities and differences in the variables of interest between or among the groups (Chen, 2003). On the other hand, when the a posteriori approach is used, a classification scheme is devised based on multiple attributes to classify cases into groups. It mainly identifies the sizes and number of visitor segments that were previously unknown by using factor-cluster statistical analysis (formica & Uysal 1998; Mazanec 1992; S. l. j. Smith, 1995).
Market segmentation can be achieved using different segmentation criteria (Middleton, 1994). Com monly used classification criteria are
sociodemographics, psychographics, buyer behav-ior, lifestyle, geographic origins, benefits, motiva-tions, and expenditure (Gitelson & Kerstetter, 1990; Middleton 1994). Kotler (1980) proposed four major variables that might be used in segmenting consumer markets, which include demographic, geographic, psychographic, and behavioral characteristics. Tkaczynski, rundle-Thiele, and beaumont (2009) reviewed 139 academic papers which focused on segmentation from 2002 to 2008. They concluded that Kotler’s (1980) four bases were frequently used by researchers to profile tourists’ characteristics.
Many authors argued that psychographic seg-mentation could provide marketers with more insightful information about their target markets than demographic or geographic segmentation (hsu & lee, 2002). According to Crompton (1979) and Schewe (1990), segmenting travelers on the basis of motivations is one of the most effective meth-ods. for instance, several event-based studies have argued that attendees should be segmented based on the intention to investigate why they partici-pated in the event (Allen et al., 2008; Getz, 2007). Crompton (1979) identified nine motives on the basis of a number of in-depth interviews, seven of which could be classified as “sociopsychological” and two as “cultural.” Cha, McCleary, and Uysal (1995) determined the motivations influencing japanese travelers to a select (certain) destination and segmented using a posteriori approach. Song (2005) segmented Korean tourists in rural areas and the results showed that the major motivational clus-ters influencing visits to Korean rural tourism vil-lages were “escape from everyday life,” “family togetherness and learning,” “self-actualization,” “accessibility,” “refreshment,” and “activity.” Gen-eral findings throughout literature review indicate that psychographic segmentation, especially using motivation criteria, is an effective way to under-stand sizes and the number of visitor segments that were previously unknown. Therefore, as part of the main goal of this study, a factor-cluster segmenta-tion was employed in order to reveal the underly-ing dimensions of motivation and existing segments as implied by motivation factors.
Quality of Trip ExperiencePerceived quality of a trip deals with tourist eval-
uations of various elements in different phases of a
TA17-5_671.indd 3 10/17/2012 9:35:47 AM
4 PrebeNSeN eT Al.
trip and is expected to affect the overall value and satisfaction of a journey (jennings & Weiler, 2006; Meng, 2006). The tourism journey has been divided into three phases: before traveling, during travel-ing, and after traveling. Sometimes, tourists start planning their vacation months before the journey starts and make larger efforts in order to organize the vacation before traveling. Others plan less and are more inclined to decide on site. Tourists are also more or less influenced by destination market-ing and promotion. During the actual vacation period, tourists spend time on transportation in addition to staying at the destination where a vari-ety of activities might be experienced. In the final phase of the on-site phase, tourists recollect their vacation experience either positively or negatively (jennings, 2006; Meng, 2006). furthermore, these different travel phases of vacation experience may also be influenced by the nature of the trip. for example, visiting an event or site within the same destination versus taking a long-haul trip will have different travel expectations and experiences.
The number and type of stages or phases may vary dependent on the context of the trip. research revealed as early as in the 1960s (Clawson & Knetsch, 1966) that a recreation-based experience was multiphasic. Specifically, the authors provided five different and interacting phases: “an anticipa-tion phase,” “travel to the site,” “on-site activity,” “return travel,” and “a recollection phase.” In out-door recreation settings, researchers attempted to investigate variability in experiential qualities assessed in different phases of recreational trips (e.g., hammitt, 1980; hultsman, 1998; McIntyre & roggenbuck, 1998). Killion (1992) portrays the tourism experience as a circular model that consists of five different phase: “planning phase,” “travel to phase,” “on-site activities phase,” “return travel phase,” and “recollection phase.” The model is considered applicable to multidestination travel. Craig-Smith and french (1994) introduce a more simplified model that consists of three difference experiences: “anticipatory phase,” “experiential phase,” and “reflective phase.” laws (1995) also investigated the tourism experience with the desti-nation in a set of phases of “pretravel,” “journey and arrival,” “destination stay,” and “after return home.” regardless of the number of phases, it is clear that experience is shaped by incremental
changes in travel behavior during time and space and that each phase has the potential to create value for tourists and destinations (Uysal, harrill, & Woo, 2011). Creation of customer values in tour-ism can occur through the different phases of the travel experience, thus each phase representing a point on the phase of the travel experience (braithwaite, 1992). It is important for tourism managers and operators to understand what tourists may consider as the important components of a high-quality tourism experience (Meng, 2006) and how this experience then may vary from one phase of travel experience to another phase of travel experience. Although a number of studies on moti-vation-based segmentation have been conducted, little research has focused on quality of travel expe-rience in different phases across different segments. Therefore, the second objective of this study is to investigate their characteristics and perceived qual-ity of tourism experience in the various phases of travel experience.
MethodStudy Site
Northern Norway is situated between 65º and 72º north and most of it is above the Arctic Circle. Approximately 460,000 inhabitants live in the area that covers nearly 180,000 square kilometers. Northern Norway is known for wildlife safaris, midnight sun, and northern lights. It is also home to the Sami, Norway’s indigenous people (http://nor-dnorge.com/#). Northern Norway’s landscape changes from alpine mountains and fjords, with prosperous coastal communities, to tundra and wil-derness. There are mountains sinking into the sea from over a thousand meters at some stretches along the coast. There are many tourist attractions in Northern Norway and plenty of entertainment and outdoor activities in nature (e.g., sailing, fish-ing, riding, hiking and climbing). Also it is possible to go on a whale safari or visit museums. The attractions developed and managed are both non-profit and profit based. Due to the relatively low population density in the northern area and low visitation (approximately 2 million tourist vacation nights per year), the visitor centers and attractions in Northern Norway have relatively few visitors, ranging from 20,000 to 300,000 ticket-paying tour-ists per year (local, national, and international).
TA17-5_671.indd 4 10/17/2012 9:35:47 AM
QUAlITy Of VACATION eXPerIeNCe PhASeS 5
Data Collection
The data used in this study come from a survey of tourist experiences at tourist attractions and destinations in Northern Norway. In this article a tourist attraction is observed as a firm offering a thematic tourist experience (i.e., an aquarium and/or a museum) and receives entrance fees from the audience. The attractions reside at a destina-tion, here perceived as a city or community (Tromsø, bardufoss, and lofoten), all within the Northern part of Norway. Altogether five nature- and culture-based attractions were picked for the purpose of data collection, two residing in Tromsø, one in bardufoss, and two in the lofoten Islands. Among the attractions two put forward more nature-based elements (i.e., one is a lift to the mountain where the visitors can enjoy the scenery of the city and the surrounding nature, and the other is an aquarium). The other three attractions also have nature as their core idea; however, these attractions also include historical and cultural elements (i.e., a zoo with stories about high North living, a visitor center including an aquarium, a movie, displays of the high North nature and culture, and a Viking museum with live actors and displays of history, culture, and nature from prehistoric days).
The data collection instrument was developed first in Norwegian and then translated into english and German. The study followed a back translation that was done by two bilingual assistants. This is also recommended as an approach in cross-cultural research settings (Dimanche, 1994). The instru-ment consisted of four sections. The first section had questions eliciting demographic and travel behavior information, the second section had a scale of motivation, the third section had a quality of vacation experience scale, and the last section consisted of involvement items. The self-adminis-trated intercept survey was conducted by well-trained research assistants. The survey was administrated from the middle of june to the mid-dle of August, 2010. The questionnaires were ran-domly handed out at the entrances of one of five tourist attractions in Northern Norway to potential respondents and were immediately collected upon their completion. In order to maintain random-ization, the study used a systematic probability
sampling scheme to administer the questionnaire. A total of 579 usable questionnaires were generated.
Measurement of Motivation and Quality of Trip Experience
A set of 13 motivation items was developed on the basis of a review of the related literature (beard & ragheb, 1983), which were modified to apply to the research site and target population. A set of 26 quality of trip experience items was also developed using previous research (Meng & Uysal, 2008). Specifically, 5 pretrip planning variables, 6 items of en-route experience variables, and 15 variables of destination on-site experiences were included in the quality of trip experience section. In the motiva-tion and quality of vacation experience sections of the survey questionnaire, items were measured on a 5-point likert scale (1—not at all important, 2—unimportant, 3—neutral, 4—important, and 5—very important). respondents were asked to rate the relative importance to them of each item for visiting the Arctic region of Norway. The demo-graphic variables of age and nationality were mea-sured on open-ended questions, and education, income, and vacation types as travel behavior ques-tions were measured on close-ended questions.
results
Demographic Information
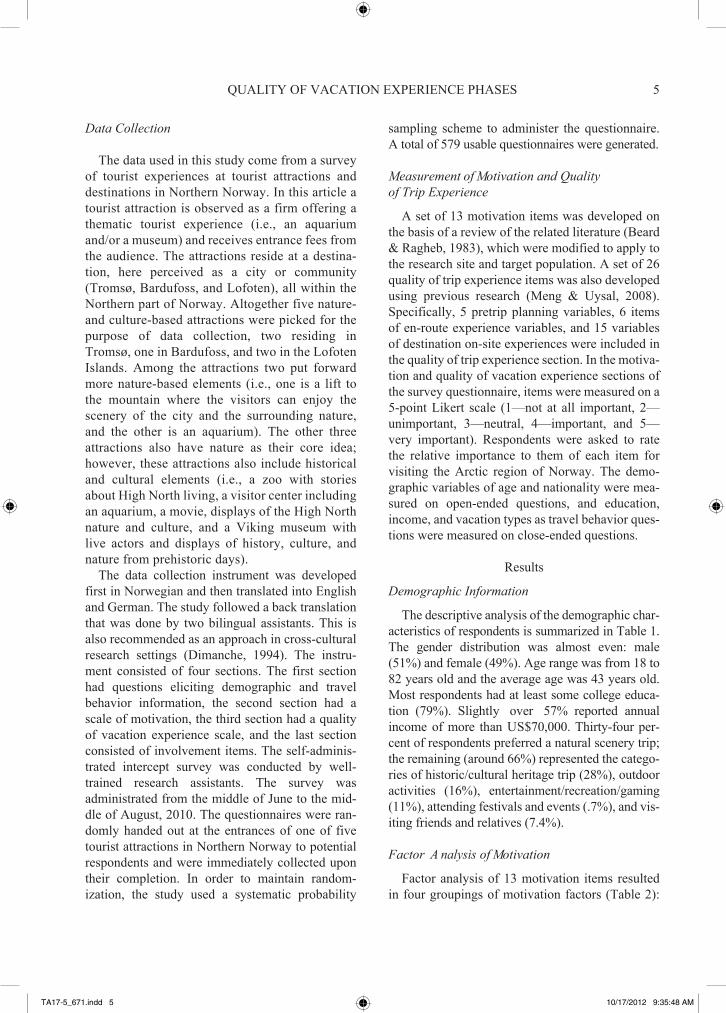
The descriptive analysis of the demographic char-acteristics of respondents is summarized in Table 1. The gender distribution was almost even: male (51%) and female (49%). Age range was from 18 to 82 years old and the average age was 43 years old. Most respondents had at least some college educa-tion (79%). Slightly over 57% reported annual income of more than US$70,000. Thirty-four per-cent of respondents preferred a natural scenery trip; the remaining (around 66%) represented the catego-ries of historic/cultural heritage trip (28%), outdoor activities (16%), entertainment/recreation/gaming (11%), attending festivals and events (.7%), and vis-iting friends and relatives (7.4%).
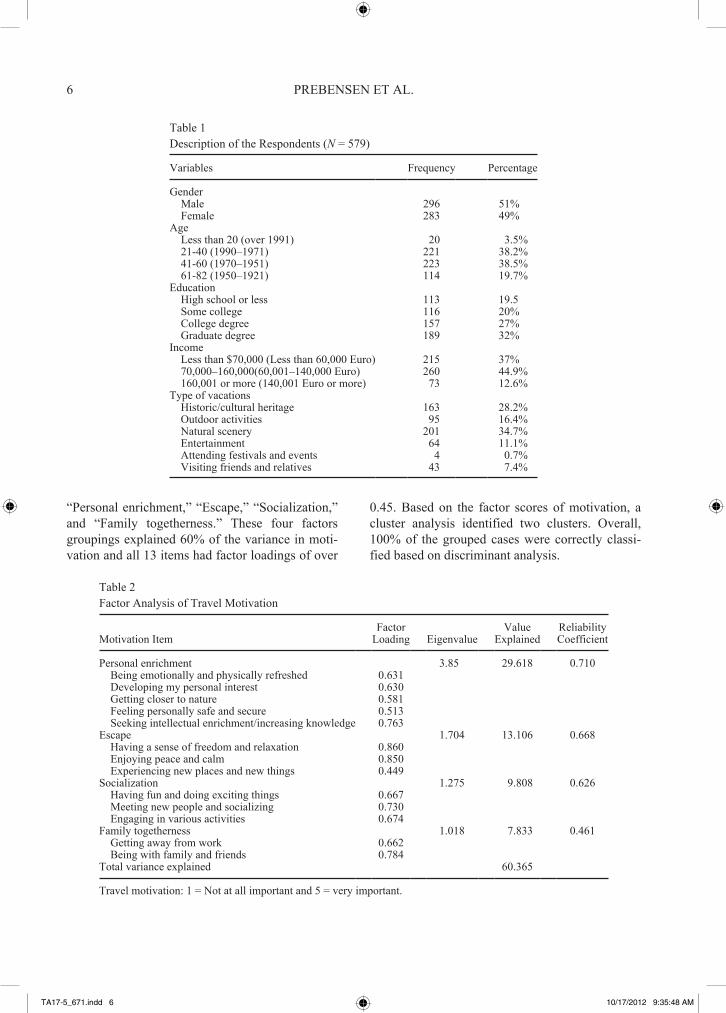
Factor A nalysis of Motivation
factor analysis of 13 motivation items resulted in four groupings of motivation factors (Table 2):
TA17-5_671.indd 5 10/17/2012 9:35:48 AM
6 PrebeNSeN eT Al.
“Personal enrichment,” “escape,” “Socialization,” and “family togetherness.” These four factors groupings explained 60% of the variance in moti-vation and all 13 items had factor loadings of over
0.45. based on the factor scores of motivation, a cluster analysis identified two clusters. Overall, 100% of the grouped cases were correctly classi-fied based on discriminant analysis.
Table 1Description of the respondents (N = 579)
Variables frequency Percentage
Gender Male 296 51% female 283 49%Age less than 20 (over 1991) 20 3.5% 21-40 (1990–1971) 221 38.2% 41-60 (1970–1951) 223 38.5% 61-82 (1950–1921) 114 19.7%education high school or less 113 19.5 Some college 116 20% College degree 157 27% Graduate degree 189 32%Income less than $70,000 (less than 60,000 euro) 215 37% 70,000–160,000(60,001–140,000 euro) 260 44.9% 160,001 or more (140,001 euro or more) 73 12.6%Type of vacations historic/cultural heritage 163 28.2% Outdoor activities 95 16.4% Natural scenery 201 34.7% entertainment 64 11.1% Attending festivals and events 4 0.7% Visiting friends and relatives 43 7.4%
Table 2factor Analysis of Travel Motivation
Motivation Itemfactor
loading eigenvalueValue
explainedreliability Coefficient
Personal enrichment 3.85 29.618 0.710 being emotionally and physically refreshed 0.631 Developing my personal interest 0.630 Getting closer to nature 0.581 feeling personally safe and secure 0.513 Seeking intellectual enrichment/increasing knowledge 0.763escape 1.704 13.106 0.668 having a sense of freedom and relaxation 0.860 enjoying peace and calm 0.850 experiencing new places and new things 0.449Socialization 1.275 9.808 0.626 having fun and doing exciting things 0.667 Meeting new people and socializing 0.730 engaging in various activities 0.674family togetherness 1.018 7.833 0.461 Getting away from work 0.662 being with family and friends 0.784Total variance explained 60.365
Travel motivation: 1 = Not at all important and 5 = very important.
TA17-5_671.indd 6 10/17/2012 9:35:48 AM
QUAlITy Of VACATION eXPerIeNCe PhASeS 7
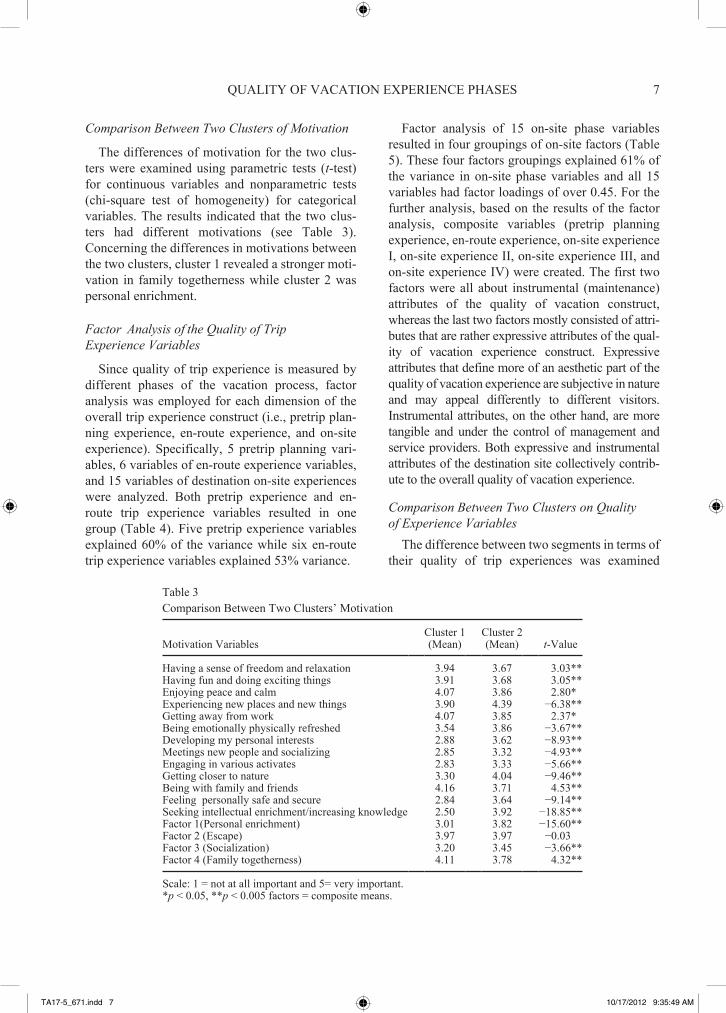
Comparison Between Two Clusters of Motivation
The differences of motivation for the two clus-ters were examined using parametric tests (t-test) for continuous variables and nonparametric tests (chi-square test of homogeneity) for categorical variables. The results indicated that the two clus-ters had different motivations (see Table 3). Concerning the differences in motivations between the two clusters, cluster 1 revealed a stronger moti-vation in family togetherness while cluster 2 was personal enrichment.
Factor Analysis of the Quality of Trip Experience Variables
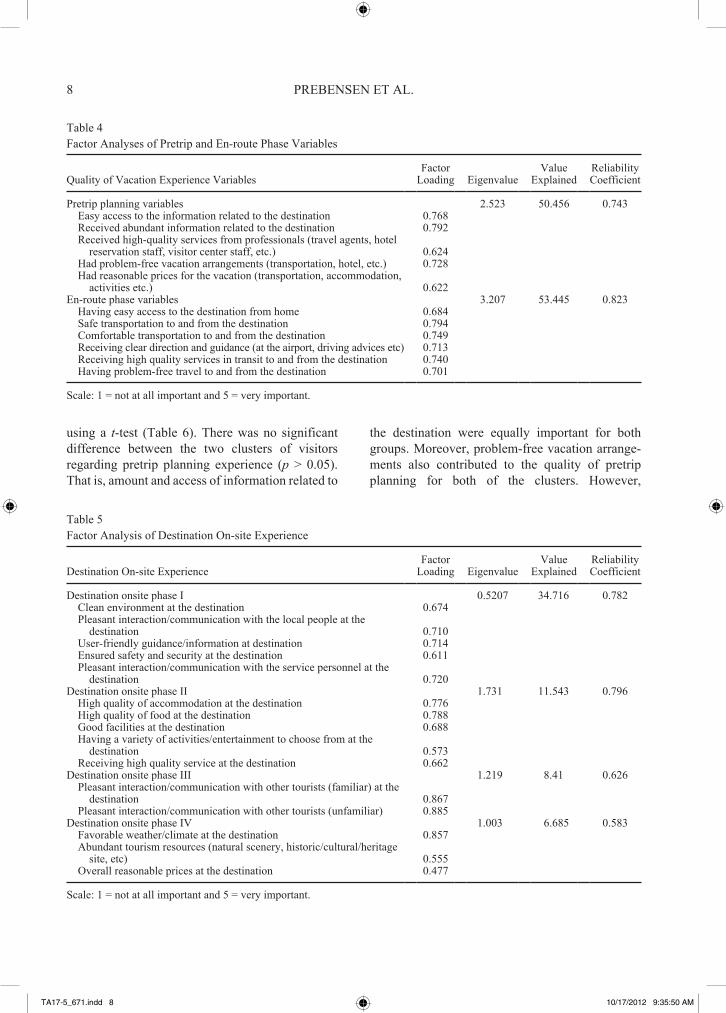
Since quality of trip experience is measured by different phases of the vacation process, factor analysis was employed for each dimension of the overall trip experience construct (i.e., pretrip plan-ning experience, en-route experience, and on-site experience). Specifically, 5 pretrip planning vari-ables, 6 variables of en-route experience variables, and 15 variables of destination on-site experiences were analyzed. both pretrip experience and en-route trip experience variables resulted in one group (Table 4). five pretrip experience variables explained 60% of the variance while six en-route trip experience variables explained 53% variance.
factor analysis of 15 on-site phase variables resulted in four groupings of on-site factors (Table 5). These four factors groupings explained 61% of the variance in on-site phase variables and all 15 variables had factor loadings of over 0.45. for the further analysis, based on the results of the factor analysis, composite variables (pretrip planning experience, en-route experience, on-site experience I, on-site experience II, on-site experience III, and on-site experience IV) were created. The first two factors were all about instrumental (maintenance) attributes of the quality of vacation construct, whereas the last two factors mostly consisted of attri-butes that are rather expressive attributes of the qual-ity of vacation experience construct. expressive attributes that define more of an aesthetic part of the quality of vacation experience are subjective in nature and may appeal differently to different visitors. Instrumental attributes, on the other hand, are more tangible and under the control of management and service providers. both expressive and instrumental attributes of the destination site collectively contrib-ute to the overall quality of vacation experience.
Comparison Between Two Clusters on Quality of Experience Variables
The difference between two segments in terms of their quality of trip experiences was examined
Table 3Comparison between Two Clusters’ Motivation
Motivation VariablesCluster 1 (Mean)
Cluster 2 (Mean) t-Value
having a sense of freedom and relaxation 3.94 3.67 3.03**having fun and doing exciting things 3.91 3.68 3.05**enjoying peace and calm 4.07 3.86 2.80*experiencing new places and new things 3.90 4.39 −6.38**Getting away from work 4.07 3.85 2.37*being emotionally physically refreshed 3.54 3.86 −3.67**Developing my personal interests 2.88 3.62 −8.93**Meetings new people and socializing 2.85 3.32 −4.93**engaging in various activates 2.83 3.33 −5.66**Getting closer to nature 3.30 4.04 −9.46**being with family and friends 4.16 3.71 4.53**feeling personally safe and secure 2.84 3.64 −9.14**Seeking intellectual enrichment/increasing knowledge 2.50 3.92 −18.85**factor 1(Personal enrichment) 3.01 3.82 −15.60**factor 2 (escape) 3.97 3.97 −0.03factor 3 (Socialization) 3.20 3.45 −3.66**factor 4 (family togetherness) 4.11 3.78 4.32**
Scale: 1 = not at all important and 5= very important.*p < 0.05, **p < 0.005 factors = composite means.
TA17-5_671.indd 7 10/17/2012 9:35:49 AM
8 PrebeNSeN eT Al.
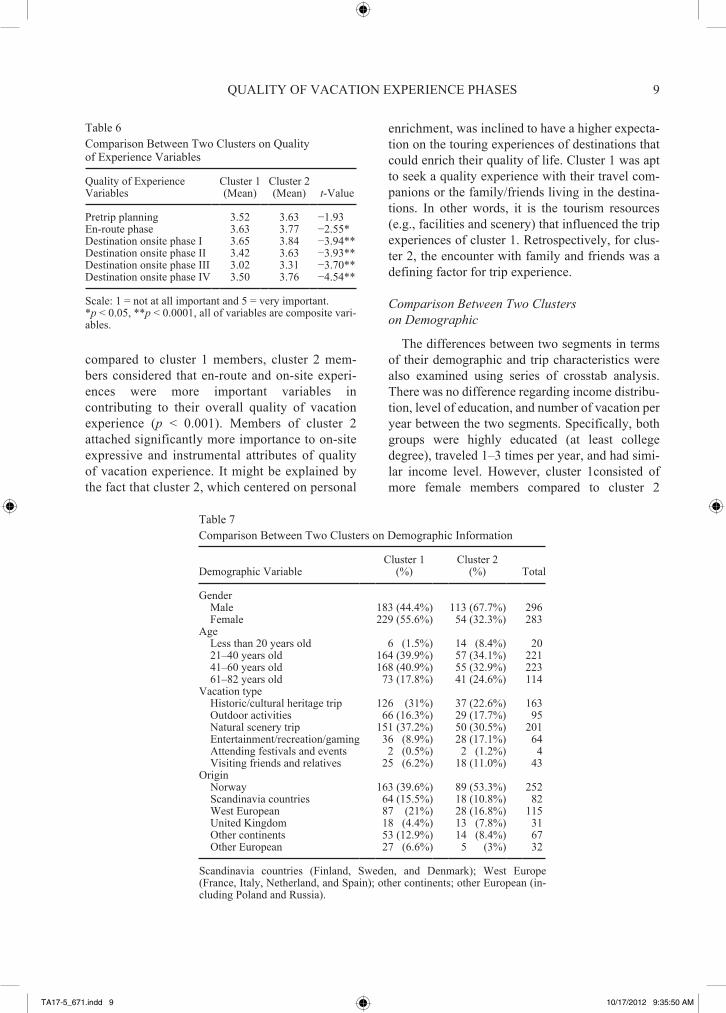
using a t-test (Table 6). There was no significant difference between the two clusters of visitors regarding pretrip planning experience (p > 0.05). That is, amount and access of information related to
the destination were equally important for both groups. Moreover, problem-free vacation arrange-ments also contributed to the quality of pretrip planning for both of the clusters. however,
Table 4factor Analyses of Pretrip and en-route Phase Variables
Quality of Vacation experience Variables factor
loading eigenvalueValue
explainedreliability Coefficient
Pretrip planning variables 2.523 50.456 0.743 easy access to the information related to the destination 0.768 received abundant information related to the destination 0.792 received high-quality services from professionals (travel agents, hotel reservation staff, visitor center staff, etc.) 0.624 had problem-free vacation arrangements (transportation, hotel, etc.) 0.728 had reasonable prices for the vacation (transportation, accommodation, activities etc.) 0.622en-route phase variables 3.207 53.445 0.823 having easy access to the destination from home 0.684 Safe transportation to and from the destination 0.794 Comfortable transportation to and from the destination 0.749 receiving clear direction and guidance (at the airport, driving advices etc) 0.713 receiving high quality services in transit to and from the destination 0.740 having problem-free travel to and from the destination 0.701
Scale: 1 = not at all important and 5 = very important.
Table 5factor Analysis of Destination On-site experience
Destination On-site experience factor
loading eigenvalueValue
explainedreliability Coefficient
Destination onsite phase I 0.5207 34.716 0.782 Clean environment at the destination 0.674 Pleasant interaction/communication with the local people at the destination 0.710 User-friendly guidance/information at destination 0.714 ensured safety and security at the destination 0.611 Pleasant interaction/communication with the service personnel at the destination 0.720Destination onsite phase II 1.731 11.543 0.796 high quality of accommodation at the destination 0.776 high quality of food at the destination 0.788 Good facilities at the destination 0.688 having a variety of activities/entertainment to choose from at the destination 0.573 receiving high quality service at the destination 0.662Destination onsite phase III 1.219 8.41 0.626 Pleasant interaction/communication with other tourists (familiar) at the destination 0.867 Pleasant interaction/communication with other tourists (unfamiliar) 0.885Destination onsite phase IV 1.003 6.685 0.583 favorable weather/climate at the destination 0.857 Abundant tourism resources (natural scenery, historic/cultural/heritage site, etc) 0.555 Overall reasonable prices at the destination 0.477
Scale: 1 = not at all important and 5 = very important.
TA17-5_671.indd 8 10/17/2012 9:35:50 AM
QUAlITy Of VACATION eXPerIeNCe PhASeS 9
compared to cluster 1 members, cluster 2 mem-bers considered that en-route and on-site experi-ences were more important variables in contributing to their overall quality of vacation experience (p < 0.001). Members of cluster 2 attached significantly more importance to on-site expressive and instrumental attributes of quality of vacation experience. It might be explained by the fact that cluster 2, which centered on personal
enrichment, was inclined to have a higher expecta-tion on the touring experiences of destinations that could enrich their quality of life. Cluster 1 was apt to seek a quality experience with their travel com-panions or the family/friends living in the destina-tions. In other words, it is the tourism resources (e.g., facilities and scenery) that influenced the trip experiences of cluster 1. retrospectively, for clus-ter 2, the encounter with family and friends was a defining factor for trip experience.
Comparison Between Two Clusters on Demographic
The differences between two segments in terms of their demographic and trip characteristics were also examined using series of crosstab analysis. There was no difference regarding income distribu-tion, level of education, and number of vacation per year between the two segments. Specifically, both groups were highly educated (at least college degree), traveled 1–3 times per year, and had simi-lar income level. however, cluster 1consisted of more female members compared to cluster 2
Table 6Comparison between Two Clusters on Quality of experience Variables
Quality of experience Variables
Cluster 1 (Mean)
Cluster 2 (Mean) t-Value
Pretrip planning 3.52 3.63 −1.93en-route phase 3.63 3.77 −2.55*Destination onsite phase I 3.65 3.84 −3.94**Destination onsite phase II 3.42 3.63 −3.93**Destination onsite phase III 3.02 3.31 −3.70**Destination onsite phase IV 3.50 3.76 −4.54**
Scale: 1 = not at all important and 5 = very important.*p < 0.05, **p < 0.0001, all of variables are composite vari-ables.
Table 7Comparison between Two Clusters on Demographic Information
Demographic VariableCluster 1
(%)Cluster 2
(%) Total
Gender Male 183 (44.4%) 113 (67.7%) 296 female 229 (55.6%) 54 (32.3%) 283Age less than 20 years old 6 (1.5%) 14 (8.4%) 20 21–40 years old 164 (39.9%) 57 (34.1%) 221 41–60 years old 168 (40.9%) 55 (32.9%) 223 61–82 years old 73 (17.8%) 41 (24.6%) 114Vacation type historic/cultural heritage trip 126 (31%) 37 (22.6%) 163 Outdoor activities 66 (16.3%) 29 (17.7%) 95 Natural scenery trip 151 (37.2%) 50 (30.5%) 201 entertainment/recreation/gaming 36 (8.9%) 28 (17.1%) 64 Attending festivals and events 2 (0.5%) 2 (1.2%) 4 Visiting friends and relatives 25 (6.2%) 18 (11.0%) 43Origin Norway 163 (39.6%) 89 (53.3%) 252 Scandinavia countries 64 (15.5%) 18 (10.8%) 82 West european 87 (21%) 28 (16.8%) 115 United Kingdom 18 (4.4%) 13 (7.8%) 31 Other continents 53 (12.9%) 14 (8.4%) 67 Other european 27 (6.6%) 5 (3%) 32
Scandinavia countries (finland, Sweden, and Denmark); West europe (france, Italy, Netherland, and Spain); other continents; other european (in-cluding Poland and russia).
TA17-5_671.indd 9 10/17/2012 9:35:50 AM
10 PrebeNSeN eT Al.
members and cluster 1 consisted of younger age groups than did cluster 2. Members of cluster 2 pre-ferred more entertainments and outdoor activities compared to cluster 1 while members of cluster 1 preferred more historic/heritage and natural scen-ery based travel experiences. Proportions of origin groups were significantly different. Cluster 2 had more tourists who originated within Norway and also came from the UK while cluster 1 consisted of more tourists that originated from West european countries and outside the european continent.
Conclusion
It is clear from this study that, based on motiva-tion, visitors to the Arctic region are not homoge-neous. There are two segments that warrant special marketing attention. both segments emphasize the high quality of their on-site experiences. Differences that were delineated should be reflected in services, types of travel experiences created, and promo-tional efforts for tourism to be more financially viable and personally rewarding. The analysis of segmentation profile revealed that cluster 1 mem-bers chose family togetherness as the most impor-tant motivation for visiting Northern Norway, while cluster 2 members selected personal enrich-ment and socialization as the key motivations. both cluster 1 and cluster 2 considered escape as an important motivation. These motivation variations between the two segments should be incorporated in to the information generated from the compari-sons of on-site quality vacation attributes.
It is important from the perspective of develop-ing strategies to mention that the defining differ-ence between the segments was a matter of the degrees of variation in the level of importance attached to quality of vacation attributes. Members of cluster 2 have higher expectations in terms of instrumental attributes that help generate quality experience. The perceived importance of expres-sive attributes is also pronounced more with mem-bers of cluster 2. Such salient statistical differences can lead to the development of high-end vacation packages that can promote “extraordinary vacation experiences” with excellent service amenities in the destinations of Northern Norway.
It is enlightening to note that family together-ness, which significantly differentiates the two
clusters, represents the leading motivation of Arctic tourists. As a managerial implication, the tourism operators involving Arctic tourism might consider rendering amenities and activities suitable for fam-ily travel. Consequently, a further study identifying the critical service/product attributes which help augment the trip experience of family/friend-related journey may be deployed. As for the seg-ment allured by personal enrichment, it is a much smaller group of travelers which is about 30% of the respondents. Although, the size of this market is small, it appears to have room to grow as the level of accessibility to the destination (e.g., re-route ser-vices) and infrastructure of the destination (e.g., on-site services) are more in alignment with the needs of this segment. Moreover, since variations in trip experiences are reported between the two motivation-based clusters, it suggests that the per-ceived importance of trip experiences entailing pre-trip, on-rout and on-site stages might be a moderator of trip motivation pertaining to a visit to Arctic des-tinations. It might be worthwhile exploring such a relationship in future study as an extension to moti-vation theory.
likely, travelling to Arctic destinations could be regarded as a new milestone of travel experiences for those who come from a different climate zone. Thus, it may be important to further contemplate the geographical factor in promoting Arctic desti-nations. Cluster 1 has more tourists from other con-tinent than cluster 2 in terms of geographic mix within the clusters. It implies that promoting family togetherness could be a valuable marketing strategy stimulating the trip demand by non-europeans.
references
Allen, j., O’Toole, W., harris, r., & McDonnell, I. (2008). Festival & special event management. Milton, QlD: john Wiles & Sons Australia, ltd.
beard, j. G., & ragheb, M. G. (1983). Measuring leisure motivation. Journal of Leisure Research,15(3), 219–228.
braithwaite, r. (1992). Value-chain assessment of the travel experience. Cornell Hotel and Restaurant Quarterly, 33(5), 41–49.
Calantone, r., & Mazanec, j. (1991). Marketing Management and Tourism. Annals of Tourism Research, 18(1), 101–119.
Cha, S. C., McCleary, K. W., & Uysal, M. (1995). Travel motivations of japanese overseas travelers: a factor-clus-ter segmentation approach. Journal of Travel Research, 34, 33–39.
TA17-5_671.indd 10 10/17/2012 9:35:51 AM
QUAlITy Of VACATION eXPerIeNCe PhASeS 11
Chen, j. S. (2003). Market segmentation by tourist’s senti-ments. Annals of Tourism Research, 301(1), 178–193.
Clawson, M., & Knetsch, j. l. (1966). Economics of outdoor recreation: Resources for the future. baltimore: john hopkins.
Craig-Smith, S., & french, C. (1994). Learning to live with tourism. Melbourne: Pitman.
Crompton, j. l. (1979). Motivations of pleasure vacation. Annals of Tourism Research, 6(4), 73–86.
Dimanche, f. (1994). Cross-cultural tourism marketing research: An assessment and recommendations for future studies. Journal of International Consumer Marketing, 6(3/4), 123–134.
Dolnicar, S. (2008). Market segmentation in tourism. In A.Woodside & D. Martin (eds.), Tourism management, analysis, behavior and strategy (pp. 129–150). Cambridge: CAbI.
fodness, D. (1994). Measuring tourist motivation. Annals of Tourism Research, 21(3), 555–581.
formica, S., & Uysal, M. (1998). Market segmentation on an international cultural historical event in Italy. Journal of Travel Research, 36(4), 16–24.
Getz, D. (2007). Event studies: Theory, research and policy for planned events. Oxford, UK: butterworth- heinemann.
Gitelson, r. j., & Kerstetter, D. l. (1990). The relationship between sociodemographic variables, benefit sought and subsequent vacation behavior: a case study. Journal of Travel Research, 28(4), 24–29.
hammitt, W. e. (1980). Outdoor recreation: Is it a multi-phase experience? Journal of Leisure Research, 12, 107–115.
hsu, C. h. C., & lee, e. (2002). Segmentation of Senior Motorcoach Travelers. Journal of Travel Research, 40(4), 364–373.
hultsman W. z. (1998). The multi-day, competitive leisure event: examining satisfaction over time, Journal of Leisure Research, 30, 472–497.
jennings, G., & Nickerson, N. P. (2006). Quality tourism experience. burlington, MA: elsevier butterworth- heinemann.
jennings, G., & Weiler, b. (2006). Mediating meaning: Perspectives on brokering quality tourist experiences. In G. jennings & N. P. Nickerson (eds.), Quality tourism experience (pp. 57–78). burlington, MA: elsevier butterworth-heinemann.
Killion, G. l. (1992). Understanding tourism. rockhampton: Central Queensland University.
Kotler, P. (1980). Principles of marketing. englewood Cliffs, Nj: Prentice-hall.
laws, e. (1995). Tourist destination management: Issues, analysis and policies. london: routledge.
Mazanec, j. (1992). Classifying tourists into market seg-ments: a neural network approach. Journal of Travel and Tourism Marketing, 1(1), 39–60.
Meng, f. (2006). An examination of destination competitive-ness from the tourists’ perspective: The relationship between quality of tourism experience and perceived destination competitiveness. Unpublished doctoral dis-sertation, Virginia Polytechnic Institute and State University, blacksburg, VA.
Meng, f., & Uysal, M. (2008). effects of gender differences on perceptions of destination attributes, motivations, and travel values: An examination of a nature-based resort destination. Journal of Sustainable Tourism, 16(4), 445–465.
Middleton, V. T. C. (1994). Segmentation. In V. Middleton (ed.), Marketing in travel and tourism (pp. 71–83). Oxford, UK: butterworth-heinemann.
Mok, C., & Iverson, T. j. (2000). expenditure-based seg-mentation: Taiwanese tourists to Guam. Tourism Management, 21(3), 299–305.
McIntyre, N., & roggenbuck, j. W. (1998). Nature/person transactions during an outdoor adventure experience: A multiphasic analysis. Journal of Leisure Research, 30, 401–422.
Park, K. S., reisinger, y., & Kang, h. j. (2008). Visitors’ motivation for attending the South beach Wine and food festival, Miami beach, florida. Journal of Travel & Tourism Marketing, 25(2), 161–181.
Prebensen, N. K., & foss, l. (2011). Coping and co-creating in tourists experiences. International Journal of Tourism Research, 13(1), 54–67.
Schewe, Ch. (1990). Get in position for the older market. American Demographics, 12(6), 38–44.
Sirakaya, e., Uysal, M., & yoshioka, C. f. (2003). Segmenting the japanese tour market to Turkey. Journal of Travel Research, 41(3), 293–304.
Smith, W. (1956). Product differentiation and market seg-mentation as alternative marketing Strategies. Journal of Marketing, 21(1), 3–8.
Smith, S. l. j. (1995). Tourism analysis: A handbook. essex, UK: longman Scientific & Technical.
Song, D. y. (2005). Why do people visit the countryside? Push & pull factors. Journal of Green Tourism, 12(2), 117–144.
Tkaczynski, A., rundle-Thiele, S. r., & beamount, N. (2009). Segmentation: A tourism stakeholder view. Tourism Management, 30(2), 169–175.
Uysal, M., harrill, r., & Woo, e. (2011). Destination mar-keting research: Issues and challenges. In y. Wang & A. Pizam (eds.), Tourism destination marketing and man-agement: Foundations and applications (pp. 99–112). london, UK: CAbI.
TA17-5_671.indd 11 10/17/2012 9:35:51 AM

TA17-5_671.indd 12 10/17/2012 9:35:51 AM
Top Related
Copyright © 2022 FDOKUMEN

