


Bahasa
Halaman
Hukum

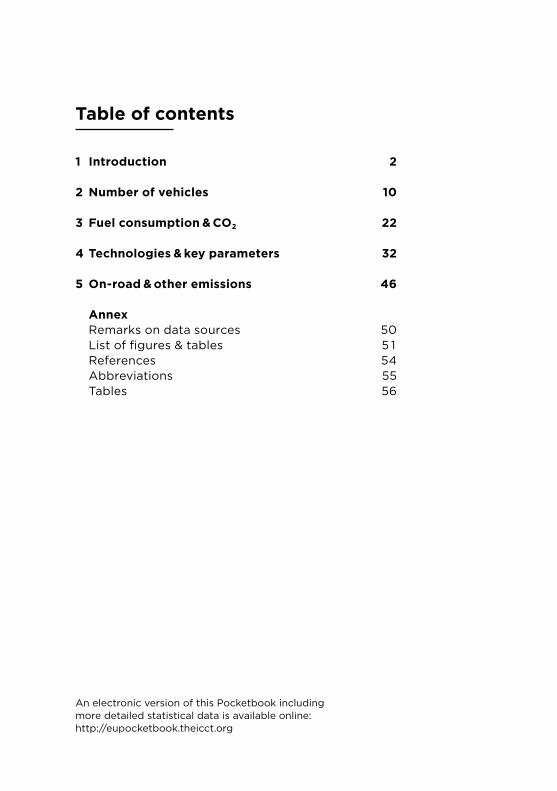
Table of contents
An electronic version of this Pocketbook including more detailed statistical data is available online: http://eupocketbook.theicct.org
1 Introduction 2
2 Number of vehicles 10
3 Fuel consumption & CO2 22
4 Technologies & key parameters 32
5 On-road & other emissions 46
Annex Remarks on data sources 50 List of figures & tables 5 1 References 54 Abbreviations 55 Tables 56

3 4
EUROPEAN VEHICLE MARKET STATISTICS 2021/22
1 INTRODUCTION
The 2021/22 edition of European Vehicle Market Statistics offers a statistical portrait of passenger car, light commercial, and heavy-duty vehicle fleets in the European Union (EU) and the United Kingdom (UK) from 2001 to 2020. As in previous editions, the emphasis is on vehicle technologies, fuel consump - tion, and emissions of greenhouse gases and other air pollutants.
The following pages give a concise overview of data in subsequent chapters and summarize the latest regulatory developments in the EU. More compre-hensive tables are included in the annex, along with information on sources.
Number of vehiclesIn 2020, there was a historic drop in new car
registrations in the EU across all markets due to the outbreak of the COVID-19 pandemic in the spring of that year. A total of 11.7 million new cars were registered in the 27 Member States of the EU and the UK in 2020, about 25 % less than in the previous year and the lowest number since 2001. Vehicle sales decreased in all segments, including the sport utility vehicle (SUV) segment, sales of which had steadily increased since 2009. Still, the SUV segment contin-ued to consolidate its position as market leader with a growing share of 39 % in 2020, followed by the Lower Medium segment (22 %).
At the same time, triggered by the phase-in of the mandatory 2020 CO2 emissions target of 95 grams per kilometer (g/km), new electric car registrations soared in Europe (Fig. 1-1). In the EU and the UK, the combined market share of battery electric (BEV) and plug-in hybrid electric vehicles (PHEVs) rose to a level of roughly 11 % in 2020 from 3 % in 2019, which cor responds to a 165 % increase in total, absolute sales. National and local policies to encourage electric vehicle uptake underpinned the
Fig. 1-1New plug-in and battery electric passenger car sales (left) and sales share (right) in Europe
effect of the EU-wide carbon dioxide (CO2) regulation. These included primarily purchase subsidies and tax discounts but also phase-out targets for internal combustion engines at country and city level (Rajon Bernard et al., 2021). In contrast, sales of new diesel cars declined for the ninth year in a row – their market share dropped from 55 % in 2011 to 29 % in 2020 – likely due to a loss in trust from con- sumers who are increasingly concerned about diesel- specific bans announced by a number of cities starting in 2024 (Wappelhorst, 2020).
Fuel consumption and CO2 emissionsThe official level of average CO2 emissions from
new passenger cars registered in the EU, the UK, Iceland, and Norway, as measured in the laboratory via the New European Driving Cycle (NEDC) type- approval test procedure, decreased to 108 g/km in 2020, which is 14 g/km lower than in the previous year (Tietge et al., 2021). As CO2 emissions and fuel consumption are directly linked, this implies a fleetwide average fuel efficiency of 4.7 liters/100 km.
https://t1p.de/xzv6c
2012 2011 20202017 2018 201920162015201420130
2
4
6
8
10
12
14
0
200,000
400,000
600,000
800,000
1,000,000
1,200,000
1,400,000
New electricpassenger car sales share (%)
New electric passenger car sales
Plug-in hybrid
Battery electric
Data is for the 27 EU Member States, the UK, and the four members of the European Free Trade Association (EFTA).

5 6
EUROPEAN VEHICLE MARKET STATISTICS 2021/22 1 Introduction
After 2015 targets were met and in the absence of targets before 2020, average CO2 emissions increased up until 2019 by 0.7 g/km per year. In 2020, as a result of the entry into force of the fleet-average CO2 target of 95 g/km, new car emission levels fell at the unprecedent rate of more than 1 g/km per month. According to preliminary data published by the European Environment Agency (EEA), nearly all manu- facturers complied with their respective 2020 CO2 targets, although only with the use of flexible com pliance mechanisms such as super-credits and phase-in provisions. Including these mechanisms lowered average NEDC CO2 emission levels to 96 g/km (Tietge et al., 2021).
New mandatory CO2 standards for the years 2025 and 2030 were adopted in early 2019 (Mock, 2019). For new passenger cars and vans, fleet- average emission reduction targets relative to a 2021 baseline were set at -15 % by 2025. The targets for 2030 are -37.5 % for new cars and -31 % for new vans. From 2021 onward, compliance with CO2 emis-sion targets will be measured in the Worldwide Harmonized Light Vehicles Test Procedure (WLTP) test procedure, which became mandatory for new vehicles in September 2018. For newly registered heavy-duty vehicles (HDVs), currently adopted CO2 emissions targets are -15 % by 2025 and -30 % by 2030, relative to a 2019 baseline (Rodríguez, 2019).
In July 2021, however, the European Commission brought forward a regulatory proposal for strengthening post-2020 CO2 standards for new light-duty vehicles (LDVs). The proposal raises the ambition of the 2030 target to -55 % for new pas- senger cars and -50 % for new vans, again relative to a 2021 baseline. Further, it introduces a new 2035 target set at -100 % for both cars and vans. The proposed amendment is part of the Commission’s “Fit for 55” regulatory package, which, among other actions, aims to bring road transport CO2 targets in line with the EU’s ambition to cut greenhouse gas emissions by at least 55 % by 2030 compared
to 1990 levels (Dornoff et al., 2021). A review of heavy-duty CO2 standards is expected in 2022.
If adopted, the LDV proposal would be a signifi-cant improvement of the current CO2 regulation. However, it lacks the required ambition to place the EU on a credible pathway to meet its economy- wide climate targets and, in particular, its targeted 90 % reduction in emissions from the transport sector by 2050 relative to 1990. With respect to road transport, recent research shows that average CO2 emissions of light-duty and heavy-duty vehicles would have to be as close to 0 g/km as feasible by 2030 and 2040, respectively, if the EU is to achieve its goals (Buysse et al., 2021) (Fig. 1-2). The Commission’s proposal does not suggest the transition from the current five-year target intervals to annual target values or pulling forward the current 2030 to the mid- 2020s, which would help to avoid a delay in the uptake of efficiency technologies and zero-emission vehicles, such as witnessed between 2015 and 2019 (Mock, 2021).
Fig. 1-2Combined pas- senger car, van, and heavy-duty tailpipe CO2 emissions under different policy scenarios compa-red to EU emissions reduction targets in 2030 (economy-wide) and 2050 (transport sector)
https://t1p.de/knhc
Data labels show percent reductions in CO2 emissions in each policy scenario for 2030 and 2050 relative to 1990. In each new-policy scenario, passenger cars and vans reach 100 % zero-emission new vehicle sales by 2030 (higher ambition), 2035 (moderate ambition), or 2040 (lower ambition). Heavy-duty vehicles lag light-duty vehicles in achieving 100 % zero-emission sales by 10 years in each of the scenarios.
Adopted policies-29%
1% (3 Mt)
-2% (-10 Mt)
-6% (-35 Mt)
-11% (-69 Mt)
Tailpipe CO2 emissions in 1990
Lower ambition-79%Moderate ambition-89%Higher ambition-94%0
400
300
200
100
500
600
55% reduction (-330 Mt from 1990)
90% reduction (-540 Mt from 1990)
700
800
Tailpipe CO2 emissions (million tonnes)
Scenario
20502020 2025 2030 2035 2040 2045

7 8
EUROPEAN VEHICLE MARKET STATISTICS 2021/22 1 Introduction
Technologies and key technical parametersThe vast majority of Europe’s new cars are pow-
ered by gasoline or diesel motors. In 2020, for the first time, hybrid electric vehicles (HEVs) and PHEVs recorded similar levels of sales, while BEVs outsold HEVs, although only by a small margin. Almost 6 % of all new car sales were BEVs in 2020, while HEVs and PHEVs each accounted for about 5 % of the market. HEVs were most popular in Finland, where the market share increased to 13 % in 2020. Toyota continues to dominate the market for HEVs sold in Europe, with about 65 % of all new Toyota vehicles in 2020 being hybrid electric.
Top EU markets for BEVs in 2020 were the Netherlands, where 21 % of new car sales were battery electric, followed by Sweden with a BEV share of almost 10 %. Sweden was also the leading market for PHEVs, were they made up 23 % of new sales. Out-side the EU, sales of electric vehicles were particularly high in Norway, where 20 % of new cars sold in 2020 were PHEVs, 54 % were BEVs, and an additional 9 % were HEVs.
In terms of manufacturer brands, Volvo (28 %) and Mercedes-Benz (15 %) were among the top sellers of PHEVs in 2020. Among large manufacturers, Hyundai and Renault led in sales of BEV models, with 12 % of each of the brands’ sales being battery electric. Nissan, the previous BEV leader, had the third-largest share in 2020 with 10 %.
In 2020, the average mass of new cars in the EU and the UK increased to 1,457 kg, 3 % higher than in 2019 and 15 % above 2001 levels. The average mass of the Swedish new car fleet was, at 1,656 kg, well above the EU average and considerably above other relatively heavy EU fleets, such in Germany where the average was 1,539 kg. In contrast, customers in Italy and France opted for significantly lighter cars, with an average weight of 1,338 kg and 1,388 kg, respectively. The average engine power increased to 106 kW in 2020, which is about 43 % more than in 2001.
Between 2016 and 2020, the average mass of new cars grew steadily across all powertrain types except HEVs (Fig. 1-3). During this period, the average mass of conventional gasoline and diesel cars in-creased by 80 kg and 86 kg, respectively, largely due to the rising popularity of SUVs, which cancelled out improvements in vehicle efficiency (Tietge et al., 2021). PHEVs, which combine an electric and a conventional combustion engine drive train, are sig- nificantly heavier than the average EU car, with an average mass of 1,921 kg in 2020. The average mass of BEVs is, at 1,696 kg, also above that of conventional vehicles due to the weight of the battery pack.
Fig. 1-3Average mass in running order of new car registra-tions in the EU and the UK by power-train type
AllHybrid electric
Battery electric
Plug-in hybrid electric
Gasoline
Diesel
1,000
1,200
1,400
1,600
1,800
2,000
Mass in running order (kg)
20202012 2013 2014 2015 2016 2017 2018 2019

9 10
EUROPEAN VEHICLE MARKET STATISTICS 2021/22 1 Introduction
On-road and other emissionsThe Real Driving Emissions (RDE) test proce-
dure was phased-in beginning in 2017 for new vehicle types and is required for all new vehicles as of September 2019. As part of RDE, conformity factors were introduced that regulate how much higher vehicle emissions are allowed to be during on-road testing than during laboratory testing. For nitro- gen oxides (NOx), these conformity factors are 2.1 for the initial phase starting in 2017 (Euro 6d-TEMP standard) and 1.43 from 2020 onward (Euro 6d stan- dard). This means that, in 2020, measured new diesel car NOx emissions could be up to 80 mg/km during laboratory testing but as high as 114 mg/km during an on-road test that is compliant with the RDE requirements. In 2020, however, the Euro 6d standard only applied to new vehicle types, while all new vehicle registrations must be Euro 6d com pliant as of January 2021.
Recent analyses of real-world driving emission levels using remote sensing technology indicate that NOx emissions from Euro 6d-TEMP compliant diesel vehicles are 1.36 to 1.68 times the regulatory limit of 80 mg/km and thus well within the on-road limit of 168 mg/km, ending years of growing discrepancy between on-road and laboratory NOx emissions. The more recent Euro 6d compliant diesel cars dem- onstrate further pollutant emissions reductions, with NOx emissions averaging 1.19 times the labo ratory limit of 80 mg/km and thus meeting the on-road limit of 114 mg/km (Bernard et al., 2021) (Figure 1-4).
The light-duty vehicle CO2 regulation adopted in 2019 required the European Commission to monitor the on-road fuel and electric energy consumption of passenger cars and vans to prevent growth in the gap between type-approval and real-world CO2 emissions. Since 2020, to collect the necessary moni- toring data, manufacturers are required to install on-board fuel and energy consumption monitoring devices (OBFCMs) in new passenger cars and vans. By 2023, the Commission must assess how
Fig. 1-4Mean estimated distance-specific NOx emissions from diesel and gasoline passenger cars, grouped by emissions standard, for Brussels and former TRUE remote sensing campaigns
https://t1p.de/a7ec
OBFCM data may be used to ensure real-world CO2 reductions and, by 2027, also assess the feasibility of adjusting each manufacturer’s average CO2 emissions to its real-world performance beginning in 2030 (Dornoff, 2019).
Whiskers represent the 95 % confidence interval of the mean. Results are only shown for groups with at least 100 measurements. Please refer to the source of the figure for the number of measurements by emissions standard and dataset.
<1 6d5 6 6d-TEMP4321
<1Euro Standard
Euro Standard
6d5 6 6d-TEMP4321
0
0.2
0.4
0.6
0.8
1.0
Regulatory limit
1.2
Mean distance-specific NOx emissions from diesel passenger cars (g/km)
TRUEDataset
Brussels
0
0.2
0.4
0.6
0.8
1.0
Regulatory limit
1.2
Mean distance-specific NOx emissions from gasoline passenger cars (g/km)
TRUEDataset
Brussels

11 12
EUROPEAN VEHICLE MARKET STATISTICS 2021/22
Gasoline 45.0
Diesel 39.3
Battery electric 4.8
Plug-in hybrid electric 4.3
Hybrid electric 4.1
Others 2.3
Unspecified 0.1
Gas 0.1
Powertrain type (%)Segment (%)
SUV/Off-Road38.3
Others 1.1
Others 17.5
Unspecified 5.8
Lower Medium22.6
Upper Medium 2.0
Car derived vans 23.8
Buses 9.7
Mini6.6
Van 5.4
Non-car derived vans58.7
Trucks 84.5
Medium 6.2
Small17.8
Passenger cars10,027,820
Light commercial vehicles1,359,601
Heavy-duty vehicles277,712
2 NUMBER OF VEHICLES
2020 European new light-duty and heavy-duty vehicle registrations by segment and powertrain type
Data is for the 27 EU Member States.
New passenger cars accounted for 86 % of all new road vehicle regis-trations in the EU in 2020. Light commercial vehicles, also known as vans, followed with a market share of roughly 12 %, while the share of trucks and buses combined was below 2.5 %. SUV sales continued to rise and vastly outnumbered sales of all other segments. However, when focusing only on battery electric vehicles, absolute sales were highest in the small passenger car segment. Plug-in hybrid vehicles, in turn, were most popular among SUVs. In 2020, more than half of new plug-in hybrid vehicles sold were SUVs.
13 14
EUROPEAN VEHICLE MARKET STATISTICS 2021/22
Fig. 2-1Passenger cars: New registrations by country
About 11.7 million new cars were registered in the EU and the UK in 2020. Registrations in Europe are dominated by the larger countries; the three largest alone – Germany, France, UK – account for more than 50 % of the total (Fig. 2-1).
Germany is the largest vehicle market, currently with a 25 % share of the EU and the UK markets combined. Registrations in Germany dropped be-tween 2006 and 2008, and then reached an all-time high in 2009 thanks to a government scrap-page scheme. After falling again in 2010, regis- trations gradually increased to around 3.6 million vehicles in 2019, a level comparable to that of 2009. By contrast, in Spain fewer than half as many new vehicles were registered in 2012 as in 2001– 2007. In recent years, sales in Spain have trended upward sharply, reaching roughly 1.4 million in 2019. The outbreak of the coronavirus in 2020 reversed the growth trend in both countries, and sales dipped by 20 % in Germany and 32 % in Spain compared to 2019. In the UK, on the other hand, in light of Brexit, new car sales have decreased since 2016 and showed a 30 % decline during the 2020 pandemic (Fig. 2-2).
In 2020, new car registrations fell across all vehicle segments but market shares by segment re- mained largely unchanged. The SUV segment increased its share to 39 %, from roughly 37 % in 2019, while the share of the Mini segment dropped mar-ginally to 6 %. About 4.6 million new cars in 2020 were SUVs, eight times as many as in 2001 (Fig. 2-4).
The VW Golf remains the most popular car model in Europe, accounting for about 2.4 % of all new vehicle sales in the EU and the UK in 2020, followed by the Renault Clio with a market share of 2.1 % (Fig. 2-10).
New registrations of heavy trucks and buses in the EU and the UK were also impacted in 2020, decreasing to 320 thousand from 430 thousand in 2019 (-26 %) (Fig. 2-12). The truck market in the EU is dominated by only five manufacturers, together accounting for nearly 100 % of all sales (Fig. 2-15).
2 Number of vehicles
Fig. 2-2Passenger cars: New registrations by country
2001 2005 2010
New registrations (millions)
EU-12/13
OthersAustria NetherlandsBelgium
Spain
Italy
United Kingdom
France
Germany
0
10
20
30
40
50
60
70
80
90
100
Market share EU-27 + UK in 2020 (%)
0
2
4
6
8
10
12
14
16
20202015
New registrations (2001 = 100%)
40
50
60
70
80
90
100
110
120
130
EU-27 + UK
Austria
Netherlands
Belgium
Spain Italy
United Kingdom
France
Germany
2001 2005 2010 20202015

15 16
EUROPEAN VEHICLE MARKET STATISTICS 2021/22
Fig. 2-5Passenger cars: New registrations by brand
Fig. 2-6Passenger cars: New registrations by brand
Fig. 2-3Passenger cars: New registrations by vehicle segment
Fig. 2-4Passenger cars: New registrationsby vehicle segment
0
2
4
6
8
10
12
14
16
New registrations (millions) Market share EU-27 + UK
in 2020 (%)
0
10
20
30
40
50
60
70
80
90
100
Others
SUV/o�-road
Van Sport Luxury Upper medium Medium
Lower medium
Small
Mini 2001 2005 2010 20202015
New registrations (2001 = 100%)
SUV/o�-road
All segmentsVan
Sport
Luxury Upper medium
Medium
Lower medium Small
Mini
0
100
200
300
400
500
600
1,100
1,000
700
800
900
2001 2005 2010 20202015
Market share EU-27 + UKin 2020 (%)
Mercedes-Benz
Others
BMW Audi
Opel
Citroën Fiat
Peugeot Ford Renault
VW
New registrations (millions)
0
10
20
30
40
50
60
70
80
90
100
0 2001 2005 2010 20202015
2
4
6
8
10
12
14
16
New registrations (2001 = 100%)
All brands
30
40
50
60
70
80
90
100
110
120
130
160
150
140
Mercedes-Benz
BMW
Audi
Opel
Citroën
Fiat
Peugeot
Ford Renault
VW
2001 2005 2010 20202015
2 Number of vehicles
While in reality many brands are part of a larger group (for example VW, Audi, Škoda, Seat and others are part of the Volkswagen Group), for this report, each of the brands are shown individually. The reason for this is that brand affiliations have changed in the past (as for example in the case of Daimler and Chrysler) and may change in the future.

17 18
EUROPEAN VEHICLE MARKET STATISTICS 2021/22
Fig. 2-8Light commercial vehicles: New registrations by brand
Fig. 2-9Market shares of passenger cars, light commercial vehicles, and trucks and buses, 2020
Fig. 2-7Light commercial vehicles: New registrations by country
Light commercial vehicles (N1 category) in the EU are defined as vehicles designed and constructed for the carriage of goods and having a maximum mass not exceeding 3.5 metric tons. They can be further classified into three sub-categories: N1 class I vehicles with a reference mass (mass in running order plus 25 kg) not exceeding 1,305 kg; N1 class II vehicles with a reference mass between 1,305 and 1,760 kg and N1 class III vehicles with a reference mass above 1,760 kg.
Tab. 2-1Vehicle segment classification used for this report
Segment Model
Mini Fiat 500, Fiat Panda, Toyota Aygo
Small Renault Clio, Peugeot 208, Toyota Yaris
Lower medium VW Golf, Škoda Octavia, Ford Focus
Medium VW Passat, BMW 3-Series, Mercedes-Benz C-Class
Upper medium Mercedes-Benz E-Class, BMW 5-Series, Audi A6
Luxury BMW 7-Series, Mercedes-Benz S-Class, BMW 8-Series
Sport BMW 4-Series, Porsche 911 Carrera, BMW Z4
Van Fiat Ducato, Citroën Berlingo, VW Caddy
SUV/off-road Renault Captur, VW Tiguan, VW T-Roc
0
0.2
0.4
0.6
0.8
1.2
1.0
1.4
2.2
2.0
1.8
1.6
Market share EU-27 + UKin 2020 (%)
0
10
20
30
40
50
60
70
80
90
100
New registrations (millions)
EU-12/13
SwedenOthers
NetherlandsBelgium Spain
Italy
United Kingdom
France
Germany
2009 20202015
Market share EU-27 + UKin 2020 (%)
0
10
20
30
40
50
60
70
80
90
100
New registrations (millions)
Others
Nissan Iveco
Opel Mercedes-Benz
VW
Ford
Peugeot
Fiat
Citroën
Renault 0
0.2
0.4
0.6
0.8
1.2
1.0
1.4
2.2
2.0
1.8
1.6
2009 20202015
Passenger cars (PC)
(86%)
Light commercial vehicles (LCV)(12%)
Trucks and buses > 3.5 t(2%)
Trucks and buses > 3.5 t(3%)
Trucks and buses > 3.5 t(2%)
Germany3.3 millionvehicles
France2.1 millionvehicles
EU-27 + UK
13.6 millionvehicles
PC (79%)
PC (89%)
LCV (19%)
LCV (8%)
2 Number of vehicles

19 20
EUROPEAN VEHICLE MARKET STATISTICS 2021/22
Fig. 2-10Top-selling passenger car models in EU-27 and UK, 2020
Fig. 2-11Top-selling light commercial vehicle models in EU-27 and UK, 2020
Model / New registrations numbers and market share, EU-27 and UK
VW Golf274,448 / 2.4%
247,870 / 2.1%
Renault Clio
176,661 / 1.5%
Škoda Octavia
16.4%Top-selling models
52.0%Top-selling models
83.6%all other models
48.0%all other models
Model / New registrations numbers and market share, EU-27 and UK
Ford Transit228,373 / 13.8%
59,485 / 3.6%
Renault TraficFord Focus170,103 / 1.5%
195,778 / 1.7%
Peugeot 208
51,101 / 3.1%
Iveco Daily
Peugeot Partner62,411 / 3.8%
68,316 / 4.1%
VW Transporter
Renault Master84,295 / 5.1%
61,064 / 3.7%
Citroën Berlingo
Fiat Ducato75,128 / 4.5%
60,375 / 3.7%
Renault Kangoo
108,422 / 6.6%
Mercedes-Benz Sprinter
Toyota Yaris175,343 / 1.5%
Renault Captur176,240 / 1.5%
166,094 / 1.4%
VW PoloVW Tiguan
169,877 / 1.5%
2 Number of vehicles
165,273 / 1.4%
Dacia Sandero

21 22
EUROPEAN VEHICLE MARKET STATISTICS 2021/22
Fig. 2-12Trucks and buses over 3.5 tons: New registrations by country
Fig. 2-14Trucks over 7.5 tons: Categories covered and not covered by adopted CO2 standards, 2020
Fig. 2-13Trucks and buses over 3.5 tons: New registrations by vehicle type
Fig. 2-15Trucks over 7.5 tons: New registra-tions by manu-facturer in the segments covered and not covered by adopted CO2 standards, 2020
Data source: ACEA; data until 2007 is for EU-25 only, data for the UK for 2016 and 2017 is estimated, data for Malta is unavailable
Data is for EU-27 only. The UK was excluded as it will not count for assessing compliance with HDV CO2 standards.
Data source: ACEA; data until 2007 is for EU-25 only, data for the UK for 2016 and 2017 is estimated, distribution of buses below and above 16 tonnes for 2018 is estimated, data for Malta is unavailable
Data is for EU-27 only. The UK was excluded as it will not count for assessing compliance with HDV CO2 standards.
2003 2010 20202015
New registrations (millions)
Others
NetherlandsBelgium
Spain Italy
United Kingdom
France
Poland
Germany
0
10
20
30
40
50
60
70
80
90
100
Market share EU-27 + UK in 2020 (%)
0
0.1
0.2
0.3
0.4
0.5
2003 2010 20202015
New registrations (millions)
0
10
20
30
40
50
60
70
80
90
100
Market share EU-27 + UK in 2020 (%)
0
0.1
0.2
0.3
0.4
0.5
Buses > 16 tons
Buses < 16 tons
Trucks > 16 tons
Trucks < 16 tons
Unregulated
2 axles 7.5–16 t
39%
More than 4 axles, > 16 t7%
Unregulated 27%
Regulated73%
Regulated
4 × 2rigid truck> 16 t11%
4 × 2tractor truck
> 16 t66%
6 × 2rigid truck20%
2 axles, > 16 t21%
4 axles, > 16 t20%
3 axles, > 16 t13%
6 × 2tractor truck3%
Volkswagen29%
Volkswagen31%
DAF 4%Iveco 8%
Volvo 17% Volvo 25%
Others 16%
Daimler24%
Daimler18%
DAF 16%
Others 2%
Unregulated 27%
Regulated73%
Unregulated Regulated
Iveco 10%
2 Number of vehicles

23 24
EUROPEAN VEHICLE MARKET STATISTICS 2021/22
3 FUEL CONSUMPTION & CO2
Global comparison of life-cycle greenhouse gas emissions of medium-size gasoline vs. battery electric passenger cars
Data source: Bieker (2021)
The life-cycle greenhouse gas emissions of battery electric passenger cars registered today are well below those of comparable combustion engine vehicles. In Europe, life-cycle emissions levels of average medium-size battery electric cars are 66 %–69 % lower than those of compa- rable gasoline vehicles, depending on the development of the electricity mix during the vehicles’ lifetime. Even in India, where the electricity mix still relies heavily on coal, medium-size battery electric cars will emit 19 %–34 % less than their conventional counterparts over their lifetime. As the electricity mix continues to decarbonize across the globe, the life- cycle emission benefits of battery electric vehicles compared to conven-tional vehicles registered in 2030 are projected to increase substantially.
Europe United States China India2021 2021
30 26 23 32
38 37 34 3832 32 30 39
45
Error bar66
131147
31
54 79
10983 g CO2 eq./km
103
165
185
63
86
109
148
25 22 20 27
216 228 237 196216 206 190 183
246254 260
228241
228210 210
2021 2021
Gasoline
Battery electric
2030 2030 2030 2030
The error bars indicate the difference between the development of the electricity mix according to stated policies (the higher values) and what is required to align with the Paris Agreement.
vehicle production
vehicle use
Emissions during

25 26
EUROPEAN VEHICLE MARKET STATISTICS 2021/22
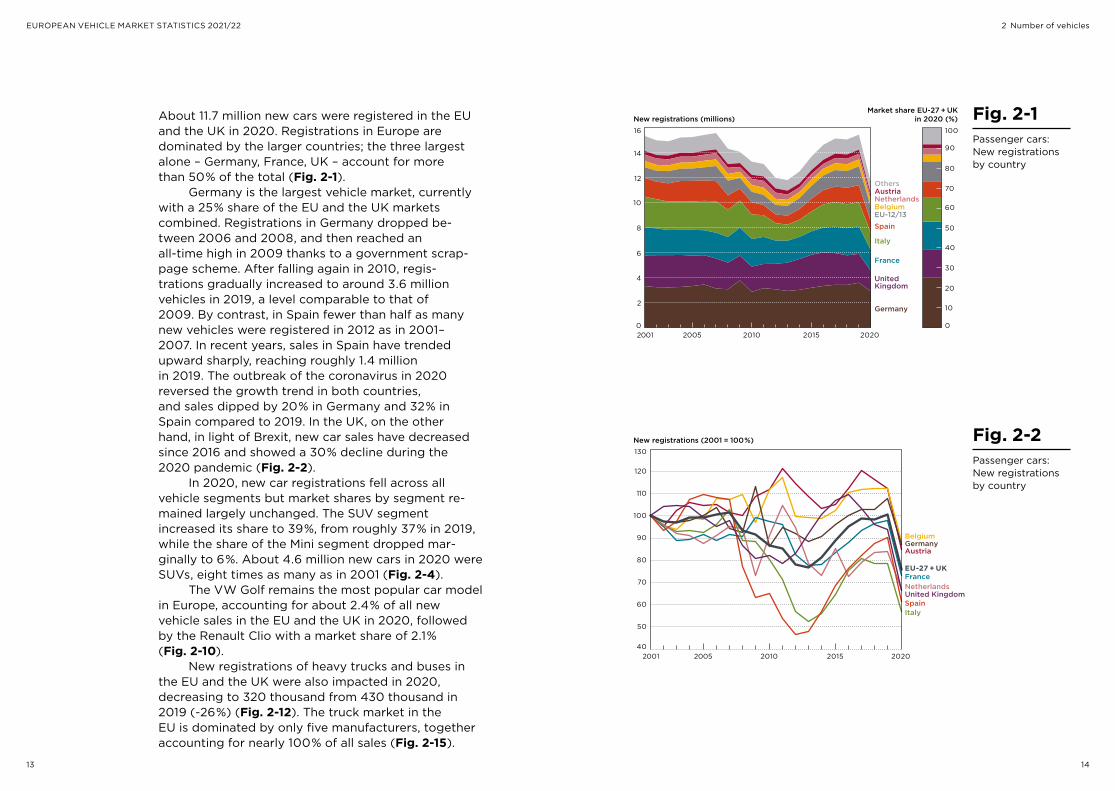
The average CO2 emissions of newly registered cars in the EU and the UK, normalized to the NEDC test cycle, were 109 g/km in 2020. That is 12 g/km less than in the previous year.
Emission levels vary widely among Member States, with Germany at the upper end (114 g/km) and France at the lower end (88 g/km) of the spectrum. Besides France, the Netherlands (88 g/km), and Sweden (92 g/km) have been most successful in reducing emission levels of new passenger cars in recent years (Fig. 3-1).
In 2020, manufacturers were required to meet an average CO2 target of 95 g/km for the 95 % least-emitting new cars in their fleets, with the indi-vidual targets dependent on the average vehicle weight of a manufacturer’s fleet. In 2021, compliance with the target will be required for 100 % of new registrations. Tesla (0 g/km), Peugeot (94 g/km), and Renault (94 g/km) had the lowest fleet average CO2 emission levels of brands sold in the EU in 2020. On the other end of the spectrum, Land Rover (163 g/km) and Porsche (155 g/km) had the highest emission levels (Fig. 3-2).
While average CO2 emission levels for new cars, according to the official test procedure, have de-creased by about 35 % since 2001, vehicle weight has increased by 15% and engine power has increased by 43% (Fig. 3-9). Excluding PHEVs and BEVs, which are heavier and more powerful than conventional cars on average, 2020 average CO2 emissions came to 121 g/km, which is roughly 29 % below 2001 levels, while vehicle weight and engine power grew by 12 % and 37 %, respectively. These develop- ments imply that lower CO2 emissions of conventional vehicles would be possible if vehicle weight and engine size were reduced.
3 Fuel consumption & CO2
Fig. 3-2Passenger cars: CO2 emissions and market share by brand, 2020
Fig. 3-1Passenger cars: CO2 emissions and market share by country, 2020
2015 average target
2020/21 average target
2020 average
Average CO2 emissions (g/km, NEDC)
0 10 20 30 40 50 60 70 80 90 100
Cumulative market share, EU-27 and UK (%)
0
80
60
40
20
100
120
140
160
180
Lancia
VolvoFiat
Ford
Seat
Toyota
Citroën
Mini
Peugeot
Škoda
Nissan
Mitsubishi
HyundaiOpel
Kia
Dacia
HondaLexus
Others
Jeep
Jaguar
MazdaAudi
BMW
Vauxhall
Mercedes-Benz
Porsche
Land Rover
Tesla
SuzukiVW
Renault
Average CO2 emissions (g/km, NEDC)
0 10 20 30 40 50 60 70 80 90 100
Cumulative market share, EU-27 and UK (%)
2015 average target
2020/21 average target
2020 average
80
90
100
110
120
130
140
Belgium
Spain Italy
DenmarkPortugal
Netherlands
Ireland
France
Finland
Sweden
Greece
Austria
Luxembourg
Germany
United Kingdom
EU-12/13
Due to the introduction of the WLTP, NEDC CO2 values are not available for all 2020 new passenger car registrations in the EU. Figures shown make use of available NEDC and WLTP-based NEDC CO2 values and may deviate from other publications.
NEDC data availability for France is limited (43 % of the country’s new registrations). See “Remarks on data sources”.

27 28
EUROPEAN VEHICLE MARKET STATISTICS 2021/22
Fig. 3-3Light commercial vehicles: CO2 emissions and market share by country, 2020
Fig. 3-4Light commercial vehicles: CO2 emissions and market share by brand, 2020
2017 average target
2020 average target
2020 average
Average CO2 emissions (g/km, NEDC)
0 10 20 30 40 50 60 70 80 90 100
Cumulative market share, EU-27 and UK (%)
140
130
150
160
170
180
Spain
Greece
Denmark
Ireland
Italy
United Kingdom
France Portugal
Belgium
EU-12/13
Sweden
FinlandNetherlands
Germany
AustriaLuxembourg
2017 average target
2020 average target
2020 average
Average CO2 emissions (g/km, NEDC)
0 10 20 30 40 50 60 70 80 90 100
Cumulative market share, EU-27 and UK (%)
Citroën Dacia
Fiat
Peugeot
Renault
Opel
Ford
Others
Nissan
VW
Vauxhall
100
120
140
160
180
200
220
240Iveco
Mercedes-Benz
Mitsubishi
Toyota
BMW
FCA-Tesla-HondaHyundai
Kia
Mercedes-Benz
PSA
Renault-Nissan-Mitsubishi
Toyota-Mazda
Average CO2 emissions (g/km, NEDC)
13001200 1400 1500 1600 1700 1800
Average vehicle mass (kg)
2020limit valuecurve
80
90
100
110
120Registrations CO2 values
100,000 Excl. compliance mechanismsIncl. compliance mechanisms500,000
1,000,000
All pools Ford-Volvo
VW
The CO2 emissions estimates for the Belgian and Greek markets cannot be considered reliable due to limited NEDC data availability (8 % and 22 % of the countries’ new registrations, respectively). See “Remarks on data sources”.
Tab. 3-1EU new passenger car CO2 emissions and weight in 2020 by manufacturer and corresponding 2020 targets
Fig. 3-5EU new passenger car CO2 emissions and weight in 2020 by manufacturer and corresponding 2020 targets
https://t1p.de/niu1
3 Fuel consumption & CO2
https://t1p.de/niu1
Manufacturer pool/ Manufacturer
EU market share (%)
Average mass (kg) CO2 values (g/km, NEDC)
2020 average excl. compliance
mechanisms
2020 average incl. compliance
mechanisms2020
target
Ford-Volvo 8 1,582 109 96 102
BMW 7 1,654 114 100 104
PSA 15 1,314 97 89 93
Hyundai 3 1,400 104 93 96
Kia 4 1,401 104 93 96
FCA-Tesla-Honda 7 1,374 104 92 95
Mercedes-Benz 6 1,734 119 104 107
Toyota-Mazda 7 1,397 100 94 96
Renault-Nissan-Mitsubishi 14 1,341 104 93 94
Volkswagen 25 1,500 112 100 99
29 30
EUROPEAN VEHICLE MARKET STATISTICS 2021/22
Fig. 3-6Passenger cars: CO2 emissions by country
Fig. 3-7Passenger cars: CO2 emissions by brand
Average CO2 emissions (g/km, NEDC)
Netherlands
EU-27 + UK
Germany
100
80
90
110
120
130
140
150
160
170
180
2001 2005 2010 20202015
2015 average target
2020/21 average target
Spain Austria
Italy
United Kingdom
France
Belgium
Average CO2 emissions (g/km, NEDC)
All brands
Mercedes-Benz
Opel Citroën
Fiat
Peugeot
Ford
Renault
VW
90
100
110
120
130
140
150
160
170
180
190
200
210
2015 average target
2020/21 average target
BMW Audi
2001 2005 2010 20202015
Average CO2 emissions (g/km, NEDC)
Diesel (PC)
Hybrid-electric (PC)
Gasoline (PC)
All (PC)
2015 average target (PC)
2020 average target (LCV)
2020/21 average target (PC)
All (LCV)
2017 average target (LCV)
80
100
90
120
140
130
110
150
160
170
180
190
2001 2005 2010 20202015
Fig. 3-9Passenger cars: CO2 emissions and technical parameters
Fig. 3-8Passenger cars and light commer-cial vehicles: CO2 emissions by engine technology
All passenger cars (2001 = 100%)
CO2
Weight
Engine power
Engine displacement
70
60
80
90
100
110
120
150
140
130
2001 2005 2010 20202015
3 Fuel consumption & CO2
NEDC data availability for Spain for 2019 and for France for 2020 is limited (66 % and 43 % of the countries’ new registrations, respectively). See “Remarks on data sources”.
NEDC data availability for VW for 2019 is limited (57 % of the brand’s new registrations). See “Remarks on data sources”.
31 32
EUROPEAN VEHICLE MARKET STATISTICS 2021/22
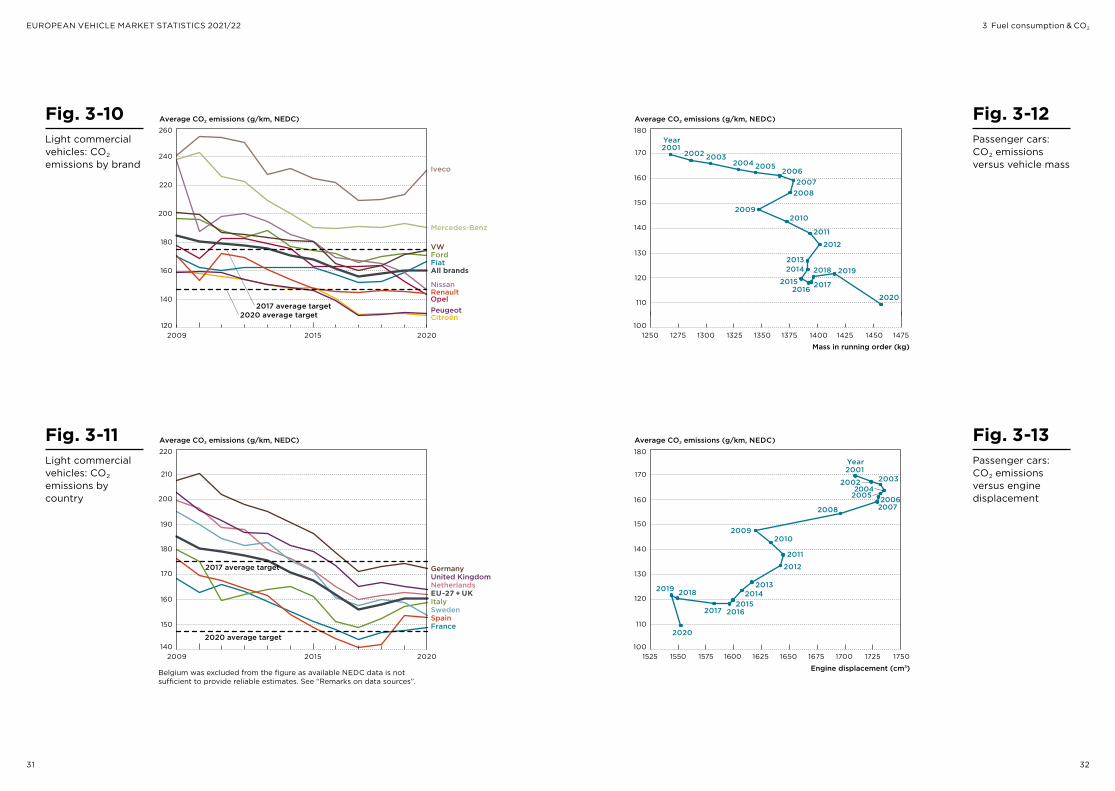
Fig. 3-10Light commercial vehicles: CO2 emissions by brand
Average CO2 emissions (g/km, NEDC)
All brands
Mercedes-Benz
Citroën
Fiat Ford
Renault
VW
Iveco
Nissan
2020 average target 120
140
160
180
200
220
240
260
2017 average target Peugeot Opel
2009 20202015
Fig. 3-12Passenger cars: CO2 emissions versus vehicle mass
Fig. 3-13Passenger cars: CO2 emissions versus engine displacement
Average CO2 emissions (g/km, NEDC)
Mass in running order (kg)
2001Year
2011
2012
20132014
20152016
2017
2018 2019
2020
2009
20082007
2006
2002
2010
200520042003
1250 1275 1300 1325 1350 1375 1400 1425 14751450
120
100
110
130
140
150
160
170
180
Average CO2 emissions (g/km, NEDC)
1525 1550 1575 1600 1625 1650 1675 1700 1725 1750
Engine displacement (cm3)
2011
2012
20142015
20162017
20182019
2020
2013
2009
2008 2007
2001Year
2005
2003
2010
20062004
2002
100
110
130
140
150
160
170
180
120
Fig. 3-11Light commercial vehicles: CO2 emissions by country
Average CO2 emissions (g/km, NEDC)
France
Italy
Spain
Netherlands EU-27 + UK
GermanyUnited Kingdom
2017 average target
2020 average target
Sweden
140
150
160
170
180
190
200
210
220
2009 20202015
3 Fuel consumption & CO2
Belgium was excluded from the figure as available NEDC data is not sufficient to provide reliable estimates. See “Remarks on data sources”.

33 34
EUROPEAN VEHICLE MARKET STATISTICS 2021/22
Passenger cars 11,800,289 registrations
Light commercial vehicles1,686,182 registrations
4 TECHNOLOGIES & KEY PARAMETERS
2020 European market shares of internal combustion engine and electric vehicle models by manufacturer
The ten most-sold passenger car models in Europe captured a market share of about 15 % in 2020. All of them are powered by conventional internal combustion engines. However, with the unprecedented growth experienced in the European electric vehicle market in 2020, a hand - ful of battery electric vehicle models are now closer to ranking among the top sellers. The light commercial vehicle market is significantly more concentrated, with the top-ten best-selling models accounting for 57 % of new registrations. Among leading manufacturers, Renault has the highest battery electric share in both the passenger car and light commercial vehicle markets. Data is for the 27 EU Member States, the UK, Norway, and Iceland.
VW
Golf
Sprinter
Vito
Clio 208 A-Class
ZoeID.3
Renault Peugeot Mercedes
Citroën
Ford ToyotaBMW Škoda
Audi
Jeep
SEAT
Nissan
Volvo
Land Rover
Mitsubishi
Tesla
DS
MG
Subaru Lancia
Alfa Romeo
Smart
Kia
Mini
Honda
Others
Porsche
Jaguar Lexus
Suzuki
Mazda
Hyundai Dacia
Fiat
Opel
Conventional internal combustion engine
Hybrid electric
Battery electric
Powertrain type
Plug-in hybrid electric
Other powertrain types
All makes and models with less than 0.01 % of total new registrations are grouped as Others
VW
Renault
PeugeotMercedes CitroënFord
Toyo
ta
Ivec
o NissanNV200
Dacia
Mitsubishi
MAN
StreetScooterWork L
Opel
FiatFocus
Kuga
3-Series
i3
Yaris Octavia
LeonSanderoKonaNiro
e-t
ron
Lea
f
A3
Panda
Corsa
Qashqai Model 3
XC40
Mini
C3
100,000
20,000
500,000
250,000
New registrations
Kangoo

35 36
EUROPEAN VEHICLE MARKET STATISTICS 2021/22
The share of diesel cars sold in the EU and the UK dropped considerably from 44 % in 2017 to 29 % in 2020. In France, where the diesel share was previ-ously well above the EU average, it dropped from a peak of 77 % in 2008 to 32 % in 2020. In the Nether-lands, the share of diesel cars fell below the 5 % threshold (Fig. 4-1). Mercedes and BMW were among the brands with the highest diesel penetration, each with a share of about 47 % (Fig. 4-6).
The total market share of HEVs was 5 % in 2020. Sales of HEVs were particularly strong in Finland, where they reached a 13 % share in 2020, and were also relatively popular in Sweden (8 %), Spain (8 %), and the Netherlands (7 %) (Fig. 4-2). Nearly 65% of all new vehicles manufactured by Toyota which were sold in the EU and the UK were hybrid electric (Fig. 4-7).
PHEVs and BEVs made a breakthrough in the market in 2020, with each accounting for 5 % to 6 % of all new car sales. Plug-in hybrid cars were par- ticularly successful in Sweden, where the share rose from 7 % in 2019 to 23 % in 2020, and for the Mercedes brand (15 % in 2020 versus 2 % in 2019) (Fig. 4-3, Fig. 4-8). BEVs reached the highest market share in the Netherlands (21 %) and for the Renault brand (12 %) (Fig. 4-4, Fig. 4-9).
The average engine power of new passenger cars in the EU and the UK increased to 106 kW in 2020, which is 43 % more than in 2001. Vehicles in Sweden and Germany, with average engine power values of 131 kW and 122 kW, respectively, were equipped with significantly more powerful engines than the EU average. Conversely, the average engine power of new cars in Italy was 86 kW in 2020 (Fig. 4-14).
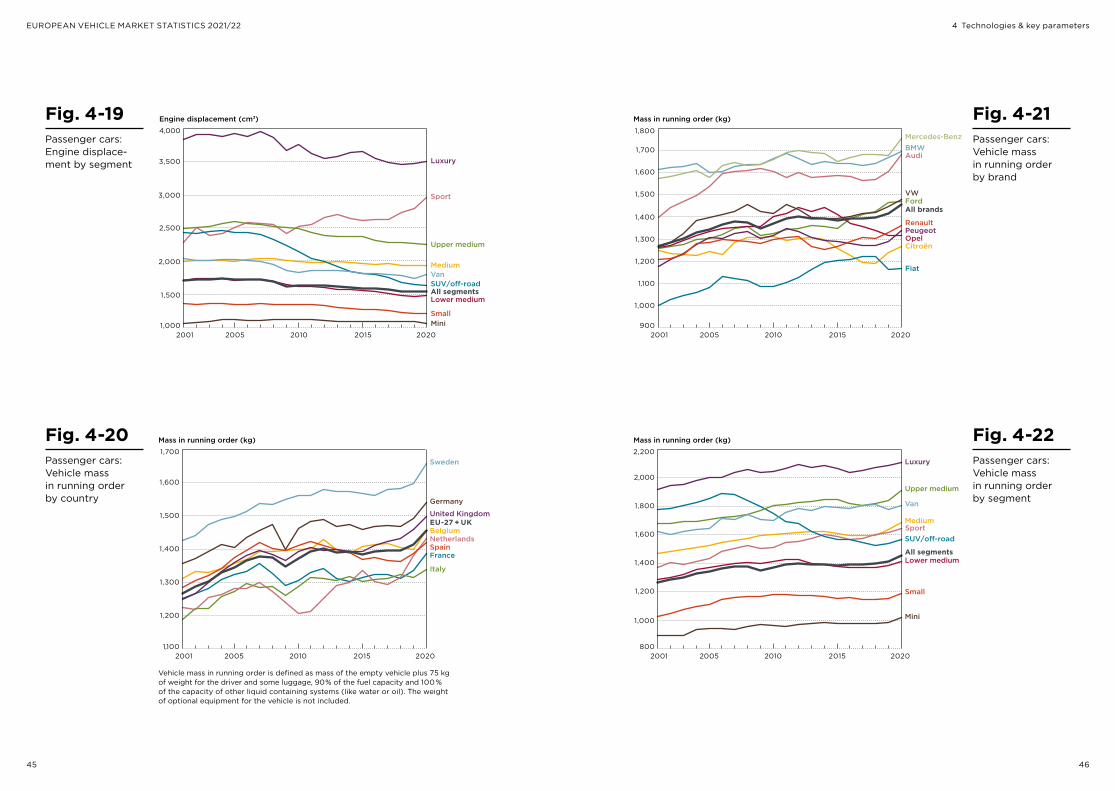
In 2020, the average mass of new cars in the EU and the UK was, at 1,457 kg, 3 % higher than in 2019. The Swedish and German new car fleets, with average mass values of 1,656 kg and 1,539 kg, respectively, were also significantly heavier than the EU average. In contrast, customers in France opted for signifi- cantly lighter cars, with an average weight of 1,388 kg (Fig. 4-20).
Fig. 4-1Passenger cars: Market share of diesel vehicles by country
Fig. 4-2Passenger cars: Market share of hybrid electric vehicles (excl. plug-in hybrid) by country
EU-27 + UK
Austria
Netherlands
Belgium
Spain Italy
United Kingdom
France Germany
0
10
20
30
40
50
60
70
80
90
100
Market share, diesel vehicles (%)
2001 2005 2010 20202015
EU-27 + UK
Netherlands
Sweden
United Kingdom
Belgium
Spain
Finland
Italy
France
Germany
Market share, hybrid electric vehicles (%)
0
2
4
6
8
10
14
12
2001 2005 2010 20202015
4 Technologies & key parameters

37 38
EUROPEAN VEHICLE MARKET STATISTICS 2021/22
Fig. 4-3Passenger cars: Market share of plug-in hybrid electric vehicles by country
Fig. 4-6Passenger cars: Market share of diesel vehicles by brand
0
10
20
30
40
50
60
70
80
90
100
Market share, diesel vehicles (%)
Mercedes-Benz BMW Audi
Opel
Toyota
Citroën
Fiat
Peugeot
Ford
Renault VW
All brands
2001 2005 2010 20202015
Fig. 4-4Passenger cars: Market share of battery electric vehicles by country
Fig. 4-5Passenger cars: Market share of natural gas and petroleum gas vehicles (mono- and bivalent) by country
EU-27 + UK
Italy
EU-27 + UK (excl. Italy) 0
5
10
15
20
25
Market share, natural gas and petroleum gas vehicles (%)
2001 2005 2010 20202015
EU-27 + UK
Netherlands
Belgium
Denmark
Sweden
Spain Italy
United Kingdom
France
Germany
Market share, plug-in hybrid electric vehicles (%)
2012 2019 20202017 201820162015201420130
5
10
25
20
15
EU-27 + UK
Netherlands
Belgium
Sweden
Spain Italy
United Kingdom
France
Austria
Germany
Market share, battery electric vehicles (%)
2012 202020192018201720162015201420130
2
4
6
8
10
12
14
16
18
20
22
4 Technologies & key parameters

39 40
EUROPEAN VEHICLE MARKET STATISTICS 2021/22
Fig. 4-8Passenger cars: Market share of plug-in hybrid electric vehicles by brand
Mercedes-Benz
BMW
Audi Opel
Citroën
Fiat
Peugeot
Ford
Renault
VW All brands
0
4
8
6
2
12
10
16
14
20
18
Market share, natural gas and petroleum gas vehicles (%)
2001 2005 2010 20202015
Fig. 4-7Passenger cars: Market share of hybrid electric vehicles (excl. plug-in hybrid) by brand
Fig. 4-9Passenger cars: Market share of battery electric vehicles by brand
Fig. 4-10Passenger cars: Market share of natural gas and petroleum gas vehicles (mono- and bivalent) by brand
Market share, plug-in hybrid electric vehicles (%)
Mercedes-Benz
BMW
Audi
Opel Citroën Fiat
Peugeot
Ford
Renault
VW
All brands
0
2
4
8
18
16
6
14
12
10
2012 20202019201820172016201520142013
Market share, battery electric vehicles (%)
Mercedes-Benz
BMW
Audi Opel
Citroën Fiat
Peugeot
Renault
Ford 0
VW
All brands
2
6
8
10
12
14
4
2012 20202019201820172016201520142013
Mercedes-Benz BMW
Audi Opel
Citroën Fiat
Peugeot
Ford Renault
VW
Toyota
All brands
Market share, hybrid electric vehicles (%)
0
10
20
70
60
40
50
30
2001 2005 2010 20202015
4 Technologies & key parameters

41 42
EUROPEAN VEHICLE MARKET STATISTICS 2021/22
Fig. 4-11Passenger cars: Market share of diesel vehicles by segment
Market share, vehicles with automatic transmission (%)
0
10
20
30
40
50
60
70
80
90
100
SUV/o�-road
Van
Sport
Luxury Upper medium Medium
Lower medium All segments
Small
Mini
2001 2005 2010 20202015
Fig. 4-13Passenger cars: Market share of vehicles with automatic transmission by segment
Fig. 4-14Passenger cars: Engine power by country
Fig. 4-12Light commercial vehicles: Market share of fuels by country, 2020
Engine power (kW)
EU-27 + UKNetherlands
Spain
BelgiumAustria
Italy
United Kingdom
France
Germany
60
65
70
75
80
85
90
95
100
125
120
115
110
105
2001 2005 2010 20202015
Diesel94%
90%
4%5% 1%
93%
3% 1% 3%
Gasoline3%
Natural gas1% Battery electric
2%
EU-27 + UK1.7 million
new registrations
Germany0.3 million
new registrations
Italy0.2 million
new registrations
Market share, diesel vehicles (%)
0
10
20
30
40
50
60
70
80
90
100
SUV/o�-road
Van
Sport
Luxury
Upper medium
Medium
Lower medium
All segments
Small Mini
2001 2005 2010 20202015
4 Technologies & key parameters

43 44
EUROPEAN VEHICLE MARKET STATISTICS 2021/22
1,100
1,500
1,300
1,700
1,900
2,100
2,300
2,500
Mercedes-Benz
BMW
Audi
Opel Citroën Fiat Peugeot Ford
Renault
VW All brands
Engine displacement (cm3)
2001 2005 2010 20202015
Belgium
AustriaEU-27 + UK
Netherlands
Spain
Italy
United Kingdom
France
Germany
1,300
1,400
1,500
1,600
1,700
1,800
1,900
Engine displacement (cm3)
2001 2005 2010 20202015
Fig. 4-17Passenger cars: Engine displace-ment by country
Fig. 4-18Passenger cars: Engine displace-ment by brand
Fig. 4-15Passenger cars: Engine power by brand
Fig. 4-16Passenger cars: Engine power by segment
Mercedes-Benz
BMW Audi
Opel
Citroën
Fiat
Peugeot
Ford VW All brands
Renault
Engine power (kW)
50
60
70
80
90
100
110
120
130
140
160
150
2001 2005 2010 20202015
Engine power (kW)
SUV/o�-road
Van
Sport
Luxury
Upper medium
Medium
Lower medium
All segments
Small Mini
0
50
100
150
200
250
300
2001 2005 2010 20202015
4 Technologies & key parameters
45 46
EUROPEAN VEHICLE MARKET STATISTICS 2021/22
Fig. 4-19Passenger cars: Engine displace-ment by segment
1,000
1,500
2,000
2,500
3,000
3,500
4,000
SUV/o�-road Van
Sport
Luxury
Upper medium
Medium
Lower medium All segments
Small Mini
Engine displacement (cm3)
2001 2005 2010 20202015
Fig. 4-20Passenger cars: Vehicle mass in running order by country
Vehicle mass in running order is defined as mass of the empty vehicle plus 75 kg of weight for the driver and some luggage, 90% of the fuel capacity and 100 % of the capacity of other liquid containing systems (like water or oil). The weight of optional equipment for the vehicle is not included.
1,100
1,200
1,300
1,400
1,500
1,700
1,600
Mass in running order (kg)
EU-27 + UK
NetherlandsBelgium
Spain
Italy
United Kingdom
France
Sweden
Germany
2001 2005 2010 20202015
Fig. 4-21Passenger cars: Vehicle mass in running order by brand
Mass in running order (kg)
900
1,000
1,100
1,200
1,300
1,400
1,500
1,600
1,800
1,700
Mercedes-Benz BMW Audi
Opel Citroën
Fiat
Peugeot
Ford
Renault
VW
All brands
2001 2005 2010 20202015
Fig. 4-22Passenger cars: Vehicle mass in running order by segment
Mass in running order (kg)
800
1,000
1,200
1,400
1,600
1,800
2,000
2,200
SUV/o�-road
Van
Sport
Luxury
Upper medium
Medium
Lower medium All segments
Small
Mini
2001 2005 2010 20202015
4 Technologies & key parameters

47 48
EUROPEAN VEHICLE MARKET STATISTICS 2021/22
5 ON-ROAD & OTHER EMISSIONS
Transport-related air pollutant emissions in Europe and implementation year of Euro Standards (Index 1990 = 100)
Road vehicle standards for air pollutant emissions were first intro- duced in Europe in 1970, transforming into the Euro standards in 1992, in an effort to mitigate the associated health risks. The adoption of these standards has resulted in a significant decrease in transport-related pollutant emissions, despite a concurrent overall rise in transport activity. The health benefits of the Euro regulations extend far beyond European borders, with over 80 % of global on-road vehicle sales following standards based on European emission limits. The European Commission intends to propose an increase to the stringency of these standards in 2022, with the formal adoption and implementation of Euro 7/VII expected in the coming years.
Data source: Mulholland et al. (2021) Data is for the 27 EU Member States.
Euro Standard
Euro 1/I
highest emissionslowest emissions
2/II 3/III 4/IV 5/V 6/VI
Passenger cars
Light commercial vehicles
Carbon monoxide (CO) Nitrogen oxides (NOx) Particulate matter (PM)
Heavy-duty vehicles100
1990 2000 2010 20190
100
1990 2000 2010 20190
100
1990 2000 2010 20190
100
1990 2000 2010 20190
100
1990 2000 2010 20190
100
1990 2000 2010 20190
100
1990 2000 2010 20190
100
1990 2000 2010 20190
100
1990 2000 2010 20190

49 50
EUROPEAN VEHICLE MARKET STATISTICS 2021/22
Since September 2014, Euro 6 emission limits have applied to new-vehicle type-approvals and, since September 2015, they have been mandatory for all new-vehicle sales (Tab. 5-1). The RDE on-road test procedure, introduced in two steps over a multi-year period beginning in September 2017, applies not-to-exceed (NTE) emission limits for NOx and par- ticulates (Tab. 5-2). During the first RDE stage, which corresponds to the Euro 6d-TEMP standard, temporary NTE limits applied, while the final, more stringent limits are mandatory for all new- vehicle type-approvals since the phase-in of the second stage (Euro 6d) in January 2020. By the end of 2020, about 67 % of new passenger car registrations were Euro 6d-TEMP compliant, and an additional 12 % met the Euro 6d emission limits (Fig. 5-1).
5 On-road & other emissions
Tab. 5-1EU emission limits for gasoline and diesel passenger cars
Tab. 5-2RDE timeline and conformity factors
EU emission limits for gasoline passenger cars (in g/km)
Effective date* CO HC NMHC NOx HC+NOx PM PN
Euro 3 Jan 2000 2.30 0.20 – 0.15 – – –
Euro 4 Jan 2005 1.00 0.10 – 0.08 – – –
Euro 5 Sep 2009 1.00 0.10 0.068 0.06 – 0.0050 –
Euro 6 Sep 2014 1.00 0.10 0.068 0.06 – 0.0050 6.0 x 10¹¹**
EU emission limits for diesel passenger cars (in g/km)
Effective date* CO HC NMHC NOx HC+NOx PM PN
Euro 3 Jan 2000 0.64 – – 0.50 0.56 0.0500 –
Euro 4 Jan 2005 0.50 – – 0.25 0.30 0.0250 –
Euro 5 Sep 2009 0.50 – – 0.18 0.23 0.0050 –
Euro 6 Sep 2014 0.50 – – 0.08 0.17 0.0050 6.0 x 10¹¹**
* For new vehicle types** 6.0 × 10¹² within first three years from Euro 6 effective dates. Applies only to diesel and direct-injection gasoline cars.
Emission limits for light commercial (N1) vehicles class I are identical to passenger car limits listed in Tab. 5-1. N1 class II and N1 class III emission limits are not listed here.
All emission levels as tested in the New European Drive Cycle (NEDC). Emissions levels in real-world driving may differ from the test cycle values. CO: Carbon monoxide; HC: Hydrocarbon; NMHC: Nonmethane hydrocarbon; NOx: Nitrogen oxides; HC+NOx: Hydrocarbon and nitrogen oxides; PM: Particulate matter; PN: Particulate number
Implementation of the Real Driving Emissions (RDE) on-road test procedure
Vehicle class Euro 6d-TEMP Euro 6d
New types Sep 1st 2017 Jan 1st 2020
All vehicles Sep 1st 2019 Jan 1st 2021
New types Sep 1st 2018 Jan 1st 2021
All vehicles Sep 1st 2020 Jan 1st 2022
Not-to-exceed (NTE) emission limits of an RDE test result for the entire trip and the urban part alone
NTE pollutant = CF pollutant x EURO 6 pollutant limit
Conformity Factor (CF)
Pollutant Mass of oxides of Number of Mass of carbon nitrogen (NOx) particles (PN) monoxide (CO) Temporary CF 1 + margin PN, no on-road limit/Euro 6d-TEMP with margin = 0.5 only measured
Final CF 1 + margin, 1 + margin PN, no on-road limit/Euro 6d with margin = 0.43 with margin = 0.5 only measured
https://transportpolicy.net
Fig. 5-1Passenger cars: Market share by emissions standard
Market share (%)
0
20
40
60
80
100
Euro 6
Euro 6d Euro 6d-TEMP
Euro 5 Euro 4 Euro 3 Euro 2
2001 2005 2010 20202015
Passenger cars (M1) and smalllight commercial vehicles (N1 CL 1)
Other light commercialvehicles (N1 CL 2, 3 and N2)
2.1

52
Annex
51
EUROPEAN VEHICLE MARKET STATISTICS 2021/22
Remarks on data sources
The basis for the statistics shown in this report is a database compiled by the ICCT. It includes tech- nical information, emission levels, and new registration volumes at a vehicle variant level. Sources of infor mation include data obtained by the European Environmental Agency (EEA) on behalf of the European Commission, the German Kraftfahrtbundes- amt (KBA), the Netherlands Vehicle Authority (RDW), the United Kingdom Vehicle Certification Agency (VCA), Allgemeiner Deutscher Auto mobil-Club (ADAC), Automobil Revue, IHS Markit, km77.com, vehicle manufacturers and importers associations, and information provided directly by manufacturers and suppliers. Data included in this publication are aggregated to a great extent and are only intended to illustrate high-level trends. It is not to be considered official data. Due to the introduction of the new WLTP test procedure, NEDC CO2 values are not available for all 2020 new pas-senger car registrations in the EU. Figures shown make use of available NEDC and WLTP-based NEDC CO2 values and may deviate from other publications.
List of figures & tables
Fig. 1-1 3New plug-in and battery electric passenger car sales and sales share in Europe
Fig. 1-2 5Combined passenger car, van, and heavy-duty tailpipe CO2 emissions under different policy scenarios compared to EU emissions reduction targets in 2030 (economy-wide) and 2050 (transport sector)
Fig. 1-3 7Average mass in running order of new car registrations in the EU and the UK by powertrain type
Fig. 1-4 9Mean estimated distance-specific NOx emissions from diesel and gasoline passenger cars, grouped by emissions standard, for Brussels and former TRUE remote sensing campaigns
Fig. 2-1 13Passenger cars: New registrations by country
Fig. 2-2 13Passenger cars: New registrations by country
Fig. 2-3 14Passenger cars: New registrations by vehicle segment
Fig. 2-4 14Passenger cars: New registrationsby vehicle segment
Fig. 2-5 15Passenger cars: New registrations by brand
Fig. 2-6 15Passenger cars: New registrations by brand
Tab. 2-1 16Vehicle segment classification used for this report
Fig. 2-7 16Light commercial vehicles: New registrations by country
Fig. 2-8 17Light commercial vehicles: New registrations by brand
Fig. 2-9 17Market shares of passenger cars, light commercial vehicles, and trucks and buses, 2020
Fig. 2-10 18Top-selling passenger car models in EU-27 and UK, 2020
Fig. 2-11 19Top-selling light commercial vehicle models in EU-27 and UK, 2020
Fig. 2-12 20Trucks and buses over 3.5 tons: New registrations by country
Fig. 2-13 20Trucks and buses over 3.5 tons: New registrations by vehicle type
Fig. 2-14 21Trucks over 7.5 tons: Categories covered and not covered by adopted CO2 standards, 2020
Fig. 2-15 21Trucks over 7.5 tons: New registrations by manufacturer in the segments covered and not covered by adopted CO2 standards, 2020
Fig. 3-1 25Passenger cars: CO2 emissions and market share by country, 2020
Fig. 3-2 25Passenger cars: CO2 emissions and market share by brand, 2020
Fig. 3-3 26Light commercial vehicles: CO2 emissions and market share by country, 2020

53 54
EUROPEAN VEHICLE MARKET STATISTICS 2021/22 Annex
Fig. 3-4 26Light commercial vehicles: CO2 emissions and market share by brand, 2020
Fig. 3-5 27EU new passenger car CO2 emissions and weight in 2020 by manufacturer and corresponding 2020 targets
Tab. 3-1 27EU new passenger car CO2 emissions and weight in 2020 by manufacturer and corresponding 2020 targets
Fig. 3-6 28Passenger cars: CO2 emissions by country
Fig. 3-7 28Passenger cars: CO2 emissions by brand
Fig. 3-8 29Passenger car and light commercial vehicles: CO2 emissions by engine technology
Fig. 3-9 29Passenger cars: CO2 emissions and technical parameters
Fig. 3-10 30Light commercial vehicles: CO2 emissions by brand
Fig. 3-11 30Light commercial vehicles: CO2 emissions by country
Fig. 3-12 31Passenger cars: CO2 emissions versus vehicle mass
Fig. 3-13 31Passenger cars: CO2 emissions versus engine displacement
Fig. 4-1 35Passenger cars: Market share of diesel vehicles by country
Fig. 4-2 35Passenger cars: Market share of hybrid electric vehicles (excl. plug-in hybrid) by country
Fig. 4-3 36Passenger cars: Market share of plug-in hybrid electric vehicles by country
Fig. 4-4 36Passenger cars: Market share of battery electric vehicles by country
Fig. 4-5 37Passenger cars: Market share of natural gas and petroleum gas vehicles (mono- and bivalent) by country
Fig. 4-6 37Passenger cars: Market share of diesel vehicles by brand
Fig. 4-7 38Passenger cars: Market share of hybrid electric vehicles (excl. plug-in hybrid) by brand
Fig. 4-8 38Passenger cars: Market share of plug-in hybrid electric vehicles by brand
Fig. 4-9 39Passenger cars: Market share of battery electric vehicles by brand
Fig. 4-10 39Passenger cars: Market share of natural gas and petroleum gas vehicles (mono- and bivalent) by brand
Fig. 4-11 40Passenger cars: Market share of diesel vehicles by segment
Fig. 4-12 40Light commercial vehicles: Market share of fuels by country, 2020
Fig. 4-13 41Passenger cars: Market share of vehicles with automatic transmission by segment
Fig. 4-14 41Passenger cars: Engine power by country
Fig. 4-15 42Passenger cars: Engine power by brand
Fig. 4-16 42Passenger cars: Engine power by segment
Fig. 4-17 43Passenger cars: Engine displacement by country
Fig. 4-18 43Passenger cars: Engine displacement by brand
Fig. 4-19 44Passenger cars: Engine displacement by segment
Fig. 4-20 44Passenger cars: Vehicle mass in running order by country
Fig. 4-21 45Passenger cars: Vehicle mass in running order by brand
Fig. 4-22 45Passenger cars: Vehicle mass in running order by segment
Tab. 5-1 48EU emission limits for gasoline and diesel passenger cars
Fig. 5-1 49Passenger cars: Market share by emissions standard
Tab. 5-2 49RDE timeline and conformity factors
56
Annex
55
EUROPEAN VEHICLE MARKET STATISTICS 2021/22
Bernard, Y., Dallmann, T., Lee, K., Rintanen, I., & Tietge, U. (2021). Evaluation of real-world vehicle emissions in Brussels. International Council on Clean Transportation (ICCT). TRUE publication. Retrieved from https://theicct.org/publications/true-brussels- emissions-nov21
Bieker, G. (2021). A global comparison of the life-cycle greenhouse gas emissions of combustion engine and electric passenger cars. International Council on Clean Transportation (ICCT). White paper. Retrieved from https://theicct.org/publications/global-LCA-passenger-cars-jul2021
Buysse, C., Miller, J., Díaz, S., Sen, A., & Braun, C. (2021). The role of the European Union’s vehicle CO2 standards in achieving the European Green Deal. International Council on Clean Transportation (ICCT). Briefing paper. Retrieved from https://theicct.org/publications/eu-vehicle-standards-green-deal-mar21
Dornoff, J. (2019). One goal, multiple pathways: A review of approaches for transferring on-board fuel consumption meter data to the European Commission. International Council on Clean Transportation (ICCT). White paper. Retrieved from https://theicct.org/ publications/transferring_obfcm_fuel_data_ec
Dornoff, J., Mock, P., Baldino, C., Bieker, G., Díaz, S., Miller, J., Sen, A., Tietge, U., & Wappelhorst, S. (2021). Fit for 55: A review and evaluation of the European Commission proposal for amending the CO2 targets for new cars and vans. International Council on Clean Transportations (ICCT). Briefing paper. Retrieved from https://theicct.org/publications/fit-for-55-review-eu-sept21
Mock, P. (2019). CO2 emission standards for passenger cars and light-commercial vehicles in the European Union. International Council on Clean Transportation (ICCT). Policy update. Retrieved from https://theicct.org/publications/ldv-co2-stds-eu-2030-update-jan2019
Mock, P. (2021, May 9). Europe’s lost decade: About the importance of interim targets. ICCT Staff Blog. Retrieved from https://theicct.org/blog/staff/interim-targets-europe-may2021
Mulholland, E., Miller, J., Braun, C., Jin, L., Rodríguez, F. (2021). Quantifying the long-term air quality and health benefits from Euro 7/VII standards in Europe. International Council on Clean Transportation (ICCT). Briefing paper. Retrieved from https://theicct.org/publications/eu-euro7-standards-health-benefits-jun21
Rajon Bernard, M., Hall, D., & Lutsey, N. (2021). Update on electric vehicle uptake in European cities. International Council on Clean Transportation (ICCT). Working paper. Retrieved from https://theicct.org/publications/ev-uptake-eu-cities-oct21
Rodríguez, F. (2019). CO2 standards for heavy-duty vehicles in the European Union. International Council on Clean Transportation (ICCT). Policy Update. Retrieved fromhttps://theicct.org/publications/co2-stds-hdv-eu-20190416
Tietge, U., Mock, P., Díaz, S., & Dornoff, J. (2021). CO2 emissions from new passenger cars in Europe: Car manufacturers’ performance in 2020. International Council on Clean Transportation (ICCT). Briefing paper. Retrieved from https://theicct.org/publications/eu-co2-pvs-performance-2020-aug21
Wappelhorst, S. (2020). The end of the road? An overview of combustion-engine car phase-out announcements across Europe. International Council on Clean Transportation (ICCT). Briefing paper. Retrieved from https://theicct.org/publications/combustion- engine-car-phase-out-EU
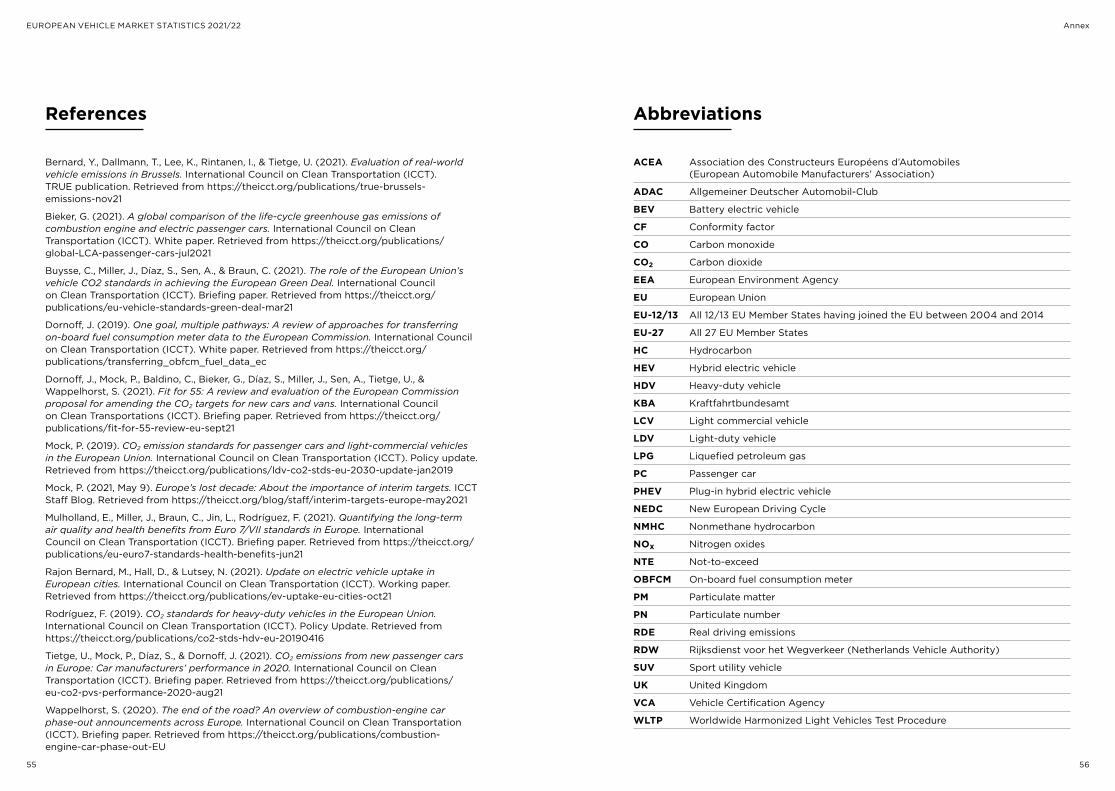
References
ACEA Association des Constructeurs Européens d’Automobiles (European Automobile Manufacturers’ Association)
ADAC Allgemeiner Deutscher Automobil-Club
BEV Battery electric vehicle
CF Conformity factor
CO Carbon monoxide
CO2 Carbon dioxide
EEA European Environment Agency
EU European Union
EU-12/13 All 12/13 EU Member States having joined the EU between 2004 and 2014
EU-27 All 27 EU Member States
HC Hydrocarbon
HEV Hybrid electric vehicle
HDV Heavy-duty vehicle
KBA Kraftfahrtbundesamt
LCV Light commercial vehicle
LDV Light-duty vehicle
LPG Liquefied petroleum gas
PC Passenger car
PHEV Plug-in hybrid electric vehicle
NEDC New European Driving Cycle
NMHC Nonmethane hydrocarbon
NOx Nitrogen oxides
NTE Not-to-exceed
OBFCM On-board fuel consumption meter
PM Particulate matter
PN Particulate number
RDE Real driving emissions
RDW Rijksdienst voor het Wegverkeer (Netherlands Vehicle Authority)
SUV Sport utility vehicle
UK United Kingdom
VCA Vehicle Certification Agency
WLTP Worldwide Harmonized Light Vehicles Test Procedure
Abbreviations

57 58
EUROPEAN VEHICLE MARKET STATISTICS 2021/22 Annex
2020Passenger cars
Pay
load
[kg
]
Leng
th [
mm
]
Wid
th [
mm
]
Hei
ght
[m
m]
Whe
elb
ase
[mm
]
Seat
s
Do
ors
CO
2 (N
ED
C a
nd N
ED
C W
LTP
bas
ed)
[g/k
m]
EU-27 + UK 11,658,884 100 32,035 29 5.0 5.0 5.6 1.8 50 79 5.0 16
Germany 2,917,466 25 37,504 32 2.3 6.9 6.7 0.5 61 70 7.9 22
France 1,646,995 14 29,331 32 5.2 4.5 6.7 1.0 48 90 4.3 6
UK 1,631,064 14 35,643 20 6.7 4.2 6.6 0 56 76 5.8 19
Italy 1,390,032 12 27,548 35 4.7 2.0 2.3 9.0 28 87 2.2 11
EU-13 1,163,059 10 25,176 25 6.0 1.1 1.5 2.1 42 81 1.4 17
Spain 925,908 8 29,485 36 7.9 2.6 2.0 1.5 32 89 2.6 9
Belgium 431,491 4 33,444 33 3.6 7.2 3.5 0.9 42 82 5.8 12
Netherlands 355,595 3 36,033 4 7.0 4.3 20.5 0.6 58 82 9.8 8
Sweden 291,821 3 38,719 22 8.0 22.6 9.6 1.1 86 56 4.4 40
Austria 248,740 2 34,805 40 2.2 3.0 6.4 0.2 44 72 3.2 24
Denmark 199,883 2 42,681 23 4.8 9.1 7.1 0 62 87 6.0 7
Portugal 145,417 1 32,483 34 3.5 8.2 5.4 1.3 36 87 6.6 6
Finland 96,487 1 37,111 15 13.0 13.2 4.4 1.9 70 75 3.0 22
Ireland 88,325 1 30,495 44 10.9 2.8 4.5 0 40 89 3.6 7
Greece 81,002 1 25,450 29 6.5 1.8 0.8 2.2 34 94 0.9 5
Luxembourg 45,599 0 39,380 40 1.8 5.9 5.4 0 93 63 6.3 31
Turkey 610,109 – 38,642 40 2.7 0.1 0.1 4.4 72 93 2.3 5
Switzerland 242,470 – 46,979 26 4.5 6.0 8.1 0.2 83 47 3.2 50
Norway 141,405 – 44,197 9 8.7 20.4 54.3 0 97 44 8.8 47
VW 1,308,051 11 32,219 32 0 3.2 7.8 1.3 52 86 4.0 10
Renault 809,877 7 24,515 29 1.5 2.2 12.3 3.6 36 90 9.1 1
Peugeot 745,668 6 28,050 39 0 2.9 5.4 0 40 99 0 1
Mercedes-Benz 722,606 6 50,917 48 0 15.1 1.9 0 89 43 22.0 35
Ford 679,822 6 28,908 32 1.0 3.6 0 0.8 27 96 1.1 3
BMW 643,354 6 51,171 47 0 12.5 3.1 0 85 30 28.0 42
Toyota 627,033 5 26,562 3 65.0 0.6 0.1 0 70 93 0.2 7
Škoda 617,303 5 27,828 33 0 3.0 2.0 2.1 47 88 0.1 12
Audi 575,154 5 47,933 42 0 7.9 4.3 0.4 79 59 0 41
Fiat 495,687 4 17,832 24 0 0 1.2 3.5 10 97 0 3
Citroën 461,639 4 22,924 38 0 1.4 0.6 0 23 100 0.4 0
Kia 412,934 4 26,904 14 7.5 8.5 8.6 3.2 42 94 0.1 6
Hyundai 408,695 4 26,343 15 9.9 1.2 12.4 0.8 40 95 0.1 5
Dacia 397,155 3 13,372 29 0 0 0.4 19.2 2 92 0 8
Opel 388,627 3 25,288 27 0 2.0 3.9 0 26 98 0 2
Seat 362,849 3 27,751 19 0 2.0 1.7 5.2 36 89 0 11
Nissan 281,424 2 28,591 20 0 0 9.6 0 38 97 0.1 3
Volvo 269,589 2 50,652 39 0 27.9 1.3 0 90 54 0 46
Mini 166,972 1 30,124 7 0 7.6 9.4 0 57 86 0 14
Die
sel [
%]
Full
hyb
rid
(ex
cl. p
lug
-in
hyb
rid
) [%
]
Plu
g-i
n hy
bri
d [
%]
Bat
tery
ele
ctri
c /
fuel
cel
l [%
]
Nat
ural
gas
(m
ono
-/b
ival
ent,
incl
. LP
G)
[%]
Aut
om
atic
[%
]
Fro
nt d
rive
[%
]
Rea
r d
rive
[%
]
4-w
heel
dri
ve [
%]
Eng
ine
pow
er [
KW
]
Eng
ine
size
[cc
m]
Num
ber
of
cylin
der
s
Mas
s in
run
ning
ord
er [
kg]
Gro
ss w
eig
ht [
kg]
106 1553 3.7 1457 1943 529 4345 1802 1547 2658 5.0 4.9 109 EU-27 + UK
122 1717 3.9 1539 2041 538 4430 1815 1553 2698 5.0 4.8 114 Germany
91 1403 3.6 1388 1842 519 4233 1790 1536 2623 5.0 4.9 88 France
118 1588 3.8 1497 1981 532 4369 1810 1539 2669 5.0 4.8 114 UK
86 1424 3.6 1338 1803 503 4180 1772 1551 2581 4.9 4.9 109 Italy
103 1541 3.8 1427 1933 544 4406 1805 1558 2663 5.1 4.9 120 EU-13
96 1497 3.7 1420 1915 532 4343 1805 1564 2660 5.1 4.9 110 Spain
102 1520 3.7 1457 1965 574 4383 1811 1545 2677 5.0 4.9 108 Belgium
108 1395 3.5 1430 1883 490 4277 1786 1523 2639 4.9 4.9 88 Netherlands
131 1735 3.9 1656 2141 528 4562 1828 1541 2734 5.0 4.9 92 Sweden
106 1586 3.8 1501 1997 540 4404 1811 1564 2682 5.1 4.9 113 Austria
103 1496 3.7 1410 1873 501 4309 1786 1524 2642 5.0 4.9 97 Denmark
96 1405 3.6 1398 1871 513 4316 1793 1519 2652 5.0 4.9 96 Portugal
111 1592 3.7 1511 1973 528 4461 1812 1532 2697 5.0 4.9 101 Finland
94 1555 3.7 1438 1954 551 4403 1811 1549 2672 5.1 4.9 107 Ireland
87 1367 3.6 1289 1759 502 4173 1773 1525 2585 5.0 4.9 107 Greece
131 1802 4.0 1549 2095 548 4426 1824 1566 2702 5.0 4.8 119 Luxembourg
91 1418 3.8 1381 1838 494 4436 1804 1513 2665 5.0 4.6 113 Turkey
144 1836 4.1 1644 2128 521 4456 1826 1574 2712 5.1 4.8 126 Switzerland
160 1892 3.9 1794 2252 503 4482 1830 1563 2728 5.0 4.9 37 Norway
103 1539 3.7 1480 1981 545 4348 1801 1564 2659 5.1 4.9 110 VW
82 1275 3.6 1362 1801 487 4189 1789 1535 2627 5.0 5.0 94 Renault
89 1349 3.5 1341 1831 534 4286 1790 1538 2637 5.1 5.0 94 Peugeot
146 1863 4.2 1754 2333 599 4677 1850 1558 2844 5.1 4.7 123 Mercedes-Benz
99 1395 3.5 1468 1977 550 4401 1825 1571 2655 5.2 4.9 113 Ford
151 2102 4.2 1695 2216 588 4594 1847 1526 2788 4.9 4.6 118 BMW
83 1688 3.7 1310 1754 491 4222 1757 1529 2598 4.9 4.9 94 Toyota
100 1479 3.7 1384 1882 541 4467 1811 1510 2652 5.1 5.0 111 Škoda
148 1917 4.2 1680 2189 560 4552 1844 1504 2744 5.0 4.8 122 Audi
69 1342 3.7 1167 1587 445 3891 1690 1546 2408 4.4 4.3 114 Fiat
80 1335 3.4 1266 1761 553 4175 1778 1581 2623 5.0 4.9 103 Citroën
92 1366 3.7 1398 1849 489 4278 1780 1519 2623 5.0 5.0 104 Kia
92 1367 3.7 1394 1837 488 4217 1788 1539 2605 5.0 5.0 108 Hyundai
74 1167 3.4 1221 1677 501 4251 1764 1597 2652 5.1 5.0 114 Dacia
85 1328 3.3 1317 1831 551 4316 1804 1537 2635 5.1 5.0 99 Opel
101 1398 3.6 1361 1849 537 4308 1806 1521 2628 5.1 5.0 115 Seat
99 1263 3.6 1388 1847 485 4337 1796 1580 2640 5.1 5.0 108 Nissan
153 1853 3.8 1866 2373 532 4642 1878 1604 2818 5.1 5.0 112 Volvo
112 1649 3.3 1390 1810 466 4027 1759 1457 2572 4.5 4.0 109 Mini
Tota
l new
sal
es/r
egis
trat
ions
Tota
l new
sal
es/r
egis
trat
ions
[%
]
Pri
ce [
EU
R in
cl. t
ax]
Data by brand is for the 27 EU Member States and the UK in all tables

59 60
EUROPEAN VEHICLE MARKET STATISTICS 2021/22 Annex
2019Passenger cars
Pay
load
[kg
]
Leng
th [
mm
]
Wid
th [
mm
]
Hei
ght
[m
m]
Whe
elb
ase
[mm
]
Seat
s
Do
ors
Fuel
co
nsum
pti
on
(NE
DC
) [l
/10
0 k
m]
Fuel
co
nsum
pti
on
(ext
ra-u
rban
) [l
/10
0 k
m]
Fuel
co
nsum
pti
on
(urb
an)
[l/1
00
km
]
CO
2 (N
ED
C a
nd N
ED
C W
LTP
bas
ed)
[g/k
m]
EU-28 15,467,336 100 30,485 32 1.7 3.7 1.1 1.9 1.6 41 79 6 15 102 1544
Germany 3,607,031 23 35,206 34 2.7 1.6 1.2 1.8 0.4 50 70 9 22 117 1694
UK 2,311,140 15 33,383 27 2.5 4.2 1.5 1.6 0 49 75 8 18 112 1610
France 2,208,560 14 27,754 35 0.7 3.6 0.8 1.9 0.1 40 89 5 7 89 1404
Italy 1,924,158 12 25,769 41 1.1 3.9 0.3 0.6 9.0 24 85 4 11 83 1442
EU-13 1,520,296 10 24,216 25 1.3 4.1 0.3 0.5 0.9 36 82 2 17 100 1534
Spain 1,363,333 9 27,329 33 1.5 6.0 0.6 0.8 1.8 25 89 3 8 93 1478
Belgium 550,003 4 29,836 31 0.6 2.9 1.5 1.6 0.6 33 84 7 10 98 1493
Netherlands 446,114 3 34,071 8 0.8 5.4 1.2 13.9 0.2 52 82 11 7 103 1376
Sweden 356,062 2 33,705 34 2.8 7.1 6.9 4.4 1.3 79 55 4 41 125 1740
Austria 329,363 2 32,468 40 2.0 1.8 0.7 2.7 0.2 36 72 3 25 101 1565
Denmark 226,679 1 41,189 27 1.4 4.4 1.7 2.4 0 53 89 6 5 98 1471
Portugal 223,799 1 29,529 40 1.0 3.4 2.6 3.1 1.0 30 87 9 4 89 1386
Ireland 117,100 1 30,687 46 0.4 8.6 1.1 2.9 0 33 90 4 6 92 1529
Finland 114,246 1 34,725 19 1.4 11.0 5.1 1.7 1.9 60 76 3 21 106 1553
Greece 114,125 1 23,555 27 0.6 4.4 0.4 0.2 2.0 18 95 2 3 79 1347
Luxembourg 55,327 0 37,763 44 2.1 1.5 1.6 1.8 0 91 64 7 29 126 1792
Turkey 387,256 – 30,309 51 0.6 2.8 0.1 0.1 4.8 66 92 3 5 88 1471
Switzerland 315,919 – 42,015 28 3.0 3.4 1.3 4.2 0.4 79 46 3 51 138 1822
Norway 142,380 – 47,518 16 0.8 11.6 13.6 42.4 0 93 44 6 50 156 1828
VW 1,728,487 11 30,762 41 0 0 0.3 1.2 1.4 43 88 0 12 100 1544
Renault 1,053,319 7 23,081 31 0 0 0 4.0 1.1 21 91 8 1 81 1245
Ford 991,363 6 27,032 31 0.1 0.9 0 0 0.3 24 93 1 6 95 1392
Peugeot 974,739 6 26,470 41 0 0 0 0.1 0 31 100 0 0 86 1353
Mercedes-Benz 889,923 6 48,413 55 6.4 0 1.8 0.2 0 85 42 29 29 141 1913
BMW 795,118 5 50,259 53 0.3 0 5.0 3.2 0 82 22 39 39 149 2112
Škoda 731,036 5 26,191 36 0 0 0 0 1.2 42 84 0 16 96 1457
Audi 716,636 5 44,777 49 11.3 0 0.4 1.7 0.5 74 62 0 38 138 1893
Toyota 715,975 5 25,480 3 0 60.5 0.3 0 0 67 94 0 6 79 1648
Fiat 661,311 4 17,464 23 0 0 0 0 5.7 5 96 1 3 68 1343
Citroën 654,635 4 22,343 35 0 0 0 0.2 0 22 100 0 0 79 1326
Opel 650,044 4 22,891 21 0 0 0 0.2 4.2 16 99 0 1 83 1358
Dacia 578,033 4 13,211 26 0 0 0 0 11.1 0 91 0 9 74 1243
Hyundai 546,372 4 24,190 16 1.9 4.4 0.6 4.6 1.1 27 93 0 6 90 1373
Kia 494,792 3 24,750 18 1.3 7.3 3.1 2.5 2.3 33 92 0 8 89 1399
Seat 492,668 3 26,203 24 0 0 0 0 3.7 28 90 0 10 97 1393
Nissan 382,677 2 28,307 30 0 0 0 7.3 0.9 28 96 0 3 95 1368
Volvo 321,815 2 47,111 58 6.3 0 8.2 0 0 83 55 0 45 144 1914
Suzuki 253,756 2 19,949 0 0 0 0 0 0 14 67 0 33 81 1233
Die
sel [
%]
Mild
hyb
rid
[%
]
Full
hyb
rid
(ex
cl. p
lug
-in
hyb
rid
) [%
]
Plu
g-i
n hy
bri
d [
%]
Bat
tery
ele
ctri
c /
fuel
cel
l [%
]
Nat
ural
gas
(m
ono
-/b
ival
ent,
incl
. LP
G)
[%]
Aut
om
atic
[%
]
Fro
nt d
rive
[%
]
Rea
r d
rive
[%
]
4-w
heel
dri
ve [
%]
Eng
ine
pow
er [
KW
]
Eng
ine
size
[cc
m]
Num
ber
of
cylin
der
s
Mas
s in
run
ning
ord
er [
kg]
Gro
ss w
eig
ht [
kg]
3.8 1415 1906 533 4327 1796 1548 2647 5.0 4.8 5.3 4.7 6.4 122 EU-28
3.9 1493 1998 538 4408 1808 1555 2684 5.0 4.8 5.7 4.9 6.9 130 Germany
3.8 1459 1949 543 4355 1803 1539 2660 5.0 4.8 5.5 4.8 6.7 127 UK
3.6 1337 1814 526 4226 1792 1540 2619 5.0 4.9 4.8 4.3 5.7 112 France
3.7 1315 1784 511 4161 1767 1555 2571 4.8 4.9 5.1 4.5 6.0 119 Italy
3.8 1407 1918 548 4398 1799 1556 2658 5.1 4.9 5.5 4.8 6.6 126 EU-13
3.7 1386 1875 530 4320 1798 1562 2647 5.1 4.9 5.3 4.7 6.4 121 Spain
3.7 1400 1909 572 4362 1802 1544 2663 5.0 4.8 5.1 4.5 6.2 119 Belgium
3.5 1382 1838 495 4286 1779 1521 2643 4.9 4.8 5.0 4.5 6.0 99 Netherlands
3.9 1598 2089 537 4559 1825 1543 2731 5.1 4.9 5.6 4.9 6.6 114 Sweden
3.8 1459 1960 539 4385 1805 1565 2670 5.1 4.9 5.3 4.6 6.2 122 Austria
3.7 1363 1836 509 4297 1780 1520 2635 5.0 4.9 5.4 4.4 6.0 107 Denmark
3.6 1341 1816 518 4270 1783 1518 2629 5.0 4.8 5.2 4.4 5.9 104 Portugal
3.7 1418 1928 554 4390 1808 1548 2657 5.0 4.9 4.8 4.4 5.7 110 Ireland
3.8 1467 1936 539 4462 1807 1531 2691 5.1 4.9 5.6 5.0 7.1 112 Finland
3.7 1241 1717 512 4119 1757 1523 2558 5.0 4.9 5.0 4.4 5.9 115 Greece
4.0 1524 2055 546 4414 1821 1560 2693 5.0 4.8 5.7 5.0 6.9 130 Luxembourg
3.9 1371 1835 503 4458 1799 1510 2669 5.0 4.5 4.9 4.3 6.0 119 Turkey
4.0 1590 2074 528 4436 1819 1568 2697 5.1 4.8 6.3 5.3 7.3 135 Switzerland
3.8 1708 2162 517 4508 1830 1548 2732 5.0 4.8 4.5 4.8 6.3 53 Norway
3.7 1446 1968 560 4357 1804 1566 2659 5.1 4.9 5.6 4.9 6.8 123 VW
3.6 1329 1785 502 4217 1779 1534 2632 5.0 5.0 5.0 4.3 6.0 112 Renault
3.5 1465 1953 547 4380 1814 1588 2646 5.2 4.9 5.5 4.7 6.6 129 Ford
3.5 1288 1805 550 4262 1801 1551 2631 5.1 5.0 4.6 4.1 5.4 108 Peugeot
4.3 1675 2255 602 4666 1843 1532 2838 5.0 4.6 5.8 5.1 7.4 140 Mercedes-Benz
4.1 1667 2191 594 4588 1841 1529 2789 4.9 4.6 5.5 4.9 6.6 128 BMW
3.6 1376 1890 555 4448 1800 1507 2648 5.0 5.0 5.1 4.4 6.0 118 Škoda
4.2 1605 2122 562 4532 1837 1491 2739 5.0 4.8 5.6 4.8 6.6 129 Audi
3.8 1291 1725 483 4195 1746 1526 2582 4.9 4.9 4.3 4.1 4.8 98 Toyota
3.8 1161 1594 456 3925 1699 1551 2426 4.5 4.3 5.3 4.5 6.5 124 Fiat
3.4 1239 1753 560 4181 1776 1577 2625 5.1 4.9 4.6 4.1 5.4 108 Citroën
3.7 1315 1801 505 4270 1782 1555 2596 5.0 4.9 5.3 4.5 6.4 123 Opel
3.6 1210 1674 507 4260 1765 1594 2654 5.1 5.0 5.4 4.8 6.3 126 Dacia
3.7 1353 1813 507 4224 1783 1543 2601 5.0 5.0 5.7 4.9 6.8 124 Hyundai
3.8 1360 1821 506 4258 1775 1523 2615 5.0 5.0 5.5 5.0 6.7 123 Kia
3.6 1337 1828 535 4287 1806 1522 2621 5.1 5.0 5.3 4.5 6.2 119 Seat
3.8 1382 1846 485 4323 1790 1570 2622 5.0 5.0 5.4 4.7 6.4 114 Nissan
3.9 1813 2315 538 4647 1873 1576 2816 5.1 5.0 5.5 5.0 6.8 133 Volvo
3.7 1086 1532 479 3975 1727 1570 2475 4.8 4.9 5.2 4.6 6.1 116 Suzuki
Tota
l new
sal
es/r
egis
trat
ions
Tota
l new
sal
es/r
egis
trat
ions
[%
]
Pri
ce [
EU
R in
cl. t
ax]
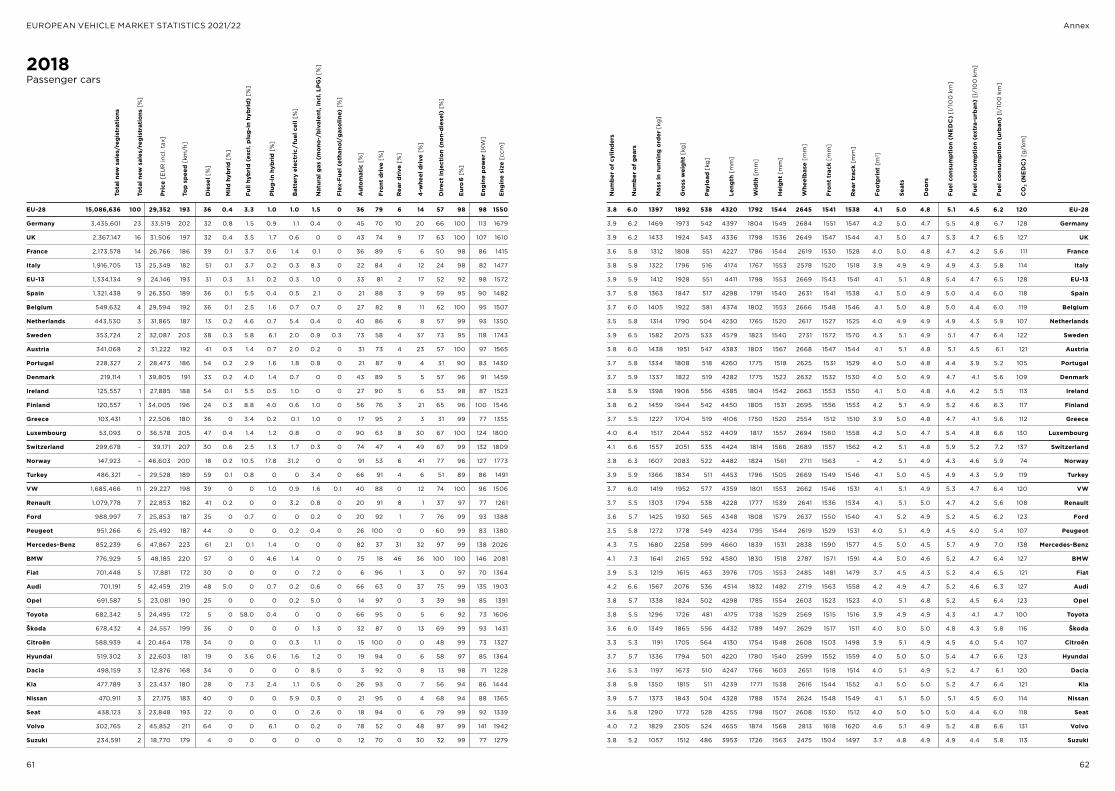
61 62
EUROPEAN VEHICLE MARKET STATISTICS 2021/22 Annex
2018Passenger cars
Pay
load
[kg
]
Leng
th [
mm
]
Wid
th [
mm
]
Hei
ght
[m
m]
Whe
elb
ase
[mm
]
Fro
nt t
rack
[m
m]
Rea
r tr
ack
[mm
]
Foo
tpri
nt [
m2 ]
Seat
s
Do
ors
Fuel
co
nsum
pti
on
(NE
DC
) [l
/10
0 k
m]
Fuel
co
nsum
pti
on
(ext
ra-u
rban
) [l
/10
0 k
m]
Fuel
co
nsum
pti
on
(urb
an)
[l/1
00
km
]
CO
2 (N
ED
C)
[g/k
m]
EU-28 15,086,636 100 29,352 193 36 0.4 3.3 1.0 1.0 1.5 0 36 79 6 14 57 98 98 1550
Germany 3,435,601 23 33,519 202 32 0.8 1.5 0.9 1.1 0.4 0 45 70 10 20 66 100 113 1679
UK 2,367,147 16 31,506 197 32 0.4 3.5 1.7 0.6 0 0 43 74 9 17 63 100 107 1610
France 2,173,578 14 26,766 186 39 0.1 3.7 0.6 1.4 0.1 0 36 89 5 6 50 98 86 1415
Italy 1,916,705 13 25,349 182 51 0.1 3.7 0.2 0.3 8.3 0 22 84 4 12 24 98 82 1477
EU-13 1,334,134 9 24,146 193 31 0.3 3.1 0.2 0.3 1.0 0 33 81 2 17 52 92 98 1572
Spain 1,321,438 9 26,350 189 36 0.1 5.5 0.4 0.5 2.1 0 21 88 3 9 59 95 90 1482
Belgium 549,632 4 29,594 192 36 0.1 2.5 1.6 0.7 0.7 0 27 82 8 11 62 100 95 1507
Netherlands 443,530 3 31,865 187 13 0.2 4.6 0.7 5.4 0.4 0 40 86 6 8 57 99 93 1350
Sweden 353,724 2 32,087 203 38 0.3 5.8 6.1 2.0 0.9 0.3 73 58 4 37 73 95 118 1743
Austria 341,068 2 31,222 192 41 0.3 1.4 0.7 2.0 0.2 0 31 73 4 23 57 100 97 1565
Portugal 228,327 2 28,473 186 54 0.2 2.9 1.6 1.8 0.8 0 21 87 9 4 31 90 83 1430
Denmark 219,114 1 39,805 191 33 0.2 4.0 1.4 0.7 0 0 43 89 5 5 57 96 91 1459
Ireland 125,557 1 27,885 188 54 0.1 5.5 0.5 1.0 0 0 27 90 5 6 53 98 87 1523
Finland 120,557 1 34,005 196 24 0.3 8.8 4.0 0.6 1.0 0 56 76 3 21 65 96 100 1546
Greece 103,431 1 22,506 180 36 0 3.4 0.2 0.1 1.0 0 17 95 2 3 31 99 77 1355
Luxembourg 53,093 0 36,578 205 47 0.4 1.4 1.2 0.8 0 0 90 63 8 30 67 100 124 1800
Switzerland 299,678 – 39,171 207 30 0.6 2.5 1.3 1.7 0.3 0 74 47 4 49 67 99 132 1809
Norway 147,923 – 46,603 200 18 0.2 10.5 17.8 31.2 0 0 91 53 6 41 77 96 127 1773
Turkey 486,321 – 29,528 189 59 0.1 0.8 0 0 3.4 0 66 91 4 6 51 89 86 1491
VW 1,685,466 11 29,227 198 39 0 0 1.0 0.9 1.6 0.1 40 88 0 12 74 100 96 1506
Renault 1,079,778 7 22,853 182 41 0.2 0 0 3.2 0.8 0 20 91 8 1 37 97 77 1261
Ford 988,997 7 25,853 187 35 0 0.7 0 0 0.2 0 20 92 1 7 76 99 93 1388
Peugeot 951,266 6 25,492 187 44 0 0 0 0.2 0.4 0 26 100 0 0 60 99 83 1380
Mercedes-Benz 852,239 6 47,867 223 61 2.1 0.1 1.4 0 0 0 82 37 31 32 97 99 138 2026
BMW 776,929 5 48,185 220 57 0 0 4.6 1.4 0 0 75 18 46 36 100 100 146 2081
Fiat 701,448 5 17,881 172 30 0 0 0 0 7.2 0 6 96 1 3 0 97 70 1364
Audi 701,191 5 42,459 219 48 5.0 0 0.7 0.2 0.6 0 66 63 0 37 75 99 135 1903
Opel 691,587 5 23,081 190 25 0 0 0 0.2 5.0 0 14 97 0 3 39 98 85 1391
Toyota 682,342 5 24,495 172 5 0 58.0 0.4 0 0 0 66 95 0 5 6 92 73 1606
Škoda 678,432 4 24,557 199 36 0 0 0 0 1.3 0 32 87 0 13 69 99 93 1431
Citroën 588,939 4 20,464 178 34 0 0 0 0.3 1.1 0 15 100 0 0 48 99 73 1327
Hyundai 519,302 3 22,603 181 19 0 3.6 0.6 1.6 1.2 0 19 94 0 6 58 97 85 1364
Dacia 498,159 3 12,876 168 34 0 0 0 0 8.5 0 3 92 0 8 13 98 71 1228
Kia 477,789 3 23,437 180 28 0 7.3 2.4 1.1 0.5 0 26 93 0 7 56 94 86 1444
Nissan 470,911 3 27,175 183 40 0 0 0 5.9 0.3 0 21 95 0 4 68 94 88 1365
Seat 438,123 3 23,848 193 22 0 0 0 0 2.6 0 18 94 0 6 79 99 92 1339
Volvo 302,765 2 45,852 211 64 0 0 6.1 0 0.2 0 78 52 0 48 97 99 141 1942
Suzuki 234,591 2 18,770 179 4 0 0 0 0 0 0 12 70 0 30 32 99 77 1279
Tota
l new
sal
es/r
egis
trat
ions
Tota
l new
sal
es/r
egis
trat
ions
[%
]
Pri
ce [
EU
R in
cl. t
ax]
Top
sp
eed
[km
/h]
Die
sel [
%]
Mild
hyb
rid
[%
]
Full
hyb
rid
(ex
cl. p
lug
-in
hyb
rid
) [%
]
Plu
g-i
n hy
bri
d [
%]
Bat
tery
ele
ctri
c /
fuel
cel
l [%
]
Nat
ural
gas
(m
ono
-/b
ival
ent,
incl
. LP
G)
[%]
Flex
-Fue
l (et
hano
l/g
aso
line)
[%
]
Aut
om
atic
[%
]
Fro
nt d
rive
[%
]
Rea
r d
rive
[%
]
4-w
heel
dri
ve [
%]
Dir
ect
inje
ctio
n (n
on-
die
sel)
[%
]
Eur
o 6
[%
]
Eng
ine
pow
er [
KW
]
Eng
ine
size
[cc
m]
Num
ber
of
cylin
der
s
Num
ber
of
gea
rs
Mas
s in
run
ning
ord
er [
kg]
Gro
ss w
eig
ht [
kg]
3.8 6.0 1397 1892 538 4320 1792 1544 2645 1541 1538 4.1 5.0 4.8 5.1 4.5 6.2 120 EU-28
3.9 6.2 1469 1973 542 4397 1804 1549 2684 1551 1547 4.2 5.0 4.7 5.5 4.8 6.7 128 Germany
3.9 6.2 1433 1924 543 4336 1798 1536 2649 1547 1544 4.1 5.0 4.7 5.3 4.7 6.5 127 UK
3.6 5.8 1312 1808 551 4227 1786 1544 2619 1530 1528 4.0 5.0 4.8 4.7 4.2 5.6 111 France
3.8 5.8 1322 1796 516 4174 1767 1553 2578 1520 1518 3.9 4.9 4.9 4.9 4.3 5.8 114 Italy
3.9 5.9 1412 1928 551 4411 1798 1553 2669 1543 1541 4.1 5.1 4.8 5.4 4.7 6.5 128 EU-13
3.7 5.8 1363 1847 517 4298 1791 1540 2631 1541 1538 4.1 5.0 4.9 5.0 4.4 6.0 118 Spain
3.7 6.0 1405 1922 581 4374 1802 1553 2666 1548 1546 4.1 5.0 4.8 5.0 4.4 6.0 119 Belgium
3.5 5.8 1314 1790 504 4230 1765 1520 2617 1527 1525 4.0 4.9 4.9 4.9 4.3 5.9 107 Netherlands
3.9 6.5 1582 2075 533 4579 1823 1540 2731 1572 1570 4.3 5.1 4.9 5.1 4.7 6.4 122 Sweden
3.8 6.0 1438 1951 547 4383 1803 1567 2668 1547 1544 4.1 5.1 4.8 5.1 4.5 6.1 121 Austria
3.7 5.8 1334 1808 518 4260 1775 1518 2625 1531 1529 4.0 5.0 4.8 4.4 3.9 5.2 105 Portugal
3.7 5.9 1337 1822 519 4282 1775 1522 2632 1532 1530 4.0 5.0 4.9 4.7 4.1 5.6 109 Denmark
3.8 5.9 1398 1906 556 4385 1804 1542 2663 1553 1550 4.1 5.0 4.8 4.6 4.2 5.5 113 Ireland
3.8 6.2 1459 1944 542 4450 1805 1531 2695 1556 1553 4.2 5.1 4.9 5.2 4.6 6.3 117 Finland
3.7 5.5 1227 1704 519 4106 1750 1520 2554 1512 1510 3.9 5.0 4.8 4.7 4.1 5.6 112 Greece
4.0 6.4 1517 2044 552 4409 1817 1557 2694 1560 1558 4.2 5.0 4.7 5.4 4.8 6.6 130 Luxembourg
4.1 6.6 1557 2051 535 4424 1814 1566 2689 1557 1562 4.2 5.1 4.8 5.9 5.2 7.2 137 Switzerland
3.8 6.3 1607 2083 522 4482 1824 1561 2711 1563 – 4.2 5.1 4.9 4.3 4.6 5.9 74 Norway
3.9 5.9 1366 1834 511 4453 1796 1505 2669 1549 1546 4.1 5.0 4.5 4.9 4.3 5.9 119 Turkey
3.7 6.0 1419 1952 577 4359 1801 1553 2662 1546 1531 4.1 5.1 4.9 5.3 4.7 6.4 120 VW
3.7 5.5 1303 1794 538 4228 1777 1539 2641 1536 1534 4.1 5.1 5.0 4.7 4.2 5.6 108 Renault
3.6 5.7 1425 1930 565 4348 1808 1579 2637 1550 1540 4.1 5.2 4.9 5.2 4.5 6.2 123 Ford
3.5 5.8 1272 1778 549 4234 1795 1544 2619 1529 1531 4.0 5.1 4.9 4.5 4.0 5.4 107 Peugeot
4.3 7.5 1680 2258 599 4660 1839 1531 2838 1590 1577 4.5 5.0 4.5 5.7 4.9 7.0 138 Mercedes-Benz
4.1 7.3 1641 2165 592 4580 1830 1518 2787 1571 1591 4.4 5.0 4.6 5.2 4.7 6.4 127 BMW
3.9 5.3 1219 1615 463 3976 1705 1553 2485 1481 1479 3.7 4.5 4.3 5.2 4.4 6.5 121 Fiat
4.2 6.6 1567 2076 536 4514 1832 1482 2719 1563 1558 4.2 4.9 4.7 5.2 4.6 6.3 127 Audi
3.8 5.7 1338 1824 502 4298 1785 1554 2603 1523 1523 4.0 5.1 4.8 5.2 4.5 6.4 123 Opel
3.8 5.5 1296 1726 481 4175 1738 1529 2569 1515 1516 3.9 4.9 4.9 4.3 4.1 4.7 100 Toyota
3.6 6.0 1349 1865 556 4432 1789 1497 2629 1517 1511 4.0 5.0 5.0 4.8 4.3 5.8 116 Škoda
3.3 5.3 1191 1705 564 4130 1754 1548 2608 1503 1498 3.9 5.1 4.9 4.5 4.0 5.4 107 Citroën
3.7 5.7 1336 1794 501 4220 1780 1540 2599 1552 1559 4.0 5.0 5.0 5.4 4.7 6.6 123 Hyundai
3.6 5.3 1197 1673 510 4247 1766 1603 2651 1518 1514 4.0 5.1 4.9 5.2 4.7 6.1 120 Dacia
3.8 5.8 1350 1815 511 4239 1771 1538 2616 1544 1552 4.1 5.0 5.0 5.2 4.7 6.4 121 Kia
3.9 5.7 1373 1843 504 4328 1788 1574 2624 1548 1549 4.1 5.1 5.0 5.1 4.5 6.0 114 Nissan
3.6 5.8 1290 1772 528 4255 1798 1507 2608 1530 1512 4.0 5.0 5.0 5.0 4.4 6.0 118 Seat
4.0 7.2 1829 2305 524 4655 1874 1568 2813 1618 1620 4.6 5.1 4.9 5.2 4.8 6.6 131 Volvo
3.8 5.2 1057 1512 486 3953 1726 1563 2475 1504 1497 3.7 4.8 4.9 4.9 4.4 5.8 113 Suzuki
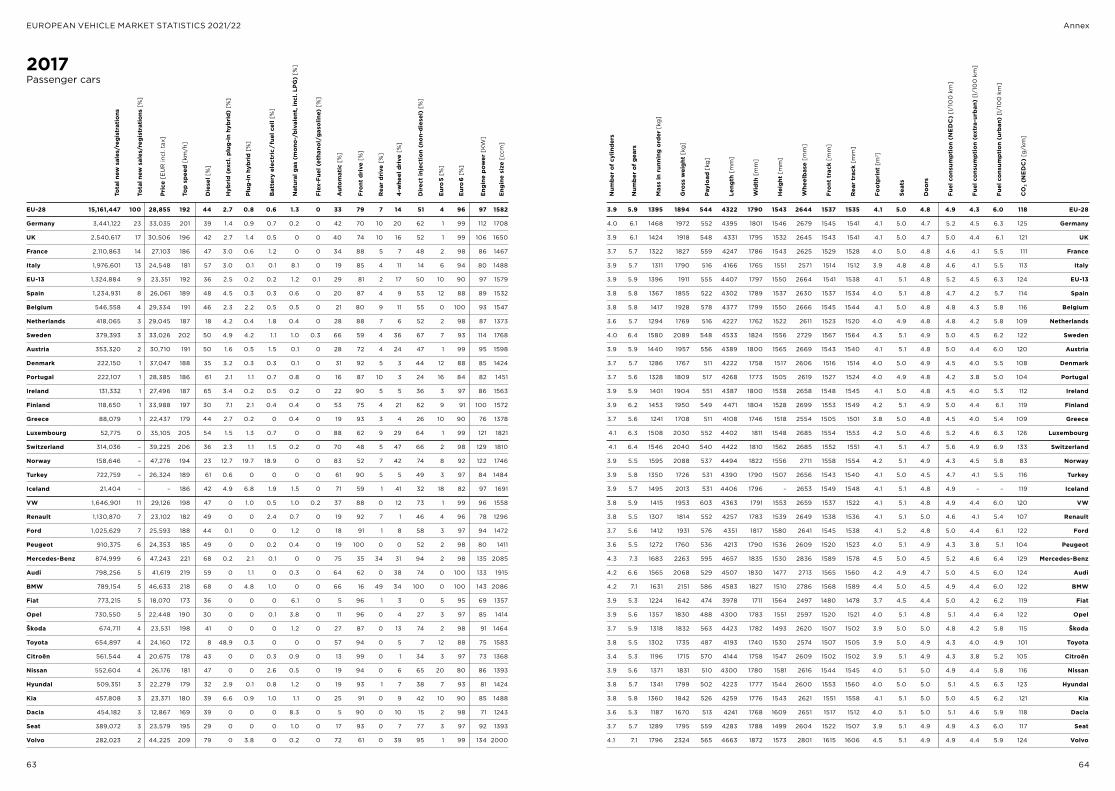
63 64
EUROPEAN VEHICLE MARKET STATISTICS 2021/22 Annex
2017Passenger cars
Pay
load
[kg
]
Leng
th [
mm
]
Wid
th [
mm
]
Hei
ght
[m
m]
Whe
elb
ase
[mm
]
Fro
nt t
rack
[m
m]
Rea
r tr
ack
[mm
]
Foo
tpri
nt [
m2 ]
Seat
s
Do
ors
Fuel
co
nsum
pti
on
(NE
DC
) [l
/10
0 k
m]
Fuel
co
nsum
pti
on
(ext
ra-u
rban
) [l
/10
0 k
m]
Fuel
co
nsum
pti
on
(urb
an)
[l/1
00
km
]
CO
2 (N
ED
C)
[g/k
m]
EU-28 15,161,447 100 28,855 192 44 2.7 0.8 0.6 1.3 0 33 79 7 14 51 4 96 97 1582
Germany 3,441,122 23 33,035 201 39 1.4 0.9 0.7 0.2 0 42 70 10 20 62 1 99 112 1708
UK 2,540,617 17 30,506 196 42 2.7 1.4 0.5 0 0 40 74 10 16 52 1 99 106 1650
France 2,110,863 14 27,103 186 47 3.0 0.6 1.2 0 0 34 88 5 7 48 2 98 86 1467
Italy 1,976,601 13 24,548 181 57 3.0 0.1 0.1 8.1 0 19 85 4 11 14 6 94 80 1488
EU-13 1,324,884 9 23,351 192 36 2.5 0.2 0.2 1.2 0.1 29 81 2 17 50 10 90 97 1579
Spain 1,234,931 8 26,061 189 48 4.5 0.3 0.3 0.6 0 20 87 4 9 53 12 88 89 1532
Belgium 546,558 4 29,334 191 46 2.3 2.2 0.5 0.5 0 21 80 9 11 55 0 100 93 1547
Netherlands 418,065 3 29,045 187 18 4.2 0.4 1.8 0.4 0 28 88 7 6 52 2 98 87 1373
Sweden 379,393 3 33,026 202 50 4.9 4.2 1.1 1.0 0.3 66 59 4 36 67 7 93 114 1768
Austria 353,320 2 30,710 191 50 1.6 0.5 1.5 0.1 0 28 72 4 24 47 1 99 95 1598
Denmark 222,150 1 37,047 188 35 3.2 0.3 0.3 0.1 0 31 92 5 3 44 12 88 85 1424
Portugal 222,107 1 28,385 186 61 2.1 1.1 0.7 0.8 0 16 87 10 3 24 16 84 82 1451
Ireland 131,332 1 27,496 187 65 3.4 0.2 0.5 0.2 0 22 90 5 5 36 3 97 86 1563
Finland 118,650 1 33,988 197 30 7.1 2.1 0.4 0.4 0 53 75 4 21 62 9 91 100 1572
Greece 88,079 1 22,437 179 44 2.7 0.2 0 0.4 0 19 93 3 4 26 10 90 76 1378
Luxembourg 52,775 0 35,105 205 54 1.5 1.3 0.7 0 0 88 62 9 29 64 1 99 121 1821
Switzerland 314,036 – 39,225 206 36 2.3 1.1 1.5 0.2 0 70 48 5 47 66 2 98 129 1810
Norway 158,646 – 47,276 194 23 12.7 19.7 18.9 0 0 83 52 7 42 74 8 92 122 1746
Turkey 722,759 – 26,324 189 61 0.6 0 0 0 0 61 90 5 5 49 3 97 84 1484
Iceland 21,404 – – 186 42 4.9 6.8 1.9 1.5 0 71 59 1 41 32 18 82 97 1691
VW 1,646,901 11 29,126 198 47 0 1.0 0.5 1.0 0.2 37 88 0 12 73 1 99 96 1558
Renault 1,130,870 7 23,102 182 49 0 0 2.4 0.7 0 19 92 7 1 46 4 96 78 1296
Ford 1,025,629 7 25,593 188 44 0.1 0 0 1.2 0 18 91 1 8 58 3 97 94 1472
Peugeot 910,375 6 24,353 185 49 0 0 0.2 0.4 0 19 100 0 0 52 2 98 80 1411
Mercedes-Benz 874,999 6 47,243 221 68 0.2 2.1 0.1 0 0 75 35 34 31 94 2 98 135 2085
Audi 798,256 5 41,619 219 59 0 1.1 0 0.3 0 64 62 0 38 74 0 100 133 1915
BMW 789,154 5 46,633 218 68 0 4.8 1.0 0 0 66 16 49 34 100 0 100 143 2086
Fiat 773,215 5 18,070 173 36 0 0 0 6.1 0 5 96 1 3 0 5 95 69 1357
Opel 730,550 5 22,448 190 30 0 0 0.1 3.8 0 11 96 0 4 27 3 97 85 1414
Škoda 674,711 4 23,531 198 41 0 0 0 1.2 0 27 87 0 13 74 2 98 91 1464
Toyota 654,897 4 24,160 172 8 48.9 0.3 0 0 0 57 94 0 5 7 12 88 75 1583
Citroën 561,544 4 20,675 178 43 0 0 0.3 0.9 0 13 99 0 1 34 3 97 73 1368
Nissan 552,604 4 26,176 181 47 0 0 2.6 0.5 0 19 94 0 6 65 20 80 86 1393
Hyundai 509,351 3 22,279 179 32 2.9 0.1 0.8 1.2 0 19 93 1 7 38 7 93 81 1424
Kia 457,808 3 23,371 180 39 6.6 0.9 1.0 1.1 0 25 91 0 9 42 10 90 85 1488
Dacia 454,182 3 12,867 169 39 0 0 0 8.3 0 5 90 0 10 15 2 98 71 1243
Seat 389,072 3 23,579 195 29 0 0 0 1.0 0 17 93 0 7 77 3 97 92 1393
Volvo 282,023 2 44,225 209 79 0 3.8 0 0.2 0 72 61 0 39 95 1 99 134 2000
Tota
l new
sal
es/r
egis
trat
ions
Tota
l new
sal
es/r
egis
trat
ions
[%
]
Pri
ce [
EU
R in
cl. t
ax]
Top
sp
eed
[km
/h]
Die
sel [
%]
Hyb
rid
(ex
cl. p
lug
-in
hyb
rid
) [%
]
Plu
g-i
n hy
bri
d [
%]
Bat
tery
ele
ctri
c /
fuel
cel
l [%
]
Nat
ural
gas
(m
ono
-/b
ival
ent,
incl
. LP
G)
[%]
Flex
-Fue
l (et
hano
l/g
aso
line)
[%
]
Aut
om
atic
[%
]
Fro
nt d
rive
[%
]
Rea
r d
rive
[%
]
4-w
heel
dri
ve [
%]
Dir
ect
inje
ctio
n (n
on-
die
sel)
[%
]
Eur
o 5
[%
]
Eur
o 6
[%
]
Eng
ine
pow
er [
KW
]
Eng
ine
size
[cc
m]
Num
ber
of
cylin
der
s
Num
ber
of
gea
rs
Mas
s in
run
ning
ord
er [
kg]
Gro
ss w
eig
ht [
kg]
3.9 5.9 1395 1894 544 4322 1790 1543 2644 1537 1535 4.1 5.0 4.8 4.9 4.3 6.0 118 EU-28 4.0 6.1 1468 1972 552 4395 1801 1546 2679 1545 1541 4.1 5.0 4.7 5.2 4.5 6.3 125 Germany
3.9 6.1 1424 1918 548 4331 1795 1532 2645 1543 1541 4.1 5.0 4.7 5.0 4.4 6.1 121 UK
3.7 5.7 1322 1827 559 4247 1786 1543 2625 1529 1528 4.0 5.0 4.8 4.6 4.1 5.5 111 France
3.9 5.7 1311 1790 516 4166 1765 1551 2571 1514 1512 3.9 4.8 4.8 4.6 4.1 5.5 113 Italy
3.9 5.9 1396 1911 555 4407 1797 1550 2664 1541 1538 4.1 5.1 4.8 5.2 4.5 6.3 124 EU-13
3.8 5.8 1367 1855 522 4302 1789 1537 2630 1537 1534 4.0 5.1 4.8 4.7 4.2 5.7 114 Spain
3.8 5.8 1417 1928 578 4377 1799 1550 2666 1545 1544 4.1 5.0 4.8 4.8 4.3 5.8 116 Belgium
3.6 5.7 1294 1769 516 4227 1762 1522 2611 1523 1520 4.0 4.9 4.8 4.8 4.2 5.8 109 Netherlands
4.0 6.4 1580 2089 548 4533 1824 1556 2729 1567 1564 4.3 5.1 4.9 5.0 4.5 6.2 122 Sweden
3.9 5.9 1440 1957 556 4389 1800 1565 2669 1543 1540 4.1 5.1 4.8 5.0 4.4 6.0 120 Austria
3.7 5.7 1286 1767 511 4222 1758 1517 2606 1516 1514 4.0 5.0 4.9 4.5 4.0 5.5 108 Denmark
3.7 5.6 1328 1809 517 4268 1773 1505 2619 1527 1524 4.0 4.9 4.8 4.2 3.8 5.0 104 Portugal
3.9 5.9 1401 1904 551 4387 1800 1538 2658 1548 1545 4.1 5.0 4.8 4.5 4.0 5.3 112 Ireland
3.9 6.2 1453 1950 549 4471 1804 1528 2699 1553 1549 4.2 5.1 4.9 5.0 4.4 6.1 119 Finland
3.7 5.6 1241 1708 511 4108 1746 1518 2554 1505 1501 3.8 5.0 4.8 4.5 4.0 5.4 109 Greece
4.1 6.3 1508 2030 552 4402 1811 1548 2685 1554 1553 4.2 5.0 4.6 5.2 4.6 6.3 126 Luxembourg
4.1 6.4 1546 2040 540 4422 1810 1562 2685 1552 1551 4.1 5.1 4.7 5.6 4.9 6.9 133 Switzerland
3.9 5.5 1595 2088 537 4494 1822 1556 2711 1558 1554 4.2 5.1 4.9 4.3 4.5 5.8 83 Norway
3.9 5.8 1350 1726 531 4390 1790 1507 2656 1543 1540 4.1 5.0 4.5 4.7 4.1 5.5 116 Turkey
3.9 5.7 1495 2013 531 4406 1796 – 2653 1549 1548 4.1 5.1 4.8 4.9 – – 119 Iceland
3.8 5.9 1415 1953 603 4363 1791 1553 2659 1537 1522 4.1 5.1 4.8 4.9 4.4 6.0 120 VW
3.8 5.5 1307 1814 552 4257 1783 1539 2649 1538 1536 4.1 5.1 5.0 4.6 4.1 5.4 107 Renault
3.7 5.6 1412 1931 576 4351 1817 1580 2641 1545 1538 4.1 5.2 4.8 5.0 4.4 6.1 122 Ford
3.6 5.5 1272 1760 536 4213 1790 1536 2609 1520 1523 4.0 5.1 4.9 4.3 3.8 5.1 104 Peugeot
4.3 7.3 1683 2263 595 4657 1835 1530 2836 1589 1578 4.5 5.0 4.5 5.2 4.6 6.4 129 Mercedes-Benz
4.2 6.6 1565 2068 529 4507 1830 1477 2713 1565 1560 4.2 4.9 4.7 5.0 4.5 6.0 124 Audi
4.2 7.1 1631 2151 586 4583 1827 1510 2786 1568 1589 4.4 5.0 4.5 4.9 4.4 6.0 122 BMW
3.9 5.3 1224 1642 474 3978 1711 1564 2497 1480 1478 3.7 4.5 4.4 5.0 4.2 6.2 119 Fiat 3.9 5.6 1357 1830 488 4300 1783 1551 2597 1520 1521 4.0 5.1 4.8 5.1 4.4 6.4 122 Opel
3.7 5.9 1318 1832 563 4423 1782 1493 2620 1507 1502 3.9 5.0 5.0 4.8 4.2 5.8 115 Škoda
3.8 5.5 1302 1735 487 4193 1740 1530 2574 1507 1505 3.9 5.0 4.9 4.3 4.0 4.9 101 Toyota
3.4 5.3 1196 1715 570 4144 1758 1547 2609 1502 1502 3.9 5.1 4.9 4.3 3.8 5.2 105 Citroën
3.9 5.6 1371 1831 510 4300 1780 1581 2616 1544 1545 4.0 5.1 5.0 4.9 4.4 5.8 116 Nissan
3.8 5.7 1341 1799 502 4223 1777 1544 2600 1553 1560 4.0 5.0 5.0 5.1 4.5 6.3 123 Hyundai
3.8 5.8 1360 1842 526 4259 1776 1543 2621 1551 1558 4.1 5.1 5.0 5.0 4.5 6.2 121 Kia
3.6 5.3 1187 1670 513 4241 1768 1609 2651 1517 1512 4.0 5.1 5.0 5.1 4.6 5.9 118 Dacia
3.7 5.7 1289 1795 559 4283 1788 1499 2604 1522 1507 3.9 5.1 4.9 4.9 4.3 6.0 117 Seat
4.1 7.1 1796 2324 565 4663 1872 1573 2801 1615 1606 4.5 5.1 4.9 4.9 4.4 5.9 124 Volvo
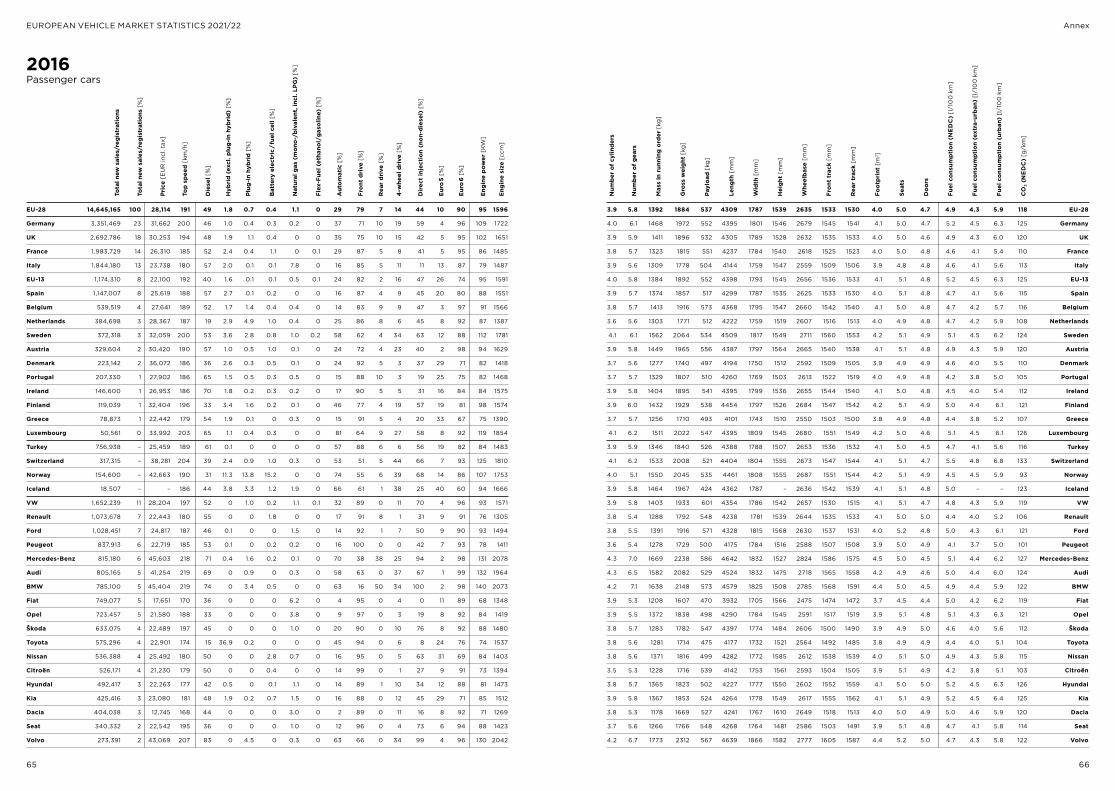
65 66
EUROPEAN VEHICLE MARKET STATISTICS 2021/22 Annex
2016Passenger cars
Pay
load
[kg
]
Leng
th [
mm
]
Wid
th [
mm
]
Hei
ght
[m
m]
Whe
elb
ase
[mm
]
Fro
nt t
rack
[m
m]
Rea
r tr
ack
[mm
]
Foo
tpri
nt [
m2 ]
Seat
s
Do
ors
Fuel
co
nsum
pti
on
(NE
DC
) [l
/10
0 k
m]
Fuel
co
nsum
pti
on
(ext
ra-u
rban
) [l
/10
0 k
m]
Fuel
co
nsum
pti
on
(urb
an)
[l/1
00
km
]
CO
2 (N
ED
C)
[g/k
m]
EU-28 14,645,165 100 28,114 191 49 1.8 0.7 0.4 1.1 0 29 79 7 14 44 10 90 95 1596
Germany 3,351,469 23 31,662 200 46 1.0 0.4 0.3 0.2 0 37 71 10 19 59 4 96 109 1722
UK 2,692,786 18 30,253 194 48 1.9 1.1 0.4 0 0 35 75 10 15 42 5 95 102 1651
France 1,983,729 14 26,310 185 52 2.4 0.4 1.1 0 0.1 29 87 5 8 41 5 95 86 1485
Italy 1,844,180 13 23,738 180 57 2.0 0.1 0.1 7.8 0 16 85 5 11 11 13 87 79 1487
EU-13 1,174,310 8 22,100 192 40 1.6 0.1 0.1 0.5 0.1 24 82 2 16 47 26 74 95 1591
Spain 1,147,007 8 25,619 188 57 2.7 0.1 0.2 0 0 16 87 4 9 45 20 80 88 1551
Belgium 539,519 4 27,641 189 52 1.7 1.4 0.4 0.4 0 14 83 9 9 47 3 97 91 1566
Netherlands 384,698 3 28,367 187 19 2.9 4.9 1.0 0.4 0 25 86 8 6 45 8 92 87 1387
Sweden 372,318 3 32,059 200 53 3.6 2.8 0.8 1.0 0.2 58 62 4 34 63 12 88 112 1781
Austria 329,604 2 30,420 190 57 1.0 0.5 1.0 0.1 0 24 72 4 23 40 2 98 94 1629
Denmark 223,142 2 36,072 186 36 2.6 0.3 0.5 0.1 0 24 92 5 3 37 29 71 82 1418
Portugal 207,330 1 27,902 186 65 1.5 0.5 0.3 0.5 0 15 88 10 3 19 25 75 82 1468
Ireland 146,600 1 26,953 186 70 1.8 0.2 0.3 0.2 0 17 90 5 5 31 16 84 84 1575
Finland 119,039 1 32,404 196 33 3.4 1.6 0.2 0.1 0 46 77 4 19 57 19 81 98 1574
Greece 78,873 1 22,442 179 54 1.9 0.1 0 0.3 0 15 91 5 4 20 33 67 75 1390
Luxembourg 50,561 0 33,992 203 65 1.1 0.4 0.3 0 0 81 64 9 27 58 8 92 119 1854
Turkey 756,938 – 25,459 189 61 0.1 0 0 0 0 57 88 6 6 56 19 82 84 1483
Switzerland 317,315 – 38,281 204 39 2.4 0.9 1.0 0.3 0 53 51 5 44 66 7 93 125 1810
Norway 154,600 – 42,663 190 31 11.3 13.8 15.2 0 0 74 55 6 39 68 14 86 107 1753
Iceland 18,507 – – 186 44 3.8 3.3 1.2 1.9 0 66 61 1 38 25 40 60 94 1666
VW 1,652,239 11 28,204 197 52 0 1.0 0.2 1.1 0.1 32 89 0 11 70 4 96 93 1571
Renault 1,073,678 7 22,443 180 55 0 0 1.8 0 0 17 91 8 1 31 9 91 76 1305
Ford 1,028,451 7 24,817 187 46 0.1 0 0 1.5 0 14 92 1 7 50 9 90 93 1494
Peugeot 837,913 6 22,719 185 53 0.1 0 0.2 0.2 0 16 100 0 0 42 7 93 78 1411
Mercedes-Benz 815,180 6 45,603 218 71 0.4 1.6 0.2 0.1 0 70 38 38 25 94 2 98 131 2078
Audi 805,165 5 41,254 219 69 0 0.9 0 0.3 0 58 63 0 37 67 1 99 132 1964
BMW 785,100 5 45,404 219 74 0 3.4 0.5 0 0 63 16 50 34 100 2 98 140 2073
Fiat 749,077 5 17,651 170 36 0 0 0 6.2 0 4 95 0 4 0 11 89 68 1348
Opel 723,457 5 21,580 188 33 0 0 0 3.8 0 9 97 0 3 19 8 92 84 1419
Škoda 633,075 4 22,489 197 45 0 0 0 1.0 0 20 90 0 10 76 8 92 88 1480
Toyota 575,296 4 22,901 174 15 36.9 0.2 0 0 0 45 94 0 6 8 24 76 74 1537
Nissan 536,388 4 25,492 180 50 0 0 2.8 0.7 0 16 95 0 5 63 31 69 84 1403
Citroën 526,171 4 21,230 179 50 0 0 0.4 0 0 14 99 0 1 27 9 91 73 1394
Hyundai 492,417 3 22,263 177 42 0.5 0 0.1 1.1 0 14 89 1 10 34 12 88 81 1473
Kia 425,416 3 23,080 181 48 1.9 0.2 0.7 1.5 0 16 88 0 12 45 29 71 85 1512
Dacia 404,038 3 12,745 168 44 0 0 0 3.0 0 2 89 0 11 16 8 92 71 1269
Seat 340,332 2 22,542 195 36 0 0 0 1.0 0 12 96 0 4 73 6 94 88 1423
Volvo 273,391 2 43,069 207 83 0 4.5 0 0.3 0 63 66 0 34 99 4 96 130 2042
Tota
l new
sal
es/r
egis
trat
ions
Tota
l new
sal
es/r
egis
trat
ions
[%
]
Pri
ce [
EU
R in
cl. t
ax]
Top
sp
eed
[km
/h]
Die
sel [
%]
Hyb
rid
(ex
cl. p
lug
-in
hyb
rid
) [%
]
Plu
g-i
n hy
bri
d [
%]
Bat
tery
ele
ctri
c /
fuel
cel
l [%
]
Nat
ural
gas
(m
ono
-/b
ival
ent,
incl
. LP
G)
[%]
Flex
-Fue
l (et
hano
l/g
aso
line)
[%
]
Aut
om
atic
[%
]
Fro
nt d
rive
[%
]
Rea
r d
rive
[%
]
4-w
heel
dri
ve [
%]
Dir
ect
inje
ctio
n (n
on-
die
sel)
[%
]
Eur
o 5
[%
]
Eur
o 6
[%
]
Eng
ine
pow
er [
KW
]
Eng
ine
size
[cc
m]
Num
ber
of
cylin
der
s
Num
ber
of
gea
rs
Mas
s in
run
ning
ord
er [
kg]
Gro
ss w
eig
ht [
kg]
3.9 5.8 1392 1884 537 4309 1787 1539 2635 1533 1530 4.0 5.0 4.7 4.9 4.3 5.9 118 EU-28 4.0 6.1 1468 1972 552 4395 1801 1546 2679 1545 1541 4.1 5.0 4.7 5.2 4.5 6.3 125 Germany
3.9 5.9 1411 1896 532 4305 1789 1528 2632 1535 1533 4.0 5.0 4.6 4.9 4.3 6.0 120 UK
3.8 5.7 1323 1815 551 4237 1784 1540 2618 1525 1523 4.0 5.0 4.8 4.6 4.1 5.4 110 France
3.9 5.6 1309 1778 504 4144 1759 1547 2559 1509 1506 3.9 4.8 4.8 4.6 4.1 5.6 113 Italy
4.0 5.8 1384 1892 552 4398 1793 1545 2656 1536 1533 4.1 5.1 4.8 5.2 4.5 6.3 125 EU-13
3.9 5.7 1374 1857 517 4299 1787 1535 2625 1533 1530 4.0 5.1 4.8 4.7 4.1 5.6 115 Spain
3.8 5.7 1413 1916 573 4368 1795 1547 2660 1542 1540 4.1 5.0 4.8 4.7 4.2 5.7 116 Belgium
3.6 5.6 1303 1771 512 4222 1759 1519 2607 1516 1513 4.0 4.9 4.8 4.7 4.2 5.9 108 Netherlands
4.1 6.1 1562 2064 534 4509 1817 1549 2711 1560 1553 4.2 5.1 4.9 5.1 4.5 6.2 124 Sweden
3.9 5.8 1449 1965 556 4387 1797 1564 2665 1540 1538 4.1 5.1 4.8 4.9 4.3 5.9 120 Austria
3.7 5.6 1277 1740 497 4194 1750 1512 2592 1509 1505 3.9 4.9 4.9 4.6 4.0 5.5 110 Denmark
3.7 5.7 1329 1807 510 4260 1769 1503 2613 1522 1519 4.0 4.9 4.8 4.2 3.8 5.0 105 Portugal
3.9 5.8 1404 1895 541 4395 1799 1536 2655 1544 1540 4.1 5.0 4.8 4.5 4.0 5.4 112 Ireland
3.9 6.0 1432 1929 538 4454 1797 1526 2684 1547 1542 4.2 5.1 4.9 5.0 4.4 6.1 121 Finland
3.7 5.7 1256 1710 493 4101 1743 1510 2550 1503 1500 3.8 4.9 4.8 4.4 3.8 5.2 107 Greece
4.1 6.2 1511 2022 547 4395 1809 1545 2680 1551 1549 4.2 5.0 4.6 5.1 4.5 6.1 126 Luxembourg
3.9 5.9 1346 1840 526 4388 1788 1507 2653 1536 1532 4.1 5.0 4.5 4.7 4.1 5.6 116 Turkey
4.1 6.2 1533 2008 521 4404 1804 1555 2673 1547 1544 4.1 5.1 4.7 5.5 4.8 6.8 133 Switzerland
4.0 5.1 1550 2045 535 4461 1808 1555 2687 1551 1544 4.2 5.1 4.9 4.5 4.5 5.9 93 Norway
3.9 5.8 1464 1967 424 4362 1787 – 2636 1542 1539 4.1 5.1 4.8 5.0 – – 123 Iceland
3.9 5.8 1403 1933 601 4354 1786 1542 2657 1530 1515 4.1 5.1 4.7 4.8 4.3 5.9 119 VW
3.8 5.4 1288 1792 548 4238 1781 1539 2644 1535 1533 4.1 5.0 5.0 4.4 4.0 5.2 106 Renault
3.8 5.5 1391 1916 571 4328 1815 1568 2630 1537 1531 4.0 5.2 4.8 5.0 4.3 6.1 121 Ford
3.6 5.4 1278 1729 500 4175 1784 1516 2588 1507 1508 3.9 5.0 4.9 4.1 3.7 5.0 101 Peugeot
4.3 7.0 1669 2238 586 4642 1832 1527 2824 1586 1575 4.5 5.0 4.5 5.1 4.4 6.2 127 Mercedes-Benz
4.3 6.5 1582 2082 529 4524 1832 1475 2718 1565 1558 4.2 4.9 4.6 5.0 4.4 6.0 124 Audi
4.2 7.1 1638 2148 573 4579 1825 1508 2785 1568 1591 4.4 5.0 4.5 4.9 4.4 5.9 122 BMW
3.9 5.3 1208 1607 470 3932 1705 1566 2475 1474 1472 3.7 4.5 4.4 5.0 4.2 6.2 119 Fiat 3.9 5.5 1372 1838 498 4290 1784 1545 2591 1517 1519 3.9 5.1 4.8 5.1 4.3 6.3 121 Opel
3.8 5.7 1283 1782 547 4397 1774 1484 2606 1500 1490 3.9 4.9 5.0 4.6 4.0 5.6 112 Škoda
3.8 5.6 1281 1714 475 4177 1732 1521 2564 1492 1485 3.8 4.9 4.9 4.4 4.0 5.1 104 Toyota
3.8 5.6 1371 1816 499 4282 1772 1585 2612 1538 1539 4.0 5.1 5.0 4.9 4.3 5.8 115 Nissan
3.5 5.3 1228 1716 539 4142 1753 1561 2593 1504 1505 3.9 5.1 4.9 4.2 3.8 5.1 103 Citroën
3.8 5.7 1365 1823 502 4227 1777 1550 2602 1552 1559 4.1 5.0 5.0 5.2 4.5 6.3 126 Hyundai
3.9 5.8 1367 1853 524 4264 1778 1549 2617 1555 1562 4.1 5.1 4.9 5.2 4.5 6.4 125 Kia
3.8 5.3 1178 1669 527 4241 1767 1610 2649 1518 1513 4.0 5.0 4.9 5.0 4.6 5.9 120 Dacia
3.7 5.6 1266 1766 548 4268 1764 1481 2586 1503 1491 3.9 5.1 4.8 4.7 4.1 5.8 114 Seat
4.2 6.7 1773 2312 567 4639 1866 1582 2777 1605 1587 4.4 5.2 5.0 4.7 4.3 5.8 122 Volvo

67 68
EUROPEAN VEHICLE MARKET STATISTICS 2021/22 Annex
2015Passenger cars
Pay
load
[kg
]
Leng
th [
mm
]
Wid
th [
mm
]
Hei
ght
[m
m]
Whe
elb
ase
[mm
]
Fro
nt t
rack
[m
m]
Rea
r tr
ack
[mm
]
Foo
tpri
nt [
m2 ]
Seat
s
Do
ors
Fuel
co
nsum
pti
on
(NE
DC
) [l
/10
0 k
m]
Fuel
co
nsum
pti
on
(ext
ra-u
rban
) [l
/10
0 k
m]
Fuel
co
nsum
pti
on
(urb
an)
[l/1
00
km
]
CO
2 (N
ED
C)
[g/k
m]
EU-28 13,699,408 100 27,987 190 52 1.5 0.6 0.4 1.5 0 25 80 7 13 40 40 60 93 1599
Germany 3,205,919 23 30,775 199 48 0.6 0.3 0.4 0.3 0 31 72 11 17 54 31 69 106 1721
UK 2,633,503 19 32,212 193 48 1.7 0.7 0.4 0 0 31 77 10 13 36 36 64 98 1642
France 1,885,568 14 25,360 184 57 2.2 0.2 0.9 0.1 0 24 88 5 7 36 37 63 83 1493
Italy 1,583,616 12 22,960 179 56 1.6 0.1 0.1 11.3 0 14 85 4 11 11 42 58 77 1479
Spain 1,034,232 8 24,599 187 63 1.8 0.1 0.1 0 0 12 88 4 8 37 52 48 85 1566
EU-13 1,007,491 7 21,471 190 42 1.0 0 0.1 0.7 0.1 19 83 2 15 38 59 41 92 1587
Belgium 501,066 4 26,626 188 60 1.5 0.3 0.3 0.1 0 11 83 9 7 39 42 58 89 1583
Netherlands 452,388 3 28,365 188 29 3.3 8.9 0.8 0.2 0 26 86 7 7 43 36 64 87 1455
Sweden 345,106 3 31,813 199 58 2.5 1.6 0.9 1.5 0.4 53 62 4 34 57 40 60 110 1802
Austria 308,555 2 28,889 189 58 0.7 0.3 0.6 0.2 0 17 74 4 22 38 40 60 91 1626
Denmark 207,389 2 34,481 182 31 1.1 0.1 2.2 0 0 18 92 5 3 29 54 46 81 1377
Portugal 178,503 1 27,597 187 68 1.7 0.3 0.3 0.4 0 16 87 11 2 18 49 51 81 1486
Ireland 124,945 1 29,897 186 71 1.2 0.1 0.4 0.1 0 15 90 5 5 26 64 35 82 1570
Finland 108,849 1 32,259 196 36 2.6 0.4 0.2 0.1 0.2 49 78 4 18 52 43 57 97 1593
Greece 75,805 1 21,553 176 63 1.1 0.1 0 0.3 0 12 91 5 4 5 57 43 71 1385
Luxembourg 46,473 0 33,024 203 71 0.8 0.2 0.2 0 0 72 64 10 26 64 38 62 116 1865
Turkey 725,596 – 23,452 187 62 0.1 0 0 0 0 51 90 6 5 50 52 48 83 1485
Switzerland 323,762 – 39,160 203 39 1.8 0.9 1.0 0.3 0 45 54 5 40 59 35 65 120 1802
Norway 150,684 – 41,379 187 41 7.1 5.3 17.1 0 0 58 57 5 38 56 41 59 103 1742
VW 1,657,492 12 28,033 196 55 0 1.2 0.2 1.4 0.1 26 90 0 10 65 30 70 91 1573
Ford 1,012,036 7 24,153 185 45 0.1 0.1 0 1.6 0 10 95 1 5 41 31 68 86 1458
Renault 950,132 7 21,364 177 57 0 0 1.7 0.7 0 13 89 10 1 23 53 47 73 1311
Peugeot 824,774 6 22,850 184 59 0.6 0 0.1 0.3 0 14 99 0 1 34 39 61 77 1440
Audi 737,770 5 41,316 217 72 0 1.3 0 0.4 0 51 63 0 37 73 14 86 130 1976
BMW 713,489 5 46,357 222 78 0 1.1 0.6 0 0 60 12 56 33 100 20 80 140 2109
Mercedes-Benz 712,503 5 45,651 218 72 1.2 0.9 0.2 0.2 0 65 40 41 19 98 14 86 128 2069
Opel 654,116 5 21,749 187 37 0 0 0 3.9 0 9 96 0 4 6 34 66 85 1463
Fiat 644,760 5 17,815 168 35 0 0 0 9.4 0 4 94 0 6 0 37 63 65 1343
Citroën 603,502 4 22,295 179 58 0.2 0 0.1 0.1 0 15 99 0 1 26 49 51 74 1430
Škoda 588,940 4 21,995 194 46 0 0 0 1.1 0 17 91 0 9 72 44 56 84 1473
Nissan 540,455 4 25,541 180 49 0 0 2.4 0.8 0 14 95 0 5 61 68 32 83 1396
Toyota 537,206 4 22,392 174 23 26.9 0.2 0 0 0 35 93 0 7 3 65 35 73 1499
Hyundai 456,084 3 21,509 175 42 0 0 0 1.0 0 9 91 0 8 27 53 47 79 1466
Kia 377,039 3 22,510 177 46 0.1 0 1.3 1.2 0 11 91 0 9 40 80 20 83 1500
Dacia 369,703 3 12,982 168 49 0 0 0 5.8 0 0 90 0 10 13 60 40 69 1288
Seat 327,652 2 21,816 192 42 0 0 0 1.2 0 10 98 0 2 64 54 46 84 1454
Vauxhall 269,767 2 24,540 186 31 0 0 0 0 0 10 99 0 1 2 21 79 83 1499
Volvo 268,653 2 41,856 205 88 0 3.4 0 0.2 0 56 69 0 31 96 30 70 125 2017
Tota
l new
sal
es/r
egis
trat
ions
Tota
l new
sal
es/r
egis
trat
ions
[%
]
Pri
ce [
EU
R in
cl. t
ax]
Top
sp
eed
[km
/h]
Die
sel [
%]
Hyb
rid
(ex
cl. p
lug
-in
hyb
rid
) [%
]
Plu
g-i
n hy
bri
d [
%]
Bat
tery
ele
ctri
c /
fuel
cel
l [%
]
Nat
ural
gas
(m
ono
-/b
ival
ent,
incl
. LP
G)
[%]
Flex
-Fue
l (et
hano
l/g
aso
line)
[%
]
Aut
om
atic
[%
]
Fro
nt d
rive
[%
]
Rea
r d
rive
[%
]
4-w
heel
dri
ve [
%]
Dir
ect
inje
ctio
n (n
on-
die
sel)
[%
]
Eur
o 5
[%
]
Eur
o 6
[%
]
Eng
ine
pow
er [
KW
]
Eng
ine
size
[cc
m]
Num
ber
of
cylin
der
s
Num
ber
of
gea
rs
Mas
s in
run
ning
ord
er [
kg]
Gro
ss w
eig
ht [
kg]
3.9 5.8 1385 1870 528 4294 1782 1536 2629 1529 1526 4.0 5.0 4.7 4.9 4.3 6.0 120 EU-28 4.0 6.0 1460 1962 543 4382 1796 1545 2671 1540 1536 4.1 5.0 4.7 5.2 4.5 6.4 127 Germany
3.9 5.9 1392 1870 521 4281 1781 1522 2621 1530 1527 4.0 5.0 4.6 5.0 4.3 6.1 121 UK
3.8 5.7 1316 1801 543 4220 1779 1541 2610 1520 1518 4.0 5.0 4.8 4.5 4.0 5.4 111 France
3.8 5.6 1302 1755 494 4128 1753 1545 2553 1508 1505 3.9 4.8 4.8 4.8 4.2 5.8 116 Italy
3.9 5.7 1370 1847 513 4285 1785 1532 2620 1529 1525 4.0 5.0 4.8 4.7 4.1 5.7 116 Spain
4.0 5.8 1375 1879 544 4378 1786 1544 2647 1531 1528 4.1 5.0 4.8 5.2 4.5 6.5 127 EU-13
3.9 5.7 1406 1906 568 4353 1791 1546 2657 1536 1534 4.1 5.0 4.7 4.7 4.2 5.7 117 Belgium
3.7 5.6 1335 1795 505 4244 1760 1511 2612 1519 1514 4.0 4.9 4.8 4.3 4.0 5.5 102 Netherlands
4.1 6.1 1567 2063 525 4511 1814 1549 2708 1557 1551 4.2 5.1 4.9 5.2 4.5 6.3 127 Sweden
3.9 5.8 1442 1943 540 4366 1792 1562 2656 1535 1533 4.1 5.1 4.8 5.0 4.4 6.0 123 Austria
3.6 5.5 1256 1709 481 4143 1738 1507 2577 1500 1496 3.9 4.9 4.9 4.6 4.0 5.6 108 Denmark
3.8 5.7 1333 1798 500 4256 1766 1499 2611 1520 1517 4.0 4.9 4.8 4.2 3.8 5.1 106 Portugal
3.9 5.8 1382 1871 531 4371 1788 1525 2647 1538 1533 4.1 5.0 4.7 4.5 4.0 5.4 114 Ireland
3.9 6.1 1436 1924 529 4439 1793 1524 2677 1544 1539 4.1 5.1 4.9 5.1 4.5 6.3 124 Finland
3.7 5.4 1233 1688 492 4084 1736 1501 2545 1500 1496 3.8 4.9 4.8 4.3 3.8 5.1 106 Greece
4.1 7.0 1510 2016 538 4381 1803 1541 2677 1546 1545 4.1 4.9 4.7 5.1 4.4 6.2 127 Luxembourg
4.0 5.8 1342 1824 518 4381 1784 1502 2650 1534 1530 4.1 5.0 4.5 4.8 4.2 5.8 118 Turkey
4.1 6.1 1505 1985 516 4378 1796 1550 2661 1541 1538 4.1 5.1 4.7 5.6 4.8 7.0 135 Switzerland
4.0 5.2 1528 1993 522 4434 1801 1543 2675 1545 1539 4.1 5.1 4.9 4.9 4.5 6.0 99 Norway
3.9 3.9 1394 1918 586 4340 1782 1537 2645 1525 1511 4.0 5.0 4.7 4.8 4.3 5.9 119 VW
3.7 3.7 1347 1886 563 4291 1803 1559 2616 1532 1527 4.0 5.1 4.7 4.9 4.2 6.0 119 Ford
3.8 3.8 1264 1762 545 4192 1773 1542 2633 1520 1518 4.0 5.0 5.0 4.4 4.0 5.3 106 Renault
3.6 3.6 1290 1734 492 4186 1784 1511 2591 1508 1509 3.9 5.0 4.8 4.2 3.7 5.0 104 Peugeot
4.3 4.3 1587 2077 519 4510 1828 1469 2710 1563 1553 4.2 4.9 4.6 5.0 4.5 6.1 127 Audi
4.3 4.3 1641 2143 563 4591 1826 1496 2795 1569 1593 4.4 4.9 4.5 5.0 4.5 6.1 127 BMW
4.3 4.3 1652 2204 568 4622 1821 1512 2806 1580 1568 4.4 5.0 4.5 5.1 4.4 6.3 127 Mercedes-Benz
3.9 3.9 1409 1872 496 4298 1785 1554 2595 1517 1519 3.9 5.1 4.7 5.2 4.4 6.5 124 Opel 3.8 3.8 1203 1594 472 3896 1698 1575 2461 1464 1458 3.6 4.5 4.3 5.1 4.3 6.3 122 Fiat
3.6 3.6 1254 1730 527 4147 1756 1553 2590 1503 1504 3.9 5.1 4.8 4.3 3.8 5.1 106 Citroën
3.8 3.8 1273 1769 540 4364 1763 1491 2592 1491 1485 3.9 4.9 5.0 4.7 4.1 5.8 115 Škoda
3.8 3.8 1353 1795 494 4262 1767 1578 2608 1535 1536 4.0 5.1 5.0 4.8 4.3 5.8 114 Nissan
3.8 3.8 1263 1692 469 4145 1728 1515 2557 1500 1495 3.8 4.9 4.9 4.5 4.0 5.4 108 Toyota
3.8 3.8 1334 1784 494 4197 1765 1543 2591 1545 1548 4.0 5.0 5.0 5.3 4.5 6.5 128 Hyundai
3.9 3.9 1345 1813 492 4228 1771 1547 2603 1549 1553 4.0 5.1 4.9 5.3 4.6 6.5 128 Kia
3.8 3.8 1177 1665 531 4244 1767 1607 2649 1517 1512 4.0 5.0 4.9 5.2 4.6 6.2 124 Dacia
3.8 3.8 1255 1737 519 4244 1756 1475 2576 1497 1486 3.8 5.0 4.7 4.8 4.1 5.9 116 Seat
4.0 4.0 1402 1813 482 4292 1785 1537 2594 1519 1519 3.9 5.1 4.5 5.3 4.5 6.7 128 Vauxhall
4.3 4.3 1744 2260 542 4616 1857 1568 2759 1594 1580 4.4 5.1 5.0 4.7 4.3 5.8 123 Volvo

69 70
EUROPEAN VEHICLE MARKET STATISTICS 2021/22 Annex
2014Passenger cars
Pay
load
[kg
]
Leng
th [
mm
]
Wid
th [
mm
]
Hei
ght
[m
m]
Whe
elb
ase
[mm
]
Fro
nt t
rack
[m
m]
Rea
r tr
ack
[mm
]
Foo
tpri
nt [
m2 ]
Seat
s
Do
ors
Fuel
co
nsum
pti
on
(NE
DC
) [l
/10
0 k
m]
Fuel
co
nsum
pti
on
(ext
ra-u
rban
) [l
/10
0 k
m]
Fuel
co
nsum
pti
on
(urb
an)
[l/1
00
km
]
CO
2 (N
ED
C)
[g/k
m]
EU-28 12,513,670 100 26,435 53 1.4 0.2 0.3 1.9 0 23 81 7 12 35 83 17 90 1607
Germany 3,036,629 24 29,588 48 0.7 0.1 0.3 0.5 0 30 73 11 16 52 75 25 103 1724
UK 2,476,435 20 27,793 50 1.5 0.3 0.3 0 0 27 79 9 12 27 88 12 95 1643
France 1,765,228 14 24,324 63 2.3 0.1 0.6 0.1 0 20 90 4 7 24 86 14 81 1518
Italy 1,370,952 11 22,271 55 1.5 0 0.1 14.3 0 12 86 4 10 9 74 26 76 1481
EU-13 875,562 7 21,270 43 0.8 0 0.1 0.6 0 16 84 2 14 33 92 8 89 1587
Spain 855,308 7 23,920 66 1.4 0 0.1 0.3 0 9 89 5 6 32 89 10 84 1581
Belgium 482,939 4 25,702 62 1.6 0.1 0.3 0.2 0 12 84 8 8 31 84 16 86 1593
Netherlands 387,825 3 25,884 27 3.7 3.1 0.9 1.0 0 26 88 6 6 38 83 17 84 1432
Sweden 303,946 2 31,117 59 2.3 1.1 0.5 1.6 0.8 46 64 5 31 49 82 18 106 1781
Austria 303,318 2 28,004 57 0.6 0.1 0.5 0.3 0 15 74 4 22 37 87 13 89 1637
Denmark 189,068 2 32,457 31 0.6 0 0.9 0 0 14 94 5 2 22 91 9 75 1368
Portugal 142,826 1 27,441 71 1.3 0.1 0.1 0.6 0 12 86 11 2 11 89 11 81 1518
Finland 106,281 1 32,414 39 2.2 0.2 0.2 0.1 0.5 42 78 5 18 55 85 15 97 1631
Ireland 96,344 1 26,948 73 1.0 0 0.2 0 0 14 89 5 6 19 93 7 80 1581
Greece 71,216 1 20,987 64 0.6 0 0.1 0.3 0 9 90 4 5 4 87 13 71 1382
Luxembourg 49,793 0 31,311 72 0.8 0.1 0.7 0.1 0 68 67 9 24 42 80 20 112 1858
Turkey 587,331 – 20,785 62 0 0 0 0.1 0 46 90 6 5 38 91 9 80 1486
Switzerland 301,892 – 34,005 37 2.0 0.2 0.6 0.2 0 41 56 5 39 56 74 26 117 1822
Norway 144,196 – 43,079 49 6.9 1.2 12.6 0 0 44 58 8 34 52 82 18 98 1738
VW 1,551,453 12 26,394 56 0 0.1 0.2 1.5 0.1 23 90 0 9 61 77 23 87 1567
Ford 939,906 8 22,490 44 0 0 0 1.9 0.1 9 95 0 5 29 95 5 83 1448
Renault 853,980 7 20,251 57 0 0 1.2 0.8 0 10 96 3 0 23 97 3 72 1334
Peugeot 757,054 6 22,089 63 1.3 0 0 0.5 0 12 98 0 2 15 92 8 75 1468
Audi 696,774 6 38,283 72 0.1 0.1 0 0.8 0 45 65 0 35 98 69 31 123 1973
BMW 643,880 5 44,048 81 0.1 0.2 1.0 0 0 57 2 65 33 100 58 41 139 2155
Mercedes-Benz 633,356 5 43,444 72 1.1 0 0 0.3 0 61 40 45 16 98 44 56 127 2083
Opel 599,441 5 22,004 40 0 0 0.1 4.3 0 9 95 0 5 1 79 21 85 1501
Citroën 588,528 5 21,925 63 0.4 0 0 0.3 0 15 98 0 2 6 91 9 74 1466
Fiat 574,390 5 16,556 33 0 0 0 11.6 0 4 95 0 5 0 62 38 62 1311
Škoda 550,284 4 21,374 48 0 0 0 0.7 0 15 92 0 8 68 97 3 81 1497
Toyota 503,849 4 22,030 26 24.7 0.2 0 0 0 34 92 0 8 0 94 6 74 1526
Nissan 463,585 4 23,489 51 0 0 2.2 1.2 0 11 94 0 6 42 100 0 81 1413
Hyundai 408,499 3 19,761 37 0 0 0 1.8 0 8 93 0 7 33 99 1 78 1452
Dacia 354,225 3 12,989 51 0 0 0 6.7 0 0 88 0 12 12 100 0 69 1302
Kia 341,707 3 21,106 47 0.2 0 0 1.9 0 9 92 0 8 33 100 0 82 1496
Seat 318,929 3 20,849 44 0 0 0 1.2 0 8 99 0 1 58 92 8 81 1463
Vauxhall 269,179 2 22,764 36 0 0 0.2 0 0 9 98 0 2 1 98 2 85 1541
Volvo 236,465 2 39,075 90 0 2.2 0 0.2 0.1 48 74 0 26 87 73 27 119 1968
Tota
l new
sal
es/r
egis
trat
ions
Tota
l new
sal
es/r
egis
trat
ions
[%
]
Pri
ce [
EU
R in
cl. t
ax]
Die
sel [
%]
Hyb
rid
(ex
cl. p
lug
-in
hyb
rid
) [%
]
Plu
g-i
n hy
bri
d [
%]
Bat
tery
ele
ctri
c /
fuel
cel
l [%
]
Nat
ural
gas
(m
ono
-/b
ival
ent,
incl
. LP
G)
[%]
Flex
-Fue
l (et
hano
l/g
aso
line)
[%
]
Aut
om
atic
[%
]
Fro
nt d
rive
[%
]
Rea
r d
rive
[%
]
4-w
heel
dri
ve [
%]
Dir
ect
inje
ctio
n (n
on-
die
sel)
[%
]
Eur
o 5
[%
]
Eur
o 6
[%
]
Eng
ine
pow
er [
KW
]
Eng
ine
size
[cc
m]
Num
ber
of
cylin
der
s
Num
ber
of
gea
rs
Mas
s in
run
ning
ord
er [
kg]
Gro
ss w
eig
ht [
kg]
3.9 5.7 1391 1859 523 4283 1778 1535 2623 1531 1522 4.0 5.0 4.7 5.0 4.4 6.2 123 EU-28
4.0 5.9 1474 1946 534 4370 1790 1543 2663 1544 1533 4.1 4.9 4.6 5.4 4.6 6.7 132 Germany
4.0 5.8 1394 1855 512 4263 1776 1521 2614 1533 1524 4.0 4.9 4.5 5.1 4.4 6.3 125 UK
3.9 5.6 1303 1796 546 4212 1778 1540 2603 1522 1514 4.0 5.0 4.8 4.6 4.1 5.6 115 France
3.9 5.5 1319 1748 487 4125 1749 1543 2552 1507 1498 3.8 4.8 4.8 4.9 4.3 6.0 118 Italy
4.0 5.7 1375 1860 537 4359 1779 1541 2637 1534 1525 4.0 5.0 4.8 5.4 4.6 6.7 130 EU-13
3.9 5.6 1391 1852 513 4284 1789 1531 2620 1533 1524 4.0 5.1 4.8 4.8 4.2 5.9 120 Spain
3.9 5.7 1388 1897 560 4338 1787 1547 2647 1537 1530 4.1 5.0 4.7 4.9 4.3 5.9 121 Belgium
3.7 5.5 1299 1752 515 4208 1754 1509 2595 1519 1506 3.9 4.9 4.8 4.6 4.1 5.7 108 Netherlands
4.1 6.1 1574 2036 510 4504 1810 1550 2694 1555 1546 4.2 5.0 4.9 5.3 4.6 6.6 132 Sweden
4.0 5.7 1455 1934 535 4360 1789 1562 2652 1539 1530 4.1 5.1 4.8 5.2 4.5 6.4 128 Austria
3.6 5.5 1263 1696 461 4105 1734 1508 2560 1504 1491 3.8 4.8 4.8 4.7 4.1 5.7 111 Denmark
3.8 5.6 1355 1790 494 4263 1766 1497 2612 1525 1515 4.0 4.9 4.8 4.4 3.8 5.2 110 Portugal
4.0 6.1 1469 1928 523 4449 1794 1521 2682 1549 1539 4.1 5.1 4.9 5.3 4.6 6.5 127 Finland
3.9 5.7 1401 1868 523 4361 1787 1524 2639 1541 1532 4.1 5.0 4.7 4.7 4.1 5.6 119 Ireland
3.8 5.3 1253 1692 490 4096 1733 1502 2542 1500 1489 3.8 4.9 4.7 4.4 3.9 5.4 110 Greece
4.2 6.7 1515 1994 530 4367 1799 1541 2669 1547 1541 4.1 4.9 4.6 5.2 4.5 6.3 129 Luxembourg
4.0 5.7 1348 1811 511 4383 1778 1499 2637 1531 1524 4.0 – 4.5 4.8 4.2 5.9 121 Turkey
4.1 6.0 1524 1975 504 4369 1793 1551 2655 1543 1535 4.1 5.0 4.7 5.9 5.0 7.4 142 Switzerland
4.0 5.9 1498 1966 519 4417 1788 1542 2671 1544 1536 4.1 5.0 4.9 5.1 4.5 6.1 110 Norway
3.8 5.7 1393 1908 579 4310 1777 1544 2626 1530 1507 4.0 5.0 4.7 5.0 4.3 6.2 124 VW
3.7 5.4 1358 1865 553 4271 1793 1558 2609 1534 1524 4.0 5.1 4.7 5.0 4.3 6.3 122 Ford
3.8 5.4 1255 1749 545 4185 1771 1529 2622 1520 1514 4.0 5.0 4.8 4.5 4.0 5.4 110 Renault
3.7 5.4 1295 1738 496 4176 1793 1518 2588 1511 1505 3.9 5.0 4.8 4.4 3.9 5.4 110 Peugeot
4.3 6.4 1581 2047 515 4491 1823 1468 2704 1565 1550 4.2 4.9 4.6 5.2 4.6 6.3 132 Audi
4.4 7.1 1648 2135 553 4611 1825 1485 2806 1567 1588 4.4 4.9 4.4 5.2 4.6 6.4 134 BMW
4.3 6.6 1684 2199 562 4600 1816 1510 2796 1581 1569 4.4 4.9 4.4 5.2 4.5 6.5 132 Mercedes-Benz
4.0 5.5 1444 1878 490 4312 1790 1557 2600 1538 1522 4.0 5.1 4.7 5.3 4.5 6.8 129 Opel
3.7 5.3 1297 1757 519 4166 1764 1561 2594 1512 1506 3.9 5.1 4.7 4.5 4.0 5.4 112 Citroën
3.8 5.2 1194 1556 452 3853 1685 1562 2447 1460 1449 3.6 4.5 4.2 5.0 4.3 6.3 120 Fiat
3.9 5.5 1283 1777 552 4367 1744 1502 2595 1504 1481 3.9 4.9 5.0 4.9 4.3 6.1 121 Škoda
3.8 5.7 1293 1693 458 4140 1733 1516 2561 1506 1493 3.8 5.0 4.9 4.7 4.2 5.6 113 Toyota
3.8 5.7 1342 1779 494 4231 1760 1578 2599 1530 1530 4.0 5.1 5.0 4.9 4.3 5.8 119 Nissan
3.9 5.7 1311 1751 494 4174 1755 1543 2578 1543 1542 4.0 5.0 4.9 5.3 4.6 6.7 129 Hyundai
3.8 5.3 1189 1670 532 4248 1770 1611 2649 1525 1514 4.0 5.0 4.9 5.3 4.7 6.4 127 Dacia
3.9 5.7 1359 1800 487 4220 1767 1542 2599 1554 1550 4.0 5.1 4.9 5.3 4.6 6.5 130 Kia
3.8 5.4 1278 1722 496 4232 1754 1476 2573 1512 1486 3.9 5.0 4.7 4.8 4.1 6.0 117 Seat
4.0 5.4 1428 1849 490 4307 1784 1543 2605 1537 1526 4.0 5.2 4.5 5.4 4.5 6.9 132 Vauxhall
4.4 6.4 1723 2206 532 4593 1852 1550 2744 1586 1572 4.3 5.1 4.9 4.9 4.3 6.0 126 Volvo

71 72
EUROPEAN VEHICLE MARKET STATISTICS 2021/22 Annex
2013Passenger cars
Pay
load
[kg
]
Leng
th [
mm
]
Wid
th [
mm
]
Hei
ght
[m
m]
Whe
elb
ase
[mm
]
Fro
nt t
rack
[m
m]
Rea
r tr
ack
[mm
]
Foo
tpri
nt [
m2 ]
Bo
ot
volu
me
[l]
Seat
s
Do
ors
Fuel
co
nsum
pti
on
(NE
DC
) [l
/10
0 k
m]
Fuel
co
nsum
pti
on
(ext
ra-u
rban
) [l
/10
0 k
m]
Fuel
co
nsum
pti
on
(urb
an)
[l/1
00
km
]
CO
2 (N
ED
C)
[g/k
m]
EU-28 11,825,400 100 25,561 53 1.4 1.8 0 0.42 21 81 7 12 32 96 4 89 1616 4.0 10.5 16.4
Germany 2,952,257 25 28,870 48 0.8 0.4 0 0.25 29 73 11 15 49 93 7 101 1732 4.1 10.4 16.4
UK 2,264,737 19 25,533 50 1.3 0 0 0.16 25 79 10 11 27 98 2 93 1647 4.0 10.6 16.4
France 1,756,251 15 23,776 66 2.6 0.2 0 0.52 18 90 3 7 18 98 1 80 1543 3.9 10.5 16.5
Italy 1,286,716 11 21,730 54 1.1 14.0 0 0.09 12 85 5 10 10 90 10 76 1483 3.9 10.7 16.5
EU-13 780,691 7 20,404 43 0.6 0.3 0 0.04 13 84 2 14 29 98 2 88 1598 4.0 10.5 16.5
Spain 722,703 6 23,636 67 1.4 0 0 0.12 9 88 5 7 28 98 1 84 1600 3.9 10.5 16.5
Belgium 486,065 4 24,902 65 1.2 0 0 0.15 12 84 8 7 21 96 4 84 1600 4.0 10.6 16.5
Netherlands 417,024 4 26,013 25 5.7 0.6 0 5.43 27 87 6 7 36 97 2 82 1441 3.7 10.7 16.2
Austria 319,035 3 27,238 57 0.8 0.2 0 0.26 15 75 4 21 30 96 3 88 1639 4.0 10.4 16.4
Sweden 269,552 2 32,013 61 1.9 1.4 1.2 0.56 41 65 5 29 47 97 3 104 1784 4.1 10.6 16.5
Denmark 181,270 2 30,785 32 0.6 0 0 0.30 9 95 4 1 20 99 1 72 1359 3.6 10.5 16.5
Portugal 105,921 1 27,054 72 1.0 0.8 0 0.20 11 86 12 2 15 98 2 81 1525 3.9 10.6 16.3
Finland 103,493 1 31,472 37 2.2 0.1 0.4 0.21 37 79 5 16 50 97 3 95 1648 4.0 10.6 16.4
Ireland 74,367 1 24,743 72 0.8 0 0 0.06 13 89 6 4 17 99 1 80 1578 3.9 10.6 16.4
Greece 58,694 0 19,906 58 0.7 0.1 0 0.01 10 91 4 5 2 98 1 69 1363 3.8 10.8 17.0
Luxembourg 46,624 0 30,341 73 0.7 0 0 0.40 63 69 9 22 40 96 4 110 1861 4.2 10.6 16.3
Switzerland 307,846 – 32,195 37 2.2 0.3 0 0.57 38 59 5 36 50 92 8 113 1811 4.2 10.4 16.4
Norway 142,151 – 45,120 53 6.7 0 0 5.79 37 62 5 33 48 94 6 95 1721 4.0 10.8 16.2
VW 1,490,410 13 25,651 56 0.2 1.3 0.1 0.07 23 90 0 9 64 98 2 85 1570 3.9 10.2 16.6
Ford 893,840 8 21,857 45 0 1.2 0.1 0.01 8 96 0 4 55 100 0 82 1454 3.7 10.6 16.2
Renault 776,698 7 20,262 60 0 0.4 0 1.14 7 100 0 0 8 99 1 72 1368 3.9 9.7 15.8
Peugeot 711,165 6 21,188 61 2.4 0.6 0 0.05 11 97 0 3 8 100 0 74 1473 3.8 10.8 16.9
Audi 664,932 6 37,318 75 0.1 0 0 0 42 67 0 33 95 97 2 121 2001 4.4 10.0 16.4
BMW 612,994 5 41,704 81 0.1 0 0 0.21 53 0 70 30 96 90 10 135 2130 4.4 10.6 16.4
Mercedes-Benz 599,892 5 42,095 71 1.0 0 0 0.02 60 42 45 14 98 71 29 126 2107 4.3 10.4 16.1
Citroën 580,590 5 21,537 64 1.0 0.4 0 0.09 13 98 0 2 6 99 0 74 1484 3.8 10.8 17.1
Fiat 557,470 5 16,113 31 0 12.7 0 0 4 95 0 5 0 79 21 62 1317 3.8 10.9 17.1
Opel 546,115 5 21,779 41 0 4.1 0 0.51 8 95 0 5 2 97 2 84 1511 4.0 10.2 17.1
Toyota 488,535 4 21,768 26 22.8 0 0 0.88 33 91 1 8 3 100 0 76 1549 3.8 11.4 16.3
Škoda 485,062 4 20,077 46 0 0.2 0 0 12 92 0 8 63 100 0 78 1476 3.8 10.2 16.6
Nissan 405,766 3 22,957 51 0 2.1 0 1.52 10 91 0 8 9 99 0 84 1524 3.9 10.6 15.3
Hyundai 405,681 3 19,439 39 0 1.7 0 0 7 93 0 6 5 99 0 79 1476 4.0 10.5 16.8
Kia 337,465 3 20,228 45 0.2 1.1 0 0 9 92 0 8 25 100 0 81 1487 3.9 10.6 17.0
Dacia 283,475 2 12,647 52 0 5.2 0.2 0 0 89 0 11 0 100 0 68 1323 3.8 9.7 16.6
Seat 279,974 2 19,707 44 0 0.8 0 0 6 99 0 1 64 100 0 77 1445 3.8 10.3 16.5
Vauxhall 259,451 2 22,190 38 0 0 0 0.10 9 96 0 4 0 100 0 85 1549 4.0 10.6 17.2
Volvo 210,924 2 38,657 87 0 0.2 0.5 3.75 45 72 0 28 87 99 1 114 1962 4.6 12.6 16.4
Mini 147,661 1 23,395 45 0 0 0 0 18 87 0 13 27 95 4 90 1665 4.0 10.9 16.5
Tota
l new
sal
es/r
egis
trat
ions
Tota
l new
sal
es/r
egis
trat
ions
[%
]
Pri
ce [
EU
R in
cl. t
ax]
Die
sel [
%]
Hyb
rid
exc
l. P
HE
V [
%]
Nat
ural
gas
(m
ono
-/b
ival
ent,
incl
. LP
G)
[%]
Flex
-Fue
l (et
hano
l/g
aso
line)
[%
]
Ele
ctri
c/fu
el c
ell i
ncl.
PH
EV
[%
]
Aut
om
atic
[%
]
Fro
nt d
rive
[%
]
Rea
r d
rive
[%
]
4-w
heel
dri
ve [
%]
Dir
ect
inje
ctio
n (n
on-
die
sel)
[%
]
Eur
o 5
[%
]
Eur
o 6
[%
]
Eng
ine
pow
er [
KW
]
Eng
ine
size
[cc
m]
Num
ber
of
cylin
der
s
Co
mp
ress
ion
rate
(g
aso
line)
Co
mp
ress
ion
rate
(d
iese
l)
Num
ber
of
gea
rs
Per
form
ance
0–1
00
km
/h (
gas
olin
e) [
s]
Per
form
ance
0–1
00
km
/h (
die
sel)
[s]
Mas
s in
run
ning
ord
er [
kg]
Gro
ss w
eig
ht [
kg]
5.7 11.8 10.8 1391 1857 518 4272 1776 1536 2616 1520 1517 4.0 386 5.0 4.7 5.2 4.5 6.4 127 EU-28
5.9 11.2 9.8 1469 1943 529 4357 1785 1545 2654 1529 1527 4.0 408 4.9 4.6 5.5 4.7 6.9 135 Germany
5.7 11.9 10.3 1398 1852 506 4251 1772 1520 2609 1525 1518 4.0 374 4.9 4.5 5.2 4.5 6.5 129 UK
5.6 12.3 11.6 1312 1798 535 4206 1775 1539 2598 1509 1507 3.9 371 5.0 4.7 4.7 4.1 5.8 118 France
5.5 13.1 11.6 1307 1742 484 4114 1744 1542 2546 1498 1496 3.8 344 4.8 4.7 5.1 4.4 6.3 121 Italy
5.6 11.8 10.9 1373 1863 538 4352 1776 1543 2629 1522 1518 4.0 425 5.0 4.8 5.5 4.7 6.9 134 EU-13
5.6 12.2 11.3 1398 1857 509 4285 1800 1529 2619 1524 1519 4.0 394 5.1 4.8 5.0 4.3 6.1 124 Spain
5.6 12.4 11.6 1398 1893 547 4325 1784 1548 2643 1523 1522 4.0 397 5.0 4.7 5.0 4.3 6.1 124 Belgium
5.6 11.8 11.2 1291 1746 513 4185 1750 1508 2587 1503 1502 3.9 347 4.8 4.7 4.7 4.2 5.9 109 Netherlands
5.7 12.4 11.0 1449 1929 530 4348 1784 1564 2644 1527 1525 4.0 403 5.1 4.8 5.3 4.6 6.6 132 Austria
5.9 11.0 10.2 1573 2042 518 4491 1808 1546 2699 1530 1545 4.2 405 5.0 4.7 5.4 4.7 6.7 135 Sweden
5.4 12.8 11.3 1268 1649 450 4055 1724 1506 2542 1562 1482 3.8 440 5.1 4.9 4.7 4.1 5.9 113 Denmark
5.5 12.9 11.2 1353 1794 489 4247 1762 1499 2604 1487 1513 4.0 326 4.8 4.7 4.5 3.9 5.5 114 Portugal
5.9 11.0 10.3 1450 1932 532 4436 1792 1527 2670 1540 1538 4.1 439 5.1 4.9 5.4 4.7 6.8 132 Finland
5.6 13.5 11.5 1393 1873 527 4367 1784 1511 2677 1517 1530 4.1 372 4.9 4.7 4.8 4.2 5.9 122 Ireland
5.3 13.7 14.2 1233 1663 478 4067 1729 1498 2530 1537 1462 3.6 436 5.1 4.8 4.5 3.9 5.6 112 Greece
6.6 9.3 9.0 1507 1987 520 4348 1794 1540 2648 1539 1543 4.2 427 5.0 4.7 5.3 4.6 6.5 133 Luxembourg
5.9 10.2 9.8 1511 1960 498 4354 1788 1551 2648 1530 1528 4.0 405 5.0 4.7 6.0 5.1 7.6 145 Switzerland
5.9 11.3 10.9 1484 1966 529 4413 1790 1547 2665 1540 1536 4.1 439 5.1 4.9 5.2 4.6 6.4 123 Norway
5.7 11.8 10.9 1399 1906 572 4295 1774 1548 2618 1515 1508 3.9 420 5.0 4.7 5.1 4.4 6.4 127 VW
5.5 12.6 11.2 1359 1856 545 4270 1788 1555 2607 1521 1520 4.0 353 5.1 4.7 5.0 4.3 6.3 123 Ford
5.4 12.4 12.1 1265 1761 543 4204 1776 1526 2620 1507 1503 3.9 359 5.0 4.7 4.5 4.0 5.5 112 Renault
5.4 12.3 11.8 1305 1749 494 4162 1795 1522 2586 1499 1497 3.9 363 5.0 4.7 4.7 4.0 5.7 115 Peugeot
6.3 8.7 8.9 1577 2042 514 4490 1823 1468 2704 1609 1552 4.3 429 4.8 4.6 5.3 4.7 6.4 135 Audi
6.9 8.0 8.4 1637 2111 537 4606 1821 1479 2802 1548 1578 4.4 453 4.9 4.5 5.3 4.6 6.5 136 BMW
6.5 8.4 9.0 1691 2212 559 4579 1812 1514 2781 1563 1569 4.3 467 4.9 4.5 5.5 4.7 6.9 139 Mercedes-Benz
5.3 12.6 12.7 1309 1759 503 4159 1768 1564 2579 1494 1498 3.8 356 5.0 4.7 4.7 4.1 5.8 118 Citroën
5.2 13.2 13.4 1163 1579 459 3870 1683 1561 2431 1449 1443 3.5 257 4.5 4.2 5.1 4.4 6.4 120 Fiat
5.5 12.5 11.4 1423 1862 490 4315 1794 1553 2605 1520 1522 3.9 373 5.1 4.6 5.4 4.6 6.9 131 Opel
5.6 12.3 10.7 1291 1700 458 4122 1733 1517 2559 1497 1493 3.8 347 5.0 4.8 4.8 4.3 5.9 115 Toyota
5.4 12.2 11.0 1274 1769 553 4331 1733 1509 2571 1493 1483 3.8 476 4.9 4.9 5.1 4.4 6.4 124 Škoda
5.5 12.2 11.6 1384 1835 500 4227 1756 1593 2599 1523 1527 4.0 343 5.3 5.0 5.5 4.7 6.8 135 Nissan
5.6 12.6 12.1 1326 1773 500 4193 1751 1546 2588 1552 1534 4.0 404 5.0 4.9 5.3 4.6 6.6 129 Hyundai
5.6 12.5 12.2 1349 1787 483 4214 1765 1537 2596 1547 1553 4.0 381 5.1 4.8 5.3 4.6 6.5 129 Kia
5.3 12.4 12.8 1184 1670 536 4237 1767 1616 2658 1493 1483 3.9 368 5.1 4.9 5.4 4.7 6.6 128 Dacia
5.4 11.1 11.1 1268 1705 488 4191 1740 1478 2559 1472 1467 3.8 425 5.0 4.7 4.9 4.2 6.1 119 Seat
5.5 12.7 11.0 1433 1881 498 4319 1784 1540 2617 1513 1514 3.9 333 5.2 4.6 5.5 4.6 7.0 134 Vauxhall
6.0 7.7 10.5 1698 2203 556 4586 1851 1538 2741 1589 1574 4.3 481 5.0 4.9 5.1 4.5 6.6 132 Volvo
6.0 9.9 10.4 1309 1645 387 3883 1724 1468 2521 1488 1501 3.8 244 4.2 3.6 5.3 4.6 6.6 130 Mini

73 74
EUROPEAN VEHICLE MARKET STATISTICS 2021/22 Annex
2012Passenger cars
Pay
load
[kg
]
Leng
th [
mm
]
Wid
th [
mm
]
Hei
ght
[m
m]
Whe
elb
ase
[mm
]
Fro
nt t
rack
[m
m]
Rea
r tr
ack
[mm
]
Foo
tpri
nt [
m2 ]
Bo
ot
volu
me
[l]
Seat
s
Do
ors
Fuel
co
nsum
pti
on
(NE
DC
) [l
/10
0 k
m]
Fuel
co
nsum
pti
on
(ext
ra-u
rban
) [l
/10
0 k
m]
Fuel
co
nsum
pti
on
(urb
an)
[l/1
00
km
]
CO
2 (N
ED
C)
[g/k
m]
CO
(d
iese
l veh
icle
s) [
mg
/km
]
CO
(g
aso
line
vehi
cles
) [m
g/k
m]
HC
(g
aso
line
vehi
cles
) [m
g/k
m]
NH
MC
(g
aso
line
Eur
o 5
/6 v
ehic
les)
[m
g/k
m]
NO
x (d
iese
l veh
icle
s) [
mg
/km
]
NO
x (g
aso
line
vehi
cles
) [m
g/k
m]
HC
+ N
Ox (
die
sel v
ehic
les)
[m
g/k
m]
Par
ticu
late
s (d
iese
l veh
icle
s) [
mg
/km
]
EU-27 12,008,247 100 25,584 55 1.1 1.9 0.2 0.16 19 80 7 11 25 91 0.7 89 1642 4.0 10.5 16.6 5.6 12.0 10.9 1402 1864
Germany 3,082,352 26 28,483 48 0.7 0.5 0.1 0.12 26 73 12 15 41 90 1.3 101 1756 4.1 10.4 16.5 5.8 11.3 9.9 1489 1950
United Kingdom 2,039,986 17 26,267 51 1.2 0 0 0.09 25 79 11 10 17 88 0.4 93 1673 4.0 10.7 16.5 5.7 11.9 10.4 1396 1858
France 1,860,524 15 24,139 73 1.3 0.1 0.4 0.32 16 89 3 8 12 94 0.6 81 1592 4.0 10.5 16.6 5.5 12.5 11.6 1342 1822
Italy 1,396,079 12 21,514 53 0.5 12.9 0 0.04 11 85 5 11 6 95 0.7 77 1511 3.9 10.7 16.6 5.5 13.4 11.5 1313 1745
EU-12 758,774 6 20,600 42 0.4 0.3 0.2 0.09 8 73 2 12 22 92 0.5 87 1620 4.0 10.4 16.6 5.5 12.1 10.9 1389 1864
Spain 699,589 6 23,786 69 1.4 0 0 0.07 9 86 5 9 19 85 0.6 85 – 4.0 10.6 16.6 5.6 12.4 11.3 1410 1869
Netherlands 502,541 4 24,123 28 4.5 1.8 0.1 0.76 21 92 5 3 29 94 0.2 79 1438 3.8 10.6 16.4 5.5 11.9 11.6 1252 1714
Belgium 486,736 4 25,215 69 1.0 0.1 0 0.17 12 84 8 8 16 85 1.0 84 1634 4.0 10.6 16.6 5.6 12.6 11.6 1430 1907
Austria 336,010 3 26,679 56 0.6 0.1 0.3 0.18 14 77 4 19 23 87 0.8 87 1648 4.0 10.5 16.5 5.6 12.6 11.1 1447 1919
Sweden 279,895 2 31,186 67 1.2 1.6 2.4 0.15 36 71 7 23 39 90 0.5 102 1787 4.1 10.5 16.5 5.9 11.0 10.3 1580 2032
Denmark 170,783 1 31,328 40 0.2 0 0 0.32 9 95 4 2 11 90 0.2 72 1404 3.7 10.5 16.7 5.3 13.0 11.5 1262 1656
Finland 111,292 1 31,617 39 1.3 0.1 1.0 0.09 32 80 6 15 39 91 0.5 96 1675 4.0 10.5 16.5 5.8 11.1 10.3 1457 1944
Portugal 95,309 1 27,450 71 1.0 0.7 0 0.09 12 85 12 2 7 92 0.3 81 1541 3.9 10.6 16.4 5.5 13.1 11.2 1366 1800
Ireland 79,498 1 28,087 73 0.8 0 1.5 0.17 12 88 6 5 13 97 0.4 81 1598 3.9 10.7 16.4 5.6 13.8 11.4 1418 1878
Greece 58,481 0 19,978 40 0.8 0.1 0 0 0 86 4 6 2 93 0.2 70 1368 3.8 10.8 17.2 5.1 13.3 12.9 1237 1658
Luxembourg 50,398 0 30,336 76 1.2 0 0 0.20 6 68 10 22 37 98 1.1 109 1874 4.2 10.8 16.3 6.6 9.3 9.2 1518 2003
VW 1,541,464 13 25,613 59 0 1.0 0.1 0 21 90 0 9 62 96 0.1 85 1588 3.9 10.2 16.7 5.7 11.9 11.0 1435 1935
Ford 920,047 8 22,043 52 0 1.2 0.2 0 9 96 0 4 15 80 0 80 1544 3.9 10.9 16.4 5.4 13.0 11.6 1347 1830
Renault 783,457 7 20,927 63 0 0.7 0.6 0.18 5 98 0 1 0 91 0.8 74 1436 4.0 9.8 15.9 5.4 12.4 11.9 1310 1785
Peugeot 759,950 6 21,607 66 1.9 0.5 0 0.35 12 96 0 2 8 96 0 75 1513 3.9 10.7 17.3 5.4 12.3 11.9 1333 1779
Audi 673,310 6 37,823 74 0.2 0 0 0 39 67 0 32 99 86 0.9 122 2031 4.4 9.9 16.5 6.2 8.7 9.0 1600 2062
Citroën 648,266 5 21,545 67 0.3 0.5 0 0.39 13 97 0 2 6 93 0 74 1513 3.9 10.7 17.2 5.2 13.2 13.0 1301 1759
BMW 614,256 5 41,989 81 0.1 0 0 0.01 50 0 71 28 94 93 0.5 138 2165 4.4 10.7 16.4 6.8 7.8 8.3 1664 2116
Opel 583,342 5 22,521 45 0 4.6 0 0.75 8 96 0 3 1 96 0 85 1524 4.0 10.2 17.2 5.5 12.4 11.7 1444 1894
Mercedes-Benz 576,078 5 42,622 70 0.3 0.1 0 0.03 56 32 53 15 75 85 9.0 127 2159 4.4 10.2 16.2 6.4 8.9 9.0 1699 2210
Fiat 573,170 5 15,244 26 0 14.9 0 0.02 3 95 0 5 0 90 0.9 62 1347 3.9 10.9 17.0 5.1 13.4 12.7 1127 1521
Toyota 486,747 4 21,500 28 14.8 0 0 0 24 91 1 7 1 87 0 76 1518 3.8 11.2 16.5 5.6 12.6 10.9 1294 1677
Škoda 463,791 4 20,530 49 0 0.2 0.1 0 9 90 0 8 60 91 0 78 1508 3.8 10.2 16.9 5.4 12.3 11.3 1328 1812
Nissan 416,938 3 22,894 51 0 1.2 0 0.68 10 88 0 10 10 87 0 84 1534 3.9 10.6 15.3 5.4 12.2 11.6 1397 1850
Hyundai 413,053 3 19,543 40 0 0.3 0 0 7 90 1 8 5 90 0 80 1502 4.0 10.5 16.7 5.5 12.5 11.8 1344 1780
Kia 330,198 3 19,726 45 0 0.2 0 0 9 89 0 9 14 94 0 79 1478 3.9 10.6 17.0 5.5 12.6 12.3 1324 1757
Seat 251,149 2 19,535 51 0 0.2 0 0 6 98 0 1 47 93 0 74 1455 3.8 10.3 16.6 5.4 11.7 11.6 1279 1721
Vauxhall 232,224 2 22,977 39 0 0 0 0.20 10 97 0 3 0 94 0 85 1538 4.0 10.6 17.1 5.5 12.4 11.2 1358 1865
Dacia 229,261 2 13,446 58 0 7.3 3.9 0 0 82 0 17 0 89 0 69 1460 4.0 9.7 16.7 5.4 13.1 12.7 1230 1710
Volvo 211,399 2 38,269 90 0 0 1.4 0.06 40 76 0 24 62 97 0 114 1944 4.6 10.1 16.4 6.0 8.9 10.2 1686 2189
Chevrolet 167,075 1 18,594 36 0 8.5 0 0.33 9 90 1 7 0 99 0 86 1568 4.0 10.2 16.4 5.4 13.2 10.5 1321 1743
No
ise
(pas
s-b
y) [
dB
]
No
ise
(sta
tio
nary
) [d
B]
Tota
l new
sal
es/r
egis
trat
ions
Tota
l new
sal
es/r
egis
trat
ions
[%
]
Pri
ce [
EU
R in
cl. t
ax]
Die
sel [
%]
Hyb
rid
exc
l. P
HE
V [
%]
Nat
ural
gas
(m
ono
-/b
ival
ent,
incl
. LP
G)
[%]
Flex
-Fue
l (et
hano
l/g
aso
line)
[%
]
Ele
ctri
c/fu
el c
ell i
ncl.
PH
EV
[%
]
Aut
om
atic
[%
]
Fro
nt d
rive
[%
]
Rea
r d
rive
[%
]
4-w
heel
dri
ve [
%]
Eng
ine
pow
er [
KW
]
Eng
ine
size
[cc
m]
Num
ber
of
cylin
der
s
Co
mp
ress
ion
rate
(g
aso
line)
Co
mp
ress
ion
rate
(d
iese
l)
Num
ber
of
gea
rs
Per
form
ance
0–1
00
km
/h (
gas
olin
e) [
s]
Per
form
ance
0–1
00
km
/h (
die
sel)
[s]
Mas
s in
run
ning
ord
er [
kg]
Gro
ss w
eig
ht [
kg]
512 4270 1772 1540 2561 1519 1515 4.0 384 4.9 4.6 5.4 4.6 6.8 133 233 379 44 36 153 24 179 2 73 79 EU-27
521 4362 1783 1552 2652 1530 1528 4.0 408 4.9 4.6 5.8 4.9 7.3 143 214 380 43 34 153 25 176 2 72 76 Germany
495 4256 1771 1519 2608 1527 1517 4.0 372 4.9 4.5 5.4 4.6 6.9 134 221 377 46 36 150 24 170 2 71 77 United Kingdom
526 4217 1773 1545 2602 1506 1504 3.9 371 5.0 4.7 5.0 4.3 6.2 125 263 379 47 38 155 24 205 2 72 76 France
488 4109 1741 1546 2545 1495 1493 3.8 339 4.8 4.6 5.4 4.6 6.7 126 250 344 44 38 153 22 186 2 72 77 Italy
526 4322 1772 1545 2621 1518 1514 4.0 422 5.0 4.8 5.8 4.9 7.3 141 243 387 41 39 148 24 193 3 72 76 EU-12
516 4299 1798 1534 2622 1524 1519 4.0 392 5.0 4.7 5.2 4.5 6.5 130 227 390 41 38 157 26 172 3 71 76 Spain
515 4156 1741 1512 2570 1499 1497 3.8 344 4.8 4.6 5.1 4.4 6.3 120 243 384 45 35 152 23 199 1 71 77 Netherlands
528 4334 1786 1549 2644 1521 1519 4.0 396 5.0 4.6 5.2 4.5 6.5 132 225 397 47 36 155 23 173 2 72 76 Belgium
523 4336 1780 1566 2637 1524 1521 4.0 399 5.0 4.8 5.5 4.7 6.9 137 227 433 43 33 154 23 171 2 72 76 Austria
508 4490 1805 1545 2694 1567 1546 4.2 442 5.0 4.8 5.5 4.8 6.9 139 218 366 41 35 154 23 172 2 71 75 Sweden
435 4054 1722 1512 2540 1487 1482 3.8 318 4.8 4.7 4.9 4.2 6.1 119 243 390 43 35 159 21 206 2 71 77 Denmark
531 4432 1790 1534 2663 1534 1536 4.1 431 5.1 4.8 5.8 4.9 7.3 141 217 396 40 36 152 25 175 2 71 76 Finland
480 4248 1761 1504 2601 1517 1512 3.9 371 4.9 4.7 4.8 4.1 5.9 120 222 391 47 37 152 21 171 2 71 76 Portugal
510 – – – 2647 1555 1534 4.1 429 5.0 4.6 5.0 4.3 6.1 126 227 480 43 33 144 22 225 1 71 75 Ireland
469 – – – 2523 1428 1425 3.5 263 4.9 4.6 5.1 4.3 6.3 122 222 374 42 36 150 24 172 3 71 77 Greece
514 – – – 2651 1554 1560 4.3 474 4.9 4.5 5.5 4.7 6.8 138 240 367 40 36 150 26 193 2 72 76 Luxembourg
568 4316 1773 1562 2572 1512 1515 3.9 423 4.9 4.6 5.4 4.6 6.8 134 217 417 40 0 143 27 170 1 71 75 VW
533 4275 1792 1546 2557 1517 1514 4.0 346 5.1 4.7 5.4 4.5 6.8 132 240 412 68 54 177 29 205 2 70 76 Ford
518 4223 1769 1539 2587 1503 1498 3.9 359 5.0 4.6 5.0 4.3 6.2 123 273 313 53 58 163 28 186 1 72 78 Renault
494 4181 1791 1524 2564 1500 1495 3.9 359 4.9 4.6 4.9 4.2 6.2 122 304 398 49 0 162 27 193 2 72 76 Peugeot
517 4513 1812 1478 2676 1637 1554 4.3 431 4.7 4.5 5.5 4.8 6.8 141 181 384 44 0 148 27 172 1 72 74 Audi
504 4156 1765 1563 2547 1487 1492 3.8 365 5.0 4.7 5.0 4.3 6.3 125 312 376 56 62 159 28 199 1 72 77 Citroën
518 4599 1824 1484 2768 1547 1574 4.4 446 4.9 4.4 5.5 4.8 6.8 142 262 191 53 33 148 30 173 11 72 77 BMW
505 4371 1800 1552 2589 1522 1527 4.0 390 5.2 4.7 5.5 4.6 7.0 133 165 457 39 0 151 22 171 2 72 77 Opel
551 4558 1812 1536 2757 1563 1568 4.3 484 4.9 4.4 5.9 5.0 7.6 150 149 318 38 18 157 25 172 2 72 76 Mercedes-Benz
468 3838 1665 1552 2408 1435 1430 3.5 238 4.6 4.3 5.3 4.5 6.7 123 352 304 40 40 165 23 206 2 72 80 Fiat
433 4060 1725 1529 2477 1488 1482 3.8 323 5.0 4.7 5.2 4.5 6.3 122 230 276 39 37 157 17 175 4 71 77 Toyota
546 4324 1728 1518 2246 1493 1482 3.8 480 4.9 4.9 5.4 4.6 6.9 134 230 423 37 0 137 21 171 1 71 73 Škoda
512 4236 1753 1596 2557 1519 1524 4.0 339 5.4 5.0 5.7 4.9 7.2 141 217 386 33 32 201 17 225 14 70 75 Nissan
492 4182 1749 1552 2483 1546 1528 4.0 395 5.0 4.9 5.4 4.7 6.6 132 211 398 29 24 143 28 172 2 72 79 Hyundai
469 4165 1756 1536 2506 1538 1543 4.0 374 5.0 4.8 5.3 4.6 6.4 129 202 371 31 20 167 29 193 7 72 79 Kia
491 4211 1732 1480 2508 1497 1487 3.8 355 4.9 4.6 5.0 4.3 6.4 124 208 283 37 0 136 32 156 1 71 76 Seat
500 4325 1784 1528 2622 1529 1531 4.1 375 5.2 4.6 5.6 4.7 7.4 135 166 417 36 0 149 21 169 2 72 77 Vauxhall
530 4260 1786 1629 2515 1454 1453 3.9 441 5.1 5.0 5.9 5.2 7.4 140 351 426 53 50 143 35 167 10 72 79 Dacia
555 4620 1851 1546 2717 1594 1578 4.4 469 5.0 4.8 5.5 4.7 7.0 144 213 414 43 0 196 19 223 1 71 73 Volvo
481 4209 1741 1554 2527 1508 1512 3.9 308 5.5 4.8 5.9 4.9 7.7 142 111 516 42 38 193 15 227 2 71 79 Chevrolet
Dir
ect
inje
ctio
n (n
on-
die
sel)
[%
]
Eur
o 5
[%
]
Eur
o 6
[%
]

75 76
EUROPEAN VEHICLE MARKET STATISTICS 2021/22 Annex
2011Passenger cars
Pay
load
[kg
]
Leng
th [
mm
]
Wid
th [
mm
]
Hei
ght
[m
m]
Whe
elb
ase
[mm
]
Fro
nt t
rack
[m
m]
Rea
r tr
ack
[mm
]
Foo
tpri
nt [
m2 ]
Bo
ot
volu
me
[l]
Seat
s
Do
ors
Fuel
co
nsum
pti
on
(NE
DC
) [l
/10
0 k
m]
Fuel
co
nsum
pti
on
(ext
ra-u
rban
) [l
/10
0 k
m]
Fuel
co
nsum
pti
on
(urb
an)
[l/1
00
km
]
CO
2 (N
ED
C)
[g/k
m]
CO
(d
iese
l veh
icle
s) [
mg
/km
]
CO
(g
aso
line
vehi
cles
) [m
g/k
m]
HC
(g
aso
line
vehi
cles
) [m
g/k
m]
NH
MC
(g
aso
line
Eur
o 5
/6 v
ehic
les)
[m
g/k
m]
NO
x (d
iese
l veh
icle
s) [
mg
/km
]
NO
x (g
aso
line
vehi
cles
) [m
g/k
m]
HC
+ N
Ox (
die
sel v
ehic
les)
[m
g/k
m]
Par
ticu
late
s (d
iese
l veh
icle
s) [
mg
/km
]
EU-27 13,117,185 100 24,439 – 55 0.7 1.0 0.2 0.07 20 83 7 10 21 77 88 1644 4.0 10.5 16.7 5.6 12.1 11.1 1393 1853
Germany 3,173,473 24 27,859 – 47 0.4 0.3 0.1 0.07 26 74 13 13 35 78 99 1767 4.1 10.4 16.7 5.7 11.4 10.0 1484 1941
France 2,165,803 17 22,668 – 72 0.6 0.5 0.3 0.12 13 91 3 6 9 83 79 1571 4.0 10.5 16.8 5.5 12.6 11.9 1329 1798
United Kingdom 1,937,105 15 24,132 – 51 1.2 0 0 0.06 24 80 10 10 17 72 93 1698 4.1 10.6 16.6 5.6 11.8 10.5 1406 1867
Italy 1,743,989 13 21,402 – 55 0.3 5.2 0 0.02 18 85 4 11 7 85 78 1529 4.0 10.7 16.8 5.5 13.3 11.5 1314 1746
EU-12 812,385 6 19,697 – 40 0.3 0.1 0 0.03 11 85 2 13 22 74 85 1612 4.0 10.4 16.8 5.5 12.1 11.0 1373 1849
Spain 808,058 6 23,569 – 70 1.2 0 0 0.05 16 84 5 11 15 67 86 1672 4.0 10.6 16.7 5.6 12.3 11.4 1422 1887
Belgium 572,209 4 24,073 – 75 1.2 0.1 0 0.05 17 86 7 7 10 67 82 1622 4.0 10.6 16.7 5.5 12.8 11.9 1400 1856
Netherlands 555,917 4 22,202 – 28 2.7 1.1 0.1 0.16 18 93 4 3 22 74 78 1445 3.8 10.5 16.6 5.4 12.1 12.0 1212 1693
Austria 356,144 3 25,970 – 55 0.4 0.1 0.4 0.18 17 79 4 16 19 75 85 1644 4.0 10.4 16.7 5.6 12.7 11.2 1438 1911
Sweden 304,983 2 29,009 – 61 1.0 1.9 5.2 0.06 32 74 7 20 34 74 102 1792 4.2 10.4 16.6 5.8 10.8 10.3 1562 2015
Denmark 170,008 1 35,126 – 48 0.1 0 0 0.27 15 95 4 2 15 69 78 1505 3.9 10.5 16.9 5.4 12.5 11.5 1332 1764
Portugal 153,486 1 26,805 – 70 0.6 0.4 0 0.13 16 88 10 2 8 74 80 1537 3.9 10.5 16.6 5.5 13.2 11.4 1373 1795
Finland 126,169 1 30,480 – 42 0.9 0 0.3 0.02 30 81 5 14 33 77 96 1703 4.1 10.5 16.6 5.7 11.1 10.4 1472 1951
Greece 97,679 1 19,084 – 10 1.0 0.1 0 0 6 89 5 7 8 68 73 1375 3.9 10.3 16.5 5.2 13.6 12.7 1230 1649
Ireland 89,896 1 25,523 – 71 0.6 0 1.5 0.05 11 91 6 3 12 75 79 1579 3.9 10.6 16.7 5.5 13.8 11.4 1394 1850
Luxembourg 49,881 0 29,880 – 77 0.6 0 0 0.06 – 70 10 20 29 93 108 1891 4.2 10.8 16.4 6.5 9.9 9.0 1518 1990
VW 1,623,368 12 25,706 – 61 0 1.0 0.2 0.01 24 92 0 8 59 94 86 1619 3.9 10.2 16.7 5.8 11.8 11.1 1454 1964
Ford 1,060,324 8 21,061 – 54 0 0.5 0.2 0 10 96 0 4 10 66 79 1576 4.0 10.9 16.6 5.4 12.8 11.7 1342 1818
Renault 1,013,699 8 20,041 – 60 0 0.5 0.9 0.05 8 99 0 1 0 74 74 1457 4.0 9.8 16.2 5.4 12.2 11.9 1305 1762
Peugeot 874,931 7 21,145 – 66 0 0.2 0 0.19 14 99 0 0 11 73 75 1518 3.9 10.6 17.6 5.4 12.7 12.1 1346 1786
Citroën 745,839 6 20,695 – 66 0 0.4 0 0.21 15 99 0 1 7 80 73 1500 3.9 10.7 17.3 5.2 13.3 13.2 1294 1763
Opel 734,688 6 21,361 – 48 0 1.0 0 0.04 9 98 0 2 1 89 82 1507 4.0 10.2 17.3 5.5 12.4 12.1 1418 1857
Fiat 677,084 5 15,145 – 33 0 7.4 0.1 0.01 9 95 0 5 0 83 61 1340 3.9 10.9 17.2 5.1 13.5 12.7 1103 1502
Audi 654,663 5 36,899 – 72 0.1 0 0.1 0 34 68 0 32 99 64 120 2041 4.4 10.0 16.7 6.0 8.8 9.2 1576 2042
BMW 618,280 5 41,195 – 81 0.1 0 0 0 41 0 71 29 84 82 139 2263 4.6 11.3 16.4 6.5 8.1 8.3 1686 2131
Mercedes-Benz 575,824 4 41,923 – 68 0 0.3 0 0.04 61 26 62 12 45 78 126 2214 4.4 10.3 16.4 6.0 9.7 8.9 1690 2181
Toyota 504,264 4 20,370 – 30 10.3 0 0 0 27 91 0 9 1 45 77 1513 3.7 11.1 16.6 5.6 12.8 11.0 1297 1685
Škoda 469,736 4 20,313 – 50 0 0.1 0.1 0 15 91 0 9 65 79 79 1526 3.9 10.1 16.8 5.5 12.0 11.5 1344 1839
Nissan 444,992 3 21,411 – 47 0 0.1 0 0.30 14 88 0 11 9 77 84 1550 3.8 10.6 15.4 5.4 12.3 11.8 1381 1817
Hyundai 379,326 3 17,848 – 38 0 0.1 0 0 10 92 1 7 1 64 77 1492 4.0 10.4 17.0 5.1 12.9 12.4 1317 1747
Seat 297,427 2 19,690 – 59 0 0.1 0 0 9 99 0 1 44 78 76 1497 3.8 10.3 16.6 5.4 11.8 11.8 1295 1759
Kia 281,111 2 18,900 – 47 0 0.2 0 0 11 91 0 9 8 73 80 1511 3.9 10.5 17.0 5.4 13.0 12.2 1353 1776
Dacia 245,309 2 13,293 – 60 0 2.9 2.7 0 0 77 0 23 0 76 69 1457 4.0 9.7 16.3 5.4 12.8 12.8 1229 1699
Volvo 235,391 2 37,379 – 88 0 0 1.8 0.03 40 76 0 24 54 89 119 1983 4.6 10.1 16.5 6.0 8.7 9.8 1698 2193
Vauxhall 234,703 2 21,758 – 44 0 0 0 0 12 99 0 1 0 89 85 1556 4.0 10.6 18.2 5.2 12.3 13.1 1394 1893
Chevrolet 171,818 1 15,905 – 20 0 8.8 0 0.04 7 95 0 5 0 83 77 1444 4.0 10.2 16.6 5.2 13.3 10.0 1258 1661
508 4263 1770 1538 2610 1511 1509 3.9 376 4.9 4.6 5.6 4.7 7.0 138 231 377 46 38 159 24 185 3 – – EU-27
513 4362 1784 1547 2651 1523 1525 4.0 403 4.9 4.5 6.0 5.0 7.6 147 211 379 45 38 158 25 182 2 – – Germany
518 4196 1765 1541 2593 1498 1496 3.9 362 5.0 4.6 5.1 4.4 6.4 129 253 393 48 43 164 23 172 3 – – France
497 4268 1773 1519 2611 1520 1513 4.0 367 4.9 4.5 5.7 4.8 7.2 140 222 356 50 38 159 25 221 3 – – United Kingdom
483 4112 1741 1544 2546 1487 1488 3.8 335 4.8 4.5 5.3 4.5 6.7 131 246 360 47 41 157 22 208 2 – – Italy
524 4306 1766 1540 2611 1513 1510 4.0 416 5.0 4.8 5.9 5.0 7.5 144 227 377 48 36 158 24 195 3 – – EU-12
522 4310 1802 1532 2625 1521 1516 4.0 391 5.0 4.7 5.4 4.6 6.8 137 220 363 42 38 163 27 202 4 – – Spain
502 4290 1775 1540 2626 1510 1507 3.9 375 5.0 4.5 5.3 4.5 6.6 133 231 394 47 37 165 21 173 3 – – Belgium
531 4117 1733 1517 2551 1496 1492 3.8 333 4.8 4.6 5.3 4.5 6.8 128 238 398 48 36 150 23 214 1 – – Netherlands
518 4331 1779 1559 2634 1518 1516 4.0 393 5.0 4.7 5.7 4.8 7.2 141 227 421 47 38 159 23 177 2 – – Austria
499 4479 1802 1543 2687 1557 1555 4.2 437 5.0 4.8 5.9 4.9 7.5 146 217 334 43 36 166 23 172 4 – – Sweden
460 4180 1744 1521 2575 1497 1492 3.8 344 4.9 4.7 5.3 4.5 6.6 129 242 379 46 34 165 21 178 3 – – Denmark
473 4250 1761 1509 2597 1515 1507 3.9 367 4.9 4.7 5.0 4.3 6.2 126 226 427 49 44 157 22 180 3 – – Portugal
529 4448 1790 1535 2663 1532 1535 4.1 432 5.1 4.8 6.0 5.0 7.6 146 212 383 44 34 157 25 175 2 – – Finland
469 – – – 2512 1421 1421 3.5 279 4.8 4.5 5.7 4.8 7.3 135 207 383 51 37 170 26 218 3 – – Greece
508 – – – 2633 1541 1524 4.0 414 5.0 4.6 5.1 4.4 6.4 129 220 446 46 40 152 22 198 2 – – Ireland
507 – – – 2647 1554 1561 4.3 473 4.9 4.5 5.7 4.8 7.1 144 238 360 43 85 152 26 141 1 – – Luxembourg
569 4362 1779 1559 2623 1505 1516 3.9 428 5.0 4.6 5.5 4.7 6.9 136 217 377 41 38 145 27 172 1 – – VW
530 4268 1794 1542 2613 1518 1513 4.0 350 5.1 4.6 5.4 4.5 7.0 135 238 417 69 46 195 31 221 5 – – Ford
504 4196 1769 1535 2615 1497 1491 3.9 353 4.9 4.5 5.3 4.6 6.7 132 281 350 55 47 183 28 208 4 – – Renault
486 4194 1783 1528 2589 1500 1495 3.9 358 4.9 4.6 5.2 4.4 6.7 130 287 436 50 42 165 25 195 3 – – Peugeot
513 4148 1762 1563 2568 1485 1490 3.8 363 5.0 4.7 5.1 4.4 6.5 128 296 375 54 55 166 26 202 2 – – Citroën
496 4348 1788 1540 2627 1516 1521 4.0 377 5.2 4.7 5.5 4.6 7.0 135 163 457 40 33 152 22 173 2 – – Opel
469 3840 1663 1544 2428 1435 1430 3.5 249 4.6 4.2 5.1 4.3 6.5 123 326 309 41 38 174 22 214 6 – – Fiat
520 4523 1819 1454 2715 1626 1551 4.3 428 4.7 4.2 5.9 5.0 7.5 149 160 386 44 37 155 27 177 2 – – Audi
498 4590 1827 1486 2804 1543 1567 4.4 446 4.8 4.4 5.8 5.0 7.3 150 271 241 50 36 145 30 172 0 – – BMW
529 4541 1811 1540 2785 1563 1567 4.3 483 4.9 4.3 6.4 5.3 8.3 162 155 383 44 37 161 21 178 2 – – Mercedes-Benz
438 4022 1725 1538 2527 1488 1482 3.8 311 4.9 4.6 5.2 4.6 6.4 127 185 306 49 37 164 17 180 9 – – Toyota
551 4370 1730 1518 2557 1495 1483 3.8 492 5.0 5.0 5.6 4.7 7.1 137 225 399 37 31 142 20 175 1 – – Škoda
500 4210 1749 1591 2597 1516 1520 3.9 338 5.3 5.0 5.9 5.0 7.4 145 209 379 35 32 194 19 218 9 – – Nissan
478 4127 1740 1559 2582 1502 1499 3.8 348 5.0 4.9 5.5 4.8 6.7 135 197 369 31 22 170 27 198 9 – – Hyundai
514 4260 1732 1477 2543 1495 1484 3.8 354 5.0 4.7 5.1 4.3 6.5 127 202 348 36 45 138 27 141 1 – – Seat
462 4168 1761 1558 2582 1536 1536 4.0 370 5.0 4.9 5.5 4.8 6.7 135 204 407 38 20 172 27 200 8 – – Kia
520 4244 1797 1631 2673 1443 1445 3.9 445 5.1 4.9 5.9 5.3 7.4 144 250 333 53 – 201 24 229 16 – – Dacia
550 4634 1851 1551 2748 1597 1581 4.4 461 5.0 4.7 5.9 4.9 7.7 154 244 384 42 – 178 23 204 1 – – Volvo
517 4358 1787 1526 2629 1489 1490 3.9 285 5.2 4.7 5.7 4.7 7.4 137 – – – – – – – – – – Vauxhall
461 4103 1711 1550 2531 1480 1482 3.8 279 5.4 4.8 6.0 4.9 7.8 141 124 545 43 38 210 15 249 3 – – Chevrolet
CO
at
-7 °
C (
gas
olin
e ve
hicl
es)
[mg
/km
]
HC
at
-7 °
C (
gas
olin
e ve
hicl
es)
[mg
/km
]
Tota
l new
sal
es/r
egis
trat
ions
Tota
l new
sal
es/r
egis
trat
ions
[%
]
Pri
ce [
EU
R in
cl. t
ax]
Top
sp
eed
[km
/h]
Die
sel [
%]
Hyb
rid
exc
l. P
HE
V [
%]
Nat
ural
gas
(m
ono
-/b
ival
ent,
incl
. LP
G)
[%]
Flex
-Fue
l (et
hano
l/g
aso
line)
[%
]
Ele
ctri
c/fu
el c
ell i
ncl.
PH
EV
[%
]
Aut
om
atic
[%
]
Fro
nt d
rive
[%
]
Rea
r d
rive
[%
]
4-w
heel
dri
ve [
%]
Dir
ect
inje
ctio
n (n
on-
die
sel)
[%
]
Eur
o 5
and
Eur
o 6
[%
]
Eng
ine
pow
er [
KW
]
Eng
ine
size
[cc
m]
Num
ber
of
cylin
der
s
Co
mp
ress
ion
rate
(g
aso
line)
Co
mp
ress
ion
rate
(d
iese
l)
Num
ber
of
gea
rs
Per
form
ance
0–1
00
km
/h (
gas
olin
e) [
s]
Per
form
ance
0–1
00
km
/h (
die
sel)
[s]
Mas
s in
run
ning
ord
er [
kg]
Gro
ss w
eig
ht [
kg]

77 78
EUROPEAN VEHICLE MARKET STATISTICS 2021/22 Annex
2010Passenger cars
EU-27 13,305,479 100 23,123 185 51 0.6 3.4 0.4 0.01 16 83 7 9 14 38 84 1633 4.0 10.5 17.2 5.4 12.4 11.6 1372 1821
Germany 2,877,790 22 26,721 192 41 0.3 0.4 0 0.01 23 75 14 11 24 49 96 1759 4.1 10.4 17.0 5.5 11.8 10.3 1462 1901
France 2,203,141 17 21,146 178 70 0.4 3.4 0.2 0.01 9 93 3 4 6 38 74 1548 4.0 10.5 17.4 5.3 12.9 12.4 1305 1767
United Kingdom 2,025,034 15 22,561 188 46 1.1 0 0 0.01 20 82 10 8 11 34 90 1694 4.1 10.6 17.2 5.4 12.2 10.9 1393 1851
Italy 1,967,376 15 20,278 178 46 0.2 18.1 0 0.01 14 86 4 10 6 34 74 1500 4.0 10.5 17.2 5.3 13.4 11.9 1287 1696
Spain 981,885 7 22,777 185 71 0.7 0 0 0.01 13 86 5 9 11 25 84 1678 4.0 10.5 17.4 5.4 12.4 11.7 1412 1874
EU-12 836,447 6 19,358 181 40 0.2 0.1 0 0 8 64 1 9 13 34 82 1614 4.0 10.4 17.7 5.3 12.6 11.6 1361 1830
Belgium 546,223 4 23,284 183 76 0.7 0 0 0.01 15 86 8 6 7 34 80 1640 4.0 10.5 17.3 5.4 13.1 12.0 1400 1856
Netherlands 483,061 4 22,549 181 20 3.3 0.4 0 0.03 18 92 4 3 16 43 79 1485 3.9 10.5 16.8 5.3 12.3 11.4 1206 1692
Austria 328,013 2 24,791 182 51 0.4 0.1 0.5 0.03 14 80 5 15 10 45 83 1643 4.0 10.4 17.2 5.4 13.2 11.7 1417 1882
Sweden 288,793 2 26,570 196 51 1.3 2.3 12.2 0 30 76 7 17 26 37 103 1816 4.2 10.4 17.2 5.5 11.0 10.8 1560 1995
Portugal 223,427 2 25,707 182 67 0.7 0.4 0 0.01 12 89 9 2 4 40 78 1529 4.0 10.5 16.9 5.4 13.4 11.5 1348 1768
Denmark 153,301 1 34,268 180 46 0.1 0 0 0.03 13 95 4 1 12 35 77 1516 3.9 10.4 17.4 5.4 12.6 11.5 1303 1757
Greece 141,496 1 19,457 177 4 0.8 0 0 0 4 83 5 8 3 34 78 1429 3.9 10.6 17.4 5.3 12.8 13.6 1250 1670
Finland 111,386 1 29,231 193 41 1.0 0 0.3 0.01 24 83 5 12 28 45 94 1719 4.1 10.5 17.1 5.6 11.3 10.7 1465 1937
Ireland 88,380 1 23,963 181 63 0.8 0 3.6 0.02 9 91 5 2 8 33 76 1563 3.9 10.5 17.3 5.3 13.5 11.7 1369 1828
Luxembourg 49,726 0 28,345 190 75 0.5 0.1 0 0 16 73 11 16 14 61 103 1870 4.2 10.4 17.2 5.5 10.6 11.6 1493 1945
VW 1,463,888 11 24,062 188 55 0 1.6 0.3 0 17 91 0 8 43 73 84 1611 3.9 10.3 17.1 5.6 12.3 11.4 1415 1910
Renault 1,109,101 8 19,345 178 60 0 2.5 1.4 0 6 97 0 1 0 24 72 1450 4.0 9.8 16.8 5.6 11.7 12.2 1299 1761
Ford 1,096,768 8 19,986 178 52 0 3.9 0.5 0 7 96 0 3 1 16 76 1579 4.0 11.0 18.1 5.1 12.9 12.1 1326 1778
Peugeot 967,037 7 19,443 178 62 0 1.7 0 0 8 99 0 1 5 23 70 1477 3.9 10.6 17.8 5.2 13.1 12.4 1315 1734
Fiat 816,424 6 14,784 163 29 0 13.2 0 0.01 11 95 0 4 0 35 57 1327 4.0 10.3 17.5 5.1 14.1 13.8 1085 1486
Citroën 813,973 6 19,695 175 63 0 3.7 0.1 0.01 8 98 0 1 5 33 70 1487 3.9 10.6 17.7 5.2 13.4 13.3 1313 1777
Opel 739,732 6 20,505 184 43 0 5.7 0 0 9 97 0 1 1 52 80 1507 4.0 10.4 17.6 5.4 12.7 12.2 1401 1838
Audi 601,652 5 37,190 214 73 0 0 0.2 0 29 68 0 31 81 44 121 2069 4.4 9.9 16.8 5.8 9.3 9.9 1606 2080
BMW 590,042 4 39,850 220 78 0.1 0 0 0 38 0 78 21 85 62 135 2291 4.6 11.6 16.3 6.2 8.4 8.5 1662 2092
Mercedes-Benz 568,710 4 40,165 210 64 0.1 0.4 0 0 60 32 56 11 14 56 122 2215 4.5 10.3 16.7 5.7 10.3 9.4 1658 2132
Toyota 559,648 4 20,251 174 31 9.4 0.6 0 0 23 89 0 10 1 23 77 1517 3.7 10.9 16.8 5.5 12.8 11.0 1312 1695
Škoda 446,194 3 19,803 187 51 0 0.3 0.1 0 12 89 0 7 37 51 78 1561 3.8 10.2 17.7 5.4 13.0 11.3 1340 1836
Nissan 392,194 3 20,550 172 43 0 2.2 0 0.01 12 87 1 10 3 22 79 1532 3.9 10.3 15.9 5.1 13.1 12.2 1367 1805
Hyundai 343,151 3 16,582 172 30 0 4.2 0 0 10 87 1 9 0 17 76 1477 4.0 10.4 17.2 5.0 13.2 12.6 1319 1724
Seat 294,661 2 18,997 185 58 0 0.5 0.2 0 6 98 0 1 25 43 76 1558 3.8 10.3 17.3 5.3 12.0 11.3 1288 1758
Dacia 259,290 2 11,157 162 41 0 21.9 1.1 0 0 80 0 6 0 10 61 1425 4.0 9.7 17.8 5.0 12.7 14.6 1174 1612
Kia 255,376 2 17,752 177 43 0 2.5 0 0 11 90 0 8 0 32 80 1527 4.0 10.1 17.4 5.0 14.1 12.9 1374 1774
Vauxhall 246,980 2 20,699 – 32 0 0 0 0 9 100 0 0 0 61 82 1532 4.0 10.6 18.1 5.2 12.7 12.7 1375 1875
Volvo 214,358 2 35,338 201 87 0 0 4.3 0 33 76 0 23 6 33 114 2019 4.6 10.3 17.8 5.5 9.8 10.8 1675 2185
Suzuki 185,371 1 14,705 166 18 0 3.1 0 0.02 9 70 0 26 0 43 68 1340 3.7 10.5 17.6 4.9 13.0 11.0 1148 1507
497 4220 1758 1531 2593 1499 1500 3.9 362 4.9 4.5 5.8 4.9 7.4 143 204 387 49 37 181 24 207 6 4338 890 EU-27
493 4312 1773 1535 2630 1504 1510 4.0 390 4.9 4.4 6.2 5.2 8.1 153 203 380 48 37 168 25 194 3 4285 938 Germany
509 4145 1751 1533 2576 1492 1488 3.8 344 4.9 4.6 5.2 4.5 6.6 132 216 384 51 41 191 24 216 9 4490 851 France
489 4238 1765 1519 2601 1498 1498 3.9 345 5.0 4.4 5.9 4.9 7.7 146 194 383 51 38 184 25 210 7 4281 901 United Kingdom
467 4059 1729 1538 2525 1483 1481 3.7 331 4.8 4.6 5.7 4.8 7.2 136 200 387 48 38 177 22 204 6 4125 815 Italy
516 4284 1767 1526 2617 1506 1504 3.9 376 5.0 4.6 5.6 4.7 7.1 141 196 400 47 33 184 24 209 8 4597 889 Spain
525 4299 1761 1539 2599 1497 1497 3.9 395 5.0 4.7 6.0 5.1 7.8 148 196 403 50 38 188 25 214 8 4734 847 EU-12
502 4274 1769 1541 2621 1505 1501 3.9 368 4.9 4.5 5.3 4.6 6.8 136 198 411 48 35 185 22 212 8 4694 884 Belgium
537 4110 1732 1521 2555 1505 1483 3.8 329 4.8 4.6 5.7 4.8 7.4 138 215 386 47 34 168 23 194 2 4277 871 Netherlands
513 4292 1769 1550 2620 1501 1501 3.9 371 5.0 4.7 5.9 5.0 7.5 147 205 413 48 38 175 23 201 4 4656 918 Austria
488 – – – 2676 1521 1525 4.1 411 5.0 4.8 6.3 5.2 8.2 156 199 357 46 34 181 24 205 3 4154 887 Sweden
473 4221 1753 1505 2587 1504 1501 3.9 358 4.9 4.7 5.1 4.4 6.5 130 208 449 52 43 171 21 197 6 4671 909 Portugal
476 4161 1746 1518 2568 1490 1490 3.8 343 4.9 4.6 5.5 4.6 7.0 136 211 383 45 35 184 23 209 6 3944 842 Denmark
473 – – – 2518 1490 1488 3.7 340 4.8 4.5 6.1 5.1 7.9 145 169 383 49 41 222 25 246 7 3806 836 Greece
522 4433 1785 1529 2652 1518 1523 4.0 420 5.1 4.8 6.2 5.1 7.9 151 194 373 50 33 171 27 195 4 3948 908 Finland
506 – – – 2611 1512 1511 3.9 400 5.0 4.6 5.3 4.5 6.7 133 191 415 49 39 175 20 200 8 4521 901 Ireland
493 – – – 2629 1499 1496 3.9 346 4.9 4.4 5.8 4.9 7.4 147 222 421 49 43 182 29 210 7 4567 899 Luxembourg
548 4296 1768 1540 2595 1470 1503 3.9 399 5.0 4.5 5.7 4.8 7.4 142 202 388 46 39 148 27 176 1 3337 1014 VW
499 4179 1757 1530 2611 1508 1503 3.9 369 5.0 4.5 5.4 4.7 6.9 136 286 382 60 – 212 25 240 12 5684 825 Renault
508 4220 1784 1529 2589 1505 1496 3.9 360 5.0 4.5 5.7 4.6 7.3 139 185 401 71 – 210 32 234 10 5327 1075 Ford
468 4125 1758 1526 2560 1488 1483 3.8 324 4.9 4.6 5.3 4.4 6.9 133 170 409 47 38 184 27 212 8 4657 877 Peugeot
470 3815 1658 1538 2417 1431 1426 3.4 283 4.5 4.4 5.4 4.5 6.9 129 256 393 44 – 182 21 215 9 3582 593 Fiat
511 4124 1753 1570 2565 1475 1477 3.8 332 5.0 4.7 5.4 4.6 6.9 133 186 403 49 52 205 28 228 9 5313 956 Citroën
485 4290 1771 1533 2618 1508 1512 4.0 393 5.2 4.6 5.8 4.8 7.5 141 164 412 45 33 176 25 195 4 6103 1153 Opel
530 4564 1823 1454 2726 1559 1542 4.2 419 4.8 4.3 6.2 5.1 8.0 156 185 405 44 39 148 29 172 1 4296 874 Audi
482 4553 1819 1475 2785 1519 1541 4.3 406 4.8 4.3 6.0 5.0 7.7 153 258 242 54 35 153 31 182 1 2562 776 BMW
520 4489 1803 1541 2768 1556 1558 4.3 481 4.9 4.3 6.8 5.6 8.9 171 169 352 47 38 177 17 200 4 3926 1094 Mercedes-Benz
445 4034 1728 1537 2523 1490 1484 3.7 290 4.9 4.7 5.4 4.7 6.7 129 213 305 47 – 180 20 199 11 3366 816 Toyota
547 4368 1724 1515 2554 1502 1486 3.8 495 5.0 5.0 5.7 4.8 7.3 141 201 356 38 – 167 21 198 5 3384 821 Škoda
486 4164 1735 1587 2593 1502 1502 3.9 323 5.3 4.9 6.1 5.3 7.6 151 175 445 46 – 196 26 217 16 4326 937 Nissan
463 4087 1730 1552 2561 1482 1476 3.8 291 5.1 4.9 5.6 4.9 7.0 138 210 359 34 – 179 24 209 9 4138 704 Hyundai
520 4231 1716 1472 2533 1490 1478 3.7 351 5.0 4.6 5.4 4.5 7.0 134 189 402 39 43 164 19 188 5 4191 1138 Seat
493 4167 1779 1586 2659 1468 1462 3.9 428 5.1 4.9 6.2 5.3 7.9 149 247 430 57 – 203 27 233 16 6991 673 Dacia
456 4153 1749 1553 2580 1475 1467 3.8 272 5.0 4.9 5.8 5.0 7.1 141 192 429 45 – 182 30 211 10 4743 812 Kia
523 4319 1776 1522 2624 1486 1489 3.9 289 5.2 4.6 6.0 4.9 7.9 143 – – – – – – – – – – Vauxhall
555 4624 1836 1553 2737 1569 1561 4.3 429 5.0 4.6 6.2 5.1 8.2 161 202 322 38 – 195 26 216 1 4117 836 Volvo
409 3813 1679 1553 2402 1439 1442 3.5 185 4.6 4.6 5.8 5.0 7.3 139 234 462 42 29 194 6 221 11 3701 706 Suzuki
Tota
l new
sal
es/r
egis
trat
ions
Tota
l new
sal
es/r
egis
trat
ions
[%
]
Pri
ce [
EU
R in
cl. t
ax]
Top
sp
eed
[km
/h]
Die
sel [
%]
Hyb
rid
exc
l. P
HE
V [
%]
Nat
ural
gas
(m
ono
-/b
ival
ent,
incl
. LP
G)
[%]
Flex
-Fue
l (et
hano
l/g
aso
line)
[%
]
Ele
ctri
c/fu
el c
ell i
ncl.
PH
EV
[%
]
Aut
om
atic
[%
]
Fro
nt d
rive
[%
]
Rea
r d
rive
[%
]
4-w
heel
dri
ve [
%]
Eng
ine
pow
er [
KW
]
Eng
ine
size
[cc
m]
Num
ber
of
cylin
der
s
Co
mp
ress
ion
rate
(g
aso
line)
Co
mp
ress
ion
rate
(d
iese
l)
Num
ber
of
gea
rs
Per
form
ance
0–1
00
km
/h (
gas
olin
e) [
s]
Per
form
ance
0–1
00
km
/h (
die
sel)
[s]
Mas
s in
run
ning
ord
er [
kg]
Gro
ss w
eig
ht [
kg]
Pay
load
[kg
]
Leng
th [
mm
]
Wid
th [
mm
]
Hei
ght
[m
m]
Whe
elb
ase
[mm
]
Fro
nt t
rack
[m
m]
Rea
r tr
ack
[mm
]
Foo
tpri
nt [
m2 ]
Bo
ot
volu
me
[l]
Seat
s
Do
ors
Fuel
co
nsum
pti
on
(NE
DC
) [l
/10
0 k
m]
Fuel
co
nsum
pti
on
(ext
ra-u
rban
) [l
/10
0 k
m]
Fuel
co
nsum
pti
on
(urb
an)
[l/1
00
km
]
CO
2 (N
ED
C)
[g/k
m]
CO
(d
iese
l veh
icle
s) [
mg
/km
]
CO
(g
aso
line
vehi
cles
) [m
g/k
m]
HC
(g
aso
line
vehi
cles
) [m
g/k
m]
NH
MC
(g
aso
line
Eur
o 5
/6 v
ehic
les)
[m
g/k
m]
NO
x (d
iese
l veh
icle
s) [
mg
/km
]
NO
x (g
aso
line
vehi
cles
) [m
g/k
m]
HC
+ N
Ox (
die
sel v
ehic
les)
[m
g/k
m]
Par
ticu
late
s (d
iese
l veh
icle
s) [
mg
/km
]
CO
at
-7 °
C (
gas
olin
e ve
hicl
es)
[mg
/km
]
HC
at
-7 °
C (
gas
olin
e ve
hicl
es)
[mg
/km
]
Dir
ect
inje
ctio
n (n
on-
die
sel)
[%
]
Eur
o 5
and
Eur
o 6
[%
]
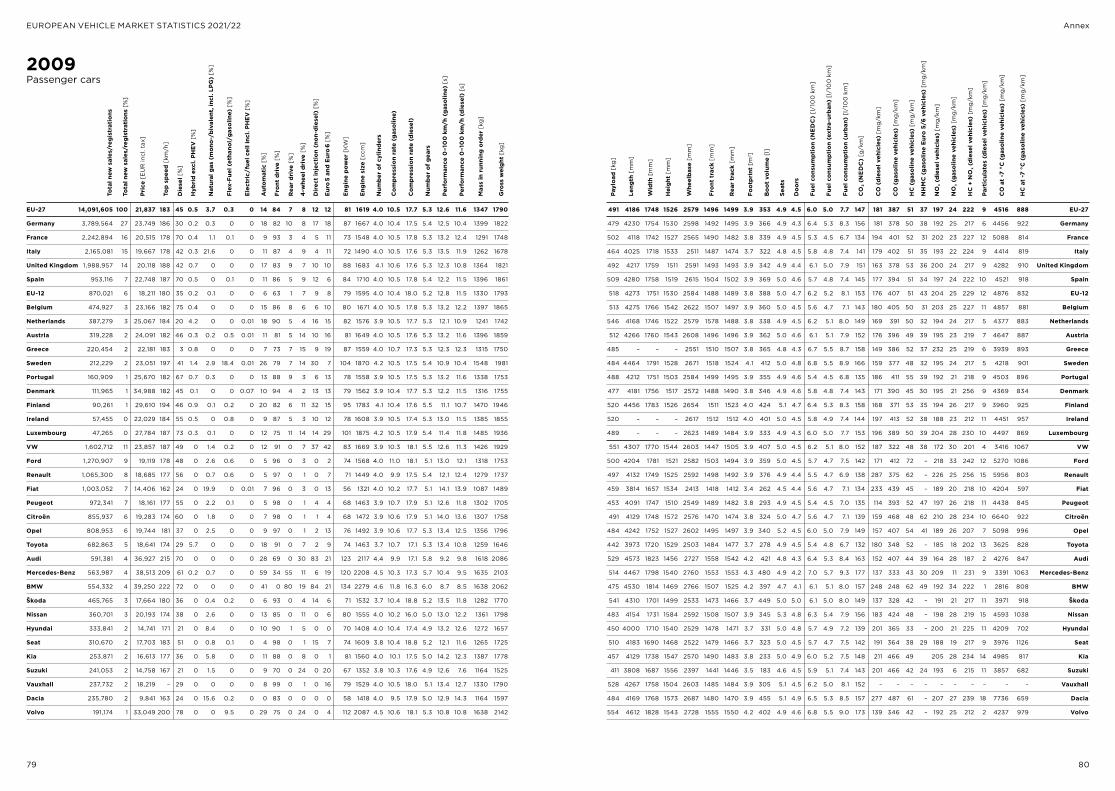
79 80
EUROPEAN VEHICLE MARKET STATISTICS 2021/22 Annex
2009Passenger cars
EU-27 14,091,605 100 21,837 183 45 0.5 3.7 0.3 0 14 84 7 8 12 12 81 1619 4.0 10.5 17.7 5.3 12.6 11.6 1347 1790
Germany 3,789,564 27 23,749 186 30 0.2 0.3 0 0 18 82 10 8 17 18 87 1667 4.0 10.4 17.5 5.4 12.5 10.4 1399 1822
France 2,242,894 16 20,515 178 70 0.4 1.1 0.1 0 9 93 3 4 5 11 73 1548 4.0 10.5 17.8 5.3 13.2 12.4 1291 1748
Italy 2,165,081 15 19,667 178 42 0.3 21.6 0 0 11 87 4 9 4 11 72 1490 4.0 10.5 17.6 5.3 13.5 11.9 1262 1678
United Kingdom 1,988,957 14 20,118 188 42 0.7 0 0 0 17 83 9 7 10 10 88 1683 4.1 10.6 17.6 5.3 12.3 10.8 1364 1821
Spain 953,116 7 22,748 187 70 0.5 0 0.1 0 11 86 5 9 12 6 84 1710 4.0 10.5 17.8 5.4 12.2 11.5 1396 1861
EU-12 870,021 6 18,211 180 35 0.2 0.1 0 0 6 63 1 7 9 8 79 1595 4.0 10.4 18.0 5.2 12.8 11.5 1330 1793
Belgium 474,927 3 23,166 182 75 0.4 0 0 0 15 86 8 6 6 10 80 1671 4.0 10.5 17.8 5.3 13.2 12.2 1397 1865
Netherlands 387,279 3 25,067 184 20 4.2 0 0 0.01 18 90 5 4 16 15 82 1576 3.9 10.5 17.7 5.3 12.1 10.9 1241 1742
Austria 319,228 2 24,091 182 46 0.3 0.2 0.5 0.01 11 81 5 14 10 16 81 1649 4.0 10.5 17.6 5.3 13.2 11.6 1396 1859
Greece 220,454 2 22,181 183 3 0.8 0 0 0 7 73 7 15 9 19 87 1559 4.0 10.7 17.3 5.3 12.3 12.3 1315 1750
Sweden 212,229 2 23,051 197 41 1.4 2.9 18.4 0.01 26 79 7 14 30 7 104 1870 4.2 10.5 17.5 5.4 10.9 10.4 1548 1981
Portugal 160,909 1 25,670 182 67 0.7 0.3 0 0 13 88 9 3 6 13 78 1558 3.9 10.5 17.5 5.3 13.2 11.6 1338 1753
Denmark 111,965 1 34,988 182 45 0.1 0 0 0.07 10 94 4 2 13 13 79 1562 3.9 10.4 17.7 5.3 12.2 11.5 1316 1755
Finland 90,261 1 29,610 194 46 0.9 0.1 0.2 0 20 82 6 11 32 15 95 1783 4.1 10.4 17.6 5.5 11.1 10.7 1470 1946
Ireland 57,455 0 22,029 184 55 0.5 0 0.8 0 9 87 5 3 10 12 78 1608 3.9 10.5 17.4 5.3 13.0 11.5 1385 1855
Luxembourg 47,265 0 27,784 187 73 0.3 0.1 0 0 12 75 11 14 14 29 101 1875 4.2 10.5 17.9 5.4 11.4 11.8 1485 1936
VW 1,602,712 11 23,857 187 49 0 1.4 0.2 0 12 91 0 7 37 42 83 1669 3.9 10.3 18.1 5.5 12.6 11.3 1426 1929
Ford 1,270,907 9 19,119 178 48 0 2.6 0.6 0 5 96 0 3 0 2 74 1568 4.0 11.0 18.1 5.1 13.0 12.1 1318 1753
Renault 1,065,300 8 18,685 177 56 0 0.7 0.6 0 5 97 0 1 0 7 71 1449 4.0 9.9 17.5 5.4 12.1 12.4 1279 1737
Fiat 1,003,052 7 14,406 162 24 0 19.9 0 0.01 7 96 0 3 0 13 56 1321 4.0 10.2 17.7 5.1 14.1 13.9 1087 1489
Peugeot 972,341 7 18,161 177 55 0 2.2 0.1 0 5 98 0 1 4 4 68 1463 3.9 10.7 17.9 5.1 12.6 11.8 1302 1705
Citroën 855,937 6 19,283 174 60 0 1.8 0 0 7 98 0 1 1 4 68 1472 3.9 10.6 17.9 5.1 14.0 13.6 1307 1758
Opel 808,953 6 19,744 181 37 0 2.5 0 0 9 97 0 1 2 13 76 1492 3.9 10.6 17.7 5.3 13.4 12.5 1356 1796
Toyota 682,863 5 18,641 174 29 5.7 0 0 0 18 91 0 7 2 9 74 1463 3.7 10.7 17.1 5.3 13.4 10.8 1259 1646
Audi 591,381 4 36,927 215 70 0 0 0 0 28 69 0 30 83 21 123 2117 4.4 9.9 17.1 5.8 9.2 9.8 1618 2086
Mercedes-Benz 563,987 4 38,513 209 61 0.2 0.7 0 0 59 34 55 11 6 19 120 2208 4.5 10.3 17.3 5.7 10.4 9.5 1635 2103
BMW 554,332 4 39,250 222 72 0 0 0 0 41 0 80 19 84 21 134 2279 4.6 11.8 16.3 6.0 8.7 8.5 1638 2062
Škoda 465,765 3 17,664 180 36 0 0.4 0.2 0 6 93 0 4 14 6 71 1532 3.7 10.4 18.8 5.2 13.5 11.8 1282 1770
Nissan 360,701 3 20,193 174 38 0 2.6 0 0 13 85 0 11 0 6 80 1555 4.0 10.2 16.0 5.0 13.0 12.2 1361 1798
Hyundai 333,841 2 14,741 171 21 0 8.4 0 0 10 90 1 5 0 0 70 1408 4.0 10.4 17.4 4.9 13.2 12.6 1272 1657
Seat 310,670 2 17,703 183 51 0 0.8 0.1 0 4 98 0 1 15 7 74 1609 3.8 10.4 18.8 5.2 12.1 11.6 1265 1725
Kia 253,871 2 16,613 177 36 0 5.8 0 0 11 88 0 8 0 1 81 1560 4.0 10.1 17.5 5.0 14.2 12.3 1387 1778
Suzuki 241,053 2 14,758 167 21 0 1.5 0 0 9 70 0 24 0 20 67 1352 3.8 10.3 17.6 4.9 12.6 7.6 1164 1525
Vauxhall 237,732 2 18,219 – 29 0 0 0 0 8 99 0 1 0 16 79 1529 4.0 10.5 18.0 5.1 13.4 12.7 1330 1790
Dacia 235,780 2 9,841 163 24 0 15.6 0.2 0 0 83 0 0 0 0 58 1418 4.0 9.5 17.9 5.0 12.9 14.3 1164 1597
Volvo 191,174 1 33,049 200 78 0 0 9.5 0 29 75 0 24 0 4 112 2087 4.5 10.6 18.1 5.3 10.8 10.8 1638 2142
491 4186 1748 1526 2579 1496 1499 3.9 353 4.9 4.5 6.0 5.0 7.7 147 181 387 51 37 197 24 222 9 4516 888 EU-27
479 4230 1754 1530 2598 1492 1495 3.9 366 4.9 4.3 6.4 5.3 8.3 156 181 378 50 38 192 25 217 6 4456 922 Germany
502 4118 1742 1527 2565 1490 1482 3.8 339 4.9 4.5 5.3 4.5 6.7 134 194 401 52 31 202 23 227 12 5088 814 France
464 4025 1718 1533 2511 1487 1474 3.7 322 4.8 4.5 5.8 4.8 7.4 141 179 402 51 35 193 22 224 9 4414 819 Italy
492 4217 1759 1511 2591 1493 1493 3.9 342 4.9 4.4 6.1 5.0 7.9 151 163 378 53 36 200 24 217 9 4282 910 United Kingdom
509 4280 1758 1519 2615 1504 1502 3.9 369 5.0 4.6 5.7 4.8 7.4 145 177 394 51 34 197 24 222 10 4521 918 Spain
518 4273 1751 1530 2584 1488 1489 3.8 388 5.0 4.7 6.2 5.2 8.1 153 176 407 51 43 204 25 229 12 4876 832 EU-12
513 4275 1766 1542 2622 1507 1497 3.9 360 5.0 4.5 5.6 4.7 7.1 143 180 405 50 31 203 25 227 11 4857 881 Belgium
546 4168 1746 1522 2579 1578 1488 3.8 338 4.9 4.5 6.2 5.1 8.0 149 169 391 50 32 194 24 217 5 4377 883 Netherlands
512 4266 1760 1543 2608 1496 1496 3.9 362 5.0 4.6 6.1 5.1 7.9 152 176 396 49 39 195 23 219 7 4647 887 Austria
485 – – – 2551 1510 1507 3.8 365 4.8 4.3 6.7 5.5 8.7 158 149 386 52 37 232 25 219 6 3939 893 Greece
484 4464 1791 1528 2671 1518 1524 4.1 412 5.0 4.8 6.8 5.5 8.9 166 159 377 48 32 195 24 217 5 4218 901 Sweden
488 4212 1751 1503 2584 1499 1495 3.9 355 4.9 4.6 5.4 4.5 6.8 135 186 411 55 39 192 21 218 9 4503 896 Portugal
477 4181 1756 1517 2572 1488 1490 3.8 346 4.9 4.6 5.8 4.8 7.4 143 171 390 45 30 195 21 256 9 4369 834 Denmark
520 4456 1783 1526 2654 1511 1523 4.0 424 5.1 4.7 6.4 5.3 8.3 158 168 371 53 35 194 26 217 9 3960 925 Finland
520 – – – 2617 1512 1512 4.0 401 5.0 4.5 5.8 4.9 7.4 144 197 413 52 38 188 23 212 11 4451 957 Ireland
489 – – – 2623 1489 1484 3.9 333 4.9 4.3 6.0 5.0 7.7 153 196 389 50 39 204 28 230 10 4497 869 Luxembourg
551 4307 1770 1544 2603 1447 1505 3.9 407 5.0 4.5 6.2 5.1 8.0 152 187 322 48 38 172 30 201 4 3416 1067 VW
500 4204 1781 1521 2582 1503 1494 3.9 359 5.0 4.5 5.7 4.7 7.5 142 171 412 72 – 218 33 242 12 5270 1086 Ford
497 4132 1749 1525 2592 1498 1492 3.9 376 4.9 4.4 5.5 4.7 6.9 138 287 375 62 – 226 25 256 15 5956 803 Renault
459 3814 1657 1534 2413 1418 1412 3.4 262 4.5 4.4 5.6 4.7 7.1 134 233 439 45 – 189 20 218 10 4204 597 Fiat
453 4091 1747 1510 2549 1489 1482 3.8 293 4.9 4.5 5.4 4.5 7.0 135 114 393 52 47 197 26 218 11 4438 845 Peugeot
491 4129 1748 1572 2576 1470 1474 3.8 324 5.0 4.7 5.6 4.7 7.1 139 159 468 48 62 210 28 234 10 6640 922 Citroën
484 4242 1752 1527 2602 1495 1497 3.9 340 5.2 4.5 6.0 5.0 7.9 149 157 407 54 41 189 26 207 7 5098 996 Opel
442 3973 1720 1529 2503 1484 1477 3.7 278 4.9 4.5 5.4 4.8 6.7 132 180 348 52 – 185 18 202 13 3625 828 Toyota
529 4573 1823 1456 2727 1558 1542 4.2 421 4.8 4.3 6.4 5.3 8.4 163 152 407 44 39 164 28 187 2 4276 847 Audi
514 4467 1798 1540 2760 1553 1553 4.3 480 4.9 4.2 7.0 5.7 9.3 177 137 333 43 30 209 11 231 9 3391 1063 Mercedes-Benz
475 4530 1814 1469 2766 1507 1525 4.2 397 4.7 4.1 6.1 5.1 8.0 157 248 248 62 49 192 34 222 1 2816 808 BMW
541 4310 1701 1499 2533 1473 1466 3.7 449 5.0 5.0 6.1 5.0 8.0 149 137 328 42 – 191 21 217 11 3971 918 Škoda
483 4154 1731 1584 2592 1508 1507 3.9 345 5.3 4.8 6.3 5.4 7.9 156 183 424 48 – 198 28 219 15 4593 1038 Nissan
450 4000 1710 1540 2529 1478 1471 3.7 331 5.0 4.8 5.7 4.9 7.2 139 201 365 33 – 200 21 225 11 4209 702 Hyundai
510 4183 1690 1468 2522 1479 1466 3.7 323 5.0 4.5 5.7 4.7 7.5 142 191 364 38 29 188 19 217 9 3976 1126 Seat
457 4129 1738 1547 2570 1490 1483 3.8 233 5.0 4.9 6.0 5.2 7.5 148 211 466 49 205 28 234 14 4985 817 Kia
411 3808 1687 1556 2397 1441 1446 3.5 183 4.6 4.5 5.9 5.1 7.4 143 201 466 42 24 193 6 215 11 3857 682 Suzuki
528 4267 1758 1504 2603 1485 1484 3.9 305 5.1 4.5 6.2 5.0 8.1 152 – – – – – – – – – – Vauxhall
484 4169 1768 1573 2687 1480 1470 3.9 455 5.1 4.9 6.5 5.3 8.5 157 277 487 61 – 207 27 239 18 7736 659 Dacia
554 4612 1828 1543 2728 1555 1550 4.2 402 4.9 4.6 6.8 5.5 9.0 173 139 346 42 – 192 25 212 2 4237 979 Volvo
Tota
l new
sal
es/r
egis
trat
ions
Tota
l new
sal
es/r
egis
trat
ions
[%
]
Pri
ce [
EU
R in
cl. t
ax]
Top
sp
eed
[km
/h]
Die
sel [
%]
Hyb
rid
exc
l. P
HE
V [
%]
Nat
ural
gas
(m
ono
-/b
ival
ent,
incl
. LP
G)
[%]
Flex
-Fue
l (et
hano
l/g
aso
line)
[%
]
Ele
ctri
c/fu
el c
ell i
ncl.
PH
EV
[%
]
Aut
om
atic
[%
]
Fro
nt d
rive
[%
]
Rea
r d
rive
[%
]
4-w
heel
dri
ve [
%]
Eng
ine
pow
er [
KW
]
Eng
ine
size
[cc
m]
Num
ber
of
cylin
der
s
Co
mp
ress
ion
rate
(g
aso
line)
Co
mp
ress
ion
rate
(d
iese
l)
Num
ber
of
gea
rs
Per
form
ance
0–1
00
km
/h (
gas
olin
e) [
s]
Per
form
ance
0–1
00
km
/h (
die
sel)
[s]
Mas
s in
run
ning
ord
er [
kg]
Gro
ss w
eig
ht [
kg]
Pay
load
[kg
]
Leng
th [
mm
]
Wid
th [
mm
]
Hei
ght
[m
m]
Whe
elb
ase
[mm
]
Fro
nt t
rack
[m
m]
Rea
r tr
ack
[mm
]
Foo
tpri
nt [
m2 ]
Bo
ot
volu
me
[l]
Seat
s
Do
ors
Fuel
co
nsum
pti
on
(NE
DC
) [l
/10
0 k
m]
Fuel
co
nsum
pti
on
(ext
ra-u
rban
) [l
/10
0 k
m]
Fuel
co
nsum
pti
on
(urb
an)
[l/1
00
km
]
CO
2 (N
ED
C)
[g/k
m]
CO
(d
iese
l veh
icle
s) [
mg
/km
]
CO
(g
aso
line
vehi
cles
) [m
g/k
m]
HC
(g
aso
line
vehi
cles
) [m
g/k
m]
NH
MC
(g
aso
line
Eur
o 5
/6 v
ehic
les)
[m
g/k
m]
NO
x (d
iese
l veh
icle
s) [
mg
/km
]
NO
x (g
aso
line
vehi
cles
) [m
g/k
m]
HC
+ N
Ox (
die
sel v
ehic
les)
[m
g/k
m]
Par
ticu
late
s (d
iese
l veh
icle
s) [
mg
/km
]
CO
at
-7 °
C (
gas
olin
e ve
hicl
es)
[mg
/km
]
HC
at
-7 °
C (
gas
olin
e ve
hicl
es)
[mg
/km
]
Dir
ect
inje
ctio
n (n
on-
die
sel)
[%
]
Eur
o 5
and
Eur
o 6
[%
]

81 82
EUROPEAN VEHICLE MARKET STATISTICS 2021/22 Annex
2008Passenger cars
Tota
l new
sal
es/r
egis
trat
ions
Tota
l new
sal
es/r
egis
trat
ions
[%
]
Pri
ce [
EU
R in
cl. t
ax]
Top
sp
eed
[km
/h]
Die
sel [
%]
Hyb
rid
exc
l. P
HE
V [
%]
Nat
ural
gas
(m
ono
-/b
ival
ent,
incl
. LP
G)
[%]
Flex
-Fue
l (et
hano
l/g
aso
line)
[%
]
Ele
ctri
c/fu
el c
ell i
ncl.
PH
EV
[%
]
Aut
om
atic
[%
]
Fro
nt d
rive
[%
]
Rea
r d
rive
[%
]
4-w
heel
dri
ve [
%]
Eng
ine
pow
er [
KW
]
Eng
ine
size
[cc
m]
Num
ber
of
cylin
der
s
Co
mp
ress
ion
rate
(g
aso
line)
Co
mp
ress
ion
rate
(d
iese
l)
Num
ber
of
gea
rs
Per
form
ance
0–1
00
km
/h (
gas
olin
e) [
s]
Per
form
ance
0–1
00
km
/h (
die
sel)
[s]
Mas
s in
run
ning
ord
er [
kg]
Gro
ss w
eig
ht [
kg]
EU-27 14,338,100 100 23,147 185 52 0.5 1.2 0.4 0 13 81 8 9 11 1 85 1696 4.1 10.5 17.9 5.3 12.3 11.5 1375 1827
Germany 3,088,289 22 27,108 192 44 0.2 0.4 0 0 21 74 15 11 17 2 96 1842 4.2 10.5 17.8 5.4 11.9 10.4 1474 1914
Italy 2,174,323 15 20,403 177 51 0.2 7.1 0 0 6 84 5 10 3 4 75 1548 4.0 10.4 17.8 5.2 13.5 11.9 1287 1696
United Kingdom 2,130,857 15 21,937 191 43 0.7 0 0 0.01 17 83 9 8 11 0 90 1745 4.1 10.5 17.8 5.3 11.9 10.8 1383 1854
France 2,050,283 14 21,426 180 77 0.4 0.1 0.2 0 9 92 4 5 5 1 76 1611 4.0 10.4 17.9 5.3 12.6 12.3 1327 1790
EU-12 1,175,625 8 17,690 177 36 0.2 0 0 0 6 57 2 6 5 1 78 1599 4.0 10.4 18.1 5.2 13.1 11.7 1325 1779
Spain 1,161,176 8 23,018 188 69 0.3 0 0.1 0 9 84 6 10 10 0 86 1747 4.1 10.5 17.9 5.3 12.0 11.5 1402 1866
Belgium 535,693 4 23,465 183 79 0.4 0 0 0 9 85 9 6 4 0 81 1709 4.0 10.4 18.0 5.3 13.2 12.4 1394 1886
Netherlands 499,952 3 25,877 184 25 2.4 0 0.1 0 16 89 5 5 11 0 83 1640 4.0 10.5 18.0 5.2 12.1 11.2 1273 1780
Austria 293,696 2 25,765 183 55 0.2 0.3 0.2 0 12 79 5 16 12 1 84 1731 4.0 10.5 17.9 5.3 13.0 11.8 1450 1912
Greece 267,215 2 21,011 180 4 0.9 0 0 0 6 75 7 14 9 2 82 1536 4.0 10.6 17.6 5.1 12.7 13.0 1283 1713
Sweden 253,923 2 25,036 197 36 1.6 0.5 21.5 0 22 80 6 13 22 0 103 1905 4.2 10.5 17.6 5.3 11.1 10.4 1534 1965
Portugal 213,374 1 25,597 182 69 0.8 0 0 0 8 89 8 2 6 1 76 1552 3.9 10.4 17.9 5.3 13.4 11.8 1341 1772
Ireland 151,616 1 23,066 184 34 0.8 0 1.8 0 13 86 7 6 12 1 81 1622 4.0 10.5 17.6 5.2 12.7 11.7 1394 1866
Denmark 150,649 1 36,211 183 47 0 0 0 0 7 93 4 2 15 0 79 1598 3.9 10.3 18.0 5.3 12.1 11.7 1292 1730
Finland 139,070 1 29,352 193 49 0.6 0 0 0 17 83 5 11 23 0 93 1812 4.1 10.5 17.9 5.3 11.2 11.0 1459 1922
Luxembourg 52,359 0 28,528 186 77 0.3 0.1 0 0 14 73 13 13 17 1 102 1939 4.3 10.5 18.0 5.3 11.2 12.1 1502 1964
VW 1,522,934 11 24,531 185 62 0 1.3 0.1 0 7 88 0 9 26 4 84 1752 3.9 10.3 18.7 5.5 12.8 11.6 1457 1972
Ford 1,210,227 8 19,838 182 54 0 0.4 0.9 0 5 96 0 2 0 0 76 1632 4.0 10.8 18.1 5.1 12.6 12.3 1358 1838
Renault 1,086,734 8 19,313 177 61 0 0.9 0.2 0 5 96 0 1 0 0 72 1490 4.0 9.9 17.7 5.4 12.1 12.3 1290 1772
Peugeot 987,494 7 18,948 181 58 0 0 0.2 0 5 97 0 1 5 0 71 1512 3.9 10.7 17.9 5.1 12.3 11.9 1334 1730
Fiat 942,131 7 14,921 166 37 0 7.5 0 0.01 2 94 0 4 0 11 60 1373 4.0 10.3 17.7 5.1 13.9 13.7 1115 1500
Citroën 843,808 6 19,858 175 61 0 0.4 0.2 0 11 98 0 1 0 0 70 1500 3.9 10.6 17.9 5.2 13.8 12.9 1309 1761
Opel 834,346 6 20,183 180 45 0 1.1 0 0 6 95 0 2 2 1 75 1514 4.0 10.6 18.0 5.3 13.2 12.9 1355 1791
Toyota 725,866 5 19,679 177 37 5.3 0 0 0 11 87 0 11 1 0 76 1555 3.8 10.6 17.3 5.2 12.7 10.7 1285 1693
Mercedes-Benz 667,323 5 39,538 209 62 0 0.4 0 0 52 33 56 10 1 0 121 2261 4.5 10.3 17.7 5.8 10.1 9.7 1632 2094
BMW 656,588 5 39,893 224 72 0 0 0 0 35 0 80 19 75 1 138 2307 4.7 11.8 16.2 6.0 8.6 8.2 1636 2070
Audi 639,726 4 37,268 216 73 0 0 0 0 29 75 0 23 78 2 124 2201 4.6 10.0 17.4 5.8 8.9 9.8 1607 2079
Škoda 434,116 3 17,801 180 46 0 0.5 0.5 0 4 90 0 3 9 1 72 1594 3.7 10.5 18.9 5.2 13.5 11.8 1297 1783
Seat 329,866 2 17,986 185 57 0 0.7 0.1 0 1 97 0 1 12 0 75 1651 3.8 10.4 19.1 5.1 12.1 12.1 1303 1765
Nissan 328,497 2 21,003 174 40 0 0 0 0 14 78 0 16 0 0 82 1617 4.0 10.2 16.3 5.0 12.5 12.2 1377 1804
Vauxhall 298,925 2 18,580 – 32 0 0 0 0 9 99 0 1 0 0 80 1556 4.0 10.5 17.9 5.2 13.0 11.9 1323 1799
Hyundai 262,857 2 16,393 170 31 0 0 0 0 10 83 1 9 0 0 73 1485 4.0 10.2 17.5 5.0 13.1 11.9 1301 1723
Suzuki 239,687 2 16,205 170 29 0 0 0 0 6 55 0 32 0 0 73 1471 4.0 9.9 17.6 4.9 11.4 7.9 1229 1613
Kia 228,877 2 18,366 178 44 0 2.3 0 0 10 84 0 11 0 1 85 1648 4.0 10.1 17.6 5.0 13.8 11.8 1422 1849
Volvo 208,918 1 34,369 205 68 0 0 11.7 0 25 81 0 18 0 0 112 2114 4.5 10.5 17.9 5.5 10.6 10.3 1611 2094
Dacia 183,716 1 9,894 164 40 0 0.6 0 0 0 59 0 0 0 0 59 1466 4.0 9.6 17.9 5.0 12.7 14.5 1160 1654
499 4228 1754 1525 2596 1509 1505 3.9 359 4.9 4.5 6.2 5.1 8.0 154 171 405 51 – 204 25 229 11 4814 914 EU-27
490 4319 1771 1531 2633 1524 1506 4.0 386 4.9 4.3 6.7 5.5 8.8 166 155 385 51 – 204 25 229 8 4505 952 Germany
467 4050 1722 1530 2525 1496 1471 3.7 318 4.8 4.5 5.8 4.9 7.5 147 174 446 49 – 204 23 231 12 4930 831 Italy
503 4251 1760 1508 2607 1503 1499 3.9 355 5.0 4.4 6.4 5.2 8.3 158 153 393 52 – 202 26 226 10 4996 958 United Kingdom
503 4164 1747 1529 2586 1492 1485 3.8 348 4.9 4.6 5.5 4.6 6.9 141 189 423 52 – 206 24 230 12 5505 847 France
513 4268 1748 1531 2584 1488 1483 3.8 382 5.0 4.6 6.3 5.2 8.2 155 181 422 50 – 206 25 226 13 5142 865 EU-12
512 4274 1759 1517 2612 1502 1496 3.9 365 5.0 4.5 6.0 5.0 7.7 151 173 400 51 – 202 27 230 11 4830 931 Spain
543 4289 1763 1540 2627 1510 1491 3.9 355 4.9 4.5 5.7 4.8 7.3 148 175 419 50 – 206 25 231 12 5224 900 Belgium
557 4202 1748 1525 2594 1611 1487 3.9 340 4.9 4.5 6.5 5.3 8.4 158 151 410 52 – 203 24 226 8 4714 900 Netherlands
510 4310 1765 1551 2629 1507 1499 3.9 364 5.1 4.6 6.3 5.3 8.2 159 153 385 50 – 209 24 233 10 4782 922 Austria
480 – – – 2537 1498 1494 3.8 333 4.8 4.3 6.8 5.6 8.8 161 143 406 50 – 222 25 227 14 4399 928 Greece
480 4469 1785 1527 2654 1522 1517 4.0 400 5.0 4.8 7.1 5.7 9.4 175 162 399 48 – 203 23 224 6 4302 900 Sweden
490 4220 1748 1501 2587 1496 1492 3.9 354 4.9 4.7 5.4 4.6 6.9 138 173 413 52 – 200 22 222 12 5040 916 Portugal
521 – – – 2626 1517 1513 4.0 403 5.0 4.5 6.4 5.3 8.4 158 170 401 53 – 210 25 247 14 4657 1020 Ireland
486 4189 1764 1510 2568 1491 1485 3.8 341 4.9 4.6 5.9 4.9 7.6 147 172 408 47 – 197 21 224 10 4862 841 Denmark
520 4434 1779 1523 2641 1522 1518 4.0 417 5.0 4.6 6.5 5.4 8.5 164 164 403 51 – 200 27 232 11 4459 927 Finland
494 – – – 2635 1482 1477 3.9 321 4.9 4.4 6.2 5.2 8.1 160 188 405 49 – 213 27 239 13 5252 914 Luxembourg
561 4338 1767 1548 2610 1513 1504 3.9 417 5.0 4.5 6.3 5.3 8.3 160 122 358 51 – 199 28 222 9 3929 1083 VW
520 4290 1792 1515 2624 1522 1512 4.0 397 5.0 4.6 6.0 4.9 7.8 149 186 391 64 – 215 43 242 13 7372 1161 Ford
515 4147 1749 1530 2600 1496 1488 3.9 378 4.9 4.5 5.7 4.9 7.1 143 285 407 62 – 226 28 256 15 6035 854 Renault
445 4126 1753 1501 2564 1488 1481 3.8 292 4.9 4.4 5.5 4.6 7.2 138 92 373 54 – 199 27 217 11 4564 811 Peugeot
460 3871 1668 1530 2432 1426 1420 3.5 273 4.6 4.4 5.6 4.7 7.2 138 216 508 44 – 197 21 226 11 4164 662 Fiat
498 4154 1747 1564 2587 1473 1479 3.8 334 5.0 4.6 5.7 4.8 7.2 143 161 498 47 – 212 25 237 10 7111 868 Citroën
485 4213 1751 1533 2602 1484 1486 3.9 319 5.2 4.5 6.0 5.0 7.8 151 187 401 54 – 202 26 222 10 5028 966 Opel
467 4049 1725 1541 2545 1486 1477 3.8 280 5.0 4.7 5.9 5.1 7.2 144 152 516 51 – 191 15 206 17 4183 873 Toyota
508 4463 1804 1538 2758 1552 1550 4.3 487 4.9 4.3 7.3 5.9 9.8 185 127 325 40 – 220 12 242 11 3265 1057 Mercedes-Benz
487 4544 1815 1474 2770 1502 1515 4.2 400 4.7 4.0 6.3 5.2 8.2 160 278 245 62 – 202 35 236 2 2879 849 BMW
531 4589 1820 1439 2724 1555 1541 4.2 405 4.9 4.1 6.7 5.4 9.0 171 119 399 46 – 186 27 209 6 4051 812 Audi
537 4330 1704 1492 2532 1473 1471 3.7 457 5.0 5.0 6.0 4.9 7.8 150 132 316 45 – 196 23 221 11 3858 968 Škoda
514 4181 1695 1480 2525 1474 1460 3.7 328 5.0 4.6 5.8 4.8 7.6 147 138 394 44 – 194 28 218 14 4895 1094 Seat
473 4171 1735 1590 2585 1500 1498 3.9 327 5.1 4.8 6.5 5.6 8.2 163 201 441 45 – 195 24 219 13 4386 1037 Nissan
540 4250 1751 1504 2607 1492 1490 3.9 324 5.3 4.4 6.2 5.1 8.2 154 – – – – – – – – – – Vauxhall
474 4039 1722 1560 2532 1476 1469 3.7 345 5.0 4.8 6.0 5.1 7.6 147 204 380 33 – 210 18 233 12 4864 645 Hyundai
434 3898 1710 1579 2415 1456 1464 3.5 209 4.8 4.4 6.4 5.5 8.0 157 180 434 45 – 187 10 208 11 4588 734 Suzuki
486 4204 1760 1552 2596 1493 1484 3.9 247 5.1 4.8 6.2 5.2 7.8 153 257 485 47 – 209 25 245 14 4813 812 Kia
532 4618 1818 1507 2722 1561 1556 4.2 431 4.9 4.5 7.1 5.7 9.6 181 145 285 37 – 199 24 221 3 4125 860 Volvo
537 4330 1762 1603 2792 1480 1470 4.1 605 5.2 4.6 6.4 5.3 8.2 156 292 556 61 – 208 28 238 19 8451 723 Dacia
Pay
load
[kg
]
Leng
th [
mm
]
Wid
th [
mm
]
Hei
ght
[m
m]
Whe
elb
ase
[mm
]
Fro
nt t
rack
[m
m]
Rea
r tr
ack
[mm
]
Foo
tpri
nt [
m2 ]
Bo
ot
volu
me
[l]
Seat
s
Do
ors
Fuel
co
nsum
pti
on
(NE
DC
) [l
/10
0 k
m]
Fuel
co
nsum
pti
on
(ext
ra-u
rban
) [l
/10
0 k
m]
Fuel
co
nsum
pti
on
(urb
an)
[l/1
00
km
]
CO
2 (N
ED
C)
[g/k
m]
CO
(d
iese
l veh
icle
s) [
mg
/km
]
CO
(g
aso
line
vehi
cles
) [m
g/k
m]
HC
(g
aso
line
vehi
cles
) [m
g/k
m]
NH
MC
(g
aso
line
Eur
o 5
/6 v
ehic
les)
[m
g/k
m]
NO
x (d
iese
l veh
icle
s) [
mg
/km
]
NO
x (g
aso
line
vehi
cles
) [m
g/k
m]
HC
+ N
Ox (
die
sel v
ehic
les)
[m
g/k
m]
Par
ticu
late
s (d
iese
l veh
icle
s) [
mg
/km
]
CO
at
-7 °
C (
gas
olin
e ve
hicl
es)
[mg
/km
]
HC
at
-7 °
C (
gas
olin
e ve
hicl
es)
[mg
/km
]
Dir
ect
inje
ctio
n (n
on-
die
sel)
[%
]
Eur
o 5
and
Eur
o 6
[%
]

83 84
EUROPEAN VEHICLE MARKET STATISTICS 2021/22 Annex
2007Passenger cars
EU-27 15,596,339 100 23,619 185 53 0.3 0.6 0.3 0 13 80 7 10 4 0 86 1729 4.1 – – – – – 1378 1832
Germany 3,146,578 20 25,970 191 48 0.2 0.3 0 0 19 75 14 11 7 0 96 1869 4.2 – – – – – 1455 1898
Italy 2,512,972 16 19,954 176 56 0.1 2.9 0 0 8 84 5 11 1 1 74 1561 4.0 – – – – – 1285 1701
United Kingdom 2,403,623 15 25,205 191 40 0.7 0 0 0.02 17 82 9 9 4 0 91 1778 4.1 – – – – – 1395 1855
France 2,064,999 13 22,459 182 74 0.3 0.1 0.2 0 9 89 4 7 2 0 80 1680 4.0 – – – – – 1356 1831
Spain 1,614,814 10 23,450 187 71 0.2 0 0.1 0 7 83 6 12 4 0 87 1786 4.1 – – – – – 1420 1885
EU-12 1,211,753 8 18,235 177 38 0.2 0 0 0 6 57 2 7 1 0 76 1602 4.0 – – – – – 1308 1762
Belgium 524,575 3 23,317 182 77 0.2 0.1 0 0 10 85 8 7 2 0 81 1721 4.0 – – – – – 1394 1891
Netherlands 505,539 3 26,426 184 28 0.7 0 0.1 0 15 88 5 7 4 0 85 1703 4.1 – – – – – 1298 1808
Sweden 306,325 2 26,556 199 35 1.1 0.5 12.1 0 23 79 6 15 6 0 106 1965 4.3 – – – – – 1538 1967
Austria 298,181 2 25,712 184 59 0.3 0.1 0 0 11 79 5 16 3 0 85 1770 4.1 – – – – – 1462 1907
Greece 279,733 2 20,229 178 3 0.4 0 0 0 6 77 6 13 4 1 80 1549 4.0 – – – – – 1278 1700
Portugal 201,816 1 27,300 182 69 0.9 0 0 0 11 89 8 3 2 0 77 1560 3.9 – – – – – 1347 1798
Ireland 186,325 1 25,326 182 27 0.6 0 0.4 0 13 85 7 7 3 0 80 1636 4.0 – – – – – 1386 1849
Denmark 162,776 1 38,484 185 40 0 0 0 0 9 92 4 4 4 0 83 1679 4.0 – – – – – 1316 1793
Finland 124,998 1 31,307 194 28 0.1 0 0.1 0 23 82 4 14 6 0 96 1857 4.2 – – – – – 1460 1908
Luxembourg 51,332 0 27,759 187 77 0.2 0.1 0 0 14 75 11 14 12 0 103 1966 4.3 – – – – – 1497 1972
VW 1,580,984 10 23,644 186 62 0 0.6 0 0 6 92 0 5 23 0 83 1767 3.9 – – – – – 1425 1932
Ford 1,286,042 8 19,858 180 52 0 0 0.9 0 4 98 0 0 0 0 75 1621 4.0 – – – – – 1348 1806
Renault 1,195,887 8 19,950 179 58 0 0.3 0.1 0 7 97 0 0 0 0 73 1519 4.0 – – – – – 1294 1786
Peugeot 1,085,098 7 19,142 181 57 0 0 0.1 0 6 98 0 0 0 0 72 1532 3.9 – – – – – 1324 1721
Opel 987,385 6 20,083 180 49 0 1.1 0 0 6 95 0 2 0 0 76 1548 4.0 – – – – – 1352 1792
Fiat 965,966 6 14,875 165 43 0 5.2 0 0 2 92 0 7 0 2 60 1386 4.0 – – – – – 1124 1542
Citroën 928,810 6 19,609 176 59 0 0.3 0.1 0 6 99 0 0 0 0 69 1496 3.9 – – – – – 1286 1737
Toyota 869,130 6 20,502 179 41 3.4 0 0 0 8 85 0 14 0 0 79 1612 3.8 – – – – – 1298 1721
Mercedes-Benz 711,119 5 40,413 207 64 0 0.1 0 0 58 34 54 12 1 0 122 2310 4.6 – – – – – 1646 2101
BMW 684,718 4 40,559 224 71 0 0 0 0 35 0 80 19 35 0 137 2368 4.8 – – – – – 1628 2068
Audi 638,506 4 37,994 215 74 0 0 0 0 26 68 0 30 53 0 126 2247 4.7 – – – – – 1606 2097
Škoda 452,398 3 18,113 181 51 0 0 0.3 0 4 91 0 3 7 0 71 1615 3.7 – – – – – 1288 1784
Seat 380,676 2 18,664 187 62 0 0 0 0 1 98 0 1 5 0 77 1696 3.8 – – – – – 1328 1797
Vauxhall 331,331 2 20,631 28 0 0 0 0 8 100 0 0 0 0 81 1578 4.0 – – – – – 1328 1801
Nissan 301,164 2 21,198 172 36 0 0 0 0 13 77 1 19 0 0 82 1651 4.0 – – – – – 1355 1786
Hyundai 298,606 2 19,847 173 42 0 0 0 0 14 72 1 21 0 0 81 1648 4.0 – – – – – 1401 1851
Suzuki 276,614 2 16,974 170 33 0 0 0 0 7 46 0 42 0 0 75 1522 4.0 – – – – – 1253 1642
Volvo 249,326 2 35,988 207 66 0 0.5 3.8 0 34 80 0 19 0 0 116 2195 4.6 – – – – – 1620 2092
Kia 247,341 2 19,300 172 47 0 0 0 0 12 80 0 17 0 1 85 1701 4.0 – – – – – 1449 1888
Dacia 173,016 1 9,480 162 45 0 0 0 0 0 45 0 0 0 0 57 1470 4.0 – – – – – 1122 1660
503 4233 1759 1524 2595 – – – – 4.9 4.4 6.3 5.2 8.2 159 164 420 51 – 211 25 235 13 4756 918 EU-27
495 4309 1763 1522 2625 – – – – 4.9 4.3 6.8 5.5 8.9 170 140 398 52 – 212 26 236 10 4587 968 Germany
463 4045 1720 1528 2524 – – – – 4.8 4.3 5.8 4.9 7.5 148 175 466 52 – 212 24 236 14 5013 833 Italy
503 4267 1761 1508 2609 – – – – 5.0 4.3 6.6 5.4 8.7 164 143 386 51 – 208 25 232 12 4425 923 United Kingdom
513 4198 1794 1532 2598 – – – – 5.0 4.5 5.8 4.9 7.4 149 181 439 53 – 213 25 238 14 5363 888 France
520 4286 1764 1526 2616 – – – – 5.0 4.5 6.1 5.1 7.9 156 176 410 53 – 212 28 236 14 4805 932 Spain
522 4213 1746 1540 2588 – – – – 5.0 4.5 6.3 5.3 8.3 158 163 463 52 – 209 25 232 15 5218 869 EU-12
552 4282 1761 1539 2625 – – – – 5.0 4.5 5.9 4.9 7.6 153 167 435 51 – 210 27 234 14 5258 918 Belgium
566 4220 1747 1530 2598 – – – – 5.0 4.5 6.7 5.5 8.8 165 151 405 49 – 205 24 227 12 4470 909 Netherlands
477 4475 1783 1519 2683 – – – – 5.0 4.7 7.4 5.9 9.9 183 133 418 48 – 202 24 240 7 3892 913 Sweden
495 4299 1760 1542 2618 – – – – 5.0 4.6 6.4 5.3 8.3 162 154 407 52 – 217 26 224 13 4745 935 Austria
475 – – – 2536 – – – – 4.9 4.3 6.9 5.7 9.1 165 138 417 50 – 226 27 228 14 4785 968 Greece
503 4235 1750 1509 2597 – – – – 5.0 4.7 5.6 4.7 7.2 143 154 415 52 – 207 24 222 13 5386 963 Portugal
511 – – – – – – – – 5.0 4.5 6.7 5.5 8.8 164 141 396 50 – 210 25 249 14 4528 993 Ireland
529 4240 1780 1519 2591 – – – – 5.0 4.6 6.5 5.3 8.5 162 145 412 48 – 200 23 230 13 4832 899 Denmark
504 4435 1772 1526 2638 – – – – 5.1 4.7 7.2 5.9 9.6 178 118 421 49 – 210 25 231 12 3964 903 Finland
504 – – – 2628 – – – – 4.9 4.4 6.4 5.3 8.4 166 186 426 53 – 218 32 244 14 5375 939 Luxembourg
553 4315 1758 1528 2600 – – – – 5.0 4.3 6.4 5.3 8.3 162 113 363 51 – 209 31 231 12 3514 1048 VW
507 4274 1793 1510 2613 – – – – 5.0 4.6 6.0 4.9 7.9 150 187 374 63 – 209 42 236 17 6941 1138 Ford
525 4149 1789 1522 2607 – – – – 5.0 4.5 5.8 5.0 7.4 147 288 430 63 – 230 31 255 15 6183 1004 Renault
452 4125 1763 1490 2566 – – – – 4.8 4.3 5.7 4.7 7.4 142 103 420 48 – 196 24 215 12 5060 755 Peugeot
495 4223 1759 1531 2609 – – – – 5.2 4.5 6.0 5.0 7.8 152 206 385 52 – 203 28 224 10 5053 925 Opel
475 3907 1671 1534 2449 – – – – 4.7 4.4 5.7 4.8 7.3 140 208 546 52 – 205 21 234 13 4874 653 Fiat
499 4133 1747 1561 2581 – – – – 5.0 4.6 5.7 4.8 7.3 143 161 484 47 – 209 25 234 13 6565 816 Citroën
478 4076 1726 1550 2545 – – – – 5.0 4.5 6.0 5.2 7.4 149 157 515 51 – 199 15 216 18 4016 868 Toyota
511 4466 1801 1539 2759 – – – – 4.8 4.2 7.5 6.0 10.1 189 92 343 45 – 236 14 257 12 3195 1119 Mercedes-Benz
494 4550 1817 1472 2773 – – – – 4.8 4.2 6.9 5.5 9.3 176 200 286 62 – 205 31 233 4 3564 981 BMW
545 4567 1813 1445 2682 – – – – 4.9 4.3 7.1 5.7 9.7 184 132 438 51 – 217 28 241 10 3861 968 Audi
548 4322 1717 1485 2538 – – – – 5.0 4.9 5.9 4.9 7.8 150 117 377 49 – 197 28 221 13 3828 1021 Škoda
521 4195 1710 1487 2534 – – – – 5.0 4.6 5.9 4.9 7.7 151 125 405 48 – 209 30 232 18 4641 1085 Seat
538 4270 1753 1501 2616 – – – – 5.2 4.4 6.4 5.2 8.4 157 – – – – – – – – – – Vauxhall
481 4147 1730 1590 2578 – – – – 5.0 4.7 6.7 5.8 8.5 167 207 465 43 – 252 25 286 24 3727 1057 Nissan
503 4161 1738 1604 2562 – – – – 5.0 4.7 6.6 5.5 8.5 164 188 407 34 – 277 18 297 19 4306 700 Hyundai
440 3924 1714 1588 2422 – – – – 4.8 4.3 6.6 5.7 8.3 164 156 416 45 – 192 13 212 11 5420 809 Suzuki
523 4605 1813 1502 2717 – – – – 4.9 4.4 7.4 5.9 10.1 189 155 278 38 – 189 22 211 3 4226 818 Volvo
493 4161 1756 1575 2586 – – – – 5.1 5.0 6.3 5.3 8.0 158 219 458 32 – 260 22 285 24 5420 833 Kia
538 4397 1759 1605 2817 – – – – 5.2 4.4 6.5 5.4 8.5 158 244 568 62 – 211 29 250 14 8354 709 Dacia
Tota
l new
sal
es/r
egis
trat
ions
Tota
l new
sal
es/r
egis
trat
ions
[%
]
Pri
ce [
EU
R in
cl. t
ax]
Top
sp
eed
[km
/h]
Die
sel [
%]
Hyb
rid
exc
l. P
HE
V [
%]
Nat
ural
gas
(m
ono
-/b
ival
ent,
incl
. LP
G)
[%]
Flex
-Fue
l (et
hano
l/g
aso
line)
[%
]
Ele
ctri
c/fu
el c
ell i
ncl.
PH
EV
[%
]
Aut
om
atic
[%
]
Fro
nt d
rive
[%
]
Rea
r d
rive
[%
]
4-w
heel
dri
ve [
%]
Eng
ine
pow
er [
KW
]
Eng
ine
size
[cc
m]
Num
ber
of
cylin
der
s
Co
mp
ress
ion
rate
(g
aso
line)
Co
mp
ress
ion
rate
(d
iese
l)
Num
ber
of
gea
rs
Per
form
ance
0–1
00
km
/h (
gas
olin
e) [
s]
Per
form
ance
0–1
00
km
/h (
die
sel)
[s]
Mas
s in
run
ning
ord
er [
kg]
Gro
ss w
eig
ht [
kg]
Pay
load
[kg
]
Leng
th [
mm
]
Wid
th [
mm
]
Hei
ght
[m
m]
Whe
elb
ase
[mm
]
Fro
nt t
rack
[m
m]
Rea
r tr
ack
[mm
]
Foo
tpri
nt [
m2 ]
Bo
ot
volu
me
[l]
Seat
s
Do
ors
Fuel
co
nsum
pti
on
(NE
DC
) [l
/10
0 k
m]
Fuel
co
nsum
pti
on
(ext
ra-u
rban
) [l
/10
0 k
m]
Fuel
co
nsum
pti
on
(urb
an)
[l/1
00
km
]
CO
2 (N
ED
C)
[g/k
m]
CO
(d
iese
l veh
icle
s) [
mg
/km
]
CO
(g
aso
line
vehi
cles
) [m
g/k
m]
HC
(g
aso
line
vehi
cles
) [m
g/k
m]
NH
MC
(g
aso
line
Eur
o 5
/6 v
ehic
les)
[m
g/k
m]
NO
x (d
iese
l veh
icle
s) [
mg
/km
]
NO
x (g
aso
line
vehi
cles
) [m
g/k
m]
HC
+ N
Ox (
die
sel v
ehic
les)
[m
g/k
m]
Par
ticu
late
s (d
iese
l veh
icle
s) [
mg
/km
]
CO
at
-7 °
C (
gas
olin
e ve
hicl
es)
[mg
/km
]
HC
at
-7 °
C (
gas
olin
e ve
hicl
es)
[mg
/km
]
Dir
ect
inje
ctio
n (n
on-
die
sel)
[%
]
Eur
o 5
and
Eur
o 6
[%
]

85 86
EUROPEAN VEHICLE MARKET STATISTICS 2021/22 Annex
2006Passenger cars
EU-27 15,443,071 100 22,969 184 51 0.2 0.3 0.2 0 12 82 7 9 4 0 84 1730 4.1 – – – – – 1366 1816
Germany 3,466,489 22 24,583 190 44 0.2 0.3 0 0 18 77 13 10 6 0 93.0 1859 4.2 – – – – – 1434 1881
Italy 2,354,141 15 19,826 176 59 0.1 1.1 0 0 8 85 5 10 1 0 74.1 1584 4.0 – – – – – 1297 1714
United Kingdom 2,344,407 15 24,555 189 38 0.4 0 0 0.01 17 82 9 9 3 0 89.0 1775 4.1 – – – – – 1382 1826
France 2,000,563 13 21,599 180 71 0.3 0.2 0 0 8 90 3 6 1 0 77.5 1666 4.0 – – – – – 1334 1796
Spain 1,634,489 11 22,531 186 70 0.1 0 0 0 6 85 5 9 3 0 84.1 1773 4.1 – – – – – 1395 1856
EU-12 1,047,967 7 17,646 175 34 0.1 0 0 0 5 61 2 5 1 0 72.6 1570 4.0 – – – – – 1277 1731
Belgium 526,113 3 22,447 181 74 0.2 0.1 0 0 10 86 8 6 1 0 78.5 1709 4.0 – – – – – 1368 1862
Netherlands 484,010 3 25,714 183 27 0.7 0 0.1 0 14 89 5 6 4 0 82.7 1696 4.1 – – – – – 1281 1789
Austria 308,595 2 25,245 182 62 0.2 0 0 0 11 81 5 14 3 0 82.6 1771 4.1 – – – – – 1452 1896
Sweden 282,475 2 25,879 199 20 1.0 1.3 9.1 0 22 81 6 14 8 0 105.1 1974 4.3 – – – – – 1514 1943
Greece 267,644 2 19,381 177 2 0.2 0 0 0 6 80 5 12 5 0 77.8 1540 4.0 – – – – – 1263 1684
Portugal 194,716 1 26,447 180 65 0.4 0 0 0 11 90 8 3 2 0 74.4 1536 3.9 – – – – – 1323 1768
Ireland 178,483 1 25,295 181 25 0.3 0 0 0 11 85 7 7 3 0 77.6 1623 4.0 – – – – – 1372 1834
Denmark 156,909 1 37,740 184 28 0 0 0 0 8 91 4 5 3 0 81.3 1682 4.0 – – – – – 1293 1776
Finland 145,233 1 29,846 192 20 0.1 0 0 0 20 85 4 11 6 0 92.7 1838 4.1 – – – – – 1423 1862
Luxembourg 50,837 0 26,400 185 77 0.2 0.1 0 0 13 76 11 13 8 0 99.7 1966 4.3 – – – – – 1480 1961
VW 1,640,165 11 22,992 185 60 0 0.3 0 0 5 94 0 4 25 0 81.8 1769 3.9 – – – – – 1412 1920
Renault 1,290,698 8 19,786 178 57 0 0.2 0 0 6 98 0 0 0 0 73.2 1537 4.0 – – – – – 1299 1774
Ford 1,263,774 8 19,241 181 49 0 0 0.7 0 6 99 0 0 0 0 73.9 1613 4.0 – – – – – 1322 1750
Peugeot 1,101,218 7 19,357 181 57 0 0 0 0 7 99 0 0 0 0 72.5 1559 4.0 – – – – – 1303 1716
Opel 1,009,540 7 19,877 181 47 0 0.6 0 0 5 99 0 0 0 0 76.0 1579 4.0 – – – – – 1347 1791
Citroën 903,184 6 18,385 175 54 0 0.1 0 0 4 99 0 0 0 0 66.1 1479 3.9 – – – – – 1231 1662
Fiat 893,934 6 14,335 162 43 0 2.6 0 0 2 92 0 7 0 0 58.4 1380 4.0 – – – – – 1130 1546
Toyota 849,620 6 20,643 179 40 2.5 0 0 0 8 84 0 15 0 0 79.8 1625 3.8 – – – – – 1300 1727
Mercedes-Benz 709,481 5 39,192 207 61 0 0 0 0 56 36 52 11 1 0 119.4 2327 4.7 – – – – – 1630 2078
BMW 663,988 4 38,552 219 67 0 0 0 0 29 0 82 18 2 0 129.7 2307 4.8 – – – – – 1606 2040
Audi 620,511 4 36,372 212 73 0 0 0 0 29 72 0 27 42 0 120.7 2223 4.6 – – – – – 1595 2096
Škoda 439,182 3 17,814 182 48 0 0 0 0 7 92 0 2 12 0 70.7 1620 3.8 – – – – – 1287 1791
Seat 383,985 2 17,903 185 62 0 0 0 0 4 99 0 0 3 0 75.1 1693 3.8 – – – – – 1312 1780
Nissan 321,378 2 20,071 173 29 0 0 0 0 10 78 1 20 0 0 78.2 1668 4.1 – – – – – 1288 1726
Hyundai 315,583 2 19,388 169 40 0 0 0 0 14 72 1 23 0 0 79.6 1675 4.0 – – – – – 1413 1869
Vauxhall 301,686 2 20,382 – 25 0 0 0 0 6 100 0 0 0 0 79.4 1578 4.0 – – – – – 1316 1772
Suzuki 249,985 2 16,842 167 32 0 0 0 0 7 45 0 41 0 0 73.7 1514 4.0 – – – – – 1248 1639
Kia 235,868 2 19,038 168 48 0 0 0 0 15 75 0 23 0 0 80.4 1767 4.0 – – – – – 1469 1898
Volvo 230,494 1 36,582 206 62 0 1.5 3.0 0 33 78 0 21 0 0 116.8 2220 4.7 – – – – – 1639 2115
Dacia 138,285 1 7,782 163 36 0 0 0 0 0 30 0 0 0 0 54.5 1450 4.0 – – – – – 1046 1544
501 4224 1759 1519 2591 – – – – 4.9 4.4 6.4 5.3 8.4 161 178 435 54 – 227 29 253 16 4774 942 EU-27
497 4296 1758 1519 2620 – – – – 4.9 4.4 6.9 5.6 9.1 172 147 411 54 – 220 29 244 13 4585 981 Germany
462 4058 1718 1528 2530 – – – – 4.8 4.4 5.9 4.9 7.6 149 188 474 55 – 230 27 254 18 5030 859 Italy
498 4248 1758 1504 2602 – – – – 5.0 4.4 6.7 5.5 8.9 167 155 422 54 – 225 26 249 14 4530 959 United Kingdom
511 4172 1822 1522 2587 – – – – 5.0 4.5 5.8 4.9 7.5 149 199 445 57 – 227 29 256 16 5577 940 France
519 4265 1753 1519 2608 – – – – 5.0 4.5 6.1 5.1 7.9 156 193 440 57 – 231 32 257 17 4996 947 Spain
520 4169 1733 1524 2573 – – – – 5.0 4.5 6.4 5.2 8.3 157 177 499 59 – 231 36 255 18 4911 884 EU-12
548 4260 1763 1534 2615 – – – – 4.9 4.4 6.0 5.0 7.7 154 178 451 52 – 235 29 260 18 5248 935 Belgium
561 4210 1738 1526 2593 – – – – 5.0 4.5 6.8 5.5 8.9 167 159 413 52 – 218 26 242 14 4481 935 Netherlands
494 4294 1755 1537 2614 – – – – 5.1 4.6 6.3 5.3 8.2 162 174 432 54 – 242 29 267 17 4937 921 Austria
478 4463 1773 1505 2656 – – – – 5.0 4.7 7.8 6.2 10.5 190 130 434 50 – 222 24 244 10 3600 943 Sweden
471 – – – 2529 – – – – 4.9 4.3 6.9 5.7 9.1 166 133 412 49 – 277 28 238 21 4944 941 Greece
497 4206 1738 1501 2589 – – – – 5.0 4.7 5.6 4.7 7.2 145 166 433 55 – 215 28 236 15 5124 899 Portugal
516 – – – – – – – – 5.0 4.5 6.7 5.5 8.9 165 156 420 50 – 227 27 300 16 4197 959 Ireland
535 4252 1770 1513 2586 – – – – 5.0 4.6 6.7 5.5 8.8 165 144 425 49 – 212 26 271 15 4694 921 Denmark
493 4417 1758 1511 2608 – – – – 5.1 4.7 7.4 6.0 9.8 180 127 447 50 – 250 25 251 19 4000 927 Finland
511 – – – 2624 – – – – 4.9 4.4 6.5 5.3 8.5 168 209 423 53 – 232 33 261 17 5015 941 Luxembourg
551 4307 1757 1526 2599 – – – – 5.0 4.4 6.4 5.3 8.4 163 132 395 54 – 213 36 237 15 3554 1006 VW
525 4152 1835 1521 2610 – – – – 5.1 4.5 5.9 5.0 7.5 148 302 410 67 – 250 35 282 18 6258 1044 Renault
487 4240 1785 1501 2595 – – – – 5.0 4.6 6.0 4.9 7.9 150 202 368 68 – 250 47 276 19 6753 1157 Ford
467 4138 1747 1487 2560 – – – – 4.8 4.2 5.8 4.8 7.6 145 120 461 54 – 198 26 220 9 5500 905 Peugeot
503 4226 1763 1530 2616 – – – – 5.3 4.6 6.1 5.0 7.9 154 193 354 48 – 198 30 217 15 4324 855 Opel
478 4072 1727 1537 2564 – – – – 4.8 4.5 5.6 4.7 7.2 141 185 494 48 – 218 27 247 14 6827 830 Citroën
482 3911 1668 1538 2456 – – – – 4.8 4.3 5.7 4.8 7.3 142 213 546 55 – 209 22 239 16 4959 636 Fiat
484 4101 1724 1553 2551 – – – – 5.1 4.5 6.1 5.3 7.6 152 158 481 49 – 204 14 223 21 3934 877 Toyota
499 4429 1793 1535 2745 – – – – 4.8 4.2 7.6 6.1 10.2 191 94 339 47 – 235 14 255 13 3041 1179 Mercedes-Benz
492 4535 1815 1466 2767 – – – – 4.9 4.4 7.3 5.7 10.0 187 165 332 57 – 211 27 237 9 4692 1051 BMW
552 4573 1809 1447 2685 – – – – 5.0 4.3 7.1 5.6 9.7 184 137 479 52 – 211 33 237 12 4056 1138 Audi
554 4348 1727 1462 2528 – – – – 5.0 4.9 6.0 4.9 7.9 151 86 488 54 – 226 29 245 20 3758 1030 Škoda
520 4174 1714 1481 2523 – – – – 5.0 4.5 5.9 4.9 7.8 151 115 350 62 – 215 40 237 20 3561 918 Seat
483 4085 1709 1569 2542 – – – – 5.0 4.4 6.8 5.8 8.6 168 363 607 49 – 447 32 513 41 4709 1355 Nissan
510 4153 1734 1614 2554 – – – – 5.0 4.7 6.8 5.7 8.8 169 222 368 31 – 367 22 397 29 5429 766 Hyundai
528 4237 1750 1494 2616 – – – – 5.2 4.5 6.4 5.2 8.5 157 – – – – – – – – – – Vauxhall
442 3908 1701 1596 2417 – – – – 4.8 4.3 6.7 5.7 8.4 166 163 441 43 – 207 15 228 13 5642 836 Suzuki
487 4149 1736 1585 2563 – – – – 5.1 4.9 6.6 5.5 8.6 167 288 515 38 – 370 21 398 42 5282 800 Kia
533 4629 1809 1504 2718 – – – – 5.1 4.6 7.6 6.1 10.4 193 164 212 36 – 227 21 252 8 3385 752 Volvo
521 4273 1743 1527 2631 – – – – 5.0 4.0 6.6 5.3 8.8 160 227 606 83 – 202 65 242 13 7741 667 Dacia
Tota
l new
sal
es/r
egis
trat
ions
Tota
l new
sal
es/r
egis
trat
ions
[%
]
Pri
ce [
EU
R in
cl. t
ax]
Top
sp
eed
[km
/h]
Die
sel [
%]
Hyb
rid
exc
l. P
HE
V [
%]
Nat
ural
gas
(m
ono
-/b
ival
ent,
incl
. LP
G)
[%]
Flex
-Fue
l (et
hano
l/g
aso
line)
[%
]
Ele
ctri
c/fu
el c
ell i
ncl.
PH
EV
[%
]
Aut
om
atic
[%
]
Fro
nt d
rive
[%
]
Rea
r d
rive
[%
]
4-w
heel
dri
ve [
%]
Eng
ine
pow
er [
KW
]
Eng
ine
size
[cc
m]
Num
ber
of
cylin
der
s
Co
mp
ress
ion
rate
(g
aso
line)
Co
mp
ress
ion
rate
(d
iese
l)
Num
ber
of
gea
rs
Per
form
ance
0–1
00
km
/h (
gas
olin
e) [
s]
Per
form
ance
0–1
00
km
/h (
die
sel)
[s]
Mas
s in
run
ning
ord
er [
kg]
Gro
ss w
eig
ht [
kg]
Pay
load
[kg
]
Leng
th [
mm
]
Wid
th [
mm
]
Hei
ght
[m
m]
Whe
elb
ase
[mm
]
Fro
nt t
rack
[m
m]
Rea
r tr
ack
[mm
]
Foo
tpri
nt [
m2 ]
Bo
ot
volu
me
[l]
Seat
s
Do
ors
Fuel
co
nsum
pti
on
(NE
DC
) [l
/10
0 k
m]
Fuel
co
nsum
pti
on
(ext
ra-u
rban
) [l
/10
0 k
m]
Fuel
co
nsum
pti
on
(urb
an)
[l/1
00
km
]
CO
2 (N
ED
C)
[g/k
m]
CO
(d
iese
l veh
icle
s) [
mg
/km
]
CO
(g
aso
line
vehi
cles
) [m
g/k
m]
HC
(g
aso
line
vehi
cles
) [m
g/k
m]
NH
MC
(g
aso
line
Eur
o 5
/6 v
ehic
les)
[m
g/k
m]
NO
x (d
iese
l veh
icle
s) [
mg
/km
]
NO
x (g
aso
line
vehi
cles
) [m
g/k
m]
HC
+ N
Ox (
die
sel v
ehic
les)
[m
g/k
m]
Par
ticu
late
s (d
iese
l veh
icle
s) [
mg
/km
]
CO
at
-7 °
C (
gas
olin
e ve
hicl
es)
[mg
/km
]
HC
at
-7 °
C (
gas
olin
e ve
hicl
es)
[mg
/km
]
Dir
ect
inje
ctio
n (n
on-
die
sel)
[%
]
Eur
o 5
and
Eur
o 6
[%
]

87 88
EUROPEAN VEHICLE MARKET STATISTICS 2021/22 Annex
2005Passenger cars
EU-27 15,275,153 100 22,208 184 49 0.1 0.2 0 0 12 83 7 8 3 0 82 1732 4.1 – – – – – 1344 1798
Germany 3,340,708 22 23,612 189 43 0.1 0.2 0 0 19 77 14 9 5 0 91 1854 4.2 – – – – – 1406 1857
United Kingdom 2,439,251 16 23,784 188 37 0.2 0 0 0 16 82 9 9 3 0 87 1771 4.1 – – – – – 1360 1806
Italy 2,264,661 15 19,155 176 59 0 1.0 0 0.02 8 86 6 9 2 0 72 1586 4.0 – – – – – 1274 1694
France 2,067,789 14 21,086 180 69 0.1 0.1 0 0 8 90 3 6 1 0 76 1693 4.0 – – – – – 1323 1796
Spain 1,649,351 11 21,826 185 69 0.1 0 0 0 7 87 5 8 2 0 82 1783 4.1 – – – – – 1375 1837
EU-12 993,982 7 16,731 173 28 0 0 0 0 3 68 2 4 1 0 70 1551 4.0 – – – – – 1234 1683
Belgium 480,008 3 21,652 181 73 0.1 0.1 0 0 10 86 8 6 1 0 77 1721 4.0 – – – – – 1357 1840
Netherlands 465,196 3 25,461 184 27 0.6 0 0 0 14 89 5 6 4 0 82 1720 4.1 – – – – – 1281 1792
Austria 307,905 2 24,499 182 61 0.1 0 0 0 12 83 5 12 5 0 81 1797 4.1 – – – – – 1426 1867
Sweden 273,932 2 25,205 199 14 0.7 1.2 2.8 0 25 82 5 13 4 0 103 2001 4.4 – – – – – 1498 1940
Greece 269,705 2 19,149 178 1 0.1 0 0 0 5 81 6 10 5 0 76 1540 4.0 – – – – – 1256 1677
Portugal 206,488 1 25,520 179 64 0.4 0 0 0 7 90 7 3 1 0 72 1533 3.9 – – – – – 1310 1747
Ireland 171,742 1 24,358 181 22 0.2 0 0 0 10 87 6 7 1 0 76 1604 4.0 – – – – – 1334 1806
Denmark 148,178 1 35,328 183 25 0 0 0 0 7 95 3 3 3 0 79 1679 4.0 – – – – – 1277 1750
Finland 147,740 1 28,705 191 17 0 0 0 0 18 88 4 9 4 0 90 1814 4.1 – – – – – 1398 1845
Luxembourg 48,517 0 25,621 184 75 0.1 0 0 0 8 76 11 11 7 0 96 1964 4.3 – – – – – 1455 1941
VW 1,520,444 10 22,355 183 61 0 0 0 0 7 93 0 5 27 0 80 1771 4.0 – – – – – 1397 1909
Renault 1,473,299 10 19,679 176 56 0 0.1 0 0 6 98 0 0 0 0 72 1554 4.0 – – – – – 1283 1773
Ford 1,252,369 8 18,904 180 46 0 0.1 0.3 0 6 99 0 0 0 0 73 1606 4.0 – – – – – 1303 1731
Peugeot 1,121,268 7 19,909 182 59 0 0 0 0 8 99 0 0 0 0 74 1629 4.0 – – – – – 1309 1751
Opel 1,032,130 7 19,210 181 46 0 0.8 0 0 3 99 0 0 0 0 74 1593 4.0 – – – – – 1334 1779
Citroën 922,265 6 18,414 176 54 0 0 0 0 4 100 0 0 0 0 67 1550 4.0 – – – – – 1246 1685
Toyota 777,964 5 20,835 182 39 2.2 0 0 0 11 85 0 15 0 0 78 1651 4.0 – – – – – 1288 1725
Fiat 747,819 5 13,558 160 41 0 2.6 0 0 1 96 0 4 0 0 56 1382 4.0 – – – – – 1082 1472
Mercedes-Benz 687,786 5 36,606 209 56 0 0.1 0 0 52 33 61 6 0 0 114 2274 4.5 – – – – – 1579 2012
BMW 637,231 4 38,850 220 66 0 0 0 0 32 0 81 18 0 0 131 2352 4.9 – – – – – 1598 2045
Audi 598,553 4 33,831 213 71 0 0 0 0 24 78 0 21 33 0 114 2160 4.6 – – – – – 1538 2030
Škoda 411,603 3 17,677 180 47 0 0 0 0 8 94 0 2 9 0 68 1617 3.8 – – – – – 1296 1779
Seat 373,400 2 17,586 184 62 0 0 0 0 4 99 0 0 3 0 74 1708 3.9 – – – – – 1290 1765
Nissan 368,448 2 20,324 173 34 0 0 0 0 11 76 1 22 0 0 80 1742 4.1 – – – – – 1313 1774
Hyundai 327,264 2 17,508 166 35 0 0 0 0 15 77 1 20 0 0 73 1639 4.0 – – – – – 1358 1802
Vauxhall 317,359 2 19,812 26 0 0.1 0 0 8 100 0 0 0 1 75 1567 4.0 – – – – – 1290 1747
Kia 251,479 2 18,397 166 42 0 0 0 0 20 73 0 26 0 0 77 1771 4.0 – – – – – 1465 1894
Volvo 241,774 2 35,884 206 58 0 1.1 0.3 0 31 79 0 21 0 0 114 2230 4.7 – – – – – 1637 2114
Suzuki 234,936 2 14,682 160 23 0 0 0 0 7 56 0 35 0 0 67 1440 4.0 – – – – – 1146 1537
Dacia 116,267 1 7,116 163 5 0 0 0 0 0 20 0 0 0 0 57 1445 4.0 – – – – – 1031 1535
504 4206 1755 1516 2584 – – – – 4.9 4.4 6.5 5.3 8.5 162 197 447 59 – 290 32 319 23 4770 992 EU-27
505 4272 1751 1514 2612 – – – – 4.9 4.4 6.9 5.6 9.2 172 167 408 56 – 270 31 297 21 4385 1021 Germany
495 4234 1755 1501 2595 – – – – 5.0 4.3 6.8 5.6 9.1 169 195 472 64 – 304 34 325 24 4995 1041 United Kingdom
464 4031 1707 1525 2518 – – – – 4.8 4.4 5.9 4.9 7.6 150 207 494 61 – 292 31 335 24 5239 959 Italy
522 4161 1821 1527 2583 – – – – 5.0 4.5 5.9 5.0 7.7 152 215 452 63 – 295 34 320 23 5321 946 France
516 4249 1749 1513 2600 – – – – 5.0 4.5 6.1 5.0 8.0 157 205 456 61 – 294 35 323 23 4964 967 Spain
516 – – – 2554 – – – – 5.0 4.5 6.4 5.3 8.4 158 192 498 65 – 306 42 332 25 5252 897 EU-12
541 4248 1778 1530 2607 – – – – 5.0 4.4 6.0 5.0 7.8 155 198 479 60 – 311 31 339 25 4869 971 Belgium
564 4221 1735 1524 2596 – – – – 5.0 4.5 6.9 5.6 9.2 170 190 418 57 – 294 29 324 24 4584 979 Netherlands
492 4270 1748 1533 2604 – – – – 5.0 4.5 6.4 5.3 8.4 164 195 444 58 – 299 31 330 24 4613 989 Austria
486 4445 1767 1507 2648 – – – – 5.0 4.7 8.0 6.4 11.0 194 178 459 53 – 336 29 375 29 4349 1049 Sweden
474 – – – 2527 – – – – 4.9 4.3 7.0 5.7 9.3 168 175 440 53 – 351 31 286 29 5361 958 Greece
490 4193 1739 1495 2581 – – – – 4.9 4.7 5.7 4.7 7.3 146 191 460 61 – 262 33 300 20 4746 981 Portugal
523 – – – – – – – – 5.0 4.5 6.8 5.6 9.0 166 186 426 53 – 296 32 376 25 4598 1055 Ireland
527 4236 1747 1512 2579 – – – – 5.0 4.6 6.8 5.5 9.0 167 162 448 54 – 275 29 363 23 4717 948 Denmark
497 4413 1749 1506 2610 – – – – 5.1 4.6 7.4 6.0 9.9 180 172 456 56 – 335 30 329 30 4379 1023 Finland
512 – – – 2616 – – – – 4.9 4.4 6.5 5.3 8.6 168 226 440 56 – 328 33 356 25 4598 952 Luxembourg
560 4285 1753 1525 2597 – – – – 5.0 4.5 6.3 5.2 8.3 162 146 357 56 – 250 37 276 21 3407 1042 VW
536 4131 1838 1525 2599 – – – – 5.1 4.5 5.9 5.0 7.7 149 313 401 75 – 402 40 428 34 6086 1036 Renault
475 4227 1776 1485 2593 – – – – 5.0 4.5 6.1 5.0 8.1 152 209 368 69 – 314 45 340 24 6773 1159 Ford
496 4188 1727 1487 2574 – – – – 4.9 4.3 6.0 4.9 7.9 150 156 520 65 – 246 28 273 15 5141 843 Peugeot
494 4201 1761 1524 2615 – – – – 5.2 4.6 6.1 5.0 8.0 155 203 370 48 – 229 29 252 18 4342 872 Opel
488 4109 1732 1542 2574 – – – – 4.9 4.5 5.8 4.8 7.5 146 220 558 64 – 257 33 288 18 5655 789 Citroën
489 4129 1720 1553 2539 – – – – 5.1 4.4 6.5 5.5 8.2 161 190 449 47 – 263 18 286 27 3243 917 Toyota
484 3833 1658 1537 2434 – – – – 4.7 4.4 5.7 4.8 7.3 142 266 616 65 – 286 28 317 23 7422 935 Fiat
488 4376 1779 1511 2710 – – – – 4.7 4.0 7.4 5.9 10.1 186 118 333 47 – 277 17 299 19 2851 1185 Mercedes-Benz
510 4535 1807 1471 2765 – – – – 4.9 4.4 7.5 5.9 10.4 193 166 370 54 – 266 30 293 18 4814 1039 BMW
542 4533 1799 1435 2662 – – – – 4.9 4.4 6.9 5.4 9.5 178 155 492 56 – 219 33 247 15 4155 1230 Audi
536 4351 1728 1455 2524 – – – – 5.0 4.9 6.0 4.9 7.9 150 95 439 57 – 288 31 308 24 3510 1016 Škoda
523 4156 1728 1486 2518 – – – – 5.0 4.5 5.9 4.8 7.8 151 109 333 66 – 324 44 348 25 4224 1120 Seat
496 4122 1718 1571 2525 – – – – 5.0 4.4 6.9 5.8 8.8 171 376 675 57 – 451 37 512 41 5463 1345 Nissan
501 4115 1722 1592 2541 – – – – 5.0 4.6 6.9 5.8 9.0 172 243 391 31 – 436 18 478 37 6548 768 Hyundai
516 4188 1767 1488 2606 – – – – 5.2 4.5 6.4 5.2 8.6 159 – – – – – – – – – – Vauxhall
484 4168 1734 1586 2558 – – – – 5.0 4.9 6.8 5.6 8.9 172 315 516 40 – 447 27 483 54 5333 809 Kia
539 4627 1806 1503 2719 – – – – 5.1 4.7 7.8 6.2 10.7 196 207 261 42 – 375 25 413 29 3075 764 Volvo
439 3796 1650 1599 2364 – – – – 4.7 4.4 6.6 5.6 8.4 162 204 430 43 – 384 18 415 27 5934 806 Suzuki
534 4284 1740 1525 2630 – – – – 5.0 4.0 6.9 5.5 9.4 167 – 595 90 – – 76 – – 7579 683 Dacia
Tota
l new
sal
es/r
egis
trat
ions
Tota
l new
sal
es/r
egis
trat
ions
[%
]
Pri
ce [
EU
R in
cl. t
ax]
Top
sp
eed
[km
/h]
Die
sel [
%]
Hyb
rid
exc
l. P
HE
V [
%]
Nat
ural
gas
(m
ono
-/b
ival
ent,
incl
. LP
G)
[%]
Flex
-Fue
l (et
hano
l/g
aso
line)
[%
]
Ele
ctri
c/fu
el c
ell i
ncl.
PH
EV
[%
]
Aut
om
atic
[%
]
Fro
nt d
rive
[%
]
Rea
r d
rive
[%
]
4-w
heel
dri
ve [
%]
Eng
ine
pow
er [
KW
]
Eng
ine
size
[cc
m]
Num
ber
of
cylin
der
s
Co
mp
ress
ion
rate
(g
aso
line)
Co
mp
ress
ion
rate
(d
iese
l)
Num
ber
of
gea
rs
Per
form
ance
0–1
00
km
/h (
gas
olin
e) [
s]
Per
form
ance
0–1
00
km
/h (
die
sel)
[s]
Mas
s in
run
ning
ord
er [
kg]
Gro
ss w
eig
ht [
kg]
Pay
load
[kg
]
Leng
th [
mm
]
Wid
th [
mm
]
Hei
ght
[m
m]
Whe
elb
ase
[mm
]
Fro
nt t
rack
[m
m]
Rea
r tr
ack
[mm
]
Foo
tpri
nt [
m2 ]
Bo
ot
volu
me
[l]
Seat
s
Do
ors
Fuel
co
nsum
pti
on
(NE
DC
) [l
/10
0 k
m]
Fuel
co
nsum
pti
on
(ext
ra-u
rban
) [l
/10
0 k
m]
Fuel
co
nsum
pti
on
(urb
an)
[l/1
00
km
]
CO
2 (N
ED
C)
[g/k
m]
CO
(d
iese
l veh
icle
s) [
mg
/km
]
CO
(g
aso
line
vehi
cles
) [m
g/k
m]
HC
(g
aso
line
vehi
cles
) [m
g/k
m]
NH
MC
(g
aso
line
Eur
o 5
/6 v
ehic
les)
[m
g/k
m]
NO
x (d
iese
l veh
icle
s) [
mg
/km
]
NO
x (g
aso
line
vehi
cles
) [m
g/k
m]
HC
+ N
Ox (
die
sel v
ehic
les)
[m
g/k
m]
Par
ticu
late
s (d
iese
l veh
icle
s) [
mg
/km
]
CO
at
-7 °
C (
gas
olin
e ve
hicl
es)
[mg
/km
]
HC
at
-7 °
C (
gas
olin
e ve
hicl
es)
[mg
/km
]
Dir
ect
inje
ctio
n (n
on-
die
sel)
[%
]
Eur
o 5
and
Eur
o 6
[%
]

89 90
EUROPEAN VEHICLE MARKET STATISTICS 2021/22 Annex
2004Passenger cars
EU-27 15,237,555 100 21,709 183 48 0.1 0.2 0 0 13 83 8 7 2 0 80 1735 4.1 – – – – – 1329 1776
Germany 3,266,678 21 24,154 190 44 0.1 0.2 0 0 21 75 17 8 3 0 89.5 1866 4.2 – – – – – 1415 1857
United Kingdom 2,566,845 17 22,894 186 32 0.1 0.1 0 0 15 83 9 9 2 0 83.6 1752 4.1 – – – – – 1332 1766
Italy 2,290,106 15 18,603 174 58 0 0.5 0 0 6 88 6 7 1 0 70.3 1592 4.0 – – – – – 1258 1668
France 2,013,709 13 20,764 180 69 0 0.1 0 0.02 8 91 4 6 1 0 75.4 1723 4.0 – – – – – 1310 1791
Spain 1,616,077 11 20,838 184 66 0 0 0 0 10 88 5 7 1 0 79.0 1782 4.1 – – – – – 1343 1800
EU-12 986,245 6 16,213 170 26 0 0 0 0 3 61 1 2 1 0 67.1 1491 4.0 – – – – – 1197 1656
Belgium 484,676 3 20,767 180 70 0 0 0 0 11 87 8 5 1 0 75.7 1735 4.1 – – – – – 1341 1812
Netherlands 483,883 3 24,372 182 25 0.2 0 0 0 14 90 5 5 3 0 80.2 1712 4.1 – – – – – 1265 1763
Austria 311,292 2 23,714 179 69 0 0 0 0 9 84 7 9 2 0 78.5 1808 4.1 – – – – – 1403 1863
Greece 289,750 2 18,447 178 3 0 0 0 0 4 82 5 10 2 0 74.1 1544 4.0 – – – – – 1235 1652
Sweden 264,154 2 25,080 200 12 0.3 2.0 0.1 0 24 82 5 12 1 0 103.3 1992 4.4 – – – – – 1490 1942
Portugal 197,584 1 24,142 177 57 0.2 0 0 0 9 91 7 2 0 0 69.4 1524 4.0 – – – – – 1273 1703
Ireland 154,136 1 24,014 180 19 0.2 0 0 0 9 88 6 6 0 0 73.8 1592 4.0 – – – – – 1310 1771
Finland 142,303 1 27,950 191 15 0 0 0 0 19 90 4 6 2 0 87.7 1803 4.1 – – – – – 1373 1807
Denmark 121,846 1 33,667 184 25 0 0 0 0 9 96 2 2 1 0 78.0 1691 4.1 – – – – – 1319 1739
Luxembourg 48,271 0 25,097 183 72 0 0 0 0 6 76 11 11 4 0 93.1 1961 4.3 – – – – – 1444 1920
Renault 1,563,715 10 19,616 177 59 0 0.1 0 0 6 98 0 0 0 0 72.6 1578 4.0 – – – – – 1282 1776
VW 1,462,371 10 22,265 183 62 0 0 0 0 10 93 0 5 21 0 78.5 1774 4.0 – – – – – 1386 1889
Ford 1,286,833 8 18,497 179 46 0 0.3 0 0 7 99 0 0 0 0 71.5 1618 4.0 – – – – – 1298 1705
Peugeot 1,185,983 8 18,826 181 54 0 0 0 0.03 7 99 0 0 0 0 71.6 1671 4.0 – – – – – 1273 1720
Opel 1,035,859 7 18,345 178 46 0 0.8 0 0 9 98 0 0 0 0 71.2 1606 4.0 – – – – – 1317 1755
Citroën 907,105 6 17,551 173 55 0 0 0 0.01 5 99 0 0 0 0 64.0 1585 4.0 – – – – – 1227 1664
Fiat 847,536 6 12,969 161 32 0 1.1 0 0 2 99 0 0 0 0 53.9 1355 4.0 – – – – – 1057 1477
Toyota 746,191 5 20,388 183 35 1.0 0 0 0 11 82 0 16 0 0 78.7 1670 4.0 – – – – – 1272 1709
Mercedes-Benz 685,992 5 38,283 214 59 0 0 0 0 54 20 74 6 0 0 113.8 2283 4.5 – – – – – 1609 2051
BMW 569,749 4 39,316 221 58 0 0 0 0 35 0 82 17 0 0 132.9 2468 5.2 – – – – – 1641 2063
Audi 546,281 4 32,834 210 69 0 0 0 0 24 79 0 19 17 0 110.5 2109 4.5 – – – – – 1498 1988
Škoda 393,811 3 16,978 178 44 0 0 0 0 7 79 0 1 1 0 66.3 1606 3.8 – – – – – 1262 1725
Seat 392,659 3 16,987 183 58 0 0 0 0 5 98 0 0 1 0 71.5 1669 3.9 – – – – – 1251 1716
Nissan 390,069 3 19,336 172 38 0 0 0 0 9 77 2 20 0 0 77.1 1722 4.0 – – – – – 1291 1746
Vauxhall 325,023 2 19,352 – 26 0 0.3 0 0 8 100 0 0 0 1 71.2 1575 4.0 – – – – – 1280 1732
Hyundai 315,226 2 16,390 165 34 0 0 0 0 12 79 1 17 0 0 70.1 1601 3.9 – – – – – 1332 1769
Volvo 242,885 2 34,467 207 52 0 0.8 0 0 33 80 0 19 0 0 116.3 2272 4.7 – – – – – 1630 2101
Suzuki 210,157 1 14,879 156 25 0 0 0 0 8 45 0 44 0 0 65.1 1453 4.0 – – – – – 1168 1547
Kia 175,274 1 17,547 166 38 0 0 0 0 23 81 0 18 0 0 76.1 1806 4.0 – – – – – 1481 1897
Dacia 61,833 0 – – 6 0 0 0 0 0 9 0 0 0 0 56.8 1446 4.0 – – – – – – 1538
498 4193 1746 1510 2578 – – – – 4.9 4.4 6.5 5.3 8.6 163 203 471 63 – 349 35 377 29 4613 1002 EU-27
496 4279 1743 1510 2611 – – – – 4.9 4.4 7.0 5.6 9.3 174 168 420 58 – 329 34 356 28 4148 1021 Germany
489 4208 1748 1495 2586 – – – – 5.0 4.3 7.0 5.6 9.3 172 216 484 70 – 383 39 383 32 4850 985 United Kingdom
460 4017 1699 1515 2513 – – – – 4.8 4.3 5.9 4.9 7.7 150 208 544 65 – 335 31 414 28 5728 1006 Italy
528 4153 1812 1522 2582 – – – – 5.0 4.5 6.0 5.0 7.8 153 223 472 67 – 354 38 362 28 4861 984 France
509 4222 1734 1502 2587 – – – – 5.0 4.4 6.2 5.1 8.1 158 211 474 65 – 354 37 382 29 4581 954 Spain
504 – – – 2525 – – – – 5.0 4.6 6.4 5.2 8.3 157 211 522 61 – 373 34 401 32 4751 973 EU-12
526 4227 1784 1522 2600 – – – – 5.0 4.4 6.1 5.0 7.9 156 208 496 62 – 364 35 392 30 4690 979 Belgium
554 4202 1724 1518 2588 – – – – 5.0 4.5 7.1 5.7 9.4 172 197 445 61 – 383 34 411 32 4733 982 Netherlands
510 4262 1735 1538 2602 – – – – 5.0 4.5 6.3 5.2 8.2 162 210 480 62 – 385 34 415 31 4642 964 Austria
468 – – – 2523 – – – – 4.9 4.3 7.0 5.7 9.3 168 249 525 65 – 426 36 403 38 5163 1027 Greece
493 4440 1758 1503 2649 – – – – 5.1 4.7 8.1 6.5 11.2 197 171 510 61 – 377 35 358 33 4295 1037 Sweden
486 4155 1733 1484 2564 – – – – 4.9 4.6 5.8 4.8 7.5 148 220 463 64 – 333 34 421 27 3984 986 Portugal
508 – – – 2582 – – – – 5.0 4.4 6.9 5.6 9.1 168 193 514 68 – 399 37 451 34 4385 940 Ireland
490 4393 1741 1497 2611 – – – – 5.0 4.6 7.5 6.0 10.1 181 179 473 60 – 384 37 411 32 4996 1042 Finland
482 4255 1721 1508 2580 – – – – 5.0 4.6 6.9 5.6 9.3 170 186 457 60 – 392 34 432 33 4958 1007 Denmark
504 – – – 2614 – – – – 4.9 4.3 6.6 5.4 8.8 169 232 511 61 – 366 36 392 28 4294 941 Luxembourg
539 4150 1825 1513 2603 – – – – 5.1 4.5 5.9 4.9 7.7 149 309 400 74 – 429 42 454 36 6056 1077 Renault
554 4267 1745 1518 2591 – – – – 5.0 4.5 6.3 5.2 8.2 160 122 340 59 – 304 39 327 25 3222 1102 VW
466 4203 1745 1481 2590 – – – – 4.9 4.5 6.2 5.0 8.3 155 168 388 70 – 369 45 394 31 5761 1008 Ford
496 4154 1717 1481 2568 – – – – 4.9 4.3 6.1 4.9 8.0 152 221 535 70 – 339 32 370 23 5114 805 Peugeot
485 4145 1745 1531 2608 – – – – 5.2 4.7 6.2 5.1 8.2 157 194 376 50 – 273 33 294 22 4184 907 Opel
484 4076 1721 1552 2565 – – – – 4.9 4.5 5.8 4.8 7.6 146 250 646 79 – 314 41 350 26 6546 683 Citroën
481 3834 1659 1527 2434 – – – – 4.8 4.3 5.7 4.8 7.4 141 329 656 68 – 321 29 357 27 7904 1028 Fiat
487 4124 1719 1549 2527 – – – – 5.1 4.4 6.7 5.6 8.5 165 193 496 51 – 342 27 363 30 2611 901 Toyota
501 4452 1775 1493 2722 – – – – 4.8 4.0 7.6 5.9 10.6 193 126 367 55 – 365 27 387 31 2249 1233 Mercedes-Benz
500 4559 1795 1466 2770 – – – – 4.9 4.1 7.9 6.2 10.9 201 168 456 56 – 343 30 377 27 4384 891 BMW
542 4476 1785 1436 2647 – – – – 4.9 4.1 6.9 5.4 9.4 177 179 493 58 – 298 35 331 26 4630 1197 Audi
512 4300 1707 1449 2505 – – – – 5.0 4.9 6.0 4.9 7.9 150 111 447 59 – 369 34 392 29 3614 1021 Škoda
513 4119 1719 1474 2502 – – – – 5.0 4.4 5.8 4.8 7.7 149 126 357 69 – 364 45 389 29 4183 1199 Seat
488 4107 1712 1561 2524 – – – – 5.0 4.4 6.7 5.7 8.6 169 356 687 60 – 432 40 486 39 7604 1106 Nissan
509 4164 1795 1498 2605 – – – – 5.3 4.5 6.7 5.4 9.0 165 – – – – – – – – – – Vauxhall
495 4099 1714 1575 2530 – – – – 5.0 4.6 6.9 5.8 9.0 171 217 399 32 – 452 17 479 39 6707 774 Hyundai
531 4627 1798 1492 2707 – – – – 5.1 4.6 8.0 6.3 11.1 201 227 489 70 – 414 38 443 35 1547 660 Volvo
435 3801 1646 1638 2347 – – – – 4.7 4.4 6.7 5.6 8.5 165 234 416 41 – 404 19 443 26 5067 691 Suzuki
475 4218 1732 1576 2559 – – – – 5.2 4.9 7.0 5.8 9.2 176 313 509 41 – 516 32 540 58 5436 785 Kia
– – – – 2630 – – – – 5.0 4.6 – – – – – – – – – – – – – – Dacia
Tota
l new
sal
es/r
egis
trat
ions
Tota
l new
sal
es/r
egis
trat
ions
[%
]
Pri
ce [
EU
R in
cl. t
ax]
Top
sp
eed
[km
/h]
Die
sel [
%]
Hyb
rid
exc
l. P
HE
V [
%]
Nat
ural
gas
(m
ono
-/b
ival
ent,
incl
. LP
G)
[%]
Flex
-Fue
l (et
hano
l/g
aso
line)
[%
]
Ele
ctri
c/fu
el c
ell i
ncl.
PH
EV
[%
]
Aut
om
atic
[%
]
Fro
nt d
rive
[%
]
Rea
r d
rive
[%
]
4-w
heel
dri
ve [
%]
Eng
ine
pow
er [
KW
]
Eng
ine
size
[cc
m]
Num
ber
of
cylin
der
s
Co
mp
ress
ion
rate
(g
aso
line)
Co
mp
ress
ion
rate
(d
iese
l)
Num
ber
of
gea
rs
Per
form
ance
0–1
00
km
/h (
gas
olin
e) [
s]
Per
form
ance
0–1
00
km
/h (
die
sel)
[s]
Mas
s in
run
ning
ord
er [
kg]
Gro
ss w
eig
ht [
kg]
Pay
load
[kg
]
Leng
th [
mm
]
Wid
th [
mm
]
Hei
ght
[m
m]
Whe
elb
ase
[mm
]
Fro
nt t
rack
[m
m]
Rea
r tr
ack
[mm
]
Foo
tpri
nt [
m2 ]
Bo
ot
volu
me
[l]
Seat
s
Do
ors
Fuel
co
nsum
pti
on
(NE
DC
) [l
/10
0 k
m]
Fuel
co
nsum
pti
on
(ext
ra-u
rban
) [l
/10
0 k
m]
Fuel
co
nsum
pti
on
(urb
an)
[l/1
00
km
]
CO
2 (N
ED
C)
[g/k
m]
CO
(d
iese
l veh
icle
s) [
mg
/km
]
CO
(g
aso
line
vehi
cles
) [m
g/k
m]
HC
(g
aso
line
vehi
cles
) [m
g/k
m]
NH
MC
(g
aso
line
Eur
o 5
/6 v
ehic
les)
[m
g/k
m]
NO
x (d
iese
l veh
icle
s) [
mg
/km
]
NO
x (g
aso
line
vehi
cles
) [m
g/k
m]
HC
+ N
Ox (
die
sel v
ehic
les)
[m
g/k
m]
Par
ticu
late
s (d
iese
l veh
icle
s) [
mg
/km
]
CO
at
-7 °
C (
gas
olin
e ve
hicl
es)
[mg
/km
]
HC
at
-7 °
C (
gas
olin
e ve
hicl
es)
[mg
/km
]
Dir
ect
inje
ctio
n (n
on-
die
sel)
[%
]
Eur
o 5
and
Eur
o 6
[%
]
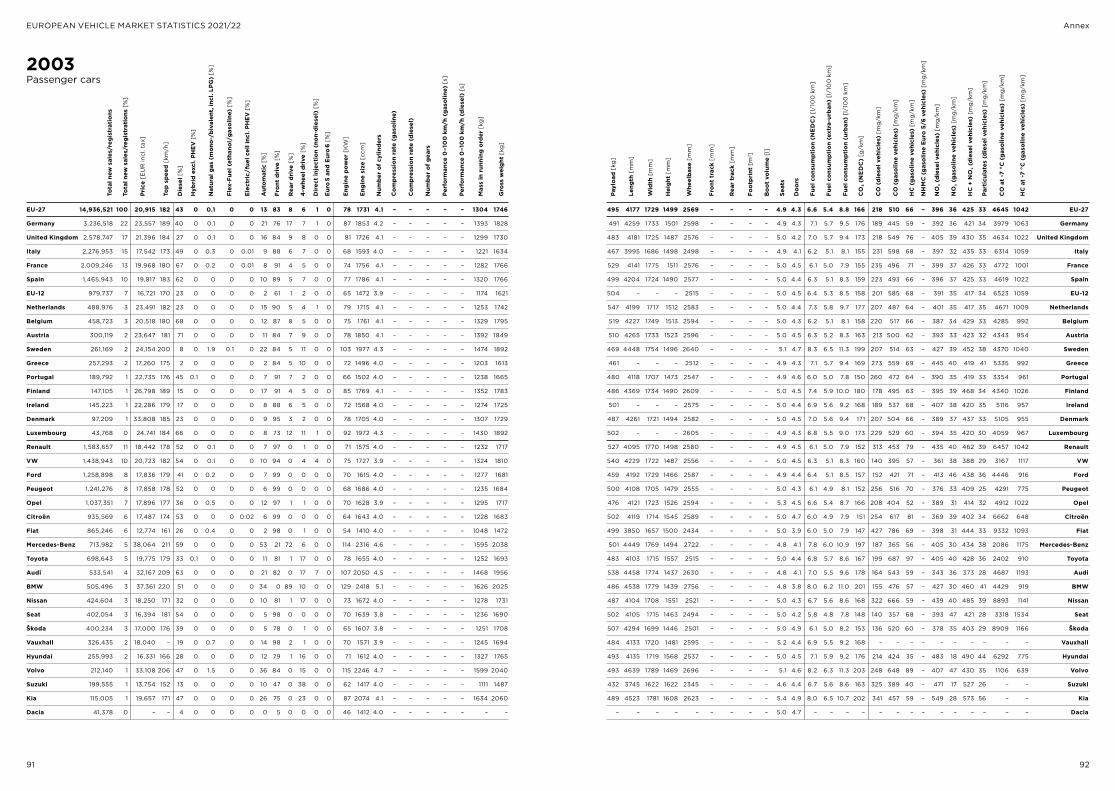
91 92
EUROPEAN VEHICLE MARKET STATISTICS 2021/22 Annex
2003Passenger cars
EU-27 14,936,521 100 20,915 182 43 0 0.1 0 0 13 83 8 6 1 0 78 1731 4.1 – – – – – 1304 1746
Germany 3,236,518 22 23,557 189 40 0 0.1 0 0 21 76 17 7 1 0 87 1853 4.2 – – – – – 1393 1828
United Kingdom 2,578,747 17 21,396 184 27 0 0.1 0 0 16 84 9 8 0 0 81 1726 4.1 – – – – – 1299 1730
Italy 2,276,953 15 17,542 173 49 0 0.3 0 0.01 9 88 6 7 0 0 68 1593 4.0 – – – – – 1221 1634
France 2,009,246 13 19,968 180 67 0 0.2 0 0.01 8 91 4 5 0 0 74 1756 4.1 – – – – – 1282 1766
Spain 1,465,943 10 19,817 183 62 0 0 0 0 10 89 5 7 0 0 77 1786 4.1 – – – – – 1320 1766
EU-12 979,737 7 16,721 170 23 0 0 0 0 2 61 1 2 0 0 65 1472 3.9 – – – – – 1174 1621
Netherlands 488,976 3 23,491 182 23 0 0 0 0 15 90 5 4 1 0 79 1715 4.1 – – – – – 1253 1742
Belgium 458,723 3 20,518 180 68 0 0 0 0 12 87 8 5 0 0 75 1761 4.1 – – – – – 1329 1795
Austria 300,119 2 23,647 181 71 0 0 0 0 11 84 7 9 0 0 78 1850 4.1 – – – – – 1392 1849
Sweden 261,169 2 24,154 200 8 0 1.9 0.1 0 22 84 5 11 0 0 103 1977 4.3 – – – – – 1474 1892
Greece 257,293 2 17,260 175 2 0 0 0 0 2 84 5 10 0 0 72 1496 4.0 – – – – – 1203 1613
Portugal 189,792 1 22,735 176 45 0.1 0 0 0 7 91 7 2 0 0 66 1502 4.0 – – – – – 1238 1665
Finland 147,105 1 26,798 189 15 0 0 0 0 17 91 4 5 0 0 85 1769 4.1 – – – – – 1352 1783
Ireland 145,223 1 22,286 179 17 0 0 0 0 8 88 6 5 0 0 72 1568 4.0 – – – – – 1274 1725
Denmark 97,209 1 33,808 185 23 0 0 0 0 9 95 3 2 0 0 78 1705 4.0 – – – – – 1307 1729
Luxembourg 43,768 0 24,741 184 66 0 0 0 0 8 73 12 11 1 0 92 1972 4.3 – – – – – 1430 1892
Renault 1,583,657 11 18,442 178 52 0 0.1 0 0 7 97 0 1 0 0 71 1575 4.0 – – – – – 1232 1717
VW 1,438,943 10 20,723 182 54 0 0.1 0 0 10 94 0 4 4 0 75 1727 3.9 – – – – – 1324 1810
Ford 1,258,898 8 17,836 179 41 0 0.2 0 0 7 99 0 0 0 0 70 1615 4.0 – – – – – 1277 1681
Peugeot 1,241,276 8 17,858 178 52 0 0 0 0 6 99 0 0 0 0 68 1686 4.0 – – – – – 1235 1684
Opel 1,037,351 7 17,896 177 36 0 0.5 0 0 12 97 1 1 0 0 70 1628 3.9 – – – – – 1295 1717
Citroën 935,569 6 17,487 174 53 0 0 0 0.02 6 99 0 0 0 0 64 1643 4.0 – – – – – 1228 1683
Fiat 865,246 6 12,774 161 26 0 0.4 0 0 2 98 0 1 0 0 54 1410 4.0 – – – – – 1048 1472
Mercedes-Benz 713,982 5 38,064 211 59 0 0 0 0 53 21 72 6 0 0 114 2316 4.6 – – – – – 1595 2038
Toyota 698,643 5 19,775 179 33 0.1 0 0 0 11 81 1 17 0 0 78 1655 4.0 – – – – – 1252 1693
Audi 533,541 4 32,167 209 63 0 0 0 0 21 82 0 17 7 0 107 2050 4.5 – – – – – 1468 1956
BMW 505,496 3 37,361 220 51 0 0 0 0 34 0 89 10 0 0 129 2418 5.1 – – – – – 1626 2025
Nissan 424,604 3 18,250 171 32 0 0 0 0 10 81 1 17 0 0 73 1672 4.0 – – – – – 1278 1731
Seat 402,054 3 16,394 181 54 0 0 0 0 5 98 0 0 0 0 70 1639 3.8 – – – – – 1236 1690
Škoda 400,234 3 17,000 176 39 0 0 0 0 5 78 0 1 0 0 65 1607 3.8 – – – – – 1251 1708
Vauxhall 326,435 2 18,040 – 19 0 0.7 0 0 14 98 2 1 0 0 70 1571 3.9 – – – – – 1245 1694
Hyundai 255,993 2 16,331 166 28 0 0 0 0 12 79 1 16 0 0 71 1612 4.0 – – – – – 1327 1765
Volvo 212,140 1 33,108 206 47 0 1.5 0 0 36 84 0 15 0 0 115 2246 4.7 – – – – – 1599 2040
Suzuki 199,555 1 13,754 152 13 0 0 0 0 10 47 0 38 0 0 62 1417 4.0 – – – – – 1111 1487
Kia 115,005 1 19,657 171 47 0 0 0 0 26 75 0 23 0 0 87 2074 4.1 – – – – – 1634 2060
Dacia 41,378 0 – – 4 0 0 0 0 0 5 0 0 0 0 46 1412 4.0 – – – – – – –
495 4177 1729 1499 2569 – – – – 4.9 4.3 6.6 5.4 8.8 166 218 510 66 – 396 36 425 33 4645 1042 EU-27
491 4259 1733 1501 2598 – – – – 4.9 4.3 7.1 5.7 9.5 176 189 445 59 – 392 36 421 34 3979 1063 Germany
483 4181 1725 1487 2576 – – – – 5.0 4.2 7.0 5.7 9.4 173 218 549 76 – 405 39 430 35 4634 1022 United Kingdom
467 3995 1686 1498 2498 – – – – 4.9 4.1 6.2 5.1 8.1 155 231 598 68 – 397 32 435 33 6314 1059 Italy
529 4141 1775 1511 2576 – – – – 5.0 4.5 6.1 5.0 7.9 155 235 496 71 – 399 37 426 33 4772 1001 France
499 4204 1724 1490 2577 – – – – 5.0 4.4 6.3 5.1 8.3 159 223 493 66 – 396 37 425 33 4619 1022 Spain
504 – – – 2515 – – – – 5.0 4.5 6.4 5.3 8.5 158 201 585 68 – 391 35 417 34 6523 1059 EU-12
547 4199 1717 1512 2583 – – – – 5.0 4.4 7.3 5.8 9.7 177 207 487 64 – 401 35 417 35 4671 1009 Netherlands
519 4227 1749 1513 2594 – – – – 5.0 4.3 6.2 5.1 8.1 158 220 517 66 – 387 34 429 33 4285 992 Belgium
510 4265 1733 1523 2596 – – – – 5.0 4.5 6.3 5.2 8.3 163 213 500 62 – 393 33 423 32 4343 954 Austria
469 4448 1754 1496 2640 – – – – 5.1 4.7 8.3 6.5 11.3 199 207 514 63 – 427 39 452 38 4370 1040 Sweden
461 – – – 2512 – – – – 4.9 4.3 7.1 5.7 9.4 169 273 559 69 – 445 40 419 41 5335 992 Greece
480 4118 1707 1473 2547 – – – – 4.9 4.6 6.0 5.0 7.8 150 260 472 64 – 390 35 419 33 3354 961 Portugal
486 4369 1734 1490 2609 – – – – 5.0 4.5 7.4 5.9 10.0 180 178 495 63 – 395 39 468 34 4340 1026 Finland
501 – – – 2575 – – – – 5.0 4.4 6.9 5.6 9.2 168 189 537 68 – 407 38 420 35 5116 957 Ireland
487 4261 1721 1494 2582 – – – – 5.0 4.5 7.0 5.6 9.4 171 207 504 66 – 389 37 437 33 5105 955 Denmark
502 – – – 2605 – – – – 4.9 4.3 6.8 5.5 9.0 173 229 529 60 – 394 35 420 30 4059 967 Luxembourg
527 4095 1770 1498 2580 – – – – 4.9 4.5 6.1 5.0 7.9 152 313 453 79 – 435 40 462 39 6457 1042 Renault
540 4229 1722 1487 2556 – – – – 5.0 4.5 6.3 5.1 8.3 160 140 395 57 – 361 38 388 29 3167 1117 VW
459 4192 1729 1466 2587 – – – – 4.9 4.4 6.4 5.1 8.5 157 152 421 71 – 413 46 438 36 4446 916 Ford
500 4108 1705 1479 2555 – – – – 5.0 4.3 6.1 4.9 8.1 152 256 516 70 – 376 33 409 25 4291 775 Peugeot
476 4121 1723 1526 2594 – – – – 5.3 4.5 6.6 5.4 8.7 166 208 404 52 – 389 31 414 32 4912 1022 Opel
502 4119 1714 1545 2589 – – – – 5.0 4.7 6.0 4.9 7.9 151 254 617 81 – 369 39 402 34 6662 648 Citroën
499 3850 1657 1500 2434 – – – – 5.0 3.9 6.0 5.0 7.9 147 427 786 69 – 398 31 444 33 9332 1093 Fiat
501 4449 1769 1494 2722 – – – – 4.8 4.1 7.8 6.0 10.9 197 187 365 56 – 405 30 434 38 2086 1175 Mercedes-Benz
483 4103 1715 1557 2515 – – – – 5.0 4.4 6.8 5.7 8.6 167 199 687 97 – 405 40 428 36 2402 910 Toyota
538 4458 1774 1437 2630 – – – – 4.8 4.1 7.0 5.5 9.6 178 164 543 59 – 343 36 373 28 4687 1193 Audi
486 4538 1779 1439 2756 – – – – 4.8 3.8 8.0 6.2 11.0 201 155 476 57 – 427 30 460 41 4429 919 BMW
487 4104 1708 1551 2521 – – – – 5.0 4.3 6.7 5.6 8.6 168 322 666 59 – 439 40 485 39 8893 1141 Nissan
502 4105 1715 1463 2494 – – – – 5.0 4.2 5.8 4.8 7.8 148 140 357 68 – 393 47 421 28 3318 1534 Seat
507 4294 1699 1446 2501 – – – – 5.0 4.9 6.1 5.0 8.2 153 136 520 60 – 378 35 403 29 8909 1166 Škoda
484 4133 1720 1481 2595 – – – – 5.2 4.4 6.9 5.5 9.2 168 – – – – – – – – – – Vauxhall
493 4135 1719 1568 2537 – – – – 5.0 4.5 7.1 5.9 9.2 176 214 424 35 – 483 18 490 44 6292 775 Hyundai
493 4639 1789 1469 2696 – – – – 5.1 4.6 8.2 6.3 11.3 203 248 648 89 – 407 47 430 35 1106 639 Volvo
432 3745 1622 1622 2345 – – – – 4.6 4.4 6.7 5.6 8.6 163 325 389 40 – 471 17 527 26 – – Suzuki
489 4523 1781 1608 2623 – – – – 5.4 4.9 8.0 6.5 10.7 202 341 457 59 – 549 28 573 56 – – Kia
– – – – – – – – – 5.0 4.7 – – – – – – – – – – – – – – Dacia
Tota
l new
sal
es/r
egis
trat
ions
Tota
l new
sal
es/r
egis
trat
ions
[%
]
Pri
ce [
EU
R in
cl. t
ax]
Top
sp
eed
[km
/h]
Die
sel [
%]
Hyb
rid
exc
l. P
HE
V [
%]
Nat
ural
gas
(m
ono
-/b
ival
ent,
incl
. LP
G)
[%]
Flex
-Fue
l (et
hano
l/g
aso
line)
[%
]
Ele
ctri
c/fu
el c
ell i
ncl.
PH
EV
[%
]
Aut
om
atic
[%
]
Fro
nt d
rive
[%
]
Rea
r d
rive
[%
]
4-w
heel
dri
ve [
%]
Eng
ine
pow
er [
KW
]
Eng
ine
size
[cc
m]
Num
ber
of
cylin
der
s
Co
mp
ress
ion
rate
(g
aso
line)
Co
mp
ress
ion
rate
(d
iese
l)
Num
ber
of
gea
rs
Per
form
ance
0–1
00
km
/h (
gas
olin
e) [
s]
Per
form
ance
0–1
00
km
/h (
die
sel)
[s]
Mas
s in
run
ning
ord
er [
kg]
Gro
ss w
eig
ht [
kg]
Pay
load
[kg
]
Leng
th [
mm
]
Wid
th [
mm
]
Hei
ght
[m
m]
Whe
elb
ase
[mm
]
Fro
nt t
rack
[m
m]
Rea
r tr
ack
[mm
]
Foo
tpri
nt [
m2 ]
Bo
ot
volu
me
[l]
Seat
s
Do
ors
Fuel
co
nsum
pti
on
(NE
DC
) [l
/10
0 k
m]
Fuel
co
nsum
pti
on
(ext
ra-u
rban
) [l
/10
0 k
m]
Fuel
co
nsum
pti
on
(urb
an)
[l/1
00
km
]
CO
2 (N
ED
C)
[g/k
m]
CO
(d
iese
l veh
icle
s) [
mg
/km
]
CO
(g
aso
line
vehi
cles
) [m
g/k
m]
HC
(g
aso
line
vehi
cles
) [m
g/k
m]
NH
MC
(g
aso
line
Eur
o 5
/6 v
ehic
les)
[m
g/k
m]
NO
x (d
iese
l veh
icle
s) [
mg
/km
]
NO
x (g
aso
line
vehi
cles
) [m
g/k
m]
HC
+ N
Ox (
die
sel v
ehic
les)
[m
g/k
m]
Par
ticu
late
s (d
iese
l veh
icle
s) [
mg
/km
]
CO
at
-7 °
C (
gas
olin
e ve
hicl
es)
[mg
/km
]
HC
at
-7 °
C (
gas
olin
e ve
hicl
es)
[mg
/km
]
Dir
ect
inje
ctio
n (n
on-
die
sel)
[%
]
Eur
o 5
and
Eur
o 6
[%
]
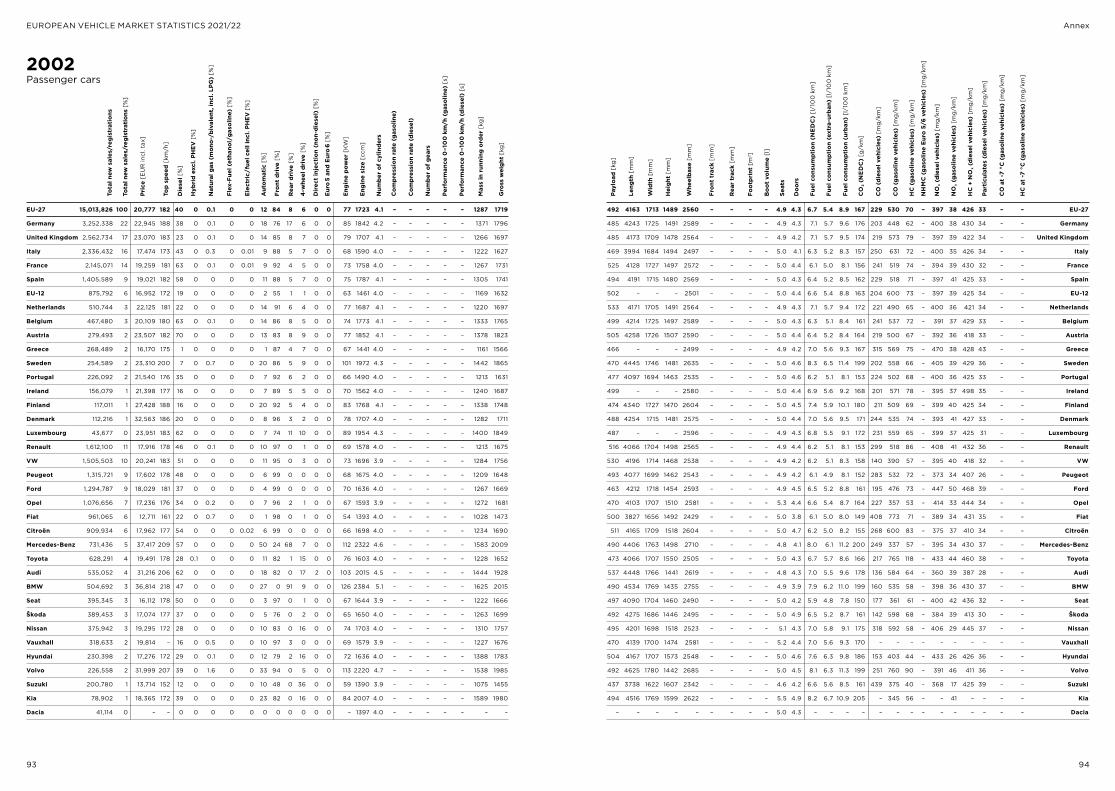
93 94
EUROPEAN VEHICLE MARKET STATISTICS 2021/22 Annex
2002Passenger cars
EU-27 15,013,826 100 20,777 182 40 0 0.1 0 0 12 84 8 6 0 0 77 1723 4.1 – – – – – 1287 1719
Germany 3,252,338 22 22,945 188 38 0 0.1 0 0 18 76 17 6 0 0 85 1842 4.2 – – – – – 1371 1796
United Kingdom 2,562,734 17 23,070 183 23 0 0.1 0 0 14 85 8 7 0 0 79 1707 4.1 – – – – – 1266 1697
Italy 2,336,432 16 17,474 173 43 0 0.3 0 0.01 9 88 5 7 0 0 68 1590 4.0 – – – – – 1222 1627
France 2,145,071 14 19,259 181 63 0 0.1 0 0.01 9 92 4 5 0 0 73 1758 4.0 – – – – – 1267 1731
Spain 1,405,589 9 19,021 182 58 0 0 0 0 11 88 5 7 0 0 75 1787 4.1 – – – – – 1305 1741
EU-12 875,792 6 16,952 172 19 0 0 0 0 2 55 1 1 0 0 63 1461 4.0 – – – – – 1169 1632
Netherlands 510,744 3 22,125 181 22 0 0 0 0 14 91 6 4 0 0 77 1687 4.1 – – – – – 1220 1697
Belgium 467,480 3 20,109 180 63 0 0.1 0 0 14 86 8 5 0 0 74 1773 4.1 – – – – – 1333 1765
Austria 279,493 2 23,507 182 70 0 0 0 0 13 83 8 9 0 0 77 1852 4.1 – – – – – 1378 1823
Greece 268,489 2 16,170 175 1 0 0 0 0 1 87 4 7 0 0 67 1441 4.0 – – – – – 1161 1566
Sweden 254,589 2 23,310 200 7 0 0.7 0 0 20 86 5 9 0 0 101 1972 4.3 – – – – – 1442 1865
Portugal 226,092 2 21,540 176 35 0 0 0 0 7 92 6 2 0 0 66 1490 4.0 – – – – – 1213 1631
Ireland 156,079 1 21,398 177 16 0 0 0 0 7 89 5 5 0 0 70 1562 4.0 – – – – – 1240 1687
Finland 117,011 1 27,428 188 16 0 0 0 0 20 92 5 4 0 0 83 1768 4.1 – – – – – 1338 1748
Denmark 112,216 1 32,563 186 20 0 0 0 0 8 96 3 2 0 0 78 1707 4.0 – – – – – 1282 1711
Luxembourg 43,677 0 23,951 183 62 0 0 0 0 7 74 11 10 0 0 89 1954 4.3 – – – – – 1400 1849
Renault 1,612,100 11 17,916 178 46 0 0.1 0 0 10 97 0 1 0 0 69 1578 4.0 – – – – – 1213 1675
VW 1,505,503 10 20,241 183 51 0 0 0 0 11 95 0 3 0 0 73 1696 3.9 – – – – – 1284 1756
Peugeot 1,315,721 9 17,602 178 48 0 0 0 0 6 99 0 0 0 0 68 1675 4.0 – – – – – 1209 1648
Ford 1,294,787 9 18,029 181 37 0 0 0 0 4 99 0 0 0 0 70 1636 4.0 – – – – – 1267 1669
Opel 1,076,656 7 17,236 176 34 0 0.2 0 0 7 96 2 1 0 0 67 1593 3.9 – – – – – 1272 1681
Fiat 961,065 6 12,711 161 22 0 0.7 0 0 1 98 0 1 0 0 54 1393 4.0 – – – – – 1028 1473
Citroën 909,934 6 17,962 177 54 0 0 0 0.02 6 99 0 0 0 0 66 1698 4.0 – – – – – 1234 1690
Mercedes-Benz 731,436 5 37,417 209 57 0 0 0 0 50 24 68 7 0 0 112 2322 4.6 – – – – – 1583 2009
Toyota 628,291 4 19,491 178 28 0.1 0 0 0 11 82 1 15 0 0 76 1603 4.0 – – – – – 1228 1652
Audi 535,052 4 31,216 206 62 0 0 0 0 18 82 0 17 2 0 103 2015 4.5 – – – – – 1444 1928
BMW 504,692 3 36,814 218 47 0 0 0 0 27 0 91 9 0 0 126 2384 5.1 – – – – – 1625 2015
Seat 395,345 3 16,112 178 50 0 0 0 0 3 97 0 1 0 0 67 1644 3.9 – – – – – 1222 1666
Škoda 389,453 3 17,074 177 37 0 0 0 0 5 76 0 2 0 0 65 1650 4.0 – – – – – 1263 1699
Nissan 375,942 3 19,295 172 28 0 0 0 0 10 83 0 16 0 0 74 1703 4.0 – – – – – 1310 1757
Vauxhall 318,633 2 19,814 – 16 0 0.5 0 0 10 97 3 0 0 0 69 1579 3.9 – – – – – 1227 1676
Hyundai 230,398 2 17,276 172 29 0 0.1 0 0 12 79 2 16 0 0 72 1636 4.0 – – – – – 1388 1783
Volvo 226,558 2 31,999 207 39 0 1.6 0 0 33 94 0 5 0 0 113 2220 4.7 – – – – – 1538 1985
Suzuki 200,780 1 13,714 152 12 0 0 0 0 10 48 0 36 0 0 59 1390 3.9 – – – – – 1075 1455
Kia 78,902 1 18,365 172 39 0 0 0 0 23 82 0 16 0 0 84 2007 4.0 – – – – – 1589 1980
Dacia 41,114 0 – – 0 0 0 0 0 0 0 0 0 0 0 – 1397 4.0 – – – – – – –
492 4163 1713 1489 2560 – – – – 4.9 4.3 6.7 5.4 8.9 167 229 530 70 – 397 38 426 33 – – EU-27
485 4243 1725 1491 2589 – – – – 4.9 4.3 7.1 5.7 9.6 176 203 448 62 – 400 38 430 34 – – Germany
485 4173 1709 1478 2564 – – – – 4.9 4.2 7.1 5.7 9.5 174 219 573 79 – 397 39 422 34 – – United Kingdom
469 3994 1684 1494 2497 – – – – 5.0 4.1 6.3 5.2 8.3 157 250 631 72 – 400 35 426 34 – – Italy
525 4128 1727 1497 2572 – – – – 5.0 4.4 6.1 5.0 8.1 156 241 519 74 – 394 39 430 32 – – France
494 4191 1715 1480 2569 – – – – 5.0 4.3 6.4 5.2 8.5 162 229 518 71 – 397 41 425 33 – – Spain
502 – – – 2501 – – – – 5.0 4.4 6.6 5.4 8.8 163 204 600 73 – 397 39 425 34 – – EU-12
533 4171 1705 1491 2564 – – – – 4.9 4.3 7.1 5.7 9.4 172 221 490 65 – 400 36 421 34 – – Netherlands
499 4214 1725 1497 2589 – – – – 5.0 4.3 6.3 5.1 8.4 161 241 537 72 – 391 37 429 33 – – Belgium
505 4258 1726 1507 2590 – – – – 5.0 4.4 6.4 5.2 8.4 164 219 500 67 – 392 36 418 33 – – Austria
466 – – – 2499 – – – – 4.9 4.2 7.0 5.6 9.3 167 315 569 75 – 470 38 428 43 – – Greece
470 4445 1746 1481 2635 – – – – 5.0 4.6 8.3 6.5 11.4 199 202 558 66 – 405 39 429 36 – – Sweden
477 4097 1694 1463 2535 – – – – 5.0 4.6 6.2 5.1 8.1 153 224 502 68 – 400 36 425 33 – – Portugal
499 – – – 2580 – – – – 5.0 4.4 6.9 5.6 9.2 168 201 571 78 – 395 37 498 35 – – Ireland
474 4340 1727 1470 2604 – – – – 5.0 4.5 7.4 5.9 10.1 180 211 509 69 – 399 40 425 34 – – Finland
488 4254 1715 1481 2575 – – – – 5.0 4.4 7.0 5.6 9.5 171 244 535 74 – 393 41 427 33 – – Denmark
487 – – – 2596 – – – – 4.9 4.3 6.8 5.5 9.1 172 231 559 65 – 399 37 425 31 – – Luxembourg
516 4066 1704 1498 2565 – – – – 4.9 4.4 6.2 5.1 8.1 153 299 518 86 – 408 41 432 36 – – Renault
530 4196 1714 1468 2538 – – – – 4.9 4.2 6.2 5.1 8.3 158 140 390 57 – 395 40 418 32 – – VW
493 4077 1699 1462 2543 – – – – 4.9 4.2 6.1 4.9 8.1 152 283 532 72 – 373 34 407 26 – – Peugeot
463 4212 1718 1454 2593 – – – – 4.9 4.5 6.5 5.2 8.8 161 195 476 73 – 447 50 468 39 – – Ford
470 4103 1707 1510 2581 – – – – 5.3 4.4 6.6 5.4 8.7 164 227 357 53 – 414 33 444 34 – – Opel
500 3827 1656 1492 2429 – – – – 5.0 3.8 6.1 5.0 8.0 149 408 773 71 – 389 34 431 35 – – Fiat
511 4165 1709 1518 2604 – – – – 5.0 4.7 6.2 5.0 8.2 155 268 600 83 – 375 37 410 34 – – Citroën
490 4406 1763 1498 2710 – – – – 4.8 4.1 8.0 6.1 11.2 200 249 337 57 – 395 34 430 37 – – Mercedes-Benz
473 4066 1707 1550 2505 – – – – 5.0 4.3 6.7 5.7 8.6 166 217 765 118 – 433 44 460 38 – – Toyota
537 4448 1766 1441 2619 – – – – 4.8 4.3 7.0 5.5 9.6 178 136 584 64 – 360 39 387 28 – – Audi
490 4534 1769 1435 2755 – – – – 4.9 3.9 7.9 6.2 11.0 199 160 535 58 – 398 36 430 37 – – BMW
497 4090 1704 1460 2490 – – – – 5.0 4.2 5.9 4.8 7.8 150 177 361 61 – 400 42 436 32 – – Seat
492 4275 1686 1446 2495 – – – – 5.0 4.9 6.5 5.2 8.7 161 142 598 68 – 384 39 413 30 – – Škoda
495 4201 1698 1518 2523 – – – – 5.1 4.3 7.0 5.8 9.1 175 318 592 58 – 406 29 445 37 – – Nissan
470 4139 1700 1474 2581 – – – – 5.2 4.4 7.0 5.6 9.3 170 – – – – – – – – – – Vauxhall
504 4167 1707 1573 2548 – – – – 5.0 4.6 7.6 6.3 9.8 186 153 403 44 – 433 26 426 36 – – Hyundai
492 4625 1780 1442 2685 – – – – 5.0 4.5 8.1 6.3 11.3 199 251 760 90 – 391 46 411 36 – – Volvo
437 3738 1622 1607 2342 – – – – 4.6 4.2 6.6 5.6 8.5 161 439 375 40 – 368 17 425 39 – – Suzuki
494 4516 1769 1599 2622 – – – – 5.5 4.9 8.2 6.7 10.9 205 – 345 56 – – 41 – – – – Kia
– – – – – – – – – 5.0 4.3 – – – – – – – – – – – – – – Dacia
Tota
l new
sal
es/r
egis
trat
ions
Tota
l new
sal
es/r
egis
trat
ions
[%
]
Pri
ce [
EU
R in
cl. t
ax]
Top
sp
eed
[km
/h]
Die
sel [
%]
Hyb
rid
exc
l. P
HE
V [
%]
Nat
ural
gas
(m
ono
-/b
ival
ent,
incl
. LP
G)
[%]
Flex
-Fue
l (et
hano
l/g
aso
line)
[%
]
Ele
ctri
c/fu
el c
ell i
ncl.
PH
EV
[%
]
Aut
om
atic
[%
]
Fro
nt d
rive
[%
]
Rea
r d
rive
[%
]
4-w
heel
dri
ve [
%]
Eng
ine
pow
er [
KW
]
Eng
ine
size
[cc
m]
Num
ber
of
cylin
der
s
Co
mp
ress
ion
rate
(g
aso
line)
Co
mp
ress
ion
rate
(d
iese
l)
Num
ber
of
gea
rs
Per
form
ance
0–1
00
km
/h (
gas
olin
e) [
s]
Per
form
ance
0–1
00
km
/h (
die
sel)
[s]
Mas
s in
run
ning
ord
er [
kg]
Gro
ss w
eig
ht [
kg]
Pay
load
[kg
]
Leng
th [
mm
]
Wid
th [
mm
]
Hei
ght
[m
m]
Whe
elb
ase
[mm
]
Fro
nt t
rack
[m
m]
Rea
r tr
ack
[mm
]
Foo
tpri
nt [
m2 ]
Bo
ot
volu
me
[l]
Seat
s
Do
ors
Fuel
co
nsum
pti
on
(NE
DC
) [l
/10
0 k
m]
Fuel
co
nsum
pti
on
(ext
ra-u
rban
) [l
/10
0 k
m]
Fuel
co
nsum
pti
on
(urb
an)
[l/1
00
km
]
CO
2 (N
ED
C)
[g/k
m]
CO
(d
iese
l veh
icle
s) [
mg
/km
]
CO
(g
aso
line
vehi
cles
) [m
g/k
m]
HC
(g
aso
line
vehi
cles
) [m
g/k
m]
NH
MC
(g
aso
line
Eur
o 5
/6 v
ehic
les)
[m
g/k
m]
NO
x (d
iese
l veh
icle
s) [
mg
/km
]
NO
x (g
aso
line
vehi
cles
) [m
g/k
m]
HC
+ N
Ox (
die
sel v
ehic
les)
[m
g/k
m]
Par
ticu
late
s (d
iese
l veh
icle
s) [
mg
/km
]
CO
at
-7 °
C (
gas
olin
e ve
hicl
es)
[mg
/km
]
HC
at
-7 °
C (
gas
olin
e ve
hicl
es)
[mg
/km
]
Dir
ect
inje
ctio
n (n
on-
die
sel)
[%
]
Eur
o 5
and
Eur
o 6
[%
]

95 96
EUROPEAN VEHICLE MARKET STATISTICS 2021/22 Annex
2001Passenger cars
EU-27 15,366,229 100 20,060 180 36 0 0.2 0 0 12 85 8 5 – 0 74 1709 4.1 – – – – – 1268 1696
Germany 3,341,209 22 22,452 187 35 0 0.1 0 0 20 76 18 5 – 0 83 1823 4.2 – – – – – 1357 1776
United Kingdom 2,458,372 16 23,001 182 18 0 0.1 0 0 14 86 8 6 – 0 78 1701 4.1 – – – – – 1251 1681
Italy 2,445,319 16 16,574 171 36 0 0.5 0 0.01 10 90 5 5 – 0 65 1557 4.0 – – – – – 1188 1594
France 2,254,732 15 18,285 179 56 0 0.2 0 0.02 5 92 3 4 – 0 71 1748 4.1 – – – – – 1250 1699
Spain 1,506,140 10 17,886 181 53 0 0 0 0 4 89 5 7 – 0 73 1776 4.1 – – – – – 1283 1710
EU-12 852,648 6 16,366 166 11 0 0 0 0 1 67 1 1 – 0 59 1421 4.0 – – – – – 1137 1615
Netherlands 530,287 3 21,629 181 23 0.1 0 0 0 13 91 6 3 – 0 76 1701 4.1 – – – – – 1223 1698
Belgium 488,630 3 18,994 177 62 0 0.1 0 0 14 88 8 4 – 0 72 1785 4.1 – – – – – 1313 1748
Austria 293,527 2 22,766 181 66 0 0 0 0 15 83 8 8 – 0 76 1848 4.1 – – – – – 1366 1794
Greece 280,294 2 15,695 172 1 0 0 0 0 0 90 4 5 – 0 64 1414 4.0 – – – – – 1131 1541
Portugal 255,215 2 20,163 174 29 0 0 0 0 7 92 5 3 – 0 64 1484 4.0 – – – – – 1191 1606
Sweden 246,581 2 22,623 200 6 0.1 1.8 0 0 19 87 6 7 – 0 101 1969 4.3 – – – – – 1427 1847
Ireland 164,573 1 20,203 174 13 0 0 0 0 7 90 5 4 – 0 68 1526 4.0 – – – – – 1209 1648
Finland 109,422 1 26,536 188 17 0 0 0 0 14 91 6 3 – 0 82 1785 4.1 – – – – – 1339 1732
Denmark 96,116 1 31,052 184 18 0 0 0 0.01 14 96 3 1 – 0 78 1716 4.1 – – – – – 1260 1703
Luxembourg 43,164 0 23,631 182 58 0 0 0 0 6 76 12 8 – 0 87 1943 4.3 – – – – – 1382 1835
Renault 1,633,011 11 17,179 178 39 0 0.1 0 0 5 97 0 1 – 0 67 1569 4.0 – – – – – 1206 1653
VW 1,612,741 10 20,459 182 49 0 0 0 0 15 96 0 2 – 0 71 1697 4.0 – – – – – 1271 1734
Peugeot 1,305,918 8 16,847 177 44 0 0 0 0.02 5 99 0 0 – 0 66 1686 4.0 – – – – – 1175 1611
Ford 1,305,093 8 17,865 180 33 0 0 0 0 4 99 0 0 – 0 70 1657 4.0 – – – – – 1255 1668
Opel 1,238,228 8 16,979 175 32 0 0 0 0 6 95 2 1 – 0 66 1576 3.9 – – – – – 1261 1673
Fiat 1,154,674 8 12,365 159 20 0 1.3 0 0 2 99 0 0 – 0 51 1357 4.0 – – – – – 1000 1452
Citroën 879,058 6 17,452 176 51 0 0 0 0.02 3 99 0 0 – 0 66 1705 4.0 – – – – – 1249 1681
Mercedes-Benz 728,830 5 35,437 206 51 0 0 0 0 47 24 69 6 – 0 109 2272 4.5 – – – – – 1571 1971
Toyota 537,364 3 19,016 176 16 0.4 0 0 0 14 85 1 13 – 0 75 1573 4.0 – – – – – 1195 1625
Audi 524,557 3 30,108 204 57 0 0 0 0 24 81 0 18 – 0 101 1978 4.4 – – – – – 1398 1880
BMW 507,035 3 35,453 217 42 0 0 0 0 27 0 93 7 – 0 124 2383 5.2 – – – – – 1615 1992
Seat 420,325 3 15,673 175 48 0 0 0 0 1 98 0 1 – 0 64 1651 4.0 – – – – – 1201 1633
Škoda 407,930 3 16,474 175 39 0 0 0 0 5 88 0 2 – 0 63 1640 4.0 – – – – – 1247 1687
Nissan 386,059 3 18,099 170 28 0 0 0 0 11 87 0 12 – 0 70 1688 4.0 – – – – – 1339 1745
Vauxhall 310,154 2 20,399 – 15 0 0.3 0 0 9 96 3 1 – 0 70 1595 3.9 – – – – – 1233 1673
Volvo 217,773 1 30,425 207 22 0 2.4 0 0 28 95 0 4 – 0 111 2178 4.6 – – – – – 1515 1953
Hyundai 214,059 1 15,357 164 14 0 0 0 0 13 84 2 13 – 0 67 1532 4.0 – – – – – 1364 1692
Suzuki 178,832 1 13,793 150 11 0 0 0 0 9 48 0 37 – 0 60 1407 3.9 – – – – – 1073 1467
Kia 72,780 0 17,113 172 30 0 0 0 0 13 79 0 18 – 0 78 1941 4.0 – – – – – 1451 1882
Dacia 40,821 0 – – 0 0 0 0 0 0 0 0 0 – 0 51 1399 4.0 – – – – – – –
491 4150 1705 1478 2551 – – – – 5.0 4.3 6.8 5.5 9.1 169 246 515 75 – 402 39 430 35 – – EU-27
480 4237 1720 1482 2583 – – – – 4.9 4.2 7.2 5.8 9.8 179 214 414 64 – 403 37 428 35 – – Germany
487 4170 1704 1466 2560 – – – – 5.0 4.2 7.3 5.9 9.8 178 260 586 87 – 407 42 429 35 – – United Kingdom
476 3976 1677 1484 2487 – – – – 5.0 4.1 6.4 5.2 8.4 158 250 615 81 – 400 39 434 36 – – Italy
520 4103 1708 1485 2563 – – – – 5.0 4.4 6.3 5.2 8.4 160 279 537 80 – 401 38 429 34 – – France
495 4172 1705 1468 2562 – – – – 5.0 4.3 6.5 5.3 8.7 164 246 502 73 – 403 40 434 35 – – Spain
502 4242 1712 1452 2477 – – – – 5.0 4.4 6.7 5.4 8.9 164 225 527 74 – 403 38 437 34 – – EU-12
536 4178 1703 1485 2564 – – – – 5.0 4.3 7.1 5.7 9.5 174 238 484 70 – 405 36 428 36 – – Netherlands
496 4217 1716 1488 2578 – – – – 5.0 4.3 6.5 5.2 8.6 165 258 485 76 – 395 39 426 34 – – Belgium
507 4253 1722 1493 2581 – – – – 5.0 4.4 6.5 5.2 8.6 166 226 462 73 – 397 38 422 34 – – Austria
469 – – – 2492 – – – – 4.9 4.2 7.0 5.6 9.3 167 327 516 84 – 452 42 433 42 – – Greece
475 4079 1685 1455 2524 – – – – 5.0 4.5 6.4 5.2 8.5 158 193 482 81 – 407 34 436 34 – – Portugal
464 4441 1742 1472 2628 – – – – 5.0 4.6 8.3 6.5 11.4 200 199 573 72 – 408 41 439 36 – – Sweden
491 – – – 2555 – – – – 5.0 4.3 7.0 5.6 9.3 169 209 546 87 – 390 42 482 35 – – Ireland
473 4337 1724 1457 2598 – – – – 5.0 4.4 7.5 5.9 10.2 181 248 485 73 – 393 43 417 35 – – Finland
504 4248 1714 1477 2574 – – – – 5.0 4.4 7.2 5.7 9.7 174 295 515 78 – 401 43 422 33 – – Denmark
488 – – – 2589 – – – – 4.9 4.3 6.9 5.5 9.3 175 258 464 71 – 403 37 432 35 – – Luxembourg
512 4041 1690 1496 2565 – – – – 4.9 4.4 6.3 5.2 8.3 157 280 496 86 – 403 41 426 35 – – Renault
523 4186 1713 1460 2533 – – – – 4.9 4.2 6.4 5.1 8.6 162 146 267 57 – 406 29 414 34 – – VW
490 4052 1688 1439 2520 – – – – 5.0 4.1 6.3 5.1 8.4 156 372 548 81 – 401 30 440 31 – – Peugeot
471 4231 1717 1443 2599 – – – – 4.9 4.4 6.8 5.4 9.1 166 246 431 73 – 438 46 442 40 – – Ford
469 4103 1695 1502 2574 – – – – 5.3 4.4 6.6 5.4 8.7 164 273 342 53 – 416 40 450 35 – – Opel
507 3801 1650 1484 2421 – – – – 5.0 3.8 6.2 5.1 8.1 149 255 727 86 – 334 46 388 40 – – Fiat
520 4164 1702 1497 2622 – – – – 5.0 4.6 6.4 5.1 8.5 159 333 597 88 – 380 41 419 33 – – Citroën
485 4376 1755 1487 2704 – – – – 4.8 4.1 8.1 6.2 11.5 203 257 317 50 – 398 37 434 38 – – Mercedes-Benz
469 4064 1700 1525 2471 – – – – 5.0 4.3 6.9 5.8 8.9 169 288 769 120 – 464 44 491 44 – – Toyota
536 4412 1760 1443 2601 – – – – 4.8 4.2 7.1 5.6 9.8 181 146 577 67 – 382 42 413 30 – – Audi
480 4542 1766 1427 2752 – – – – 4.9 3.9 8.2 6.4 11.4 204 216 691 81 – 421 47 465 36 – – BMW
488 4076 1684 1455 2483 – – – – 5.0 4.2 6.0 4.9 8.0 153 184 298 57 – 408 39 448 34 – – Seat
496 4267 1685 1444 2480 – – – – 5.0 5.0 6.4 5.1 8.7 160 170 644 74 – 385 40 420 30 – – Škoda
491 4165 1688 1507 2513 – – – – 5.1 4.2 7.1 5.9 9.1 177 207 615 62 – 391 35 422 35 – – Nissan
469 4144 1691 1469 2575 – – – – 5.1 4.4 7.0 5.6 9.4 170 – – – – – – – – – – Vauxhall
485 4612 1773 1434 2678 – – – – 5.0 4.5 8.4 6.5 11.7 203 234 942 108 – 373 48 398 35 – – Volvo
506 4109 1667 1550 2520 – – – – 5.0 4.5 7.6 6.3 9.9 184 150 422 42 – 340 20 374 34 – – Hyundai
444 3752 1630 1607 2342 – – – – 4.6 4.1 6.9 5.8 8.7 167 427 412 44 – 400 25 447 41 – – Suzuki
508 4473 1757 1577 2625 – – – – 5.5 4.8 8.6 7.0 11.3 212 – 343 56 – – 43 – – – – Kia
– – – – 2440 – – – – 5.0 4.3 – – – – – – – – – – – – – – Dacia
Tota
l new
sal
es/r
egis
trat
ions
Tota
l new
sal
es/r
egis
trat
ions
[%
]
Pri
ce [
EU
R in
cl. t
ax]
Top
sp
eed
[km
/h]
Die
sel [
%]
Hyb
rid
exc
l. P
HE
V [
%]
Nat
ural
gas
(m
ono
-/b
ival
ent,
incl
. LP
G)
[%]
Flex
-Fue
l (et
hano
l/g
aso
line)
[%
]
Ele
ctri
c/fu
el c
ell i
ncl.
PH
EV
[%
]
Aut
om
atic
[%
]
Fro
nt d
rive
[%
]
Rea
r d
rive
[%
]
4-w
heel
dri
ve [
%]
Eng
ine
pow
er [
KW
]
Eng
ine
size
[cc
m]
Num
ber
of
cylin
der
s
Co
mp
ress
ion
rate
(g
aso
line)
Co
mp
ress
ion
rate
(d
iese
l)
Num
ber
of
gea
rs
Per
form
ance
0–1
00
km
/h (
gas
olin
e) [
s]
Per
form
ance
0–1
00
km
/h (
die
sel)
[s]
Mas
s in
run
ning
ord
er [
kg]
Gro
ss w
eig
ht [
kg]
Pay
load
[kg
]
Leng
th [
mm
]
Wid
th [
mm
]
Hei
ght
[m
m]
Whe
elb
ase
[mm
]
Fro
nt t
rack
[m
m]
Rea
r tr
ack
[mm
]
Foo
tpri
nt [
m2 ]
Bo
ot
volu
me
[l]
Seat
s
Do
ors
Fuel
co
nsum
pti
on
(NE
DC
) [l
/10
0 k
m]
Fuel
co
nsum
pti
on
(ext
ra-u
rban
) [l
/10
0 k
m]
Fuel
co
nsum
pti
on
(urb
an)
[l/1
00
km
]
CO
2 (N
ED
C)
[g/k
m]
CO
(d
iese
l veh
icle
s) [
mg
/km
]
CO
(g
aso
line
vehi
cles
) [m
g/k
m]
HC
(g
aso
line
vehi
cles
) [m
g/k
m]
NH
MC
(g
aso
line
Eur
o 5
/6 v
ehic
les)
[m
g/k
m]
NO
x (d
iese
l veh
icle
s) [
mg
/km
]
NO
x (g
aso
line
vehi
cles
) [m
g/k
m]
HC
+ N
Ox (
die
sel v
ehic
les)
[m
g/k
m]
Par
ticu
late
s (d
iese
l veh
icle
s) [
mg
/km
]
CO
at
-7 °
C (
gas
olin
e ve
hicl
es)
[mg
/km
]
HC
at
-7 °
C (
gas
olin
e ve
hicl
es)
[mg
/km
]
Dir
ect
inje
ctio
n (n
on-
die
sel)
[%
]
Eur
o 5
and
Eur
o 6
[%
]

97 98
EUROPEAN VEHICLE MARKET STATISTICS 2021/22 Annex
2019Light commercial vehicles
2020Light commercial vehicles
Whe
elb
ase
[mm
]
Whe
elb
ase
[mm
]
Whe
eltr
ack
[mm
]
Whe
eltr
ack
[mm
]
Foo
tpri
nt [
m2 ]
Foo
tpri
nt [
m2 ]
Fuel
co
nsum
pti
on
(NE
DC
) [l
/10
0 k
m]
CO
2 (W
LTP
) [g
/km
]
CO
2 (W
LTP
) [g
/km
]
CO
2 (N
ED
C)
[g/k
m]
CO
2 (N
ED
C)
[g/k
m]
Tota
l new
sal
es/r
egis
trat
ions
Tota
l new
sal
es/r
egis
trat
ions
Tota
l new
sal
es/r
egis
trat
ions
[%
]
Tota
l new
sal
es/r
egis
trat
ions
[%
]
Die
sel [
%]
Die
sel [
%]
Hyb
rid
exc
l. p
lug
-in
hyb
rid
[%
]
Hyb
rid
exc
l. p
lug
-in
hyb
rid
[%
]
Plu
g-i
n/b
atte
ry e
lect
ric/
fuel
cel
l [%
]
Plu
g-i
n hy
bri
d [
%]
Bat
tery
ele
ctri
c/fu
el c
ell [
%]
Nat
ural
gas
(m
ono
-/b
ival
ent,
incl
. LP
G)
[%]
Nat
ural
gas
(m
ono
-/b
ival
ent,
incl
. LP
G)
[%]
Aut
om
atic
[%
]
Aut
om
atic
[%
]
Eng
ine
pow
er [
KW
]
Eng
ine
pow
er [
KW
]
Eng
ine
size
[cc
m]
Eng
ine
size
[cc
m]
Mas
s in
run
ning
ord
er [
kg]
Mas
s in
run
ning
ord
er [
kg]
EU-28 2,002,929 100 93 0.1 1.3 1.3 9 95 1927 1874 3278 1631 5.4 6.1 160 194
France 478,211 24 93 0.3 1.7 0.3 13 89 1834 1758 3157 1617 5.2 5.6 147 178
United Kingdom 368,175 18 97 0 0.9 0 17 97 1967 1957 3263 1644 5.4 6.3 165 197
Germany 303,988 15 92 0.1 2.1 0.8 2 103 2055 2003 3589 1658 6.0 6.6 174 210
Italy 180,534 9 89 0.2 0.6 5.7 0 89 1838 1780 3104 1588 5.0 5.8 157 189
EU-13 180,525 9 91 0 0.3 1.4 4 100 2023 1949 3432 1655 5.7 6.5 171 211
Spain 110,025 5 93 0.1 1.4 4.4 3 85 1850 1785 3156 1604 5.1 5.7 153 182
Belgium 82,285 4 91 0 0.4 1.6 1 83 1699 1478 2800 1642 4.3 5.3 138 160
Netherlands 76,105 4 95 0 1.5 2.0 11 95 1963 1896 3295 1642 5.4 6.0 163 196
Sweden 53,795 3 94 0 2.6 2.0 58 103 1959 1885 3212 1613 5.2 6.0 159 197
Austria 45,417 2 95 0 1.1 0.2 1 100 2017 1969 3326 1653 5.5 6.5 171 205
Portugal 38,454 2 99 0 0.6 0.1 5 84 1787 1671 3068 1580 4.9 5.4 142 166
Denmark 32,742 2 94 0.6 0.8 0 3 100 1906 1886 3238 1643 5.4 6.0 159 195
Ireland 24,946 1 98 0 1.3 0 8 88 1890 1831 3162 1618 5.2 5.9 155 184
Finland 14,721 1 98 0 0.4 0.4 1 102 1965 1984 3343 1646 5.5 6.3 168 204
Greece 7,994 0 93 0 0.1 2.2 0 93 1915 1705 2865 1551 4.3 5.5 152 190
Luxembourg 5,012 0 96 0 1.7 0.2 1 96 1946 1892 3324 1646 5.5 6.1 161 193
Turkey 84,257 53 98 0 0 0.9 12 88 1748 1714 2973 1568 4.7 5.6 150 186
Norway 37,564 24 93 0 5.4 0.1 10 107 2003 1892 3146 1613 5.1 6.0 154 187
Switzerland 35,935 23 86 0 1.6 0.3 30 103 2083 1957 3278 1631 5.4 6.6 173 205
Iceland 1,390 1 88 0 3.4 1.0 41 96 1882 1834 3151 1591 5.0 6.0 157 196
Ford 323,582 16 97 0.1 0 0 12 100 1992 2054 3217 1657 5.3 6.5 172 209
Renault 302,243 15 94 0 3.7 0.1 5 82 1762 1734 3263 1608 5.3 5.6 145 180
VW 222,596 11 94 0 0.2 2.1 15 101 2005 1910 3347 1642 5.5 6.4 172 208
Peugeot 212,230 11 97 0 0.5 0 6 86 1731 1647 3133 1635 5.2 4.9 131 153
Mercedes-Benz 197,819 10 99 0 0.5 0 12 109 2119 2166 3676 1683 6.2 7.3 193 235
Citroën 175,753 9 96 0 0.4 0 5 84 1709 1627 3124 1633 5.1 4.9 130 153
Fiat 173,725 9 84 0 0 5.1 2 87 1821 1770 3283 1647 5.5 5.9 159 204
Iveco 61,990 3 98 0 0 2.4 5 110 2581 2401 3727 1694 6.3 7.9 213 286
Opel 61,822 3 98 0 0 0.3 1 88 1778 1777 3368 1632 5.5 5.7 152 177
Nissan 52,835 3 88 0 10.5 0 26 107 2172 1945 3109 1518 4.7 6.3 159 224
Toyota 49,489 2 94 3.9 0 0 17 103 2174 1959 3079 1563 4.8 6.3 168 224
EU-27 + UK 1,653,233 100 93 0.1 0.1 1.9 1.1 11 97 1951 1922 3315 1646 5.5 160 204
France 401,138 24 93 0.3 0.1 2.2 0.4 15 92 1878 1806 3206 1633 5.3 149 192
United Kingdom 293,632 18 97 0 0.1 1.8 0 18 98 1975 1984 3273 1658 5.5 164 205
Germany 266,717 16 92 0.1 0.1 3.0 0.9 2 105 2061 2048 3624 1671 6.1 172 217
Italy 151,678 9 87 0.2 0 0.7 4.8 1 91 1863 1831 3139 1615 5.1 159 198
EU-13 149,282 9 93 0 0 0.4 0.6 5 104 2057 2033 3468 1671 5.8 174 227
Spain 83,517 5 91 0.1 0 2.0 2.9 3 89 1869 1841 3191 1620 5.2 153 197
Belgium 72,455 4 93 0 0 0.5 1.4 2 90 1692 1666 2956 1649 4.6 136 167
Netherlands 60,198 4 94 0 0.1 2.5 2.2 20 98 2017 1944 3328 1652 5.5 162 205
Austria 39,802 2 95 0 0 1.9 0.2 4 102 2035 2018 3343 1663 5.6 171 215
Sweden 31,033 2 89 0 0.3 6.4 2.5 66 103 1967 1920 3216 1619 5.2 153 190
Denmark 30,675 2 93 0.4 0.5 1.5 0 6 102 1920 1914 3246 1652 5.4 157 200
Portugal 27,576 2 99 0 0 0.9 0 7 89 1816 1748 3133 1595 5.0 145 184
Ireland 21,351 1 95 0 0.1 3.4 0 15 92 1933 1897 3193 1631 5.3 155 193
Finland 12,856 1 97 0.1 0.2 1.0 0.5 5 103 1994 2007 3298 1651 5.5 166 209
Greece 6,875 0 92 0 0 0.2 2.6 0 91 1842 1705 2873 1571 4.4 148 187
Luxembourg 4,448 0 97 0 0 1.4 0.1 3 100 1994 1954 3356 1660 5.6 164 211
Turkey 152,319 71 96 0 0 0 3.8 14 89 1698 1721 2957 1569 4.7 148 182
Norway 31,946 15 91 0 0.1 8.1 0.1 11 109 1979 1921 3167 1616 5.1 151 187
Switzerland 29,111 14 90 0 0 2.6 0.4 33 103 2022 2010 3282 1649 5.4 172 212
Iceland 1,003 1 89 0 0 4.9 0.5 53 104 1965 1927 3178 1602 5.1 160 201
Ford 277,272 17 95 0 0.2 0 0 14 101 1937 2052 3228 1672 5.4 170 206
Renault 231,531 14 93 0.1 0 5.0 0.1 6 87 1904 1812 3349 1627 5.5 152 203
Mercedes-Benz 179,268 11 98 0 0 2.3 0 14 109 2108 2238 3683 1696 6.3 195 243
VW 175,102 11 94 0 0 1.3 2.1 17 102 1994 1959 3384 1645 5.6 176 214
Peugeot 171,342 10 96 0 0 0.8 0 9 89 1762 1682 3149 1644 5.2 132 177
Citroën 145,648 9 94 0 0 0.6 0 8 85 1716 1652 3135 1634 5.2 129 175
Fiat 140,728 9 93 0 0 0 4.5 2 92 1925 1889 3398 1675 5.8 167 215
Opel 58,818 4 96 0 0 0.3 0 4 91 1828 1773 3352 1635 5.5 144 198
Iveco 51,102 3 97 0 0 0 2.5 5 112 2588 2413 3673 1697 6.2 230 296
Toyota 48,483 3 94 2.3 0 0.2 0 14 100 2089 1930 3071 1563 4.8 158 209
Nissan 34,369 2 83 0 0 15.9 0 23 105 2180 1955 3122 1589 5.0 178 218
Data by brand is for the 27 EU Member States and the UK in all tables
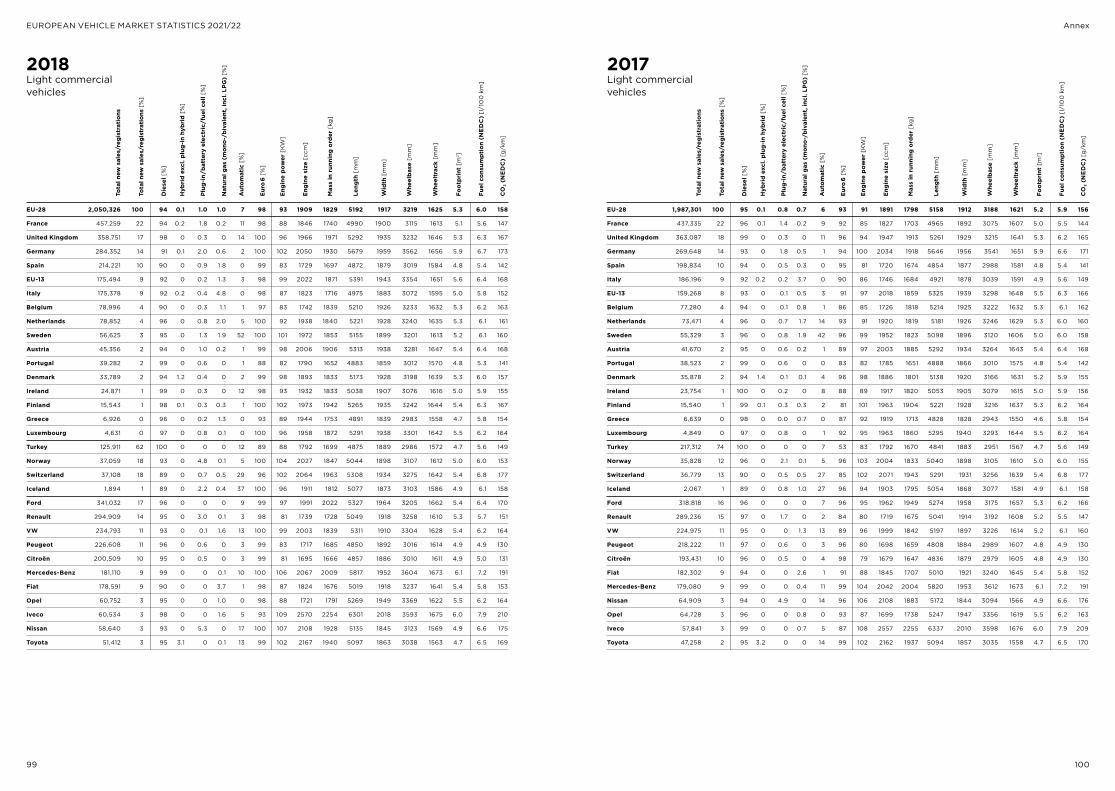
99 100
EUROPEAN VEHICLE MARKET STATISTICS 2021/22 Annex
2018Light commercial vehicles
Leng
th [
mm
]
Wid
th [
mm
]
Whe
elb
ase
[mm
]
Whe
eltr
ack
[mm
]
Foo
tpri
nt [
m2 ]
Fuel
co
nsum
pti
on
(NE
DC
) [l
/10
0 k
m]
CO
2 (N
ED
C)
[g/k
m]
Tota
l new
sal
es/r
egis
trat
ions
Tota
l new
sal
es/r
egis
trat
ions
[%
]
Die
sel [
%]
Hyb
rid
exc
l. p
lug
-in
hyb
rid
[%
]
Plu
g-i
n/b
atte
ry e
lect
ric/
fuel
cel
l [%
]
Nat
ural
gas
(m
ono
-/b
ival
ent,
incl
. LP
G)
[%]
Eur
o 6
[%
]
Aut
om
atic
[%
]
Eng
ine
pow
er [
KW
]
Eng
ine
size
[cc
m]
Mas
s in
run
ning
ord
er [
kg]
EU-28 2,050,326 100 94 0.1 1.0 1.0 7 98 93 1909 1829 5192 1917 3219 1625 5.3 6.0 158
France 457,259 22 94 0.2 1.8 0.2 11 98 88 1846 1740 4990 1900 3115 1613 5.1 5.6 147
United Kingdom 358,751 17 98 0 0.3 0 14 100 96 1966 1971 5292 1935 3232 1646 5.3 6.3 167
Germany 284,352 14 91 0.1 2.0 0.6 2 100 102 2050 1930 5679 1959 3562 1656 5.9 6.7 173
Spain 214,221 10 90 0 0.9 1.8 0 99 83 1729 1697 4872 1879 3019 1584 4.8 5.4 142
EU-13 175,494 9 92 0 0.2 1.3 3 98 99 2022 1871 5391 1943 3354 1651 5.6 6.4 168
Italy 175,378 9 92 0.2 0.4 4.8 0 98 87 1823 1716 4975 1883 3072 1595 5.0 5.8 152
Belgium 78,996 4 90 0 0.3 1.1 1 97 83 1742 1839 5210 1926 3233 1632 5.3 6.2 163
Netherlands 78,852 4 96 0 0.8 2.0 5 100 92 1938 1840 5221 1928 3240 1635 5.3 6.1 161
Sweden 56,625 3 95 0 1.3 1.9 52 100 101 1972 1853 5155 1899 3201 1613 5.2 6.1 160
Austria 45,356 2 94 0 1.0 0.2 1 99 98 2006 1906 5313 1938 3281 1647 5.4 6.4 168
Portugal 39,282 2 99 0 0.6 0 1 88 82 1790 1652 4883 1859 3012 1570 4.8 5.3 141
Denmark 33,789 2 94 1.2 0.4 0 2 99 98 1893 1833 5173 1928 3198 1639 5.3 6.0 157
Ireland 24,871 1 99 0 0.3 0 12 98 93 1932 1833 5038 1907 3076 1616 5.0 5.9 155
Finland 15,543 1 98 0.1 0.3 0.3 1 100 102 1973 1942 5265 1935 3242 1644 5.4 6.3 167
Greece 6,926 0 96 0 0.2 1.3 0 93 89 1944 1753 4891 1839 2983 1558 4.7 5.8 154
Luxembourg 4,631 0 97 0 0.8 0.1 0 100 96 1958 1872 5291 1938 3301 1642 5.5 6.2 164
Turkey 125,911 62 100 0 0 0 12 89 88 1792 1699 4875 1889 2986 1572 4.7 5.6 149
Norway 37,059 18 93 0 4.8 0.1 5 100 104 2027 1847 5044 1898 3107 1612 5.0 6.0 153
Switzerland 37,108 18 89 0 0.7 0.5 29 96 102 2064 1963 5308 1934 3275 1642 5.4 6.8 177
Iceland 1,894 1 89 0 2.2 0.4 37 100 96 1911 1812 5077 1873 3103 1586 4.9 6.1 158
Ford 341,032 17 96 0 0 0 9 99 97 1991 2022 5327 1964 3205 1662 5.4 6.4 170
Renault 294,909 14 95 0 3.0 0.1 3 98 81 1739 1728 5049 1918 3258 1610 5.3 5.7 151
VW 234,793 11 93 0 0.1 1.6 13 100 99 2003 1839 5311 1910 3304 1628 5.4 6.2 164
Peugeot 226,608 11 96 0 0.6 0 3 99 83 1717 1685 4850 1892 3016 1614 4.9 4.9 130
Citroën 200,509 10 95 0 0.5 0 3 99 81 1695 1666 4857 1886 3010 1611 4.9 5.0 131
Mercedes-Benz 181,110 9 99 0 0 0.1 10 100 106 2067 2009 5817 1952 3604 1673 6.1 7.2 191
Fiat 178,591 9 90 0 0 3.7 1 98 87 1824 1676 5019 1918 3237 1641 5.4 5.8 153
Opel 60,752 3 95 0 0 1.0 0 98 88 1721 1791 5269 1949 3369 1622 5.5 6.2 164
Iveco 60,534 3 98 0 0 1.6 5 93 109 2570 2254 6301 2018 3593 1675 6.0 7.9 210
Nissan 58,640 3 93 0 5.3 0 17 100 107 2108 1928 5135 1845 3123 1569 4.9 6.6 175
Toyota 51,412 3 95 3.1 0 0.1 13 99 102 2167 1940 5097 1863 3038 1563 4.7 6.5 169
2017Light commercial vehicles
Leng
th [
mm
]
Wid
th [
mm
]
Whe
elb
ase
[mm
]
Whe
eltr
ack
[mm
]
Foo
tpri
nt [
m2 ]
Fuel
co
nsum
pti
on
(NE
DC
) [l
/10
0 k
m]
CO
2 (N
ED
C)
[g/k
m]
Tota
l new
sal
es/r
egis
trat
ions
Tota
l new
sal
es/r
egis
trat
ions
[%
]
Die
sel [
%]
Hyb
rid
exc
l. p
lug
-in
hyb
rid
[%
]
Plu
g-i
n/b
atte
ry e
lect
ric/
fuel
cel
l [%
]
Nat
ural
gas
(m
ono
-/b
ival
ent,
incl
. LP
G)
[%]
Eur
o 6
[%
]
Aut
om
atic
[%
]
Eng
ine
pow
er [
KW
]
Eng
ine
size
[cc
m]
Mas
s in
run
ning
ord
er [
kg]
EU-28 1,987,301 100 95 0.1 0.8 0.7 6 93 91 1891 1798 5158 1912 3188 1621 5.2 5.9 156
France 437,335 22 96 0.1 1.4 0.2 9 92 85 1827 1703 4965 1892 3075 1607 5.0 5.5 144
United Kingdom 363,087 18 99 0 0.3 0 11 96 94 1947 1913 5261 1929 3215 1641 5.3 6.2 165
Germany 269,648 14 93 0 1.8 0.5 1 94 100 2034 1918 5646 1956 3541 1651 5.9 6.6 171
Spain 198,834 10 94 0 0.5 0.3 0 95 81 1720 1674 4854 1877 2988 1581 4.8 5.4 141
Italy 186,196 9 92 0.2 0.2 3.7 0 90 86 1746 1684 4921 1878 3039 1591 4.9 5.6 149
EU-13 159,268 8 93 0 0.1 0.5 3 91 97 2018 1859 5325 1939 3298 1648 5.5 6.3 166
Belgium 77,280 4 94 0 0.1 0.8 1 86 85 1726 1818 5214 1925 3222 1632 5.3 6.1 162
Netherlands 73,471 4 96 0 0.7 1.7 14 93 91 1920 1819 5181 1926 3246 1629 5.3 6.0 160
Sweden 55,329 3 96 0 0.8 1.9 42 96 99 1952 1823 5098 1896 3120 1606 5.0 6.0 158
Austria 41,670 2 95 0 0.6 0.2 1 89 97 2003 1885 5292 1934 3264 1643 5.4 6.4 168
Portugal 38,523 2 99 0 0.6 0 0 83 82 1785 1651 4888 1866 3010 1575 4.8 5.4 142
Denmark 35,878 2 94 1.4 0.1 0.1 4 96 98 1886 1801 5138 1920 3166 1631 5.2 5.9 155
Ireland 23,754 1 100 0 0.2 0 8 88 89 1917 1820 5053 1905 3079 1615 5.0 5.9 156
Finland 15,540 1 99 0.1 0.3 0.3 2 81 101 1963 1904 5221 1928 3216 1637 5.3 6.2 164
Greece 6,639 0 98 0 0.0 0.7 0 87 92 1919 1713 4828 1828 2943 1550 4.6 5.8 154
Luxembourg 4,849 0 97 0 0.8 0 1 92 95 1963 1860 5295 1940 3293 1644 5.5 6.2 164
Turkey 217,312 74 100 0 0 0 7 53 83 1792 1670 4841 1883 2951 1567 4.7 5.6 149
Norway 35,828 12 96 0 2.1 0.1 5 96 103 2004 1833 5040 1898 3105 1610 5.0 6.0 155
Switzerland 36,779 13 90 0 0.5 0.5 27 85 102 2071 1943 5291 1931 3256 1639 5.4 6.8 177
Iceland 2,067 1 89 0 0.8 1.0 27 96 94 1903 1795 5054 1868 3077 1581 4.9 6.1 158
Ford 318,818 16 96 0 0 0 7 96 95 1962 1949 5274 1958 3175 1657 5.3 6.2 166
Renault 289,236 15 97 0 1.7 0 2 84 80 1719 1675 5041 1914 3192 1608 5.2 5.5 147
VW 224,975 11 95 0 0 1.3 13 89 96 1999 1842 5197 1897 3226 1614 5.2 6.1 160
Peugeot 218,222 11 97 0 0.6 0 3 96 80 1698 1659 4808 1884 2989 1607 4.8 4.9 130
Citroën 193,431 10 96 0 0.5 0 4 98 79 1679 1647 4836 1879 2979 1605 4.8 4.9 130
Fiat 182,302 9 94 0 0 2.6 1 91 88 1845 1707 5010 1921 3240 1645 5.4 5.8 152
Mercedes-Benz 179,080 9 99 0 0 0.4 11 99 104 2042 2004 5820 1953 3612 1673 6.1 7.2 191
Nissan 64,909 3 94 0 4.9 0 14 96 106 2108 1883 5172 1844 3094 1566 4.9 6.6 176
Opel 64,728 3 96 0 0 0.8 0 93 87 1699 1738 5247 1947 3356 1619 5.5 6.2 163
Iveco 57,841 3 99 0 0 0.7 5 87 108 2557 2255 6337 2010 3598 1676 6.0 7.9 209
Toyota 47,258 2 95 3.2 0 0 14 99 102 2162 1937 5094 1857 3035 1558 4.7 6.5 170

101 102
EUROPEAN VEHICLE MARKET STATISTICS 2021/22 Annex
2016Light commercial vehicles
Leng
th [
mm
]
Wid
th [
mm
]
Whe
elb
ase
[mm
]
Whe
eltr
ack
[mm
]
Foo
tpri
nt [
m2 ]
Fuel
co
nsum
pti
on
(NE
DC
) [l
/10
0 k
m]
CO
2 (N
ED
C)
[g/k
m]
Tota
l new
sal
es/r
egis
trat
ions
Tota
l new
sal
es/r
egis
trat
ions
[%
]
Die
sel [
%]
Hyb
rid
exc
l. p
lug
-in
hyb
rid
[%
]
Plu
g-i
n/b
atte
ry e
lect
ric/
fuel
cel
l [%
]
Nat
ural
gas
(m
ono
-/b
ival
ent,
incl
. LP
G)
[%]
Eur
o 6
[%
]
Aut
om
atic
[%
]
Eng
ine
pow
er [
KW
]
Eng
ine
size
[cc
m]
Mas
s in
run
ning
ord
er [
kg]
EU-28 1,915,122 100 96 0.1 0.6 0.8 5 63 88 1913 1780 5148 1909 3178 1617 5.2 6.1 162
France 408,332 21 97 0.1 1.3 0.2 8 71 83 1844 1665 4965 1887 3070 1601 5.0 5.7 148
United Kingdom 375,735 20 100 0 0.3 0 8 52 91 1983 1888 5253 1927 3213 1638 5.3 6.5 174
Germany 257,385 13 95 0.1 0.9 0.5 1 66 97 2054 1921 5631 1953 3529 1648 5.9 6.8 179
Italy 195,631 10 93 0.1 0.3 5.3 0 58 83 1793 1648 4880 1876 3006 1580 4.8 5.7 151
Spain 172,156 9 95 0 0.5 0.2 0 75 78 1731 1664 4849 1875 2979 1577 4.7 5.5 144
EU-13 154,413 8 94 0 0.1 0.4 2 52 95 2072 1845 5316 1936 3289 1647 5.5 6.6 175
Netherlands 70,460 4 97 0 0.4 1.3 11 67 87 1927 1797 5168 1921 3212 1624 5.2 6.2 165
Belgium 69,067 4 95 0 0.1 0.6 1 81 76 1642 1817 5209 1924 3213 1633 5.3 6.1 162
Sweden 51,664 3 96 0 0.7 1.4 33 71 94 1928 1794 5068 1888 3119 1600 5.0 6.1 161
Austria 37,303 2 96 0 1.2 0.3 1 54 94 2036 1877 5285 1933 3252 1641 5.4 6.6 173
Denmark 36,606 2 93 1.2 0.1 0.1 6 69 95 1898 1768 5090 1911 3137 1624 5.1 6.0 158
Portugal 34,890 2 100 0 0.2 0 0 55 78 1763 1623 4835 1857 2970 1567 4.7 5.5 147
Ireland 27,762 1 100 0 0 0 10 60 86 1993 1818 5032 1903 3065 1614 5.0 6.1 163
Finland 13,529 1 98 0 0.4 0.2 0 48 98 1983 1867 5239 1929 3229 1640 5.3 6.4 170
Greece 5,645 0 98 0 0 0.4 0 75 87 1909 1699 4828 1826 2936 1548 4.6 5.8 154
Luxembourg 4,544 0 98 0 0.4 0 0 53 92 1998 1858 5330 1944 3315 1646 5.5 6.5 173
Turkey 210,243 75 100 0 – 0 6 12 82 1793 1677 4849 1886 2956 1568 4.7 5.7 151
Norway 36,062 13 96 0 – 0.2 1 19 101 2031 1831 5020 1891 3083 1603 5.0 6.1 159
Switzerland 33,939 12 90 0 – 0.5 15 35 99 2075 1913 5279 1929 3233 1636 5.3 7.0 182
Iceland 1,752 1 84 0 – 1.5 18 0 87 1857 1697 4943 1854 3029 1573 4.8 6.1 157
Ford 306,246 16 98 0 0 0.1 4 50 91 2031 1921 5265 1962 3176 1658 5.3 6.5 172
Renault 282,496 15 98 0 1.5 0 2 63 78 1719 1651 5047 1912 3201 1605 5.2 5.6 148
VW 217,981 11 97 0 0 1.0 9 70 91 1939 1828 5159 1893 3192 1605 5.1 6.2 165
Fiat 193,977 10 94 0 0 4.3 1 61 85 1849 1645 4965 1913 3205 1636 5.3 6.0 157
Peugeot 193,813 10 98 0 0.4 0 2 61 78 1746 1650 4808 1880 2970 1601 4.8 5.3 140
Citroën 175,614 9 98 0 0.3 0 2 65 76 1727 1640 4830 1874 2973 1600 4.8 5.3 141
Mercedes-Benz 166,797 9 99 0 0 0.4 9 100 102 2045 1993 5842 1953 3618 1672 6.1 7.1 190
Opel 63,674 3 96 0 0 1.2 0 56 84 1701 1733 5238 1943 3346 1616 5.4 6.1 163
Nissan 62,728 3 94 0 4.7 0 13 76 106 2119 1875 5204 1838 3073 1563 4.8 6.7 178
Iveco 56,846 3 99 0 0 1.0 3 25 104 2604 2230 6359 2010 3566 1674 6.0 8.3 222
Vauxhall 37,729 2 100 0 0 0 0 42 80 1645 1689 5138 1943 3263 1614 5.3 6.0 161
2015Light commercial vehicles
Leng
th [
mm
]
Wid
th [
mm
]
Whe
elb
ase
[mm
]
Whe
eltr
ack
[mm
]
Foo
tpri
nt [
m2 ]
Fuel
co
nsum
pti
on
(NE
DC
) [l
/10
0 k
m]
CO
2 (N
ED
C)
[g/k
m]
Tota
l new
sal
es/r
egis
trat
ions
Tota
l new
sal
es/r
egis
trat
ions
[%
]
Die
sel [
%]
Hyb
rid
exc
l. p
lug
-in
hyb
rid
[%
]
Nat
ural
gas
(m
ono
-/b
ival
ent,
incl
. LP
G)
[%]
Flex
-Fue
l (et
hano
l/g
aso
line)
[%
]
Eur
o 6
[%
]
Aut
om
atic
[%
]
Eng
ine
pow
er [
KW
]
Eng
ine
size
[cc
m]
Mas
s in
run
ning
ord
er [
kg]
EU-28 1,704,612 100 97 0 0.5 0 4 31 86 1904 1758 5115 1903 3177 1613 5.2 6.4 168
France 377,407 22 97 0 0.1 0 6 34 80 1825 1630 4898 1879 3044 1595 4.9 5.8 151
United Kingdom 373,120 22 100 0 0 0 6 27 88 1964 1839 5188 1917 3184 1627 5.2 6.7 179
Germany 236,860 14 96 0.1 0.6 0 0 35 95 2044 1921 5634 1945 3558 1646 5.9 7.1 186
Spain 154,848 9 97 0 0 0 0 35 76 1718 1619 4785 1869 2947 1573 4.7 5.6 149
EU-13 132,305 8 93 0 0.5 0 1 23 92 2045 1807 5268 1929 3289 1644 5.4 6.8 179
Italy 123,422 7 92 0.1 3.6 0 0 21 82 1758 1661 4920 1871 3096 1585 4.9 6.1 161
Belgium 62,156 4 96 0 0.5 0 0 36 79 1670 1806 5164 1918 3208 1626 5.2 6.2 164
Netherlands 57,689 3 97 0 1.3 0 9 34 86 1914 1795 5151 1917 3205 1623 5.2 6.4 172
Sweden 44,786 3 95 0 1.6 0 29 33 93 1923 1792 5059 1887 3126 1600 5.0 6.5 171
Austria 34,352 2 96 0 0.5 0 0 21 92 2003 1848 5237 1923 3232 1632 5.3 6.8 180
Denmark 32,447 2 92 1.1 0 0 7 52 93 1883 1736 5037 1901 3115 1617 5.1 6.0 157
Portugal 30,858 2 100 0 0 0 0 26 76 1746 1576 4748 1847 2917 1559 4.6 5.6 147
Ireland 23,336 1 100 0 0 0 10 39 82 1979 1815 5007 1901 3047 1613 4.9 6.3 168
Finland 11,435 1 99 0 0.2 0 7 30 97 2000 1890 5230 1928 3222 1639 5.3 6.8 179
Greece 5,649 0 99 0 0.1 0 0 24 73 1866 1608 4697 1802 2885 1532 4.4 5.8 155
Luxembourg 3,942 0 98 0 0.1 0 0 22 90 1984 1830 5282 1932 3288 1637 5.4 6.7 178
Turkey 220,412 – 100 0 0 0 3 12 79 1755 1631 4808 1884 2960 1562 4.6 5.7 153
Switzerland 34,211 – 90 0 0.4 0 12 19 97 2067 1892 5265 1931 3241 1636 5.3 7.3 190
Norway 33,291 – 96 0 0.1 0 1 35 97 2011 1807 4979 1883 3062 1599 4.9 6.4 166
Renault 256,701 15 97 0 0 0 2 25 77 1723 1645 4981 1911 3155 1604 5.1 5.6 150
Ford 252,085 15 98 0 0 0 2 21 88 2035 1838 5227 1957 3149 1656 5.2 6.6 175
VW 192,364 11 97 0 1.0 0 8 17 89 1867 1888 5210 1894 3224 1610 5.2 6.8 181
Peugeot 174,979 10 99 0 0 0 1 50 75 1739 1628 4765 1869 2943 1593 4.7 5.5 146
Citroën 169,082 10 99 0 0 0 2 28 73 1718 1595 4785 1866 2950 1591 4.7 5.6 149
Fiat 163,652 10 94 0 2.6 0 1 4 85 1889 1659 4911 1902 3250 1627 5.2 6.2 163
Mercedes-Benz 156,316 9 99 0 0.4 0 7 96 100 2041 1998 5870 1953 3638 1673 6.1 7.2 190
Opel 55,903 3 97 0 1.1 0 0 25 83 1692 1705 5204 1940 3338 1617 5.4 6.2 163
Iveco 48,758 3 99 0 1.1 0 1 0 103 2572 2148 6308 2008 3857 1691 6.5 8.4 225
Nissan 45,620 3 93 0 0 0 10 44 98 2109 1764 5068 1825 3049 1556 4.8 7.2 192
Vauxhall 41,737 2 100 0 0 0 0 29 81 1626 1673 5128 1942 3249 1614 5.3 6.1 161

103 104
EUROPEAN VEHICLE MARKET STATISTICS 2021/22 Annex
2014Light commercial vehicles
Leng
th [
mm
]
Wid
th [
mm
]
Whe
elb
ase
[mm
]
Whe
eltr
ack
[mm
]
Foo
tpri
nt [
m2 ]
Fuel
co
nsum
pti
on
(NE
DC
) [l
/10
0 k
m]
CO
2 (N
ED
C)
[g/k
m]
Tota
l new
sal
es/r
egis
trat
ions
Tota
l new
sal
es/r
egis
trat
ions
[%
]
Die
sel [
%]
Hyb
rid
exc
l. p
lug
-in
hyb
rid
[%
]
Nat
ural
gas
(m
ono
-/b
ival
ent,
incl
. LP
G)
[%]
Flex
-Fue
l (et
hano
l/g
aso
line)
[%
]
Eur
o 5
and
Eur
o 6
[%
]
Aut
om
atic
[%
]
Eng
ine
pow
er [
KW
]
Eng
ine
size
[cc
m]
Mas
s in
run
ning
ord
er [
kg]
EU-28 1,552,706 100 96 0 0.6 0 4 99 85 1919 1752 5069 1891 3201 1610 5.2 6.5 171
France 370,129 24 98 0 0.1 0 5 100 78 1833 1642 4852 1872 3044 1592 4.9 5.9 155
United Kingdom 322,650 21 100 0 0 0 5 99 86 1977 1821 5126 1902 3217 1620 5.2 6.8 181
Germany 227,289 15 96 0 0.6 0 0 100 93 2061 1934 5601 1937 3542 1647 5.9 7.2 191
EU-13 142,075 9 90 0 0.2 0 2 100 93 2011 1759 5113 1901 3214 1625 5.3 6.6 175
Spain 113,825 7 99 0 0 0 0 97 75 1734 1608 4747 1849 3041 1568 4.8 5.8 154
Italy 106,027 7 91 0 4.7 0 0 99 81 1794 1620 4905 1867 3094 1589 5.0 6.3 165
Belgium 54,280 3 97 0 0.4 0 0 100 75 1756 1802 5113 1907 3253 1622 5.3 6.0 158
Netherlands 51,749 3 96 0 2.1 0 1 100 85 1966 1804 5104 1901 3403 1618 5.5 6.7 176
Sweden 42,008 3 94 0 1.7 0 31 99 91 1924 1793 5015 1876 3105 1596 5.0 6.7 175
Austria 32,524 2 95 0 0.6 0 0 100 91 2030 1828 5162 1909 3332 1629 5.4 7.0 185
Denmark 28,470 2 94 0.5 0.1 0 7 99 91 1932 1748 4982 1891 3125 1615 5.1 6.2 162
Portugal 26,166 2 100 0 0 0 0 98 74 1731 1554 4676 1830 2899 1552 4.5 5.6 148
Ireland 16,458 1 99 0 0 0 9 99 81 1966 1777 4941 1886 3234 1605 5.2 6.4 170
Finland 10,625 1 99 0 0.1 0 4 100 95 2015 1903 5173 1911 3263 1630 5.3 6.9 184
Greece 4,904 0 98 0 0 0 0 97 77 1861 1596 4684 1790 2956 1535 4.6 5.2 137
Luxembourg 3,527 0 98 0 0.3 0 0 100 90 2029 1859 5291 1936 3393 1647 5.6 7.0 184
Turkey 163,969 – 100 0 0 0 3 98 79 1778 1556 4653 1853 3004 1545 4.7 5.9 157
Switzerland 31,575 – 89 0 0.5 0 11 100 95 2092 1884 5198 1920 3205 1637 5.3 7.4 194
Norway 29,622 – 96 0 0.1 0 1 100 95 2001 1809 4929 1875 3291 1596 5.3 6.6 172
Renault 222,659 14 97 0 0 0 2 99 75 1795 1688 4903 1895 3196 1601 5.2 5.9 157
VW 204,449 13 97 0 1.0 0 6 100 87 1853 1896 5169 1883 3559 1605 5.7 6.8 181
Ford 202,852 13 99 0 0 0 1 100 86 2057 1872 5202 1945 3141 1662 5.2 6.7 177
Citroën 160,400 10 99 0 0 0 2 98 71 1698 1572 4736 1859 2923 1582 4.7 5.6 148
Peugeot 159,855 10 99 0 0 0 1 100 73 1723 1603 4725 1864 2924 1587 4.7 5.6 149
Fiat 152,364 10 94 0 3.0 0 1 98 84 1856 1518 4989 1909 3193 1639 5.3 6.2 163
Mercedes-Benz 144,011 9 99 0 0.3 0 5 100 100 2107 1954 5901 1950 3662 1671 6.1 7.5 201
Opel 48,117 3 96 0 1.4 0 0 100 81 1825 1738 5053 1910 3305 1614 5.4 6.6 176
Nissan 42,522 3 95 0 0 0 12 100 99 2100 1807 5093 1830 3080 1565 4.8 7.3 193
Iveco 39,130 3 99 0 0.4 0 0 99 101 2559 2146 6098 1997 3548 1653 5.9 8.7 232
Toyota 36,329 2 94 0.7 0.1 0 12 99 106 2433 1877 5038 1788 2984 1524 4.5 7.2 189
2013Light commercial vehicles
Leng
th [
mm
]
Wid
th [
mm
]
Whe
elb
ase
[mm
]
Whe
eltr
ack
[mm
]
Foo
tpri
nt [
m2 ]
Fuel
co
nsum
pti
on
(NE
DC
) [l
/10
0 k
m]
CO
2 (N
ED
C)
[g/k
m]
Tota
l new
sal
es/r
egis
trat
ions
Tota
l new
sal
es/r
egis
trat
ions
[%
]
Die
sel [
%]
Hyb
rid
exc
l. P
HE
V [
%]
Nat
ural
gas
(m
ono
-/b
ival
ent,
incl
. LP
G)
[%]
Flex
-Fue
l (et
hano
l/g
aso
line)
[%
]
Eur
o 5
and
Eur
o 6
[%
]
Aut
om
atic
[%
]
Eng
ine
pow
er [
KW
]
Eng
ine
size
[cc
m]
Mas
s in
run
ning
ord
er [
kg]
EU-28 1,370,998 100 97 0 0.6 0 3 99 84 1925 1746 5040 1883 3202 1603 5.2 6.6 175
France 364,814 27 97 0 0.1 0 4 99 77 1827 1632 4789 1865 3037 1585 4.9 6.1 159
United Kingdom 270,782 20 100 0 0 0 4 99 85 1987 1817 5120 1890 3227 1612 5.2 7.0 186
Germany 211,895 15 96 0 0.6 0 0 100 92 2055 1896 5577 1926 3515 1639 5.8 7.4 195
EU-13 104,918 8 91 0 0.5 0 1 99 89 2020 1785 5142 1904 3283 1628 5.4 7.0 184
Italy 88,973 6 93 0 4.7 0 0 99 84 1854 1616 4730 1837 2986 1559 4.7 6.2 164
Spain 85,402 6 99 0 0.1 0 0 91 75 1764 1614 4754 1841 3056 1566 4.8 6.1 161
Belgium 54,444 4 97 0 0.1 0 0 100 71 1744 1804 5100 1907 3267 1621 5.3 5.8 153
Netherlands 50,553 4 97 0 1.6 0 0 99 84 1936 1796 5079 1898 3413 1613 5.5 6.8 180
Sweden 37,395 3 94 0 1.6 0.1 31 98 92 1963 1796 5025 1873 3105 1592 5.0 6.9 183
Austria 31,933 2 95 0 0.7 0 0 99 90 2038 1834 5132 1902 3357 1621 5.4 7.2 189
Denmark 23,712 2 95 0.2 0 0 8 98 90 1960 1759 4959 1885 3134 1611 5.1 6.5 170
Portugal 18,202 1 100 0 0 0 0 96 75 1772 1579 4719 1828 2933 1551 4.5 5.8 155
Ireland 10,863 1 98 0 0 0 7 99 80 1969 1787 4900 1875 3232 1596 5.2 6.5 173
Finland 10,411 1 99 0.1 0.2 0 2 100 94 2021 1871 5124 1904 3287 1627 5.4 7.0 186
Greece 3,433 0 96 0 0.1 0 0 93 85 1900 1631 4750 1780 2977 1531 4.6 6.0 160
Luxembourg 3,268 0 97 0 0.2 0 0 100 90 2034 1838 5223 1929 3398 1643 5.6 7.1 187
Switzerland 31,735 – 90 0 0.6 0 10 99 95 2111 1877 5144 1914 3212 1632 5.3 7.6 199
Norway 30,862 – 98 0 0.1 0 1 100 96 2023 1824 4886 1873 3298 1593 5.3 6.8 178
Renault 203,078 15 96 0 0 0 3 97 74 1816 1693 4881 1890 3191 1596 5.1 6.3 166
VW 182,230 13 96 0 1.9 0 5 100 87 1848 1894 5155 1882 3559 1604 5.7 6.9 183
Ford 161,218 12 100 0 0 0 1 100 86 2127 1876 5299 1927 3196 1656 5.3 7.1 188
Peugeot 148,751 11 99 0 0 0 1 98 72 1706 1585 4708 1859 2917 1584 4.7 5.7 150
Citroën 145,124 11 98 0 0 0 1 99 70 1686 1554 4717 1854 2907 1578 4.6 5.7 150
Fiat 134,034 10 95 0 1.7 0 1 96 83 1833 1531 4650 1889 3165 1613 5.1 6.1 162
Mercedes-Benz 130,421 10 99 0 0.2 0 4 100 99 2108 1931 5846 1946 3649 1667 6.1 7.9 209
Nissan 42,650 3 99 0 0.1 0 10 100 100 2080 1801 5088 1826 3071 1565 4.8 7.3 194
Opel 41,800 3 97 0 0.7 0 0 100 80 1841 1725 5054 1903 3291 1610 5.3 6.7 179
Iveco 37,005 3 98 0 1.8 0 0 100 99 2569 2146 6079 1996 3523 1649 5.8 8.5 228
Vauxhall 29,736 2 100 0 0 0 1 95 78 1854 1691 4917 1892 3195 1603 5.1 6.8 181
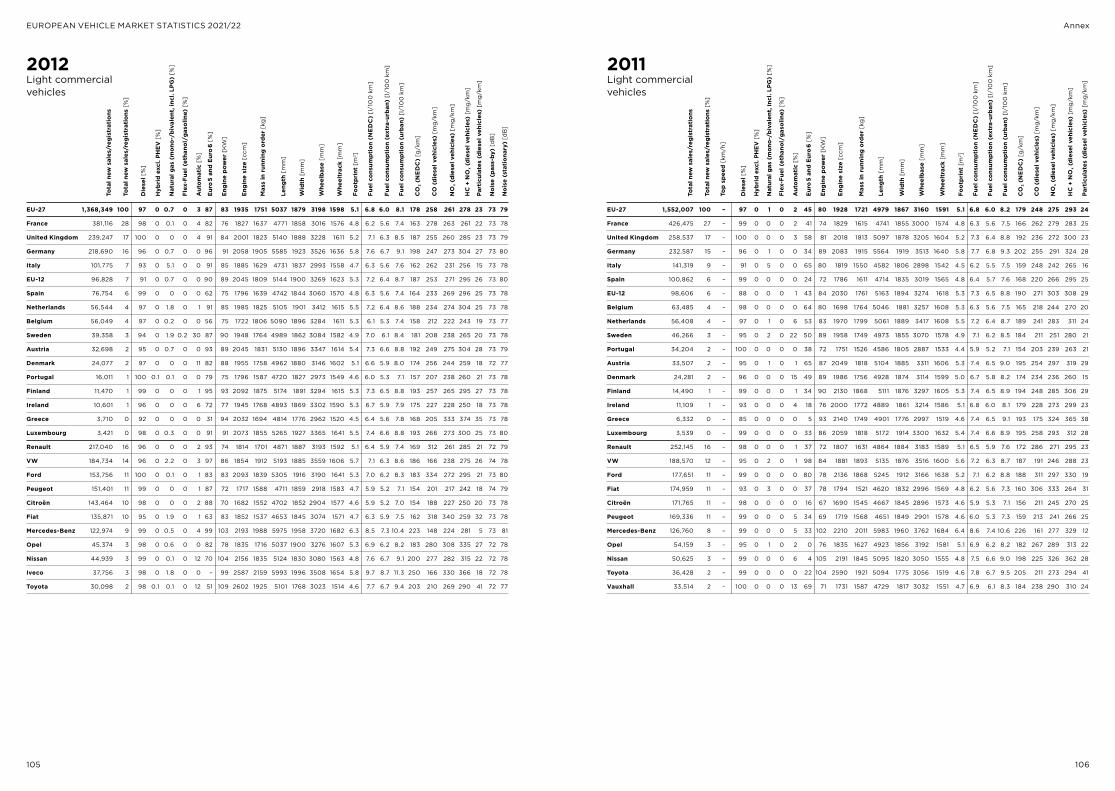
105 106
EUROPEAN VEHICLE MARKET STATISTICS 2021/22 Annex
2012Light commercial vehicles
Leng
th [
mm
]
Wid
th [
mm
]
Whe
elb
ase
[mm
]
Whe
eltr
ack
[mm
]
Foo
tpri
nt [
m2 ]
Fuel
co
nsum
pti
on
(NE
DC
) [l
/10
0 k
m]
Fuel
co
nsum
pti
on
(ext
ra-u
rban
) [l
/10
0 k
m]
Fuel
co
nsum
pti
on
(urb
an)
[l/1
00
km
]
CO
2 (N
ED
C)
[g/k
m]
CO
(d
iese
l veh
icle
s) [
mg
/km
]
NO
x (d
iese
l veh
icle
s) [
mg
/km
]
HC
+ N
Ox (
die
sel v
ehic
les)
[m
g/k
m]
Par
ticu
late
s (d
iese
l veh
icle
s) [
mg
/km
]
No
ise
(pas
s-by
) [d
B]
No
ise
(sta
tio
nary
) [d
B]
Tota
l new
sal
es/r
egis
trat
ions
Tota
l new
sal
es/r
egis
trat
ions
[%
]
Die
sel [
%]
Hyb
rid
exc
l. P
HE
V [
%]
Nat
ural
gas
(m
ono
-/b
ival
ent,
incl
. LP
G)
[%]
Flex
-Fue
l (et
hano
l/g
aso
line)
[%
]
Eur
o 5
and
Eur
o 6
[%
]
Aut
om
atic
[%
]
Eng
ine
pow
er [
KW
]
Eng
ine
size
[cc
m]
Mas
s in
run
ning
ord
er [
kg]
EU-27 1,368,349 100 97 0 0.7 0 3 87 83 1935 1751 5037 1879 3198 1598 5.1 6.8 6.0 8.1 178 258 261 278 23 73 79
France 381,116 28 98 0 0.1 0 4 82 76 1827 1637 4771 1858 3016 1576 4.8 6.2 5.6 7.4 163 278 263 261 22 73 78
United Kingdom 239,247 17 100 0 0 0 4 91 84 2001 1823 5140 1888 3228 1611 5.2 7.1 6.3 8.5 187 255 260 285 23 73 79
Germany 218,690 16 96 0 0.7 0 0 96 91 2058 1905 5585 1923 3526 1636 5.8 7.6 6.7 9.1 198 247 273 304 27 73 80
Italy 101,775 7 93 0 5.1 0 0 91 85 1885 1629 4731 1837 2993 1558 4.7 6.3 5.6 7.6 162 262 231 256 15 73 78
EU-12 96,828 7 91 0 0.7 0 0 90 89 2045 1809 5144 1900 3269 1623 5.3 7.2 6.4 8.7 187 253 271 295 26 73 80
Spain 76,754 6 99 0 0 0 0 62 75 1796 1639 4742 1844 3060 1570 4.8 6.3 5.6 7.4 164 233 269 296 25 73 78
Netherlands 56,544 4 97 0 1.8 0 1 91 85 1985 1825 5105 1901 3412 1615 5.5 7.2 6.4 8.6 188 234 274 304 25 73 78
Belgium 56,049 4 97 0 0.2 0 0 56 75 1722 1806 5090 1896 3284 1611 5.3 6.1 5.3 7.4 158 212 222 243 19 73 77
Sweden 39,358 3 94 0 1.9 0.2 30 87 90 1948 1764 4989 1862 3084 1582 4.9 7.0 6.1 8.4 181 208 238 265 20 73 78
Austria 32,698 2 95 0 0.7 0 0 93 89 2045 1831 5130 1896 3347 1614 5.4 7.3 6.6 8.8 192 249 275 304 28 73 79
Denmark 24,077 2 97 0 0 0 11 82 88 1955 1758 4962 1880 3146 1602 5.1 6.6 5.9 8.0 174 256 244 259 18 72 77
Portugal 16,011 1 100 0.1 0.1 0 0 79 75 1796 1587 4720 1827 2973 1549 4.6 6.0 5.3 7.1 157 207 238 260 21 73 78
Finland 11,470 1 99 0 0 0 1 95 93 2092 1875 5174 1891 3294 1615 5.3 7.3 6.5 8.8 193 257 265 295 27 73 78
Ireland 10,601 1 96 0 0 0 6 72 77 1945 1768 4893 1869 3302 1590 5.3 6.7 5.9 7.9 175 227 228 250 18 73 78
Greece 3,710 0 92 0 0 0 0 31 94 2032 1694 4814 1776 2962 1520 4.5 6.4 5.6 7.8 168 205 333 374 35 73 78
Luxembourg 3,421 0 98 0 0.3 0 0 91 91 2073 1855 5265 1927 3365 1641 5.5 7.4 6.6 8.8 193 266 273 300 25 73 80
Renault 217,040 16 96 0 0 0 2 93 74 1814 1701 4871 1887 3193 1592 5.1 6.4 5.9 7.4 169 312 261 285 21 72 79
VW 184,734 14 96 0 2.2 0 3 97 86 1854 1912 5193 1885 3559 1606 5.7 7.1 6.3 8.6 186 166 238 275 26 74 78
Ford 153,756 11 100 0 0.1 0 1 83 83 2093 1839 5305 1916 3190 1641 5.3 7.0 6.2 8.3 183 334 272 295 21 73 80
Peugeot 151,401 11 99 0 0 0 1 87 72 1717 1588 4711 1859 2918 1583 4.7 5.9 5.2 7.1 154 201 217 242 18 74 79
Citroën 143,464 10 98 0 0 0 2 88 70 1682 1552 4702 1852 2904 1577 4.6 5.9 5.2 7.0 154 188 227 250 20 73 78
Fiat 135,871 10 95 0 1.9 0 1 63 83 1852 1537 4653 1845 3074 1571 4.7 6.3 5.9 7.5 162 318 340 259 32 73 78
Mercedes-Benz 122,974 9 99 0 0.5 0 4 99 103 2193 1988 5975 1958 3720 1682 6.3 8.5 7.3 10.4 223 148 224 281 5 73 81
Opel 45,374 3 98 0 0.6 0 0 82 78 1835 1716 5037 1900 3276 1607 5.3 6.9 6.2 8.2 183 280 308 335 27 72 78
Nissan 44,939 3 99 0 0.1 0 12 70 104 2156 1835 5124 1830 3080 1563 4.8 7.6 6.7 9.1 200 277 282 315 22 72 78
Iveco 37,756 3 98 0 1.8 0 0 – 99 2587 2159 5993 1996 3508 1654 5.8 9.7 8.7 11.3 250 166 330 366 18 72 78
Toyota 30,098 2 98 0.1 0.1 0 12 51 109 2602 1925 5101 1768 3023 1514 4.6 7.7 6.7 9.4 203 210 269 290 41 72 77
2011Light commercial vehicles
Leng
th [
mm
]
Wid
th [
mm
]
Whe
elb
ase
[mm
]
Whe
eltr
ack
[mm
]
Foo
tpri
nt [
m2 ]
Fuel
co
nsum
pti
on
(NE
DC
) [l
/10
0 k
m]
Fuel
co
nsum
pti
on
(ext
ra-u
rban
) [l
/10
0 k
m]
Fuel
co
nsum
pti
on
(urb
an)
[l/1
00
km
]
CO
2 (N
ED
C)
[g/k
m]
CO
(d
iese
l veh
icle
s) [
mg
/km
]
NO
x (d
iese
l veh
icle
s) [
mg
/km
]
HC
+ N
Ox (
die
sel v
ehic
les)
[m
g/k
m]
Par
ticu
late
s (d
iese
l veh
icle
s) [
mg
/km
]
Tota
l new
sal
es/r
egis
trat
ions
Tota
l new
sal
es/r
egis
trat
ions
[%
]
Top
sp
eed
[km
/h]
Die
sel [
%]
Hyb
rid
exc
l. P
HE
V [
%]
Nat
ural
gas
(m
ono
-/b
ival
ent,
incl
. LP
G)
[%]
Flex
-Fue
l (et
hano
l/g
aso
line)
[%
]
Eur
o 5
and
Eur
o 6
[%
]
Aut
om
atic
[%
]
Eng
ine
pow
er [
KW
]
Eng
ine
size
[cc
m]
Mas
s in
run
ning
ord
er [
kg]
EU-27 1,552,007 100 – 97 0 1 0 2 45 80 1928 1721 4979 1867 3160 1591 5.1 6.8 6.0 8.2 179 248 275 293 24
France 426,475 27 – 99 0 0 0 2 41 74 1829 1615 4741 1855 3000 1574 4.8 6.3 5.6 7.5 166 262 279 283 25
United Kingdom 258,537 17 – 100 0 0 0 3 58 81 2018 1813 5097 1878 3205 1604 5.2 7.3 6.4 8.8 192 236 272 300 23
Germany 232,587 15 – 96 0 1 0 0 34 89 2083 1915 5564 1919 3513 1640 5.8 7.7 6.8 9.3 202 255 291 324 28
Italy 141,319 9 – 91 0 5 0 0 65 80 1819 1550 4582 1806 2898 1542 4.5 6.2 5.5 7.5 159 248 242 265 16
Spain 100,862 6 – 99 0 0 0 0 24 72 1786 1611 4714 1835 3019 1565 4.8 6.4 5.7 7.6 168 220 266 295 25
EU-12 98,606 6 – 88 0 0 0 1 43 84 2030 1761 5163 1894 3274 1618 5.3 7.3 6.5 8.8 190 271 303 308 29
Belgium 63,485 4 – 98 0 0 0 0 64 80 1698 1764 5046 1881 3257 1608 5.3 6.3 5.6 7.5 165 218 244 270 20
Netherlands 56,408 4 – 97 0 1 0 6 53 83 1970 1799 5061 1889 3417 1608 5.5 7.2 6.4 8.7 189 241 283 311 24
Sweden 46,266 3 – 95 0 2 0 22 50 89 1958 1749 4973 1855 3070 1578 4.9 7.1 6.2 8.5 184 211 251 280 21
Portugal 34,204 2 – 100 0 0 0 0 38 72 1751 1526 4586 1805 2887 1533 4.4 5.9 5.2 7.1 154 203 239 263 21
Austria 33,507 2 – 95 0 1 0 1 65 87 2049 1818 5104 1885 3311 1606 5.3 7.4 6.5 9.0 195 254 297 319 29
Denmark 24,281 2 – 96 0 0 0 15 49 89 1986 1756 4928 1874 3114 1599 5.0 6.7 5.8 8.2 174 234 236 260 15
Finland 14,490 1 – 99 0 0 0 1 34 90 2130 1868 5111 1876 3297 1605 5.3 7.4 6.5 8.9 194 248 285 306 29
Ireland 11,109 1 – 93 0 0 0 4 18 76 2000 1772 4889 1861 3214 1586 5.1 6.8 6.0 8.1 179 228 273 299 23
Greece 6,332 0 – 85 0 0 0 0 5 93 2140 1749 4901 1776 2997 1519 4.6 7.4 6.5 9.1 193 175 324 365 38
Luxembourg 3,539 0 – 99 0 0 0 0 33 86 2059 1818 5172 1914 3300 1632 5.4 7.4 6.6 8.9 195 258 293 312 28
Renault 252,145 16 – 98 0 0 0 1 37 72 1807 1631 4864 1884 3183 1589 5.1 6.5 5.9 7.6 172 286 271 295 23
VW 188,570 12 – 95 0 2 0 1 98 84 1881 1893 5135 1876 3516 1600 5.6 7.2 6.3 8.7 187 191 246 288 23
Ford 177,651 11 – 99 0 0 0 0 80 78 2136 1868 5245 1912 3166 1638 5.2 7.1 6.2 8.8 188 311 297 330 19
Fiat 174,959 11 – 93 0 3 0 0 37 78 1794 1521 4620 1832 2996 1569 4.8 6.2 5.6 7.3 160 306 333 264 31
Citroën 171,765 11 – 98 0 0 0 0 16 67 1690 1545 4667 1845 2896 1573 4.6 5.9 5.3 7.1 156 211 245 270 25
Peugeot 169,336 11 – 99 0 0 0 5 34 69 1719 1568 4651 1849 2901 1578 4.6 6.0 5.3 7.3 159 213 241 266 25
Mercedes-Benz 126,760 8 – 99 0 0 0 5 33 102 2210 2011 5983 1960 3762 1684 6.4 8.6 7.4 10.6 226 161 277 329 12
Opel 54,159 3 – 95 0 1 0 2 0 76 1835 1627 4923 1856 3192 1581 5.1 6.9 6.2 8.2 182 267 289 313 22
Nissan 50,625 3 – 99 0 0 0 6 4 105 2191 1845 5095 1820 3050 1555 4.8 7.5 6.6 9.0 198 225 326 362 28
Toyota 36,428 2 – 99 0 0 0 0 22 104 2590 1921 5094 1775 3056 1519 4.6 7.8 6.7 9.5 205 211 273 294 41
Vauxhall 33,514 2 – 100 0 0 0 13 69 71 1731 1587 4729 1817 3032 1551 4.7 6.9 6.1 8.3 184 238 290 310 24

107 108
EUROPEAN VEHICLE MARKET STATISTICS 2021/22 Annex
2010Light commercial vehicles
Leng
th [
mm
]
Wid
th [
mm
]
Whe
elb
ase
[mm
]
Whe
eltr
ack
[mm
]
Foo
tpri
nt [
m2 ]
Fuel
co
nsum
pti
on
(NE
DC
) [l
/10
0 k
m]
Fuel
co
nsum
pti
on
(ext
ra-u
rban
) [l
/10
0 k
m]
Fuel
co
nsum
pti
on
(urb
an)
[l/1
00
km
]
CO
2 (N
ED
C)
[g/k
m]
CO
(d
iese
l veh
icle
s) [
mg
/km
]
NO
x (d
iese
l veh
icle
s) [
mg
/km
]
HC
+ N
Ox (
die
sel v
ehic
les)
[m
g/k
m]
Par
ticu
late
s (d
iese
l veh
icle
s) [
mg
/km
]
Tota
l new
sal
es/r
egis
trat
ions
Tota
l new
sal
es/r
egis
trat
ions
[%
]
Top
sp
eed
[km
/h]
Die
sel [
%]
Hyb
rid
exc
l. P
HE
V [
%]
Nat
ural
gas
(m
ono
-/b
ival
ent,
incl
. LP
G)
[%]
Flex
-Fue
l (et
hano
l/g
aso
line)
[%
]
Eur
o 5
and
Eur
o 6
[%
]
Aut
om
atic
[%
]
Eng
ine
pow
er [
KW
]
Eng
ine
size
[cc
m]
Mas
s in
run
ning
ord
er [
kg]
EU-27 1,480,685 100 156 96 0 2 0 3 5 78 1932 1665 4868 1862 3056 1586 4.9 6.9 6.0 8.4 180 226 283 301 25
France 414,911 28 159 99 0 0 0 3 4 73 1828 1557 4661 1846 2920 1572 4.6 6.2 5.4 7.4 162 226 268 288 24
United Kingdom 222,915 15 150 100 0 0 0 3 3 79 2024 1773 4992 1883 3119 1604 5.0 7.4 6.5 9.0 195 221 287 312 23
Germany 196,552 13 152 96 0 1 0 1 6 87 2106 1926 5494 1922 3495 1645 5.8 8.0 6.9 9.9 210 241 308 324 25
Italy 166,529 11 157 82 0 15 0 0 14 75 1858 1592 4670 1830 2924 1557 4.6 6.9 6.0 8.5 175 275 312 302 28
Spain 115,924 8 155 99 0 0 0 0 1 71 1801 1586 4683 1848 2877 1564 4.6 6.4 5.6 7.8 170 196 272 302 24
EU-12 95,183 6 157 96 0 0 0 1 1 76 1927 1576 4718 1834 2960 1565 4.6 6.5 5.7 8.0 172 220 275 292 26
Belgium 54,841 4 157 92 0 0 0 2 1 81 1804 1589 4722 1835 2918 1557 4.6 6.9 5.9 8.6 181 194 256 283 27
Netherlands 49,607 3 153 98 0 1 0 9 7 82 2040 1766 4925 1887 3146 1607 5.1 7.4 6.5 9.1 196 213 276 303 19
Portugal 45,669 3 159 100 0 0 0 1 1 72 1816 1507 4581 1810 2862 1541 4.4 6.2 5.4 7.5 163 200 263 280 24
Sweden 37,975 3 161 94 0 3 0 17 6 87 2009 1725 4809 1854 3065 1579 4.8 7.3 6.3 9.0 190 184 274 305 22
Austria 29,055 2 154 97 0 1 0 3 5 85 2084 1814 5079 1895 3165 1619 5.2 7.6 6.6 9.2 199 235 307 314 28
Denmark 16,198 1 162 99 0 0 0 24 4 88 1995 1696 4881 1858 2868 1588 4.9 7.1 6.2 8.8 188 174 330 341 26
Finland 11,050 1 157 100 0 0 0 4 14 89 2154 1855 5075 1874 3231 1605 5.2 7.8 6.7 9.7 206 206 288 307 26
Greece 10,644 1 164 84 0 0 0 7 0 93 2214 1740 4952 1770 2984 1510 4.5 7.8 6.7 9.8 203 172 349 383 40
Ireland 10,387 1 156 100 0 0 0 5 1 85 2145 1701 4805 1872 3003 1587 4.8 7.2 6.3 8.9 191 206 313 341 26
Luxembourg 3,245 0 153 98 0 0 0 0 0 84 2089 1740 5018 1900 3109 1622 5.2 7.3 6.4 8.7 192 247 325 311 31
Renault 240,489 16 159 98 0 0 0 1 0 69 1774 1493 4518 1843 2941 1558 4.6 5.8 5.3 6.7 153 222 257 280 23
Citroën 172,618 12 156 97 0 0 0 1 0 66 1670 1495 4581 1827 2852 1562 4.5 6.0 5.3 7.3 158 205 247 271 26
Fiat 170,345 12 157 87 0 11 0 0 3 75 1787 1519 4631 1834 2968 1571 4.7 6.3 5.6 7.7 162 316 345 285 33
Peugeot 164,514 11 158 99 0 0 0 0 0 66 1679 1551 4582 1852 2862 1585 4.6 6.0 5.3 7.4 159 209 240 267 25
Ford 160,911 11 148 99 0 0 0 0 0 76 2104 1424 4974 1942 3090 1633 5.1 7.4 6.5 9.0 196 287 317 350 24
VW 155,586 11 156 97 0 1 0 5 28 82 2004 1893 5123 1877 3201 1611 5.2 7.6 6.5 9.6 200 182 258 299 12
Mercedes-Benz 119,969 8 150 99 0 0 0 5 16 99 2205 2032 5939 1962 3727 1683 6.3 9.2 7.7 11.7 243 133 400 424 27
Opel 48,734 3 158 96 0 2 0 2 0 73 1761 1244 4362 1813 3072 1550 4.8 6.4 5.6 7.8 168 237 279 302 21
Iveco 44,638 3 156 99 0 1 0 6 0 97 2556 2341 6104 1995 3520 1689 5.9 9.6 8.6 11.2 254 168 376 407 26
Nissan 39,131 3 157 99 0 0 0 0 0 96 2175 1804 5189 1809 3074 1524 4.7 7.1 6.5 8.1 188 206 353 400 36
Toyota 35,321 2 160 99 0 0 0 13 0 98 2547 1920 5204 1769 3088 1518 4.8 8.4 7.2 10.5 222 189 308 329 42
2009Light commercial vehicles
EU-27 1,313,122 100 155 96 0 1 0 5 3 76 1948 1609 4796 1859 3007 1583 4.8 7.0 6.1 8.5 185 210 270 298 21
France 368,644 28 158 98 0 0 0 2 1 70 1822 1464 4600 1837 2892 1564 4.5 6.4 5.5 7.6 168 206 252 278 21
United Kingdom 184,701 14 150 99 0 0 0 3 2 78 2061 1729 4984 1884 3110 1605 5.0 7.6 6.6 9.3 203 223 289 319 20
Germany 166,678 13 153 94 0 1 0 10 13 84 2106 1816 5186 1912 3237 1633 5.3 7.9 6.9 9.8 207 222 302 334 21
Italy 164,011 12 154 87 0 9 0 6 1 76 1889 1579 4651 1825 2928 1561 4.6 7.0 5.9 8.5 180 207 267 296 21
Spain 105,515 8 155 99 0 0 0 4 0 71 1845 1577 4628 1854 2918 1577 4.6 6.7 5.8 8.0 176 215 255 286 21
EU-12 97,678 7 160 92 0 0 0 6 1 79 1948 1569 4783 1840 2977 1567 4.7 7.0 6.0 8.6 183 194 261 287 21
Belgium 48,415 4 153 98 0 0 0 12 3 81 2033 1652 4921 1890 3130 1610 5.0 7.3 6.6 9.1 193 207 282 308 24
Netherlands 47,313 4 154 99 0 0 0 13 3 79 2056 1631 4876 1884 3083 1604 4.9 7.5 6.7 9.2 199 220 279 308 18
Portugal 38,004 3 158 100 0 0 0 4 0 72 1855 1460 4580 1810 2864 1531 4.4 6.3 5.4 7.5 168 178 244 269 20
Sweden 26,397 2 160 91 0 3 0 16 1 85 2025 1703 4825 1850 2997 1573 4.7 7.4 6.4 9.2 195 195 269 297 18
Austria 23,946 2 154 95 0 1 0 5 3 82 2083 1738 5004 1891 3112 1610 5.0 7.7 6.8 9.6 202 216 294 324 22
Greece 13,402 1 158 80 0 0 0 6 0 95 2260 1684 4903 1802 2993 1537 4.6 8.3 7.3 10.3 218 173 293 318 22
Denmark 11,886 1 162 97 0 0 0 8 6 87 2087 1668 4853 1887 3044 1602 4.8 7.9 6.6 9.6 202 223 277 304 19
Finland 7,471 1 158 100 0 0 0 5 1 87 2276 1800 5067 1896 3195 1593 5.1 8.1 7.0 10.2 215 196 299 326 23
Ireland 7,173 1 154 100 0 0 0 4 0 81 2065 1709 4845 1870 3024 1593 4.8 7.1 6.3 8.8 190 227 278 310 21
Luxembourg 1,888 0 153 100 0 0 0 0 0 77 1971 1629 – – 2658 1513 4.0 6.9 6.1 8.3 182 199 274 302 19 Renault 194,776 15 155 98 0 0 0 1 0 67 1789 1483 4512 1853 2913 1569 4.6 6.5 5.8 7.6 171 235 263 289 22
Citroën 160,117 9 155 96 0 0 0 2 0 65 1668 1418 4463 1819 2824 1553 4.4 6.1 5.3 7.4 159 197 245 271 25
Fiat 155,801 8 153 91 0 7 0 5 0 75 1826 1518 4594 1836 2929 1578 4.7 6.6 5.7 8.1 170 183 272 302 22
Ford 149,036 7 145 99 0 0 0 0 0 77 2127 1701 5017 1921 3123 1639 5.1 7.4 6.4 9.3 197 336 299 339 17
Peugeot 148,225 7 157 98 0 0 1 1 0 66 1674 1444 4500 1840 2830 1564 4.4 6.0 5.3 7.3 159 187 242 267 25
VW 132,192 7 157 95 0 2 0 9 7 80 2086 1755 4988 1877 3089 1603 5.0 7.7 6.6 9.6 201 218 268 314 15
Mercedes-Benz 108,171 6 159 99 0 1 0 22 24 95 2216 1979 5553 1959 3508 1670 5.9 8.9 7.5 11.3 238 65 319 335 10
Opel 69,745 5 157 95 0 3 0 4 0 71 1733 1517 4610 1804 2956 1541 4.6 6.8 6.1 8.4 178 259 276 300 19
Iveco 40,132 4 – 99 0 0 0 3 1 96 2574 2108 6142 1996 3495 1701 5.9 9.1 8.7 10.6 241 – – – –
Nissan 37,414 4 160 99 0 0 0 8 0 101 2341 1848 5128 1861 3087 1562 4.9 8.9 7.9 10.6 238 166 331 351 25
Toyota 32,843 4 164 99 0 0 0 11 0 93 2566 1774 5079 1785 3033 1508 4.6 8.1 7.0 10.1 215 121 268 283 32
Leng
th [
mm
]
Wid
th [
mm
]
Whe
elb
ase
[mm
]
Whe
eltr
ack
[mm
]
Foo
tpri
nt [
m2 ]
Fuel
co
nsum
pti
on
(NE
DC
) [l
/10
0 k
m]
Fuel
co
nsum
pti
on
(ext
ra-u
rban
) [l
/10
0 k
m]
Fuel
co
nsum
pti
on
(urb
an)
[l/1
00
km
]
CO
2 (N
ED
C)
[g/k
m]
CO
(d
iese
l veh
icle
s) [
mg
/km
]
NO
x (d
iese
l veh
icle
s) [
mg
/km
]
HC
+ N
Ox (
die
sel v
ehic
les)
[m
g/k
m]
Par
ticu
late
s (d
iese
l veh
icle
s) [
mg
/km
]
Tota
l new
sal
es/r
egis
trat
ions
Tota
l new
sal
es/r
egis
trat
ions
[%
]
Top
sp
eed
[km
/h]
Die
sel [
%]
Hyb
rid
exc
l. P
HE
V [
%]
Nat
ural
gas
(m
ono
-/b
ival
ent,
incl
. LP
G)
[%]
Flex
-Fue
l (et
hano
l/g
aso
line)
[%
]
Eur
o 5
and
Eur
o 6
[%
]
Aut
om
atic
[%
]
Eng
ine
pow
er [
KW
]
Eng
ine
size
[cc
m]
Mas
s in
run
ning
ord
er [
kg]
For additional information:International Council on Clean Transportation EuropeFasanenstraße 85, 10623 [email protected]
© 2021 International Council on Clean TransportationFunding for this work was generously provided by the European Climate Foundation
Edited by Sonsoles Díaz (ICCT Europe), with kind support from Marie Rajon Bernard, Yoann Bernard, Georg Bieker, Kaylin Lee, Peter Mock, Eamonn Mulholland, Pierre-Louis Ragon, Felipe Rodriguez, Uwe Tietge, Sandra Wappelhorst.Design and visualization by Hahn + Zimmermann, Bern
Printed on 100% recycled paper
An electronic version of this Pocketbook, including more detailed statistical data is available online: http://eupocketbook.theicct.org

International Council on Clean Transportation EuropeFasanenstraße 8510623 [email protected]
Top Related
Copyright © 2022 FDOKUMEN

