


Bahasa
Halaman
Hukum


Enhanced Detection of Low AbundanceHuman Plasma Proteins Using a TandemIgY12-SuperMix Immunoaffinity SeparationStrategy*□S
Wei-Jun Qian‡, David T. Kaleta‡, Brianne O. Petritis‡, Hongliang Jiang‡, Tao Liu‡,Xu Zhang‡, Heather M. Mottaz‡, Susan M. Varnum‡, David G. Camp II‡, Lei Huang§,Xiangming Fang¶, Wei-Wei Zhang¶, and Richard D. Smith‡�
The enormous dynamic range of human bodily fluid pro-teomes poses a significant challenge for current MS-based proteomics technologies as it makes it especiallydifficult to detect low abundance proteins in humanbiofluids such as blood plasma, which is an essentialaspect for successful biomarker discovery efforts. Herewe present a novel tandem IgY12-SuperMix immunoaffin-ity separation system for enhanced detection of low abun-dance proteins in human plasma. The tandem IgY12-Su-perMix system separates �60 abundant proteins from thelow abundance proteins in plasma, allowing for significantenrichment of low abundance plasma proteins in the Su-perMix flow-through fraction. High reproducibility of thetandem separations was observed in terms of both sam-ple processing recovery and LC-MS/MS identification re-sults based on spectral count data. The ability to quanti-tatively measure differential protein abundances followingapplication of the tandem separations was demonstratedby spiking six non-human standard proteins at three dif-ferent levels into plasma. A side-by-side comparison be-tween the SuperMix flow-through and IgY12 flow-throughsamples analyzed by both one- and two-dimensional LC-MS/MS revealed a 60–80% increase in proteome cover-age as a result of the SuperMix separations, suggestingsignificantly enhanced detection of low abundance pro-teins. A total of 695 plasma proteins were confidentlyidentified in a single analysis (with a minimum of twopeptides per protein) by coupling the tandem separationstrategy with two-dimensional LC-MS/MS, including 42proteins with reported normal concentrations of �100pg/ml to 100 ng/ml. The concentrations of two selectedproteins, macrophage colony-stimulating factor 1 andmatrix metalloproteinase-8, were independently validatedby ELISA as 202 pg/ml and 12.4 ng/ml, respectively. Eval-uation of binding efficiency revealed that 45 medium
abundance proteins were efficiently captured by the Su-perMix column with >90% retention. Taken together,these results illustrate the potential broad utilities of thistandem IgY12-SuperMix strategy for proteomics applica-tions involving human biofluids where effectively address-ing the dynamic range challenge of the specimen isimperative. Molecular & Cellular Proteomics 7:1963–1973, 2008.
There has been tremendous interest in using advancedproteomics technologies to analyze human bodily fluids suchas plasma and serum for the purpose of discovering andverifying new candidate protein biomarkers applicable to dif-ferent diseases (1, 2). These technologies are challenged todetect low abundance physiologically relevant proteins withextremely wide dynamic ranges in concentrations (i.e., morethan 10 orders of magnitude for protein concentrations re-ported in human plasma) (3, 4). Despite significant recentadvances, current proteomics technologies still fall short ofbeing able to reliably detect in blood plasma low ng/ml tosub-ng/ml protein concentrations, a level of detection oftenrequired for discovering disease-specific biomarkers (4).Many different fractionation/separation techniques have beendeveloped and applied in a multidimensional fashion to en-hance detection of low abundance proteins in human biofluids(5, 6). One of the most commonly applied strategies to po-tentially alleviate the “masking” effect created by the pres-ence of the highly abundant proteins is to remove them (7). Inthe human plasma proteome, 22 proteins are responsible for99% of the bulk mass of the total protein content in humanplasma; this leaves perhaps hundreds of thousands of otherproteins in only 1% of the protein mass (3). As a result,effective strategies for removing these 22 proteins (and pos-sibly other medium abundance proteins) should greatly en-hance detection of low abundance proteins within this impor-tant biofluid proteome.
Multicomponent immunoaffinity separation strategies areincreasingly being applied in various biomarker discovery ap-plications to remove the abundant proteins and achieve com-
From the ‡Biological Sciences Division and Environmental Molec-ular Sciences Laboratory, Pacific Northwest National Laboratory,Richland, Washington 99352, §GenWay Biotech, Inc., San Diego,California 92121, and ¶Acrotics Corp., San Diego, California 92130
Received, January 7, 2008, and in revised form, June 18, 2008Published, MCP Papers in Press, July 15, 2008, DOI 10.1074/
mcp.M800008-MCP200
Research
Molecular & Cellular Proteomics 7.10 1963This paper is available on line at http://www.mcponline.org
prehensive surveys of the biofluid proteomes. In such ap-proaches, affinity-purified polyclonal antibodies typicallyimmobilized by cross-linking on either chromatographic mat-rices or microbeads are used as immunoaffinity reagents tospecifically remove abundant proteins. An optimized mixtureof different antibody-immobilized beads for targeting a num-ber of proteins within the partitioning column allows for simul-taneous and efficient capture of multiple proteins. The princi-ple of multicomponent immunoaffinity separation was initiallydemonstrated by Pieper et al. (8) when they illustrated acapability for removing 10 high abundance proteins in a singlestep. At present, several commercially available products areavailable for simultaneously removing multiple abundant pro-teins, including the Agilent (Palo Alto, CA) Multiple AffinityRemoval System (MARS) (9), GenWay Seppro� IgY12 system(10), and Sigma ProteoPrep� 20 that can separate 7, 12, and20 human plasma proteins, respectively. These antibody-based separation systems have been demonstrated to behighly efficient for removing the specifically targeted proteinsas well as being both reproducible and selective (7, 11, 12).Although the current immunoaffinity partitioning technologiesfor capturing up to 20 high abundance proteins have providedsome promising results, coupling immunoaffinity approacheswith 1D1 or 2D LC-MS/MS analysis to identify plasma proteinsat concentrations of ng/ml or lower remains a challenge (4).Overcoming this challenge requires an effective fractionationscheme to reduce the dynamic range and enable broaderdetection of the remaining low abundance proteins of interest.
In this study, we present a new Seppro IgY-SuperMix im-munoaffinity separation system for its ability to enhance de-tection of low abundance proteins in human plasma. The newSuperMix system has been designed to be applied in tandemwith the IgY12 system for capturing �50 moderately abun-dant proteins in addition to the 12 most abundant proteins inplasma. Herein we present results from this study that illus-trate the potential for enhanced detection of low abundanceproteins as well as the reproducibility of the SuperMix parti-tioning method for LC-MS/MS plasma proteome profiling.
EXPERIMENTAL PROCEDURES
Plasma Sample—The human blood plasma sample supplied by theStanford University School of Medicine (Palo Alto, CA) was obtainedfrom a single, healthy volunteer. Approval for the conduct of this studywas obtained from the Institutional Review Boards of the StanfordUniversity School of Medicine and the Pacific Northwest NationalLaboratory in accordance with federal regulations. The initial proteinconcentration was �61 mg/ml as determined by BCA protein assay(Pierce). Unless otherwise noted, all protein sample processing wasperformed at 4 °C.
Generation of IgY-SuperMix LC2 Column—To generate an immu-noaffinity column with a mixture of antibodies that will bind to thosemoderately abundant proteins in human plasma, a plasma samplewas initially depleted of the 12 highest abundance proteins using anIgY12 column. The flow-through fraction containing medium or lowabundance proteins was used as a mixture of antigens for immunizingchickens and generating a mixture of polyclonal IgY antibodies. TheIgY12-depleted flow-through fraction was also used as affinity ligandsand conjugated to CNBr-activated SepharoseTM 4B (GE Healthcare)for preparing an antigen affinity column, which was used to purify theantibodies from the total IgYs isolated from the chickens immunizedwith the IgY12-depleted fraction. The mixture of newly purified IgYantibodies from the antigen affinity column was then conjugated toUltraLink Hydrazide Gel (Pierce) and packaged into an immunoaffinitycolumn called the SuperMix LC2 column.
IgY12 and SuperMix Immunoaffinity Chromatography—The plasmasamples were initially subjected to the separation of 12 high abun-dance proteins (albumin, IgG, �1-antitrypsin, IgA, IgM, transferrin,haptoglobin, �1-acid glycoprotein, �2-macroglobulin, apolipoproteinA-I, apolipoprotein A-II, and fibrinogen) using a ProteomeLabTM
12.7 � 79.0-mm IgY12 LC10 affinity LC column (Beckman Coulter,Fullerton, CA) with a column capacity of 250 �l of plasma using anAgilent 1100 series HPLC system. The manufacturer’s recommenda-tions were followed in these separations, which were similar to thosedescribed previously (7). The same three buffers were utilized (dilu-tion/washing: 10 mM Tris-HCl, 150 mM NaCl, pH 7.4 (TBS); stripping/elution buffer: 100 mM glycine, pH 2.5; neutralization buffer: 100 mM
Tris-HCl, pH 8.0) in a separation scheme that consisted of sampleloading-washing-eluting-neutralization followed by a re-equilibrationscheme for a total cycle time of �70 min. The flow-through andbound (or eluted) fractions were collected separately.
Following the IgY12 separations, the flow-through fractions wereconcentrated in Amicon� Ultra-15 (5-kDa nominal molecular masslimit; Millipore, Billerica, MA) concentrators followed by buffer ex-change to 50 mM NH4HCO3, pH 8.0. Protein concentration was thendetermined by BCA protein assay (Pierce).
The concentrated IgY12 flow-through fractions were then parti-tioned using a Seppro SuperMix LC2 (6.4 � 63.0-mm) immunoaffinitycolumn on the same HPLC system. The separation conditions usingthe SuperMix column were similar to that described for the IgY12 LC2separation (7). Both the flow-through and bound fractions from theSuperMix LC2 column were collected and concentrated as describedabove with buffer exchange to 50 mM NH4HCO3, and protein con-centration was measured using the BCA protein assay (Pierce).
To demonstrate the measurements of differential protein abun-dances, six non-human standard proteins were spiked into three 1-mlhuman plasma samples at 1, 5, and 25 �g/ml concentrations, respec-tively. The six proteins spiked into plasma were bovine carbonicanhydrase 2, chicken ovalbumin, horse myoglobin, bovine �-lactal-bumin, bovine cytochrome c, and bovine �-lactoglobulin. Eachplasma sample with spiked protein was subjected to triplicate tandemIgY12-SuperMix immunoaffinity separations with 250 �l of startingplasma for each replicate. Both the SuperMix flow-through andbound fractions for each of the replicate experiments were concen-trated as described above.
Protein Digestion—The protein samples from IgY12 flow-through,SuperMix flow-through, and SuperMix bound fractions were dena-tured and reduced in 50 mM NH4HCO3 buffer, pH 8.0, 8 M urea, 10 mM
DTT for 1 h at 37 °C. Protein cysteinyl residues were alkylated with 40mM iodoacetamide for 60 min at room temperature. The resultingprotein mixture was diluted 6-fold with 50 mM NH4HCO3, pH 8.0,before sequencing grade modified porcine trypsin (Promega, Madi-son, WI) was added at a trypsin:protein ratio of 1:50 (w/w). Thesample was incubated at 37 °C for 3 h. The tryptically digested
1 The abbreviations used are: 1D, one-dimensional; 2D, two-dimen-sional; IgY, immunoglobulin yolk; SPE, solid-phase extraction; M-CSF, macrophage colony-stimulating factor 1; LTQ, linear ion trapquadrupole; IPI, International Protein Index; Xcorr, cross-correlationscore; �Cn, delta correlation; MMP8, matrix metalloproteinase-8;�2-HS-glycoprotein, �2-Heremans-Schmid glycoprotein.
Tandem IgY-SuperMix Immunoaffinity Separations
1964 Molecular & Cellular Proteomics 7.10
sample was then loaded onto a 1-ml SPE C18 column (Supelco,Bellefonte, PA) and washed with 4 ml of 0.1% TFA, 5% acetonitrile.Peptides were eluted from the SPE column with 1 ml of 0.1% TFA,80% acetonitrile and lyophilized. Final peptide concentration wasdetermined by BCA protein assay (Pierce). Peptide samples werestored at �80 °C until further analysis.
Strong Cation Exchange Fractionation—�150 �g of tryptic pep-tides from the IgY12 flow-through and SuperMix flow-through frac-tions were resuspended in 150 �l of 10 mM ammonium formate, 25%acetonitrile and fractionated by strong cation exchange chromatog-raphy on a 2.1 � 200-mm (5-�m, 300-Å) Polysulfoethyl A LC column(PolyLC, Columbia, MD) preceded by a 2.1 � 10-mm guard columnusing an 1100 series HPLC system (Agilent) at a flow rate of 200�l/min. Mobile phases used were 10 mM ammonium formate, pH 3.0,25% acetonitrile (A) and 500 mM ammonium formate, pH 6.8, 25%acetonitrile (B). Sample was loaded onto the column and run with100% A for 10 min. Peptides were then separated by a linear gradientto 50% B over 40 min followed by a linear gradient from 50 to 100%B over 10 min. 100% B was then maintained for 20 min. A total of 25fractions were collected with each fraction being lyophilized prior toreversed-phase LC-MS/MS analysis.
Reversed-phase Capillary LC-MS/MS Analysis—Peptide sampleswere analyzed using a custom-built automated four-column highpressure capillary LC system coupled on-line to a linear ion trap massspectrometer (LTQ; ThermoElectron) via an electrospray ionizationinterface manufactured in-house. The reversed-phase capillary col-umn was prepared by slurry-packing 3-�m Jupiter C18 bonded par-ticles (Phenomenex, Torrence, CA) into a 65-cm-long, 75-�m-innerdiameter fused silica capillary (Polymicro Technologies, Phoenix, AZ).The mobile phase consisted of 0.2% acetic acid, 0.05% TFA in water(A) and 0.1% TFA in 90% acetonitrile, 10% water (B). After loading 5�l of peptides onto the column, the mobile phase was held at 100%A for 20 min. Exponential gradient elution was performed by increas-ing the mobile phase composition from 0 to 70% B over 85 min. Toidentify the eluting peptides, the LTQ mass spectrometer was oper-ated in a data-dependent MS/MS mode (m/z 400–2000) in which a fullMS scan was followed by 10 MS/MS scans. The 10 most intensiveprecursor ions were dynamically selected in the order of highestintensity to lowest intensity and subjected to collision-induced disso-ciation using a normalized collision energy setting of 35% and adynamic exclusion duration of 1 min. The heated capillary was main-tained at 200 °C; the ESI voltage was kept at 2.2 kV.
Data Analysis—The LC-MS/MS raw data were converted into a .dtafile by Extract_MSn (version 3.0) in Bioworks Cluster 3.2 (Thermo),and the SEQUEST algorithm (version 27, revision 12) was used toindependently search all the MS/MS spectra against the human In-ternational Protein Index (IPI) database with a total of 61,225 totalprotein entries (version 3.20, released August 22, 2006). The searchparameters used were as follows: 3-Da tolerance for precursor ionmasses and 1 Da for fragment ion masses with no enzyme restraintand a maximum of three missed tryptic cleavages. Static carboxam-idomethylation of cysteine and dynamic oxidation of methionine wereused during the database search.
Because false positive peptide/protein identifications are a com-mon concern in proteomics investigations, we developed and applieda set of criteria based on the reversed database approach for filteringthe raw data to limit false positive identifications to �5% at the uniquepeptide level as described previously (13, 14). The reversed humanprotein database was created by reversing the order of the amino acidsequences for each protein, and the false positive rate (FPR) forpeptide identifications was estimated by dividing the number ofunique peptides identified from the reversed database search (NR) bythe number of unique peptides identified from the normal databasesearch (NN), i.e. FPR � NR/NN. Table I summarizes the cross-corre-
lation score (Xcorr) and delta correlation (�Cn) values along withtryptic cleavage states for filtering the SEQUEST raw data. A falsepositive rate of �4% was observed at the unique peptide level fol-lowing such filtering for this study.
ProteinProphetTM software was used as a clustering tool to gen-erate a list of non-redundant proteins or protein groups (15). Peptidesthat passed the filtering criteria were assigned the identical probabilityscore of 1 and entered into the software program (done exclusively forcluster analysis) to generate a final list of non-redundant proteins/protein groups. One protein IPI number was randomly selected torepresent each corresponding protein group that consists of a num-ber of database entries. Only those proteins or protein groups withtwo or more unique peptide identifications were considered as con-fident protein identifications.
ELISA—The plasma protein concentrations for macrophage colo-ny-stimulating factor 1 (M-CSF) and matrix metalloproteinase-8(MMP8) were determined in triplicate using Quantikine ELISA kits(R&D Systems, Minneapolis, MN) following the manufacturer’s in-structions. Each sample was analyzed at three different dilutions todetermine the optimal dilution.
RESULTS
Tandem IgY12-SuperMix Immunoseparation Strategy—Thescheme used to generate the SuperMix column is shown inFig. 1. The concept behind the SuperMix immunoaffinity sep-aration is that antibodies can be generated against mixedantigens such as the proteins present in human plasma. Be-cause the antibody titers correspond to the abundance andthe immunogenicity of the proteins (16) the assumption is thatmoderately abundant proteins in human plasma may lead tomuch higher immune response than lower abundance pro-teins. As a result, a purified mixture of these antibodies can beused to capture a large number of medium abundance pro-teins especially when applied in tandem with a high abun-dance protein removal strategy such as IgY12. Because theSuperMix column contains antibodies against those mediumabundance proteins from the IgY12-depleted plasma sample,it can be applied in tandem with the IgY12 column as a dualseparation strategy (Fig. 1) to significantly enrich low abun-
TABLE ISEQUEST filtering criteria used for peptide identifications
Charge state �Cn Xcorr Tryptic ends
1� �0.05 �1.7 Fully1� �0.1 �1.5 Fully1� �0.05 �3.0 Partially1� �0.16 �2.8 Partially2� �0.05 �2.8 Fully2� �0.1 �2.7 Fully2� �0.16 �2.3 Fully2� �0.05 �3.8 Partially2� �0.1 �3.7 Partially2� �0.16 �3.5 Partially3� �0.05 �3.5 Fully3� �0.1 �3.3 Fully3� �0.16 �3 Fully3� �0.05 �4.6 Partially3� �0.1 �4.5 Partially3� �0.16 �4.3 Partially
Tandem IgY-SuperMix Immunoaffinity Separations
Molecular & Cellular Proteomics 7.10 1965

dance proteins by capturing a relatively large number (�50) ofhigh or medium abundance proteins onto the IgY12 and Su-perMix columns. Fig. 1 also indicates typical loading andrecoveries for the dual separation strategy; for example, �100�g of total proteins is expected to be recovered from 250 �lof starting plasma sample.
Reproducibility of the Tandem IgY12-SuperMix Separa-tions—As reproducible separations and sample processingsteps are key requirements for quantitative applications inclinical proteomics, we evaluated the reproducibility of tan-dem IgY12-SuperMix separations Table II shows the repro-ducibility based on five independent experimental replicatesin terms of sample recoveries for each step of separation andsample processing. Recovered amounts of proteins in theIgY12 and SuperMix flow-throughs and SuperMix bound frac-tions as well as the final digested peptides in the SuperMixflow-through fraction are consistent across the five replicates.This consistency suggests overall good reproducibility of both
tandem separations and concentrating, buffer exchange, andprotein digestion steps. The variation for finalized recoveredpeptides in the SuperMix flow-through is slightly higher thanthe protein level presumably because of contributions fromthe SPE clean-up step following digestion.
To further evaluate the reproducibility, three replicates ofpeptide samples from the IgY12 flow-through, SuperMix flow-through, and SuperMix bound fractions were selected forseparate LC-MS/MS analyses. An average of 151 3, 232
6, 104 3 proteins were identified from triplicate analyses ofIgY12 flow-through, SuperMix flow-through, and SuperMixbound fractions, respectively. The number of MS/MS spectrathat identified a given protein (spectral count) after stringentfiltering was used to further evaluate (7) the reproducibilityamong replicate analyses. Spectral count information hasbeen demonstrated recently as a means for relative quantita-tion among samples as well as for comparing absolute proteinabundances within a sample (17–19). Fig. 2 shows the linear
FIG. 1. The tandem IgY12-SuperMiximmunoaffinity separation strategy.The SuperMix column was generated byusing the protein mixture from IgY12-depleted human plasma as mixed anti-gens. For the tandem separations,plasma or other biofluid samples are ini-tially separated by the IgY12 LC-10 col-umn. The flow-through from the IgY12column is further separated by the Su-perMix LC2 column into the flow-through and eluted fractions. The typicalrecoveries are indicated assuming �250�l of plasma is loaded.
TABLE IISample recoveries for tandem IgY12 and SuperMix separations
Replicatea A B C D E Recoveryb
%
IgY12 flow-through (�g)c 1249 1429 1281 1443 1457 10.0 0.72SuperMix bound (�g)d 485 421 424 438 414 3.19 0.21SuperMix flow-through (�g)d 121 128 123 117 122 0.89 0.03SuperMix flow-through postdigestion (�g)d 68 54 69 78 50 0.47 0.08
a For each replicate experiment, 225 �l of plasma was used with the total protein quantity of �13.7 mg (plasma concentration, �61 mg/ml).b All recoveries are expressed as the percentage of recovered proteins or peptides compared with the 13.7 mg of starting materials along
with the standard deviations.c The amount of proteins or peptides recovered for each replicate.d Only nine-tenths of the IgY12 flow-through was used for SuperMix separations.
Tandem IgY-SuperMix Immunoaffinity Separations
1966 Molecular & Cellular Proteomics 7.10
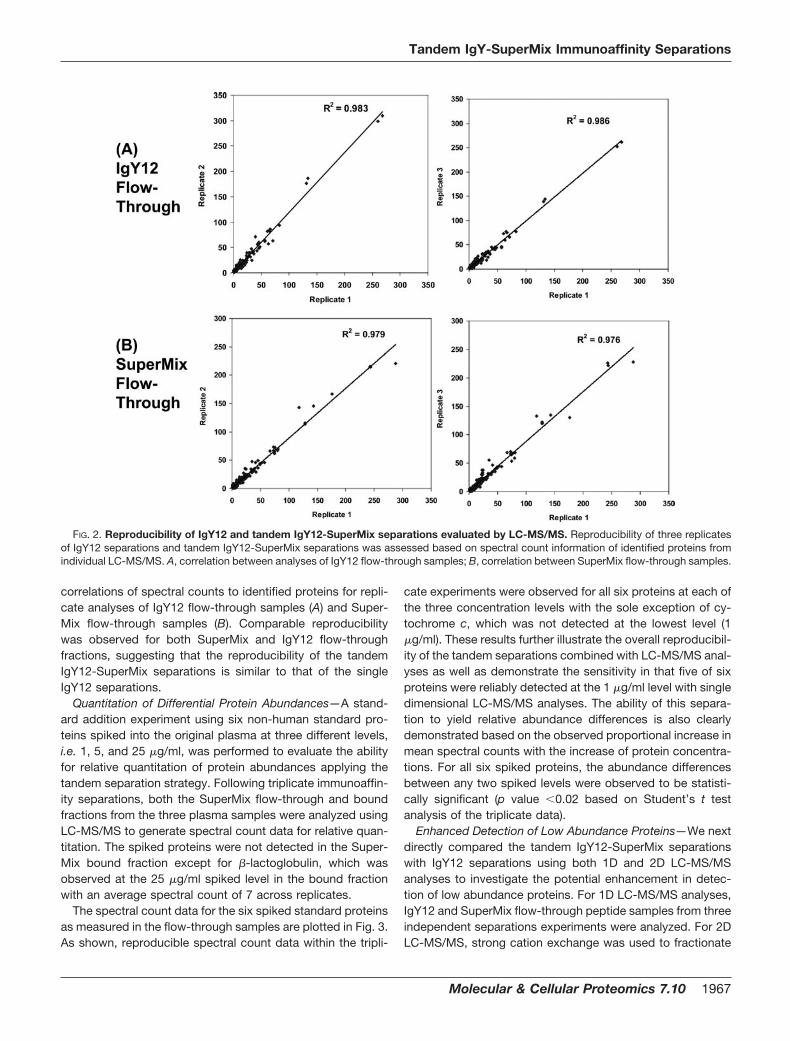
correlations of spectral counts to identified proteins for repli-cate analyses of IgY12 flow-through samples (A) and Super-Mix flow-through samples (B). Comparable reproducibilitywas observed for both SuperMix and IgY12 flow-throughfractions, suggesting that the reproducibility of the tandemIgY12-SuperMix separations is similar to that of the singleIgY12 separations.
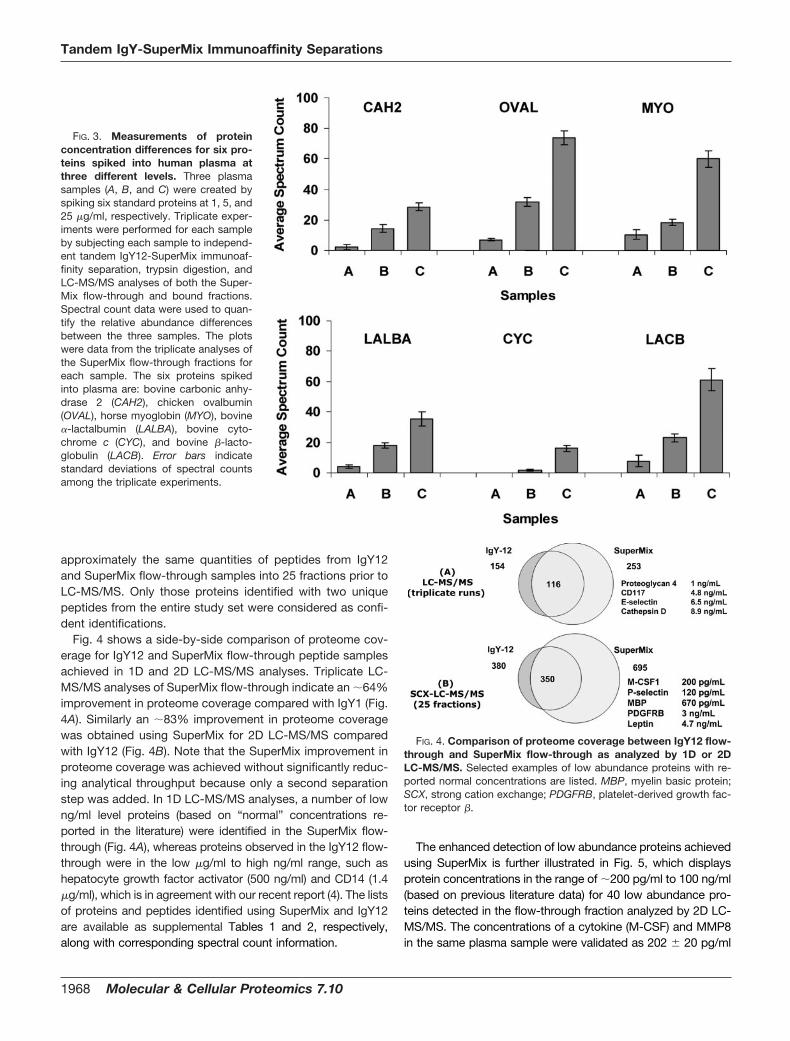
Quantitation of Differential Protein Abundances—A stand-ard addition experiment using six non-human standard pro-teins spiked into the original plasma at three different levels,i.e. 1, 5, and 25 �g/ml, was performed to evaluate the abilityfor relative quantitation of protein abundances applying thetandem separation strategy. Following triplicate immunoaffin-ity separations, both the SuperMix flow-through and boundfractions from the three plasma samples were analyzed usingLC-MS/MS to generate spectral count data for relative quan-titation. The spiked proteins were not detected in the Super-Mix bound fraction except for �-lactoglobulin, which wasobserved at the 25 �g/ml spiked level in the bound fractionwith an average spectral count of 7 across replicates.
The spectral count data for the six spiked standard proteinsas measured in the flow-through samples are plotted in Fig. 3.As shown, reproducible spectral count data within the tripli-
cate experiments were observed for all six proteins at each ofthe three concentration levels with the sole exception of cy-tochrome c, which was not detected at the lowest level (1�g/ml). These results further illustrate the overall reproducibil-ity of the tandem separations combined with LC-MS/MS anal-yses as well as demonstrate the sensitivity in that five of sixproteins were reliably detected at the 1 �g/ml level with singledimensional LC-MS/MS analyses. The ability of this separa-tion to yield relative abundance differences is also clearlydemonstrated based on the observed proportional increase inmean spectral counts with the increase of protein concentra-tions. For all six spiked proteins, the abundance differencesbetween any two spiked levels were observed to be statisti-cally significant (p value �0.02 based on Student’s t testanalysis of the triplicate data).
Enhanced Detection of Low Abundance Proteins—We nextdirectly compared the tandem IgY12-SuperMix separationswith IgY12 separations using both 1D and 2D LC-MS/MSanalyses to investigate the potential enhancement in detec-tion of low abundance proteins. For 1D LC-MS/MS analyses,IgY12 and SuperMix flow-through peptide samples from threeindependent separations experiments were analyzed. For 2DLC-MS/MS, strong cation exchange was used to fractionate
FIG. 2. Reproducibility of IgY12 and tandem IgY12-SuperMix separations evaluated by LC-MS/MS. Reproducibility of three replicatesof IgY12 separations and tandem IgY12-SuperMix separations was assessed based on spectral count information of identified proteins fromindividual LC-MS/MS. A, correlation between analyses of IgY12 flow-through samples; B, correlation between SuperMix flow-through samples.
Tandem IgY-SuperMix Immunoaffinity Separations
Molecular & Cellular Proteomics 7.10 1967
approximately the same quantities of peptides from IgY12and SuperMix flow-through samples into 25 fractions prior toLC-MS/MS. Only those proteins identified with two uniquepeptides from the entire study set were considered as confi-dent identifications.
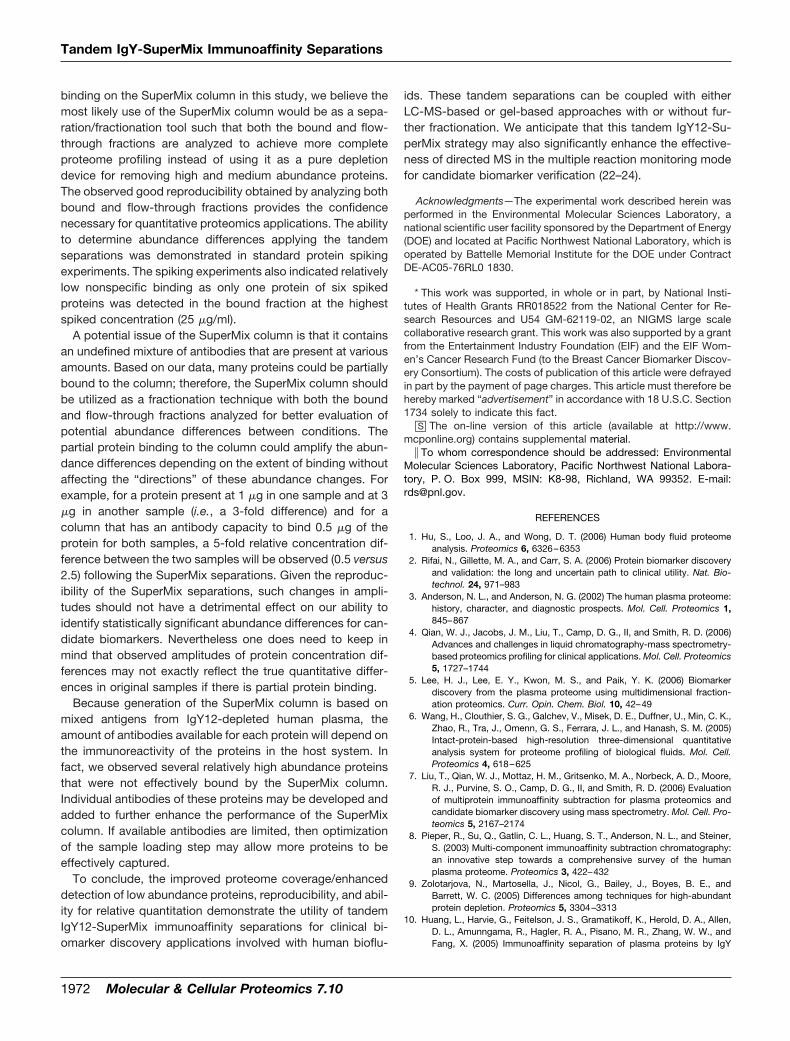
Fig. 4 shows a side-by-side comparison of proteome cov-erage for IgY12 and SuperMix flow-through peptide samplesachieved in 1D and 2D LC-MS/MS analyses. Triplicate LC-MS/MS analyses of SuperMix flow-through indicate an �64%improvement in proteome coverage compared with IgY1 (Fig.4A). Similarly an �83% improvement in proteome coveragewas obtained using SuperMix for 2D LC-MS/MS comparedwith IgY12 (Fig. 4B). Note that the SuperMix improvement inproteome coverage was achieved without significantly reduc-ing analytical throughput because only a second separationstep was added. In 1D LC-MS/MS analyses, a number of lowng/ml level proteins (based on “normal” concentrations re-ported in the literature) were identified in the SuperMix flow-through (Fig. 4A), whereas proteins observed in the IgY12 flow-through were in the low �g/ml to high ng/ml range, such ashepatocyte growth factor activator (500 ng/ml) and CD14 (1.4�g/ml), which is in agreement with our recent report (4). The listsof proteins and peptides identified using SuperMix and IgY12are available as supplemental Tables 1 and 2, respectively,along with corresponding spectral count information.
The enhanced detection of low abundance proteins achievedusing SuperMix is further illustrated in Fig. 5, which displaysprotein concentrations in the range of �200 pg/ml to 100 ng/ml(based on previous literature data) for 40 low abundance pro-teins detected in the flow-through fraction analyzed by 2D LC-MS/MS. The concentrations of a cytokine (M-CSF) and MMP8in the same plasma sample were validated as 202 20 pg/ml
FIG. 3. Measurements of proteinconcentration differences for six pro-teins spiked into human plasma atthree different levels. Three plasmasamples (A, B, and C) were created byspiking six standard proteins at 1, 5, and25 �g/ml, respectively. Triplicate exper-iments were performed for each sampleby subjecting each sample to independ-ent tandem IgY12-SuperMix immunoaf-finity separation, trypsin digestion, andLC-MS/MS analyses of both the Super-Mix flow-through and bound fractions.Spectral count data were used to quan-tify the relative abundance differencesbetween the three samples. The plotswere data from the triplicate analyses ofthe SuperMix flow-through fractions foreach sample. The six proteins spikedinto plasma are: bovine carbonic anhy-drase 2 (CAH2), chicken ovalbumin(OVAL), horse myoglobin (MYO), bovine�-lactalbumin (LALBA), bovine cyto-chrome c (CYC), and bovine �-lacto-globulin (LACB). Error bars indicatestandard deviations of spectral countsamong the triplicate experiments.
FIG. 4. Comparison of proteome coverage between IgY12 flow-through and SuperMix flow-through as analyzed by 1D or 2DLC-MS/MS. Selected examples of low abundance proteins with re-ported normal concentrations are listed. MBP, myelin basic protein;SCX, strong cation exchange; PDGFRB, platelet-derived growth fac-tor receptor �.
Tandem IgY-SuperMix Immunoaffinity Separations
1968 Molecular & Cellular Proteomics 7.10

and 12.4 0.4 ng/ml, respectively, based on triplicate analysesby ELISAs. Importantly the M-CSF protein was confidently iden-tified by four different peptides as shown in Table III. In com-parison only 21 of the 40 proteins were observed in the IgY12flow-through. The results in Fig. 4 and 5 clearly demonstratethat the use of tandem IgY12-SuperMix separations signifi-cantly enhances the detection of low abundance proteins andthe overall proteome coverage. Notably this tandem separationstrategy coupled with 2D LC-MS/MS analyses has enabledidentification of a number of physiologically relevant moleculessuch as known cytokines and growth factors. Table IV lists 14known cytokines and growth factors (based on the IngenuityKnowledgebase) that were identified in this study of which onlythree were also observed in the IgY12 flow-through.
Capture Efficiency for Moderately Abundant Proteins bySuperMix Column—The observed significant improvement inproteome coverage afforded by the SuperMix separation ispresumably because of efficient binding of a number of mod-erately abundant proteins to the column, thus leading to theenrichment of lower abundance proteins. As a result, weexamined the binding efficiency of the SuperMix column formoderate abundance proteins. The binding efficiency wasestimated on the basis of observed spectral counts fromtriplicate LC-MS/MS analyses of SuperMix bound and flow-through fractions. Although not quantitative because thebound and flow-through samples are very different in protein/peptide composition, this estimation still allowed us to identifythose proteins that are efficiently captured by the column
FIG. 5. The range of reported normal concentrations for 40 detected low abundance proteins detected in 2D LC-MS/MS analyses ofSuperMix flow-through. The protein concentration is plotted on a log scale. All protein concentrations were obtained based on previouslyreported data for plasma/serum samples from normal human subjects (3, 18, 25). Those proteins highlighted with gray squares were detectedin both IgY12 and SuperMix flow-through fractions; the others were detected in SuperMix flow-through only. Protein concentrations based onELISA results from the present study are marked with # (M-CSF and MMP8). ACE, angiotensin-converting enzyme; TIMP, tissue inhibitor ofmetalloprotease; VIP36, 36 kDa vesicular integral membrane protein; VCAM, vascular cell adhesion molecule; IGF, insulin-like growth factor;IGFBP, insulin-like growth factor-binding protein; ICAM, intercellular adhesion molecule; PECAM, platelet endothelial cell adhesion molecule;HGF L, hepatocyte growth factor-like; MIF, macrophage migration-inhibitory factor; EGF R, epidermal growth factor receptor; VEGF R, vascularendothelial growth factor receptor; PF4, platelet factor 4; PDGF R, platelet-derived growth factor receptor; MBP, myelin basic protein; MCSFR, M-CSF receptor.
TABLE IIIPeptide identification information for two selected low abundance proteins reported to be at sub-ng/ml levels
MBP, myelin basic protein.
Protein Identified peptide Charge state Xcorr �Cn Spectral count
M-CSF R2 SHSSGSVLPLGELEGRR2 S 2 3.4659 0.3521 2M-CSF K2 SCFTKDYEEHDKACVR2 T 2 4.9067 0.4207 1M-CSF K2 KAFLLVQDIMEDTMR2 F 2 3.5667 0.3052 1M-CSF R2 FRDNTPNAIAIVQLQELSLR2 L 3 4.6686 0.2551 1MBP R2 TQDENPVVHFFK2 N 2 3.8375 0.3424 2MBP R2 HRDTGILDSIGR2 F 2 3.0247 0.3330 2
Tandem IgY-SuperMix Immunoaffinity Separations
Molecular & Cellular Proteomics 7.10 1969

because either zero or a minimum number of spectral countsshould be observed in the flow-through.
Table V lists 45 medium abundance proteins that werecaptured with �90% efficiency by the SuperMix column; �35additional proteins were captured with 20–90% efficiency.Because the SuperMix column contains a mixture of IgYantibodies that were generated on the basis of the immuno-reactivity of medium abundance proteins that were present inthe IgY12-depleted plasma sample, one might expect that thelimited amounts of available antibodies would lead to lowbinding efficiencies for some of the proteins. To test thishypothesis, we loaded the SuperMix column with twice theamount of sample (IgY12 flow-through from �500 �l ofplasma). Interestingly overloading of the SuperMix columnsignificantly reduced the total number of proteins identified inthe flow-through fraction (188 proteins versus 253 proteinsshown in Fig. 4). The number of proteins efficiently capturedby the SuperMix column was also reduced from 45 to 29.These results suggest that further optimization of loading theSuperMix column may further enhance detection of low abun-dance proteins as a result of capturing more moderatelyabundant proteins.
Several relatively abundant proteins were not bound effi-ciently by the SuperMix column presumably because oflimited immunoreactivity. These proteins included vitaminD-binding proteins, apolipoprotein A-IV, prothrombin, �1-antichymotrypsin, apolipoprotein B-100, and �2-HS-glyco-protein, all of which were captured with �50% efficiencyeven though their relative abundances based on spectralcount ranking were among the top 30 proteins present in theIgY12-depleted plasma. Further details regarding estimatedcapture efficiency are available in supplemental Table 1.
DISCUSSION
One of the greatest challenges for applying advanced MS-based proteomics to clinical biomarker discovery efforts re-
mains the ability to effectively detect low abundance proteinsin complex mixtures. Many different fractionation/separationtechniques have been developed and applied in a multidimen-sional fashion at both the protein and peptide levels to ad-dress this dynamic range challenge (5, 20, 21). Essentially allof the chromatography-based separation and fractionationapproaches provide some degree of enrichment (or focusing)of a specific subset of low abundance proteins to achieveimproved detection. Immunoaffinity chromatography withmultiplexed antibodies that target relatively abundant proteinsis a commonly used technique for human biofluid proteomeprofiling (9, 10). In LC format, immunoaffinity separations offeran effective strategy for separating high abundance from rel-atively low abundance proteins in a highly reproducible fash-ion (7, 12) thus alleviating the masking effect of high abun-dance proteins. However, despite advances in recent years,immunoaffinity separation strategies have been limited to thenumber of antibodies that can be multiplexed on the LCcolumn (currently limited to 20 proteins).
In this work, we introduced a novel tandem IgY12-SuperMiximmunoaffinity separation strategy that allows effective bind-ing of �57 high or medium abundance proteins onto theIgY12-SuperMix column. This method of separating �50abundant proteins from low abundance proteins has led tosignificant improvements as evidenced by LC-MS/MS results.Improvements in plasma proteome coverage (�60–80%)(Fig. 4) and detection sensitivity has now allowed identifica-tion of a number of low concentration (ng/ml) proteins, includ-ing known cytokines and growth factors from a normal humansubject (Fig. 5 and Table IV). Importantly one of the cytokines(M-CSF) has been confirmed to be present at �200 pg/mlbased on ELISA results. These results demonstrate that tan-dem IgY12-SuperMix immunoaffinity separations with highreproducibility offer an effective means to dig deeper intocomplex biofluid proteomes for quantitative clinical applica-tions. Unlike other fractionation approaches that typically pro-
TABLE IVA selected list of known cytokines or growth factors identified from 2D LC-MS/MS analyses of IgY12 and SuperMix flow-through fractions
Only proteins observed with two or more spectral counts were considered as confidently detected in individual experiments. The numberof unique peptides for a given protein is the combined results for the entire study.
Protein name Gene Unique peptidesSpectral count
IgY12 SuperMix
Uteroglobin SCGB1A1 3 7Secreted and transmembrane protein 1 SECTM1 2 2Macrophage colony-stimulating factor 1 CSF1 5 5Platelet basic protein PPBP 8 3 36Platelet factor 4 PF4 3 6Macrophage migration-inhibitory factor MIF 2 2Neuron-derived neurotrophic factor NENF 3 3Mimecan (osteoglycin) OGN 10 9 11Inhibin � C chain INHBC 5 6Granulins GRN 3 3Leptin LEP 6 8 5Insulin-like growth factor I IGF1 7 27Growth/differentiation factor 8 GDF8 2 2Insulin-like growth factor II IGF2 7 27
Tandem IgY-SuperMix Immunoaffinity Separations
1970 Molecular & Cellular Proteomics 7.10

duce many fractions, the immunoaffinity separations onlygenerate two fractions (the flow-through and bound fractions);thus the improvements are achieved without a significantreduction in analytical throughput. Moreover the separationscan be fully automated on an HPLC system with only a slightincrease in sample processing because of the addition ofconcentration and buffer exchange steps. Finally immunoaf-finity columns typically allow more than 100 separations per
column, alleviating the concern of batch-to-batch variationsof affinity columns because a given biological study can betypically completed using a single column.
One of the general concerns in applying immunoaffinitycolumns is the extent of nonspecific binding. We recentlydemonstrated that the extent of nonspecific or specific bind-ing to a column is reproducible for a given protein (7). Al-though we did not observe strong evidence of nonspecific
TABLE VList of moderately abundant proteins that bound to the SuperMix column with relatively high capture efficiency
The spectral count data from triplicate analyses of the flow-through and bound fraction of SuperMix separations are presented for the listedmoderately abundant proteins. LMW, low molecular weight; HMW, high molecular weight.
IPI no. Protein name Gene nameSpectral counts Capture
efficiencyaFlow-through Bound
%
IPI00164623.4 Complement C3 C3 7 2060 �99IPI00418163.3 Complement 4B C4B 12 747 98IPI00032258.4 Complement C4A C4A 12 707 98IPI00017601.1 Ceruloplasmin CP 0 532 �99IPI00022488.1 Hemopexin HPX 3 509 99IPI00019591.1 Complement factor B CFB 3 425 99IPI00218192.1 Inter-�-trypsin inhibitor heavy chain H4 ITIH4 4 352 99IPI00032291.1 Complement C5 C5 0 306 �99IPI00006543.2 Complement factor H-related 5 CFHR5 0 288 �99IPI00305461.2 Inter-�-trypsin inhibitor heavy chain H2 ITIH2 1 275 �99IPI00515041.2 Complement factor H CFH 0 260 �99IPI00292530.1 Inter-�-trypsin inhibitor heavy chain H1 ITIH1 0 243 �99IPI00019580.1 Plasminogen PLG 0 216 �99IPI00215894.1 Isoform LMW of kininogen-1 KNG1 3 191 98IPI00032179.2 Antithrombin III variant SERPINC1 0 184 �99IPI00032328.1 Isoform HMW of kininogen-1 KNG1 2 178 99IPI00009920.2 Complement component C6 C6 0 151 �99IPI00298828.3 �2-Glycoprotein 1 APOH 0 125 �99IPI00022895.7 �1B-Glycoprotein A1BG 0 123 �99IPI00022418.1 Fibronectin FN1 0 121 �99IPI00294395.1 Complement C8 � chain C8B 0 114 �99IPI00291866.5 Plasma protease C1 inhibitor SERPING1 2 113 98IPI00022420.3 Plasma retinol-binding protein RBP4 0 100 �99IPI00165421.4 SERPINC1 protein SERPINC1 0 98 �99IPI00021885.1 Fibrinogen � chain FGA 0 90 �99IPI00022371.1 Histidine-rich glycoprotein HRG 1 88 99IPI00298497.3 Fibrinogen � chain FGB 0 83 �99IPI00298971.1 Vitronectin VTN 1 81 99IPI00021891.5 Fibrinogen � chain FGG 0 68 �99IPI00736985.1 Similar to ceruloplasmin LOC441368 0 68 �99IPI00021727.1 C4B-binding protein � chain C4BPA 0 65 �99IPI00296608.6 Complement component C7 C7 0 59 �99IPI00011252.1 Complement C8 � chain C8A 0 59 �99IPI00022391.1 Serum amyloid P-component APCS 1 49 98IPI00011261.1 Complement C8 � chain C8G 0 48 �99IPI00294004.1 Vitamin K-dependent protein S PROS1 0 36 �99IPI00011264.1 Complement factor H-related protein 1 CFHR1 0 32 �99IPI00006154.1 Complement factor H-related protein 2 CFHR2 0 13 �99IPI00021364.1 Properdin CFP 1 13 93IPI00022392.1 Complement C1Q subunit A C1QA 0 12 �99IPI00022394.2 Complement C1Q subunit C C1QC 0 12 �99IPI00477992.1 C1Q subcomponent, B chain C1QB 0 10 �99IPI00027507.1 Complement factor H-related protein 3 CFHR3 0 7 �99IPI00025862.1 C4B-binding protein � chain C4BPB 0 5 �99IPI00029168.1 Apolipoprotein(a) LPA 0 5 �99
a The capture efficiency is used to estimate the percentage for a given protein to be captured by the SuperMix column; it was estimated foreach protein by dividing the spectral count for each protein from the bound fraction (B) by the sum of spectral counts from the bound fractionand flow-through fraction (FT), i.e. B/(B � FT). The estimated capture efficiency will be less accurate for proteins with only a few spectralcounts. Even if 0 count was observed in the flow-through, it does not mean a complete capture by the column; therefore, these proteins arerepresented as �99%.
Tandem IgY-SuperMix Immunoaffinity Separations
Molecular & Cellular Proteomics 7.10 1971
binding on the SuperMix column in this study, we believe themost likely use of the SuperMix column would be as a sepa-ration/fractionation tool such that both the bound and flow-through fractions are analyzed to achieve more completeproteome profiling instead of using it as a pure depletiondevice for removing high and medium abundance proteins.The observed good reproducibility obtained by analyzing bothbound and flow-through fractions provides the confidencenecessary for quantitative proteomics applications. The abilityto determine abundance differences applying the tandemseparations was demonstrated in standard protein spikingexperiments. The spiking experiments also indicated relativelylow nonspecific binding as only one protein of six spikedproteins was detected in the bound fraction at the highestspiked concentration (25 �g/ml).
A potential issue of the SuperMix column is that it containsan undefined mixture of antibodies that are present at variousamounts. Based on our data, many proteins could be partiallybound to the column; therefore, the SuperMix column shouldbe utilized as a fractionation technique with both the boundand flow-through fractions analyzed for better evaluation ofpotential abundance differences between conditions. Thepartial protein binding to the column could amplify the abun-dance differences depending on the extent of binding withoutaffecting the “directions” of these abundance changes. Forexample, for a protein present at 1 �g in one sample and at 3�g in another sample (i.e., a 3-fold difference) and for acolumn that has an antibody capacity to bind 0.5 �g of theprotein for both samples, a 5-fold relative concentration dif-ference between the two samples will be observed (0.5 versus2.5) following the SuperMix separations. Given the reproduc-ibility of the SuperMix separations, such changes in ampli-tudes should not have a detrimental effect on our ability toidentify statistically significant abundance differences for can-didate biomarkers. Nevertheless one does need to keep inmind that observed amplitudes of protein concentration dif-ferences may not exactly reflect the true quantitative differ-ences in original samples if there is partial protein binding.
Because generation of the SuperMix column is based onmixed antigens from IgY12-depleted human plasma, theamount of antibodies available for each protein will depend onthe immunoreactivity of the proteins in the host system. Infact, we observed several relatively high abundance proteinsthat were not effectively bound by the SuperMix column.Individual antibodies of these proteins may be developed andadded to further enhance the performance of the SuperMixcolumn. If available antibodies are limited, then optimizationof the sample loading step may allow more proteins to beeffectively captured.
To conclude, the improved proteome coverage/enhanceddetection of low abundance proteins, reproducibility, and abil-ity for relative quantitation demonstrate the utility of tandemIgY12-SuperMix immunoaffinity separations for clinical bi-omarker discovery applications involved with human bioflu-
ids. These tandem separations can be coupled with eitherLC-MS-based or gel-based approaches with or without fur-ther fractionation. We anticipate that this tandem IgY12-Su-perMix strategy may also significantly enhance the effective-ness of directed MS in the multiple reaction monitoring modefor candidate biomarker verification (22–24).
Acknowledgments—The experimental work described herein wasperformed in the Environmental Molecular Sciences Laboratory, anational scientific user facility sponsored by the Department of Energy(DOE) and located at Pacific Northwest National Laboratory, which isoperated by Battelle Memorial Institute for the DOE under ContractDE-AC05-76RL0 1830.
* This work was supported, in whole or in part, by National Insti-tutes of Health Grants RR018522 from the National Center for Re-search Resources and U54 GM-62119-02, an NIGMS large scalecollaborative research grant. This work was also supported by a grantfrom the Entertainment Industry Foundation (EIF) and the EIF Wom-en’s Cancer Research Fund (to the Breast Cancer Biomarker Discov-ery Consortium). The costs of publication of this article were defrayedin part by the payment of page charges. This article must therefore behereby marked “advertisement” in accordance with 18 U.S.C. Section1734 solely to indicate this fact.
□S The on-line version of this article (available at http://www.mcponline.org) contains supplemental material.
� To whom correspondence should be addressed: EnvironmentalMolecular Sciences Laboratory, Pacific Northwest National Labora-tory, P. O. Box 999, MSIN: K8-98, Richland, WA 99352. E-mail:[email protected].
REFERENCES
1. Hu, S., Loo, J. A., and Wong, D. T. (2006) Human body fluid proteomeanalysis. Proteomics 6, 6326–6353
2. Rifai, N., Gillette, M. A., and Carr, S. A. (2006) Protein biomarker discoveryand validation: the long and uncertain path to clinical utility. Nat. Bio-technol. 24, 971–983
3. Anderson, N. L., and Anderson, N. G. (2002) The human plasma proteome:history, character, and diagnostic prospects. Mol. Cell. Proteomics 1,845–867
4. Qian, W. J., Jacobs, J. M., Liu, T., Camp, D. G., II, and Smith, R. D. (2006)Advances and challenges in liquid chromatography-mass spectrometry-based proteomics profiling for clinical applications. Mol. Cell. Proteomics5, 1727–1744
5. Lee, H. J., Lee, E. Y., Kwon, M. S., and Paik, Y. K. (2006) Biomarkerdiscovery from the plasma proteome using multidimensional fraction-ation proteomics. Curr. Opin. Chem. Biol. 10, 42–49
6. Wang, H., Clouthier, S. G., Galchev, V., Misek, D. E., Duffner, U., Min, C. K.,Zhao, R., Tra, J., Omenn, G. S., Ferrara, J. L., and Hanash, S. M. (2005)Intact-protein-based high-resolution three-dimensional quantitativeanalysis system for proteome profiling of biological fluids. Mol. Cell.Proteomics 4, 618–625
7. Liu, T., Qian, W. J., Mottaz, H. M., Gritsenko, M. A., Norbeck, A. D., Moore,R. J., Purvine, S. O., Camp, D. G., II, and Smith, R. D. (2006) Evaluationof multiprotein immunoaffinity subtraction for plasma proteomics andcandidate biomarker discovery using mass spectrometry. Mol. Cell. Pro-teomics 5, 2167–2174
8. Pieper, R., Su, Q., Gatlin, C. L., Huang, S. T., Anderson, N. L., and Steiner,S. (2003) Multi-component immunoaffinity subtraction chromatography:an innovative step towards a comprehensive survey of the humanplasma proteome. Proteomics 3, 422–432
9. Zolotarjova, N., Martosella, J., Nicol, G., Bailey, J., Boyes, B. E., andBarrett, W. C. (2005) Differences among techniques for high-abundantprotein depletion. Proteomics 5, 3304–3313
10. Huang, L., Harvie, G., Feitelson, J. S., Gramatikoff, K., Herold, D. A., Allen,D. L., Amunngama, R., Hagler, R. A., Pisano, M. R., Zhang, W. W., andFang, X. (2005) Immunoaffinity separation of plasma proteins by IgY
Tandem IgY-SuperMix Immunoaffinity Separations
1972 Molecular & Cellular Proteomics 7.10

microbeads: meeting the needs of proteomic sample preparation andanalysis. Proteomics 5, 3314–3328
11. Yocum, A. K., Yu, K., Oe, T., and Blair, I. A. (2005) Effect of immunoaffinitydepletion of human serum during proteomic investigations. J. ProteomeRes. 4, 1722–1731
12. Brand, J., Haslberger, T., Zolg, W., Pestlin, G., and Palme, S. (2006)Depletion efficiency and recovery of trace markers from a multiparameterimmunodepletion column. Proteomics 6, 3236–3242
13. Qian, W. J., Liu, T., Monroe, M. E., Strittmatter, E. F., Jacobs, J. M., Kangas,L. J., Petritis, K., Camp, D. G., and Smith, R. D. (2005) Probability-basedevaluation of peptide and protein identifications from tandem massspectrometry and SEQUEST analysis: the human proteome. J. ProteomeRes. 4, 53–62
14. Liu, T., Qian, W. J., Gritsenko, M. A., Xiao, W., Moldawer, L. L., Kaushal, A.,Monroe, M. E., Varnum, S. M., Moore, R. J., Purvine, S. O., Maier, R. V.,Davis, R. W., Tompkins, R. G., Camp, D. G., II, and Smith, R. D. (2006)High dynamic range characterization of the trauma patient plasma pro-teome. Mol. Cell. Proteomics 5, 1899–1913
15. Nesvizhskii, A. I., Keller, A., Kolker, E., and Aebersold, R. (2003) A statisticalmodel for identifying proteins by tandem mass spectrometry. Anal.Chem. 75, 4646–4658
16. Anderson, N. G., Willis, D. D., Holladay, D. W., Caton, J. E., Holleman, J. W.,Eveleigh, J. W., Attrill, J. E., Ball, F. L., and Anderson, N. L. (1975)Analytical techniques for cell fractions. XX. Cyclic affinity chromatogra-phy: principles and applications. Anal. Biochem. 68, 371–393
17. Liu, H., Sadygov, R. G., and Yates, J. R., III (2004) A model for randomsampling and estimation of relative protein abundance in shotgun pro-teomics. Anal. Chem. 76, 4193–4201
18. Qian, W. J., Jacobs, J. M., Camp, II, D. G., Monroe, M. E., Moore, R. J.,Gritsenko, M. A., Calvano, S. E., Lowry, S. F., Xiao, W., Moldawer, L. L.,Davis, R. W., Tompkins, R. G., and Smith, R. D. (2005) Comparative
proteome analyses of human plasma following in vivo lipopolysaccharideadministration using multidimensional separations coupled with tandemmass spectrometry. Proteomics 5, 572–584
19. Zybailov, B., Coleman, M. K., Florens, L., and Washburn, M. P. (2005)Correlation of relative abundance ratios derived from peptide ion chro-matograms and spectrum counting for quantitative proteomic analysisusing stable isotope labeling. Anal. Chem. 77, 6218–6224
20. Wang, H., and Hanash, S. (2005) Intact-protein based sample preparationstrategies for proteome analysis in combination with mass spectrometry.Mass Spectrom. Rev. 24, 413–426
21. Sheng, S., Chen, D., and Van Eyk, J. E. (2006) Multidimensional liquidchromatography separation of intact proteins by chromatographic fo-cusing and reversed phase of the human serum proteome: optimizationand protein database. Mol. Cell. Proteomics 5, 26–34
22. Keshishian, H., Addona, T., Burgess, M., Kuhn, E., and Carr, S. A. (2007)Quantitative, multiplexed assays for low abundance proteins in plasmaby targeted mass spectrometry and stable isotope dilution. Mol. Cell.Proteomics 6, 2212–2229
23. Anderson, L., and Hunter, C. L. (2006) Quantitative mass spectrometricmultiple reaction monitoring assays for major plasma proteins. Mol. Cell.Proteomics 5, 573–588
24. Stahl-Zeng, J., Lange, V., Ossola, R., Eckhardt, K., Krek, W., Aebersold, R.,and Domon, B. (2007) High sensitivity detection of plasma proteins bymultiple reaction monitoring of N-glycosites. Mol. Cell. Proteomics 6,1809–1817
25. Haab, B. B., Geierstanger, B. H., Michailidis, G., Vitzthum, F., Forrester, S.,Okon, R., Saviranta, P., Brinker, A., Sorette, M., Perlee, L., Suresh, S.,Drwal, G., Adkins, J. N., and Omenn, G. S. (2005) Immunoassay andantibody microarray analysis of the HUPO Plasma Proteome Projectreference specimens: systematic variation between sample types andcalibration of mass spectrometry data. Proteomics 5, 3278–3291
Tandem IgY-SuperMix Immunoaffinity Separations
Molecular & Cellular Proteomics 7.10 1973
Top Related
Copyright © 2022 FDOKUMEN

