


Bahasa
Halaman
Hukum


Please cite as: Murphy F, Devlin G, Mcdonnell K (2013) Energy requirements and environmental impacts associated with the production of short rotation willow (Salix sp.) chip in Ireland. GCB Bioenergy, Advance online publication. DOI:10.1111/gcbb.12111.
Energy requirements and environmental impacts associated with the production of short 1
rotation willow (Salix sp.) chip in Ireland 2
Fionnuala Murphy, Ger Devlin and Kevin McDonnell. 3
School of Biosystems Engineering, University College Dublin, Belfield, Dublin 4, Ireland. 4
Corresponding author: Ms. Fionnuala Murphy 5
Biosystems Engineering 6
Room 325, Agriculture Building, 7
UCD Belfield, 8
Dublin 4, 9
Ireland 10
Tel: +35317167458 11
Email: [email protected] 12
Keywords: 13
Short rotation coppice willow 14
LCA 15
Biological fertilizer 16
Bioenergy 17
Energy ratio/requirements 18
Environmental impacts 19
Ireland 20
21

Please cite as: Murphy F, Devlin G, Mcdonnell K (2013) Energy requirements and environmental impacts associated with the production of short rotation willow (Salix sp.) chip in Ireland. GCB Bioenergy, Advance online publication. DOI:10.1111/gcbb.12111.
22
23
Abstract 24
Willow salix sp. is currently cultivated as a short rotation forestry crop in Ireland as a source 25
of biomass to contribute to renewable energy goals. The aim of this study is to evaluate the 26
energy requirements and environmental impacts associated with willow (Salix sp.) 27
cultivation, harvest, and transport using life cycle assessment (LCA). In this study only 28
emissions from the production of the willow chip are included, end-use emissions from 29
combustion are not considered. In this LCA study, three impact categories are considered; 30
acidification potential, eutrophication potential and global warming potential. In addition the 31
cumulative energy demand and energy ratio of the system are evaluated. The results identify 32
three key processes in the production chain which contribute most to all impact categories 33
considered; maintenance, harvest and transportation of the crop. Sensitivity analysis on the 34
type of fertilizers used, harvesting technologies, and transport distances highlight the effects 35
of these management techniques on overall system performance. Replacement of synthetic 36
fertiliser with biosolids results in a reduction in overall energy demand, but raises 37
acidification potential, eutrophication potential, and global warming potential. Rod harvesting 38
compares unfavourably in comparison with direct chip harvesting in each of the impact 39
categories considered due to the additional chipping step required. The results show that 40
dedicated truck transport is preferable to tractor-trailer transport in terms of energy demand 41
and environmental impacts. Finally, willow chip production compares favourably with coal 42
provision in terms of energy ratio and global warming potential, while achieving a higher 43
energy ratio than peat provision but also a higher global warming potential. 44
45

Please cite as: Murphy F, Devlin G, Mcdonnell K (2013) Energy requirements and environmental impacts associated with the production of short rotation willow (Salix sp.) chip in Ireland. GCB Bioenergy, Advance online publication. DOI:10.1111/gcbb.12111.
46
47
Introduction 48
Bioenergy targets, policy and uptake in Ireland 49
Biomass, a source of renewable energy, has received much attention in recent years as many 50
countries endeavour to reduce greenhouse gas (GHG) emissions and the reliance on 51
dwindling fossil fuel resources. In an effort to develop a sustainable energy economy and 52
reduce GHG emissions, the European Union adopted a series of targets to be achieved by 53
2020; a 20% reduction in GHG emissions, a 20% increase in energy efficiency, and 20 % of 54
the overall share of energy to come from renewable sources (European Commission, 2007). 55
These targets became mandatory in 2009 with the publishing of the EU Renewable Energy 56
Directive (European Commission, 2009). Each country in the EU was assigned different 57
targets in order to achieve the overall target for Europe. Ireland's mandatory renewable 58
energy target is 16% of gross final consumption to come from renewables by 2020 (European 59
Commission, 2009). The Irish government first outlined its commitment to bioenergy by 60
publishing the Government White Paper on Energy in 2007 which laid out strategic goals for 61
sustainable energy production (Department of Communications Marine and Natural 62
Resources, 2007). In an effort to promote the use of bioenergy in Ireland and to contribute to 63
meeting the EU targets outlined above, the Government set out to implement co-firing of 64
biomass at the three peat-fired electricity generating plants owned by the state. The co-firing 65
targets are limited to cofiring 30% of the maximum rated capacity in any plant until 2017, 66
40% between 2017 and 2019, and 50% thereafter (Department of Communications Energy 67
and Natural Resources, 2010). Three hundred kilotonnes of biomass will be required to 68
Please cite as: Murphy F, Devlin G, Mcdonnell K (2013) Energy requirements and environmental impacts associated with the production of short rotation willow (Salix sp.) chip in Ireland. GCB Bioenergy, Advance online publication. DOI:10.1111/gcbb.12111.
achieve 30% co-firing at Edenderry power plant alone. In order to meet this demand, 69
additional quantities of biomass to those currently co-fired will need to be obtained. 70
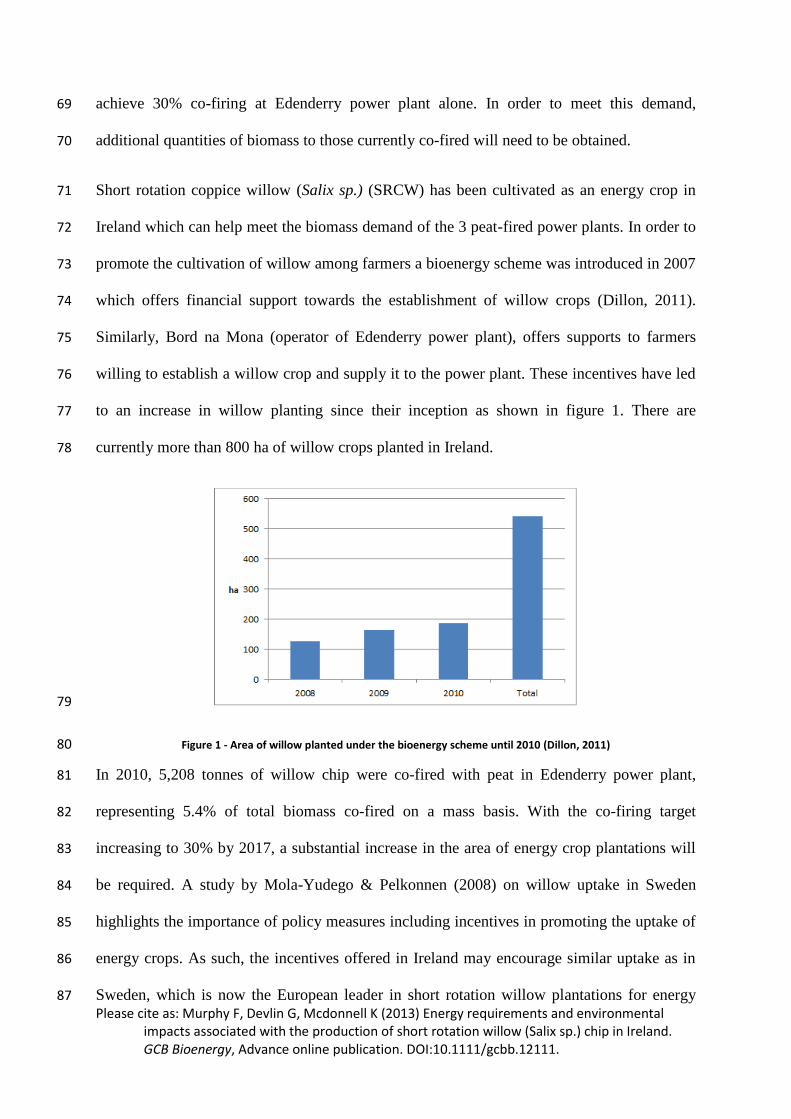
Short rotation coppice willow (Salix sp.) (SRCW) has been cultivated as an energy crop in 71
Ireland which can help meet the biomass demand of the 3 peat-fired power plants. In order to 72
promote the cultivation of willow among farmers a bioenergy scheme was introduced in 2007 73
which offers financial support towards the establishment of willow crops (Dillon, 2011). 74
Similarly, Bord na Mona (operator of Edenderry power plant), offers supports to farmers 75
willing to establish a willow crop and supply it to the power plant. These incentives have led 76
to an increase in willow planting since their inception as shown in figure 1. There are 77
currently more than 800 ha of willow crops planted in Ireland. 78
79
Figure 1 - Area of willow planted under the bioenergy scheme until 2010 (Dillon, 2011) 80
In 2010, 5,208 tonnes of willow chip were co-fired with peat in Edenderry power plant, 81
representing 5.4% of total biomass co-fired on a mass basis. With the co-firing target 82
increasing to 30% by 2017, a substantial increase in the area of energy crop plantations will 83
be required. A study by Mola-Yudego & Pelkonnen (2008) on willow uptake in Sweden 84
highlights the importance of policy measures including incentives in promoting the uptake of 85
energy crops. As such, the incentives offered in Ireland may encourage similar uptake as in 86
Sweden, which is now the European leader in short rotation willow plantations for energy 87

Please cite as: Murphy F, Devlin G, Mcdonnell K (2013) Energy requirements and environmental impacts associated with the production of short rotation willow (Salix sp.) chip in Ireland. GCB Bioenergy, Advance online publication. DOI:10.1111/gcbb.12111.
production with the establishment of more than 14,000 ha on agricultural lands (González-88
García et al., 2012b). 89
Suitability to Irish conditions 90
In context of climate and soils, willow (Salix) is the most suitable woody biomass crop for 91
Ireland and for many other temperate regions of the World. Willow coppice has a high water 92
requirement, in line with other conventional agricultural crops (Jørgensen & Schelde, 2001), 93
and hence requires a good moisture retentive soil. Areas with an annual rainfall of 900-94
1,100mm are optimal for willow production, as well as areas where the crop has access to 95
ground water (Teagasc, 2010). A study by Lindroth and Båth (1999) highlights water as a 96
limiting factor in achieving high yields. According to Met Éireann statistics, the vast majority 97
of Ireland receives upwards of 800 mm of rainfall per year (Met Éireann, 2012). Therefore, 98
water availability does not represent a constraint in Irish conditions. 99
Justification for willow 100
The production and use of SRCW as a source of renewable energy has numerous benefits 101
which contribute to its sustainability, environmentally, economically, and ecologically; 102
Willow (Salix. Sp.) is suitable for cultivation on medium fertility sites, thus not competing 103
for the most fertile land which is currently used for food production (Helby et al., 2004). The 104
long life-span of willow crops (20 plus years) allows the accumulation of soil carbon in 105
mineral soils, as well as promoting stable nutrient cycling and soil biological activity, 106
resulting in increased soil fertility when compared to conventional agricultural crops 107
(Abrahamson et al., 1998, Börjesson, 1999a, Helby et al., 2004, Rowe et al., 2009). In 108
addition, the cultivation of willow promotes a higher biodiversity when compared to 109
conventional agricultural crops (Perttu, 1998, Sage, 1998, Schulz et al., 2009). 110

Please cite as: Murphy F, Devlin G, Mcdonnell K (2013) Energy requirements and environmental impacts associated with the production of short rotation willow (Salix sp.) chip in Ireland. GCB Bioenergy, Advance online publication. DOI:10.1111/gcbb.12111.
Willow crops are also known for their bioremediation potential. Willow has been proven to 111
effectively take up nutrients and heavy metals (Börjesson, 1999a, Dimitriou & Aronsson, 112
2011, Klang-Westin & Eriksson, 2003, Perttu, 1998). Cultivation of willow can therefore be 113
used to treat a number waste sources; wastewater, municipal waste, sewage sludge, distillery 114
effluent. Willow is particularly appropriate to treat these types of waste as it is not a food 115
crop, thereby not threatening contamination in the food chain (Curley, 2010). 116
The use of SRCW as an energy source has been shown to be more favourable than the use of 117
fossil fuels in terms of GHG emissions and energy requirements (González-García et al., 118
2012a, Heller et al., 2004, Perttu, 1998). Furthermore, willow also performs positively in 119
comparison to other biomass sources such as annual food crops, sugar beet and oil seed 120
production (Börjesson, 1996). 121
The economics of willow production can be improved if the crop is used for waste treatment 122
as outlined above. Waste application allows an avoidance of fertilizer costs, and the gross 123
profit margin increases further if compensation is paid to the farmer for waste treatment, 124
however, currently this is not common practice in Ireland (Börjesson, 1999b, Dimitriou & 125
Rosenqvist, 2011, Rosenqvist & Dawson, 2005). A survey carried out by Augustenborg et al. 126
(2012), has shown high willingness of farmers to adopt energy crops in Ireland, with over 127
70% of respondents indicating interest in producing energy crops. 128
Why Life Cycle Assessment? 129
Despite the environmental benefits associated with willow production as reported above, 130
intensive willow coppice cultivation involves potential negative environmental effects. The 131
life cycle of a willow crop managed for energy purposes requires the use of energy and raw 132
materials in several respects; in the extraction of raw materials (fuels, minerals), in 133
production and transportation of system inputs (fertilizers, pesticides), and in field operations 134

Please cite as: Murphy F, Devlin G, Mcdonnell K (2013) Energy requirements and environmental impacts associated with the production of short rotation willow (Salix sp.) chip in Ireland. GCB Bioenergy, Advance online publication. DOI:10.1111/gcbb.12111.
required for crop cultivation. Willow crop cultivation also results in emissions to air, soil, and 135
water which may have effects on the environment. It is essential that all effects, positive and 136
negative, are considered in a holistic manner to enable a comprehensive evaluation of the 137
system. LCA is a tool which can be used to assess the sustainability of agricultural and 138
energy production systems in terms of energy balance and environmental impacts. LCA 139
allows the holistic evaluation of the environmental impact of a product or system over its 140
entire life-cycle, from raw materials acquisition through processing, to the point of final 141
consumption and disposal. In LCA, the material and energy inputs for each step in the life 142
cycle are quantified, and related to the resulting outputs in the system inventory. Potential 143
environmental impacts resulting from the system are then predicted based on this inventory. 144
The holistic nature of LCA analysis allows the identification of hotspots in the system; points 145
of critical contributions to key environmental impacts. A wide range of LCA literature exists 146
evaluating the benefits of energy crops systems (Butnar et al., 2010, Gasol et al., 2010, Monti 147
et al., 2009, Rafaschieri et al., 1999), with a number of them focusing on willow production 148
(González-García et al., 2012b, Heller et al., 2003, Lettens et al., 2003, St. Clair et al., 2008, 149
Styles & Jones, 2008). 150
The aim of this study is to evaluate the energy requirements and environmental impacts 151
associated with the cultivation, harvest, and transport of willow (Salix sp.) for energy 152
utilisation in Ireland. The paper presents detailed life cycle inventory (LCI) data for willow 153
cultivation in Ireland. The paper considers a number of scenarios based on; synthetic fertilizer 154
and biosolid application, chip and whole rod harvesting, and transport distances. Cherubini et 155
al. (2009) have recommended that the energy and GHG balances of biomass to energy 156
systems should always be contrasted against fossil fuel systems. This allows comparison of 157
the potential benefits/drawbacks of the bioenergy system in question. As such, the results of 158
Please cite as: Murphy F, Devlin G, Mcdonnell K (2013) Energy requirements and environmental impacts associated with the production of short rotation willow (Salix sp.) chip in Ireland. GCB Bioenergy, Advance online publication. DOI:10.1111/gcbb.12111.
this LCA are compared to some common fossil fuels including coal and peat, feedstocks with 159
which biomass is commonly co-fired in Ireland (Heller et al., 2004, Mann & Spath, 2001, 160
Sebastián et al., 2011, Styles & Jones, 2008). 161
Materials and Methods 162
The LCA is carried out in accordance with the steps outlined in the International Standards 163
on life cycle assessment, namely; goal and scope definition, life cycle inventory analysis 164
(LCI), life cycle impact assessment (LCIA) and life cycle interpretation (ISO 14040, 2006, 165
ISO 14044, 2006). The LCA software SimaPro v7.3.2 (PRé Consultants, 2011) was used to 166
construct the LCA model and undertake the impact assessment calculations. 167
Goal and Scope 168
The aim of this study is to evaluate the energy requirements and environmental impacts 169
associated with willow (Salix sp.) cultivation, harvest and transport. Different management 170
practices based on the application of synthetic and organic fertilizers are compared. Two 171
methods of harvesting, direct chip and whole rod, are analysed. Two transport distances are 172
evaluated; 50 km and 100 km. The scenario with the highest energy ratio will be determined. 173
It is envisaged that the results of this study will help to establish the most environmentally 174
friendly pathways for willow cultivation and harvest. As this study focuses on the production 175
of biomass and transport to the end user gate it is thus considered a ‘cradle to gate’ LCA. 176
Functional unit 177
The function of the SRCW system is the production of biomass for energy use. The 178
functional unit generally used in other LCA studies on biomass production is area of crop 179
production (hectare) (Goglio & Owende, 2009, González-García et al., 2012b, Heller et al., 180
2003, Styles & Jones, 2008). However, as the function of the system being studied is for 181

Please cite as: Murphy F, Devlin G, Mcdonnell K (2013) Energy requirements and environmental impacts associated with the production of short rotation willow (Salix sp.) chip in Ireland. GCB Bioenergy, Advance online publication. DOI:10.1111/gcbb.12111.
energy use, and the results are to be compared with fossil fuels, the functional unit in this 182
case is ‘1 GJ of energy contained in the willow biomass’. Using a measure of energy 183
contained in the feedstock allows the energy productivity of the system to be analysed in 184
comparison with other sources of fuel (Goglio et al., 2012, Nemecek et al., 2011). 185
System description 186
The LCA considers three aspects of the supply chain; willow cultivation, harvesting and 187
transport. All of the field activities, from land preparation, to maintenance, harvesting and 188
transport have been considered, as can be seen in the system diagram in figure 2. All of the 189
inputs (material, fuel, energy) and outputs (product flow, and emissions to air, soil, water) for 190
each of the unit operations in the supply chain are quantified and included in the LCA. 191
192
Figure 2 - System boundary of willow cultivation. Dotted lines denote material inputs to the system. 193

Please cite as: Murphy F, Devlin G, Mcdonnell K (2013) Energy requirements and environmental impacts associated with the production of short rotation willow (Salix sp.) chip in Ireland. GCB Bioenergy, Advance online publication. DOI:10.1111/gcbb.12111.
194
Description of crop production cycle outlined in figure 2: 195
The ground is prepared prior to seeding. This involves application of herbicide to control 196
actively growing weeds, ploughing, and finally disking to prepare a stale seedbed for 197
planting. The willow crop is planted with a modified potato planter to a density of 16,500 198
cuttings per hectare. The site is consolidated by rolling and a residual herbicide applied. The 199
crop is cutback during the first growing season and further herbicide applied. Fertiliser is not 200
applied during the first two growing seasons. Beyond this, fertilizer is applied 7 times over 201
the life of the willow plantation (after every 3 year harvest). Herbicide is also applied at this 202
stage. Nitrogen is added to the growing plants in the spring with the aim of minimising the 203
amount of fertilizer taken up by competing plants (weeds) or lost through runoff (Volk et al., 204
2004). The application of synthetic fertilizers and biological fertilizers are compared in this 205
study. Willow is harvested on a 3-yearly basis. Upon harvest, the willow biomass is 206
transported 5 km to the farm yard. Two harvesting methods are compared in this study; direct 207
chipping, and whole rod harvesting followed by chipping. In the case of rod harvesting, the 208
rods are chipped at the farm yard. The willow chip is transferred to trucks and is transported 209
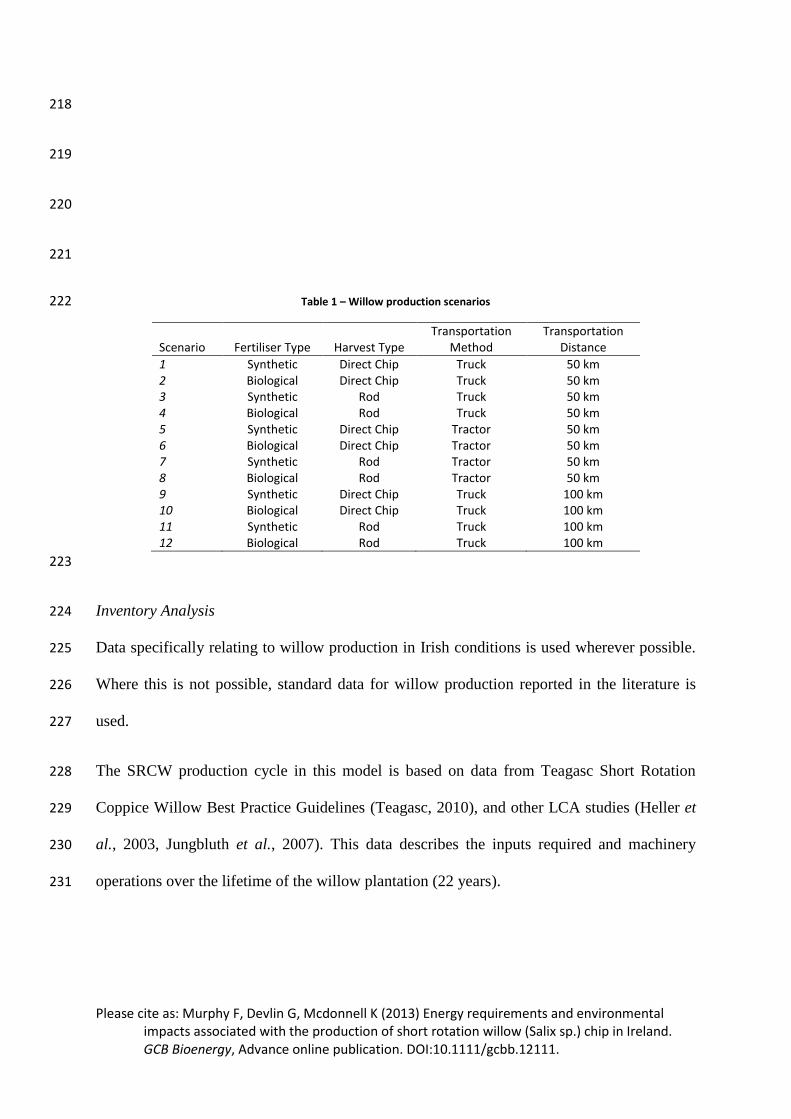
to the distributor. In this analysis three transport scenarios are compared; delivered 50 km and 210
100 km by truck, and delivered 50 km by tractor-trailer. The willow crop is removed from the 211
site at the end of the crops life (approximately 22 years) by the application of herbicide such 212
as glyphosate followed by ploughing. This leaves the majority of the root system in place 213
without damaging the soil structure (Teagasc, 2010). Once the willow chip is deposited at 214
Edenderry power plant, the assumed end user in this study, the willow is mixed with peat and 215
co-fired immediately, therefore no drying occurs. Each scenario is outlined in Table 1, with 216
scenario 1 representing the base case. 217
Please cite as: Murphy F, Devlin G, Mcdonnell K (2013) Energy requirements and environmental impacts associated with the production of short rotation willow (Salix sp.) chip in Ireland. GCB Bioenergy, Advance online publication. DOI:10.1111/gcbb.12111.
218
219
220
221
Table 1 – Willow production scenarios 222
Scenario Fertiliser Type Harvest Type Transportation
Method Transportation
Distance
1 Synthetic Direct Chip Truck 50 km 2 Biological Direct Chip Truck 50 km 3 Synthetic Rod Truck 50 km 4 Biological Rod Truck 50 km 5 Synthetic Direct Chip Tractor 50 km 6 Biological Direct Chip Tractor 50 km 7 Synthetic Rod Tractor 50 km 8 Biological Rod Tractor 50 km 9 Synthetic Direct Chip Truck 100 km 10 Biological Direct Chip Truck 100 km 11 Synthetic Rod Truck 100 km 12 Biological Rod Truck 100 km
223
Inventory Analysis 224
Data specifically relating to willow production in Irish conditions is used wherever possible. 225
Where this is not possible, standard data for willow production reported in the literature is 226
used. 227
The SRCW production cycle in this model is based on data from Teagasc Short Rotation 228
Coppice Willow Best Practice Guidelines (Teagasc, 2010), and other LCA studies (Heller et 229
al., 2003, Jungbluth et al., 2007). This data describes the inputs required and machinery 230
operations over the lifetime of the willow plantation (22 years). 231

Please cite as: Murphy F, Devlin G, Mcdonnell K (2013) Energy requirements and environmental impacts associated with the production of short rotation willow (Salix sp.) chip in Ireland. GCB Bioenergy, Advance online publication. DOI:10.1111/gcbb.12111.
Machinery and fuel consumption 232
Data regarding the manufacture and fuel consumption of conventional agricultural machinery 233
used in willow cultivation were obtained from a report by Nemecek et al. (2007). For 234
machinery specifically related to willow production, not contained in the ecoinvent databases, 235
other sources of data were used (Association d'Initiatives Locales pour l'Energie at 236
l'Environnement, 2007, Lechasseur & Savoie, 2005). Data on tractor and trailer manufacture 237
and use comes from the ecoinvent database (Spielmann et al., 2007). 238
Most of the air emissions from biomass supply chains are due to the combustion of fossil 239
fuels in machinery engines, and measurement of these emissions in non-laboratory conditions 240
is difficult (Hansson et al., 2003). Data regarding air emissions from field operations are 241
obtained from Nemecek et al. (2007). Emissions from the willow harvesters were estimated 242
based on methods used in Nemecek et al. (2007) and fuel consumption data in published 243
literature (Association d'Initiatives Locales pour l'Energie at l'Environnement, 2007, 244
Lechasseur & Savoie, 2005). 245
Table 2 outlines frequency of field operations over the lifetime of the crop. 246
Table 2 – Summary of field operations and associated machinery data 247
Machinery dataa
Field operation Frequency of
operation (per 22 year cycle)
Productivity (h/ha)
Fuel consumption (l/h)
Fuel consumption (l/ha)
Pre-ploughing herbicide 1 0.7 3 2.1 Plough 2 2.1 14.8 31.08 Disk 1 1.2 11.4 13.68
Plant 1 5.3 2 10.6 Roll 1 0.9 4.2 3.78
Harvest 7 See table 4 Herbicide 8 0.7 3 2.1 Fertilise 7 1.5 4.2 6.3
a(Nemecek et al., 2007) 248
249

Please cite as: Murphy F, Devlin G, Mcdonnell K (2013) Energy requirements and environmental impacts associated with the production of short rotation willow (Salix sp.) chip in Ireland. GCB Bioenergy, Advance online publication. DOI:10.1111/gcbb.12111.
Field inputs 250
Nursery stock production was modelled based on data from Jungbluth, Frischknecht et al. 251
(2007) and Heller, Keoleian et al. (2003). 252
Nitrogen, phosphorus and potassium fertilizer data was obtained from the Danish LCA Food 253
Database (Nielsen et al., 2003). The nitrogen fertilizer plant does not include catalytic N2O 254
cleaning. The application of biosolids (sewage sludge) as a soil amendment was modelled 255
according to Galbally et al. (2012) and Curly (Curley, 2010). Average values for the nutrient 256
content of biosolids were obtained from McGrath et al. (2000). Nutrient availability from 257
biosolids were assumed to be 40% of N (Irish Government, 2009) and 46% of P (Plunkett, 258
2010) contained in the biosolids. The biosolids were assumed to have been pre-treated by 259
anaerobic digestion, followed by storage and transportation of 15 km according to Akwo 260
(2008) and Hospido et al. (2005). 261
The annual leaf litter from the willow crop represents a further source of nutrients which can 262
be re-utilised by the growing plant (Baum et al., 2009, Ericsson, 1994). Annual leaf fall in 263
this case is assumed to be 3,800 kg ha-1
yr-1
and a leaf nitrogen content of 1.5% was assumed 264
according to Heller, Keoleian et al. (2003). 265
Data on pesticide manufacture was obtained from Nemecek et al.(2007). 266
Table 3 outlines the inputs over the lifetime of the cropping system. 267
Table 3 - Data summary of inputs to cropping system (Caslin, 2010) 268
Plan Input Frequency (per 22 year cycle)
Application rate (kg/ha)
Total (kg/ha) over life cycle
Land preparation
Water 1 400 400
Glyphosate 1 1.98 1.98
Crop Establishment
Cuttings 1 16500u 16500u
Water 1 500 500
Pendimethalin 1 1.09 1.09
Cutback Water 1 200 200

Please cite as: Murphy F, Devlin G, Mcdonnell K (2013) Energy requirements and environmental impacts associated with the production of short rotation willow (Salix sp.) chip in Ireland. GCB Bioenergy, Advance online publication. DOI:10.1111/gcbb.12111.
Pendimethalin 1 1.37 1.37
Maintenance
Water 7 200 1400
Nitrogen 7 120 840
Phosphorous 7 15 105
Potassium 7 10 280
Pendimethalin 7 1.37 9.59
Crop removal Water 1 200 200 Glyphosate 1 1.8 1.8
269
Field emissions 270
The cultivation of willow and the application of fertilizers result in emissions to air, soil and 271
water. 272
The ammonium contained in fertilizers can be released to the atmosphere as ammonia (NH3) 273
through the process of volatilisation. Rates of volatilisation depend on a number of factors; 274
fertilizer type, soil type and pH, and weather conditions (Heller et al., 2003). In this study, 275
NH3 volatilisation is assumed to be 2% of applied nitrogen according to sources (Cherubini et 276
al., 2009, Nemecek et al., 2007). For the application of biosolids, it is assumed that 26% of 277
the N contained in the biosolids is released as ammonia according to Nemecek, Kägi et al. 278
(2007). 279
Nitrous oxide (N2O) is produced naturally as a product in the denitrification and nitrification 280
processes by soil micro-organisms. The addition of nitrogen to the cropping system in the 281
form of both synthetic and biological fertilizers enhances N2O formation. N2O is a powerful 282
greenhouse gas and is has 298 times the global warming potential of 1 kg of CO2 equivalent 283
(Hellebrand et al., 2008). Uncertainties exist in estimates of N2O emissions from managed 284
soils due to a number of factors including; uncertainties related to the emission factors, 285
natural variability, activity data, spatial aggregation, and lack of information on specific on-286
farm practices (IPPC, 2006). In this study N2O formation is estimated to be 1.25% of 287
available nitrogen from synthetic sources after ammonia volatilisation. This estimation is 288

Please cite as: Murphy F, Devlin G, Mcdonnell K (2013) Energy requirements and environmental impacts associated with the production of short rotation willow (Salix sp.) chip in Ireland. GCB Bioenergy, Advance online publication. DOI:10.1111/gcbb.12111.
consistent with those used in published literature (Heller et al., 2003, IPPC, 2006, Jørgensen 289
et al., 1997). As emissions factors for both synthetic fertilizer and biosolids are similar, N2O 290
emission rates for both are assumed to be the same according to the Biosolids Emissions 291
Assessment Model (BEAM) (Brown et al., 2010). 292
During the nitrification process in soils, nitrogen oxides (NOx) may be produced in parallel 293
with N2O. NOx emissions in this study for both synthetic and biosolid fertilizers are estimated 294
according to Nemecek, Kägi et al. (2007). 295
Nitrate leaching under willow plantations is low in comparison with conventional agricultural 296
crops (Dimitriou et al., 2011). However, the loss of nitrates in the soil to groundwater can 297
occur due to the fact that nitrate is easily dissolved in water. The addition of fertilizer to the 298
soil, coupled with high rainfall rates in Ireland result in a high risk of leaching to 299
groundwater. The nitrate leaching rate estimated for conventional crops according to IPPC 300
data (IPPC, 2006), is 30% of applied nitrogen in both synthetic and biosolid fertilizers is lost 301
in leaching to groundwater while 0.75% is converted to N2O. In this study it is assumed that 302
nitrate leaching is reduced by 90% under willow cultivation when compared with 303
conventional agricultural croplands (Jørgensen et al., 2013). Studies on nitrate leaching under 304
willow plantations applied with inorganic fertilizers (Aronsson et al., 2000, Mortensen et al., 305
1998) and wastewaters (Sugiura et al., 2008, Werner & McCracken, 2008) have shown low 306
rates of leaching. In this study it is assumed that nitrate leaching is reduced by 90% under 307
willow cultivation when compared with conventional agricultural croplands (Jørgensen et al., 308
2013). 309
Harvest 310
Harvest losses represent an important loss during the conversion of the standing yield of the 311
crop to the harvested yield. Harvest efficiency for was assumed to be 90% according to Styles 312

Please cite as: Murphy F, Devlin G, Mcdonnell K (2013) Energy requirements and environmental impacts associated with the production of short rotation willow (Salix sp.) chip in Ireland. GCB Bioenergy, Advance online publication. DOI:10.1111/gcbb.12111.
and Jones (2008). The harvest loss was assumed to be the same for both direct chipping 313
system and the rod harvesting followed by chipping system. 314
The yield from the first harvest is assumed to be 23 tonnes dry matter (DM) per hectare. In 315
subsequent rotations this yield rises to approximately 30 tonnes DM per ha (Teagasc, 2010). 316
Edenderry power plant, the assumed end user in this study, require the willow to be chipped 317
and directly transported to the power plant, therefore no drying occurs. The willow yield on a 318
wet basis (55% moisture content) is assumed to be 51 tonnes per hectare in the first rotation, 319
rising to 67 tonnes per hectare in subsequent rotations. The lower heating value of the willow 320
at this moisture level is approximately 7 GJ/t, on a dry matter basis this is 18.4 GJ/t (Caslin, 321
2010). The bulk density of chipped willow at 55% moisture content is assumed to be 285 322
kg/m3 (Garstang et al., 2002). 323
Two harvesting technologies are considered; direct chipping, and rod harvesting followed by 324
chipping in the farm yard (Table 4). It is assumed that the harvested willow chip and rods are 325
transported an initial distance of 5 km from the field to the farm yard by tractor trailer. The 326
willow rods are chipped in the farm yard before transportation. 327
Table 4 – Harvester productivity and fuel consumption 328
Harvest type Productivity (ha/h) Fuel consumption (l/ha)
Whole rod harvestinga 0.2-0.5 50 Direct chip harvestinga 0.1-1 100
a(Association d'Initiatives Locales pour l'Energie at l'Environnement, 2007) 329
Data on the chipper was obtained from the ecoinvent database (Werner et al., 2007) and was 330
modified using data from Spinelli et al. (2011). The productivity of the chipper was assumed 331
to be 27.4 tonnes per hour with an associated fuel consumption of 1.68 litres per tonne. 332

Please cite as: Murphy F, Devlin G, Mcdonnell K (2013) Energy requirements and environmental impacts associated with the production of short rotation willow (Salix sp.) chip in Ireland. GCB Bioenergy, Advance online publication. DOI:10.1111/gcbb.12111.
Transport 333
The produced willow chip is subsequently transport 50 km by a 44 tonne (design gross 334
vehicle weight) truck to the end user. The sensitivity analysis explores the effect of 335
transporting 50 km by tractor and increasing the truck transport distance to 100 km. It is 336
assumed that there is a 2% by mass loss during transport. 337
Data used in calculating the environmental impact of transport vehicles comes from the 338
ecoinvent database (Spielmann et al., 2007). 339
Carbon sequestration 340
Soil carbon sequestration occurs when plants remove CO2 from the atmosphere through 341
photosynthesis and incorporate into the soil carbon pool. Willow, as a perennial crop, has a 342
high capacity to sequester carbon from atmosphere as it has a deep rooting system, causes 343
minimal soil disturbance during its growing season and allows the accumulation of soil 344
carbon over its long lifetime (approximately 22 years). The soil organic carbon is added to 345
the soil by two mechanisms; decay of plant material on the surface and by root growth and 346
senescence below the soil surface (Lemus & Lal, 2005). Factors affecting the rate of soil 347
carbon sequestration under willow crops include; carbon inputs (net primary production), 348
decomposition rates of the major soil carbon pools, initial soil carbon content (an inverse 349
relationship with rates of soil carbon sequestration), crop/plantation management, and depth 350
of soil being influenced by the bioenergy crop (Grogan & Matthews, 2002). The amount of 351
carbon sequestered by SRC willow can be further enhanced if plantations are used for the 352
bioremediation of effluents and sludges (Brown et al., 2010). 353
The conversion of land from arable cropping to perennial bioenergy crops may result in 354
greenhouse gas mitigation due to a number of factors including; reduced fertiliser inputs, 355
increased CO2 sequestration into root biomass and the soil, reduced fieldwork operations and 356
Please cite as: Murphy F, Devlin G, Mcdonnell K (2013) Energy requirements and environmental impacts associated with the production of short rotation willow (Salix sp.) chip in Ireland. GCB Bioenergy, Advance online publication. DOI:10.1111/gcbb.12111.
ploughing, and other inputs associated with cultivation (ploughing, liming, herbicides, fuel 357
usage, grain drying, etc) (Lanigan & Finnan, 2010). The magnitude of any greenhouse gas 358
mitigation benefit depends strongly on the previous land use and former carbon stock levels 359
(Don et al., 2012). 360
With the displacement of arable cropping with perennial willow cultivation, there will be a 361
net increase in carbon sequestration. Arable crop lands have been shown to be net emitters of 362
CO2, mainly due to carbon loss in arable systems caused by ploughing and extended fallow 363
periods, in comparison (Lanigan & Finnan, 2010). It has been estimated that carbon input 364
into the soil associated with the conversion of arable land to willow increases by between 365
1.8–2.7 tCO2 /ha/yr (Rowe et al., 2009). 366
Conversely, the conversion of grassland to willow cultivation is broadly considered to have 367
no impact on long-term net carbon sequestration (Lanigan & Finnan, 2010, Rowe et al., 368
2009). 369
Total site preparation losses (ploughing and soil preparation) are assumed to be 1 tCO2 ha-1
, 370
according to Lanigan (2010). It is assumed that no net carbon sequestration occurs as the 371
reference land use is grassland. 372
Life Cycle Impact Assessment 373
The attributional LCA for willow cultivation in this case was carried out using CML 2001 374
(Guinée et al., 2002) and ecoinvent methods (Frischknecht et al., 2007). The impacts 375
assessed include acidification potential (AP), eutrophication potential (EP), and global 376
warming potential (GWP). The cumulative energy demand (CED) is also evaluated, allowing 377
the energy ratio (energy out versus energy in) of the system to be calculated. 378
Please cite as: Murphy F, Devlin G, Mcdonnell K (2013) Energy requirements and environmental impacts associated with the production of short rotation willow (Salix sp.) chip in Ireland. GCB Bioenergy, Advance online publication. DOI:10.1111/gcbb.12111.
Global warming potential 379
Global warming potential (GWP) is an important environmental impact to consider in the 380
evaluation of renewable energy systems. GWP refers to the potential of the system to trap 381
greenhouse gases in the atmosphere, leading to climate change. Gases which contribute to 382
global warming include carbon dioxide, methane and nitrous oxide. GWP is expressed in kg 383
CO2-equivalents (Guinée et al., 2002). 384
Acidification potential 385
Acidification potential (AP) is an important environmental impact to consider when 386
evaluating bioenergy systems as it is expected to increase with increased production of 387
biomass. AP is caused by the emission of acids or acid forming substance the environment, 388
resulting in acidification of soil and water. Acidification harms natural life such as fish and 389
trees, and also causes damage to buildings etc. The main sources for emissions of acidifying 390
substances are agriculture and fossil fuel combustion. Examples of contributing substances 391
include; sulphur dioxide, nitrogen oxides and ammonia. AP is expressed in kg SO2-392
equivalents (Guinée et al., 2002). 393
Eutrophication potential 394
Eutrophication potential (EP) is another environmental impact important in evaluation 395
bioenergy systems. EP is defined as the potential of nutrients to cause over-fertilisation of 396
water and soil which in turn can result in increased growth of undesirable biomass. This 397
biomass has negative impacts on other life in the ecosystem. Contributing substances include; 398
phosphates, nitrates, ammonia, nitrogen oxides etc. EP is expressed in kg PO4-equivalents 399
(Guinée et al., 2002). 400

Please cite as: Murphy F, Devlin G, Mcdonnell K (2013) Energy requirements and environmental impacts associated with the production of short rotation willow (Salix sp.) chip in Ireland. GCB Bioenergy, Advance online publication. DOI:10.1111/gcbb.12111.
Energy demand and energy ratio 401
Cumulative energy demand (CED) of a product or system characterises both the direct and 402
indirect energy use throughout the life cycle. It is a particularly important evaluation of 403
bioenergy systems in order to ensure that more energy is not consumed than produced. CED 404
is expressed in mega joules (MJ). 405
In addition, Huijbregts et al. (2005) found that CED correlates well with most environmental 406
life cycle impact categories and can be considered an appropriate proxy indicator for 407
environmental performance. 408
A further way to assess advantages of renewable energy systems may be to evaluate the pure 409
energy ratio of the system. The term "energy ratio" is used to characterize relations between 410
the energy input and output. Energy ratio is a ratio between the energy output and energy 411
input (Klvac, 2011). 412
Comparison with fossil fuels 413
When evaluating any bioenergy system it is important the environmental impacts be 414
compared with fossil energy reference systems (Schlamadinger et al., 1997). In this study, the 415
production of willow biomass is compared to the provision of coal and peat, fuels with which 416
willow is commonly co-fired. Data on the environmental impacts of coal and peat supply 417
were obtained from the ecoinvent database (Dones et al., 2007). 418
Results 419
Table 5 quantifies the impacts associated with the production of 1 GJ of energy embodied in 420
the harvested willow chips. Table 5 gives the results of scenario 1 which is considered to be 421
the reference scenario in this study; willow chip production using synthetic fertiliser, direct 422
chip harvesting and transporting the product 50 km by truck to the end user. In this scenario, 423

Please cite as: Murphy F, Devlin G, Mcdonnell K (2013) Energy requirements and environmental impacts associated with the production of short rotation willow (Salix sp.) chip in Ireland. GCB Bioenergy, Advance online publication. DOI:10.1111/gcbb.12111.
the production of 1 GJ of willow chip requires 59.7 MJ of energy, and results in the emission 424
of 5.84 kg CO2-eq, 0.0336 kg SO2-eq and 0.0092 kg PO4-eq. 425
Table 5 - LCA results–AP, EP, GWP, CED per GJ of energy contained in willow chip biomass for the base-case scenario 426
Impact category Unit
Land Preparation Planting Cutback Maintenance Harvest
Crop Removal
Transport Total
AP
kg SO2 eq 0.0005 0.0011 0.0001 0.0216 0.0058 0.0003 0.0043 0.0336
EP
kg PO4-eq
0.0002
0.0009
0.0000
0.0052
0.0017
0.0001
0.0011
0.0092
GWP
kg CO2 eq 0.43 0.15 0.01 2.99 1.32 0.05 0.88 5.84
CED MJ 1.3 1.5 0.2 19.4 21.6 0.8 14.9 59.7
427
Figure 3 shows the percentage contribution of each of the life cycle stages to the overall 428
impacts for each category for the reference scenario (direct chipping of willow grown using 429
synthetic fertilizer and transported a distance of 50 km by truck). 430
431
Figure 3: Percentage contribution of life cycle stages to each impact category for the base-case scenario 432
The results clearly identify three important processes in the production chain; maintenance, 433
harvest and transport. These three steps in the supply chain contribute the largest share of 434
0
10
20
30
40
50
60
70
80
90
100
Acidification(kg SO2 eq)
Eutrophication(kg PO4 eq)
GlobalWarming (kg
CO2 eq)
EnergyDemand (MJ)
%
Transport
Crop Removal
Harvest
Maintenance
Cutback
Planting
Land Preparation
Please cite as: Murphy F, Devlin G, Mcdonnell K (2013) Energy requirements and environmental impacts associated with the production of short rotation willow (Salix sp.) chip in Ireland. GCB Bioenergy, Advance online publication. DOI:10.1111/gcbb.12111.
impacts to each of the impact categories. Maintenance, harvest, and transport, are repeated 435
for every harvest cycle throughout the life cycle, while the other steps are only carried out 436
once. Maintenance of the willow crop is highly energy intensive, with energy required for the 437
manufacture of synthetic fertilizers but also in diesel consumption in the farm machinery 438
used in fertilizer application. Willow harvesting and transport are also significant energy 439
intensive processes with high consumption of diesel in the chipper harvester and truck engine 440
respectively, contributing to the high energy demand. 441
Energy demand and energy ratio 442
Figure 4 demonstrates the energy requirements of each step in the life cycle. Figures in black 443
indicate the energy demand associated with each individual step, while figures in bold 444
represent cumulative energy demand along the production chain. The final figures show that 445
the cumulative energy required to produce 1 GJ of energy contained in the harvested willow. 446
Energy consumption ranged from 51.6 – 107.7 MJ/GJ biomass, with biosolid application, 447
direct chip harvesting, and biomass transportation 50 km by truck requiring the least energy 448
input. On the other hand, the most energy intensive system involved synthetic fertiliser 449
application, rod harvesting and tractor-trailer transport over a distance of 50 km. 450

Please cite as: Murphy F, Devlin G, Mcdonnell K (2013) Energy requirements and environmental impacts associated with the production of short rotation willow (Salix sp.) chip in Ireland. GCB Bioenergy, Advance online publication. DOI:10.1111/gcbb.12111.
451
Figure 4: Energy flow diagram 452
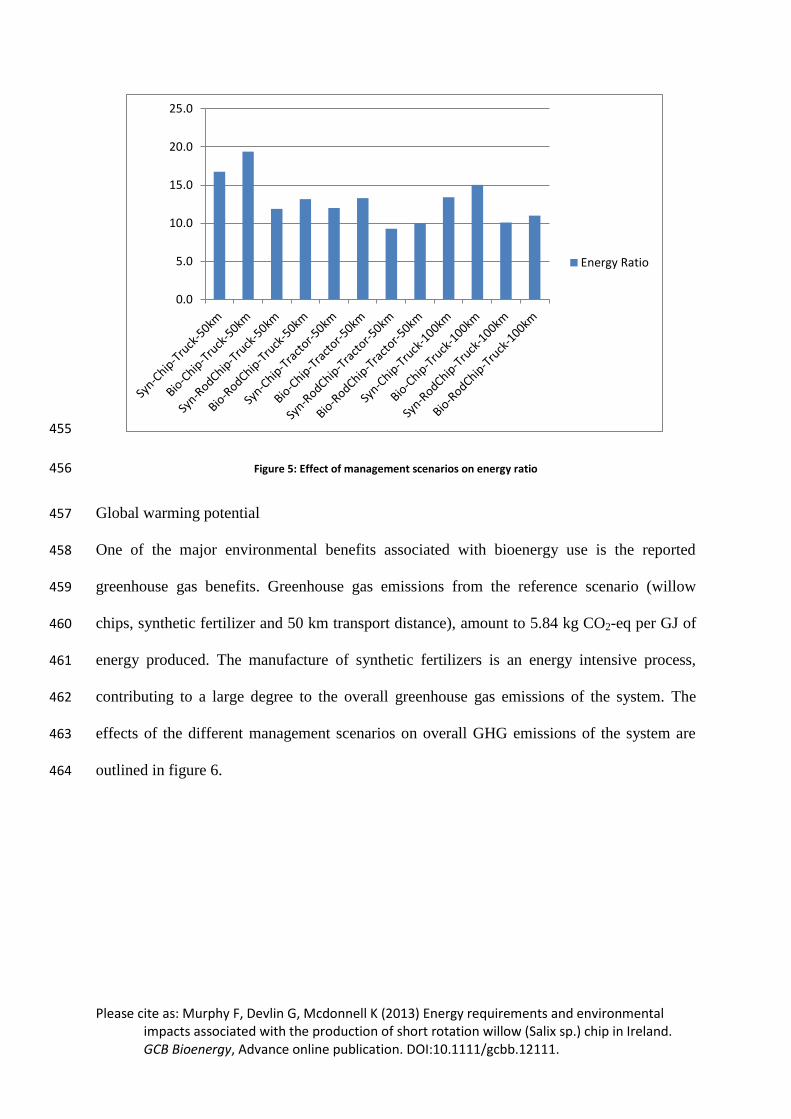
Figure 5 graphs the energy ratio of the willow production system under the different 453
management scenarios. The energy ratio ranges from 9.29 – 19.38. 454
Please cite as: Murphy F, Devlin G, Mcdonnell K (2013) Energy requirements and environmental impacts associated with the production of short rotation willow (Salix sp.) chip in Ireland. GCB Bioenergy, Advance online publication. DOI:10.1111/gcbb.12111.
455
Figure 5: Effect of management scenarios on energy ratio 456
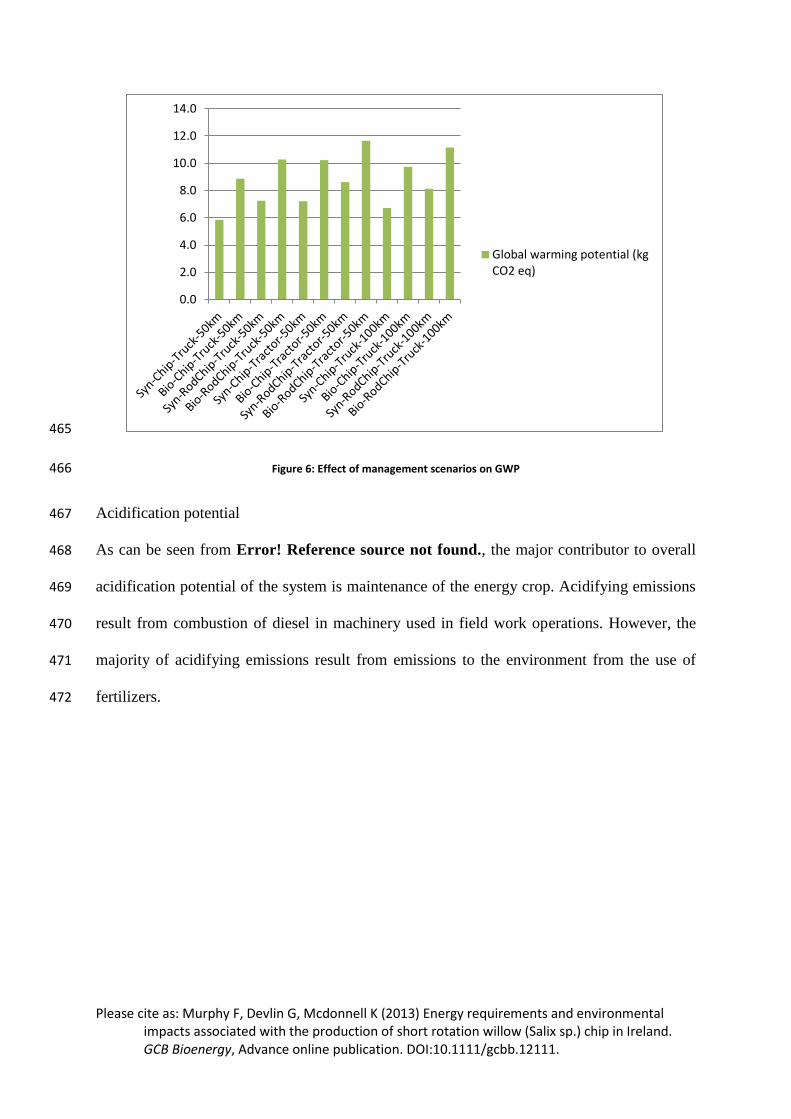
Global warming potential 457
One of the major environmental benefits associated with bioenergy use is the reported 458
greenhouse gas benefits. Greenhouse gas emissions from the reference scenario (willow 459
chips, synthetic fertilizer and 50 km transport distance), amount to 5.84 kg CO2-eq per GJ of 460
energy produced. The manufacture of synthetic fertilizers is an energy intensive process, 461
contributing to a large degree to the overall greenhouse gas emissions of the system. The 462
effects of the different management scenarios on overall GHG emissions of the system are 463
outlined in figure 6. 464
0.0
5.0
10.0
15.0
20.0
25.0
Energy Ratio
Please cite as: Murphy F, Devlin G, Mcdonnell K (2013) Energy requirements and environmental impacts associated with the production of short rotation willow (Salix sp.) chip in Ireland. GCB Bioenergy, Advance online publication. DOI:10.1111/gcbb.12111.
465
Figure 6: Effect of management scenarios on GWP 466
Acidification potential 467
As can be seen from Error! Reference source not found., the major contributor to overall 468
acidification potential of the system is maintenance of the energy crop. Acidifying emissions 469
result from combustion of diesel in machinery used in field work operations. However, the 470
majority of acidifying emissions result from emissions to the environment from the use of 471
fertilizers. 472
0.0
2.0
4.0
6.0
8.0
10.0
12.0
14.0
Global warming potential (kgCO2 eq)

Please cite as: Murphy F, Devlin G, Mcdonnell K (2013) Energy requirements and environmental impacts associated with the production of short rotation willow (Salix sp.) chip in Ireland. GCB Bioenergy, Advance online publication. DOI:10.1111/gcbb.12111.
473
Figure 7: Effect of management scenarios on AP and EP 474
Eutrophication potential 475
Error! Reference source not found. demonstrates that the maintenance of the willow crop 476
results in the highest contribution to overall eutrophication potential. Furthermore, as shown 477
in figure 7, the application of biosolid fertilizer also increases eutrophication potential due to 478
increased ammonia volatilisation, however not to the same extent as acidification potential. 479
Discussion 480
The results of this study highlight the environmental costs and benefits of short rotation 481
coppice willow production. Sensitivity analysis on three key processes in the production 482
chain which contribute most significantly to all impact categories considered; the type of 483
fertilizers used, harvesting technologies and transport distances highlights the effects of these 484
management techniques on overall system performance. 485

Please cite as: Murphy F, Devlin G, Mcdonnell K (2013) Energy requirements and environmental impacts associated with the production of short rotation willow (Salix sp.) chip in Ireland. GCB Bioenergy, Advance online publication. DOI:10.1111/gcbb.12111.
The positive energy ratios displayed in figure 5 (9.29 – 19.38) highlight the strong energy 486
performance of the system and are slightly higher than the 3 to 16 range for the cradle-to-487
plant assessments reported by Djomo et al. (2011). The energy ratios are lower than those 488
reported by Dubuisson & Sintzoff (1998), as they include drying of the willow biomass. In 489
addition, Heller et al. (2003) reported significantly higher energy ratios for willow production 490
of approximately 33.2 – 83 depending on yield and fertiliser application rate. The ratio 491
specified by Heller et al. (2003), assume drying of the biomass which increases the energy 492
content of the material, hence increasing the energy ratio, they also fail to consider transport 493
in these estimates. In this study, the harvested willow is assumed to have a lower energy 494
content as the material is exported from the farm to the power plant directly after harvest, 495
allowing no time for drying. Furthermore, the energy ratios of the willow scenarios in this 496
study are lower than other reported values by Matthews (2001) and González-García et al. 497
(2012b) as they do not consider transport in their analysis. 498
The range of global warming potential figures in this study (5.84 – 11.65 kg CO2-eq/GJ) are 499
comparable to those reported by Dubuisson & Sintzoff (1998), but are all higher than those 500
of 4.8 kg CO2-eq/GJ reported by Matthews (2001) as their analysis assumes lower 501
fertilisation rates and includes only transport of 3.2 km to the farm. 502
Alternative fertilisers 503
The production of synthetic fertilisers contributes significantly to each of the impact 504
categories studied due to the energy and resources used to produce them. GHG emissions 505
from synthetic nitrogen fertilizers also originate from N2O from the production process, and 506
the technology utilized is an important factor in GHG emissions (Börjesson & Tufvesson, 507
2011). The application of biosolids to the crop as an alternative fertiliser has the potential to 508
reduce these impacts through the utilisation of a waste product to meet the crops nutrient 509
requirements. Biosolid fertilisation removes the need for synthetic fertilizers which require 510

Please cite as: Murphy F, Devlin G, Mcdonnell K (2013) Energy requirements and environmental impacts associated with the production of short rotation willow (Salix sp.) chip in Ireland. GCB Bioenergy, Advance online publication. DOI:10.1111/gcbb.12111.
significant energy inputs in manufacture. Sensitivity analysis was carried out on substituting 511
biosolids for synthetic fertilisers. Figure 7 shows that using biosolids in place of synthetic 512
fertiliser increases both acidification and eutrophication potential by 259-404% and 136-513
182% respectively. This increase in acidifying emissions can be attributed to a 24% higher 514
ammonia volatilisation rate associated with the use of biosolids when compared to synthetic 515
fertilizer use. Furthermore, as presented in figure 7, the application of biosolid fertilizer also 516
increases eutrophication potential due to increased ammonia volatilisation, however not to the 517
same extent as acidification potential. These findings echo Gilbert et al. (2011) who also 518
found that higher emissions result from a higher proportion of the inorganic content 519
volatilising shortly after spreading onto the land. In addition, global warming potential 520
increases by 35-52% when utilising biological fertiliser. The increase in global warming 521
potential is due to the leakage of methane during anaerobic digestion which is part of the 522
pretreatment process in this study. However, utilising biological fertiliser positively affects 523
the cumulative energy demand, reducing it by 8-14%, and thereby increasing the energy ratio 524
of the biosolid scenarios. 525
The use of biological fertiliser in place of synthetic fertiliser improves the energy 526
performance of the system while negatively affecting each of the environmental impacts 527
Harvesting 528
The use of different harvesters has a significant effect on energy demand and emissions. An 529
analysis of the energy flow diagram (figure 4), which shows each of the different processing 530
steps in the scenarios, highlights that although energy consumption in the rod harvester is 531
lower than the direct chipper, this energy saving is significantly outweighed by the energy 532
required to subsequently chip the rods. Rod harvesting increases the energy demand by 29-533
47%. In addition, the overall energy ratio for rod harvesting is significantly lower than when 534
direct chipping is employed. The use of the rod harvester subsequently results in increases in 535
Please cite as: Murphy F, Devlin G, Mcdonnell K (2013) Energy requirements and environmental impacts associated with the production of short rotation willow (Salix sp.) chip in Ireland. GCB Bioenergy, Advance online publication. DOI:10.1111/gcbb.12111.
AP of 6-32%, EP 7-33%, and GWP 14-24%. An advantage of rod harvesting is that storage 536
and drying is easier as air flow between the rods is less restricted than through chips. The 537
drying of the rods will result in a higher calorific value than wet chip. However, as drying 538
does not occur in the particular supply chain in this study, the drying benefits of rod 539
harvesting benefits are not included in the results. 540
Transport 541
The lowest impacts from transportation occur when the biomass is transported 50 km by 542
truck. Truck transport over a distance of 100 km increases AP by 2-13%, EP by 3-12%, by 543
GWP 9-15%, and CED by 18-29%. Tractor-trailer transport over a distance of 50 km 544
increases AP by 4-24%, EP by 6-29%, GWP by 13-23%, and CED by 28-46%. As such, 545
tractor-trailer transportation over a distance of 50 km causes greater environmental impacts 546
than transporting the biomass by truck over a greater distance of 100 km. This shows that 547
there is a higher impact transporting biomass short distances using agricultural machinery and 548
tractors, compared to the lesser impact of long distance transport by dedicated haulage 549
equipment. This finding highlights the importance of keeping biomass supply and use on a 550
regional level, in order to keep transport distances low and thus maximise the environmental 551
benefits attributable to biomass. This echoes the finding by Thornley (2008) that lorry 552
transport makes a minor contribution to overall emissions while tractor transport emissions 553
are more significant. 554
Comparison with fossil fuels 555
Finally, willow chip production compares favourably with coal provision in terms of energy 556
ratio and global warming potential, while achieving a higher energy ratio then peat provision 557
but also a higher global warming potential. 558

Please cite as: Murphy F, Devlin G, Mcdonnell K (2013) Energy requirements and environmental impacts associated with the production of short rotation willow (Salix sp.) chip in Ireland. GCB Bioenergy, Advance online publication. DOI:10.1111/gcbb.12111.
The energy ratios of all willow chip scenarios are higher than both coal and peat which have 559
an energy ratio of 2 and 5 respectively (Dones et al., 2007), implying that more energy is 560
required to produce these fuels. 561
Greenhouse gas emissions associated with willow production in all scenarios are lower than 562
coal supply which emits approximately 12.28 kg CO2 eq per GJ of coal (Dones et al., 2007). 563
GWP of peat provision is lower than the production of willow, as the harvesting of peat is the 564
only process considered. Although combustion is outside the scope of this analysis, further 565
GHG reductions would occur when comparing biomass combustion to fossil fuel combustion. 566
The CO2 released during biomass combustion is approximately equal to the CO2 the biomass 567
had accumulated from the atmosphere during its growing cycle, this convention is widely 568
adopted in LCA studies of biomass-to-energy systems (Cherubini et al., 2011). In this study 569
only emissions from the production of the willow chip are included, end-use emissions from 570
combustion are not considered. 571
When compared to conventional fossil fuels, coal and peat, the willow biomass system 572
performs favourably in terms of acidification and eutrophication potentials. 573
574
575
Acknowledgement 576
This study was funded under the Charles Parsons Energy Research Program (Grant Number 577
Grant Number 6C/CP/E001) of Science Foundation Ireland (SFI). 578
Please cite as: Murphy F, Devlin G, Mcdonnell K (2013) Energy requirements and environmental impacts associated with the production of short rotation willow (Salix sp.) chip in Ireland. GCB Bioenergy, Advance online publication. DOI:10.1111/gcbb.12111.
References 579
Abrahamson LP, Robison DJ, Volk TA, White EH, Neuhauser EF, Benjamin WH, Peterson JM (1998) 580 Sustainability and environmental issues associated with willow bioenergy development in 581 New York (U.S.A.). Biomass and Bioenergy, 15, 17-22. 582
Akwo NS (2008) A Life Cycle Assessment of Sewage Sludge Treatment Options. Unpublished MSc. 583 Environmental Management Aalborg University, Aalborg. 584
Aronsson PG, Bergström LF, Elowson SNE (2000) Long-term influence of intensively cultured short-585 rotation Willow Coppice on nitrogen concentrations in groundwater. Journal of 586 Environmental Management, 58, 135-145. 587
Association D'initiatives Locales Pour L'energie at L'environnement (2007) Life environent Wilwater - 588 Study of the economics and development potential of SRWC. pp Page. 589
Augustenborg CA, Finnan J, Mcbennett L, Connolly V, Priegnitz U, Müller C (2012) Farmers' 590 perspectives for the development of a bioenergy industry in Ireland. GCB Bioenergy, 4, 597-591 610. 592
Baum C, Leinweber P, Weih M, Lamersdorf N, Dimitriou I (2009) Effects of short rotation coppice 593 with willows and poplar on soil ecology. pp Page. 594
Börjesson P (1999a) Environmental effects of energy crop cultivation in Sweden—I: Identification 595 and quantification. Biomass and Bioenergy, 16, 137-154. 596
Börjesson P (1999b) Environmental effects of energy crop cultivation in Sweden—II: Economic 597 valuation. Biomass and Bioenergy, 16, 155-170. 598
Börjesson P, Tufvesson LM (2011) Agricultural crop-based biofuels – resource efficiency and 599 environmental performance including direct land use changes. Journal of Cleaner 600 Production, 19, 108-120. 601
Börjesson PII (1996) Energy analysis of biomass production and transportation. Biomass and 602 Bioenergy, 11, 305-318. 603
Brown S, Beecher N, Carpenter A (2010) Calculator Tool for Determining Greenhouse Gas Emissions 604 for Biosolids Processing and End Use. Environmental Science & Technology, 44, 9509-9515. 605
Butnar I, Rodrigo J, Gasol CM, Castells F (2010) Life-cycle assessment of electricity from biomass: 606 Case studies of two biocrops in Spain. Biomass and Bioenergy, 34, 1780-1788. 607
Caslin B (2010) Willow Production. pp Page, Oakpark, Teagasc. 608 Cherubini F, Bird ND, Cowie A, Jungmeier G, Schlamadinger B, Woess-Gallasch S (2009) Energy and 609
greenhouse gas-based LCA of biofuel and bioenergy systems: Key issues, ranges and 610 recommendations. Resources, Conservation and Recycling, 53, 434-447. 611
Cherubini F, Peters GP, Berntsen T, Strømman AH, Hertwich E (2011) CO2 emissions from biomass 612 combustion for bioenergy: atmospheric decay and contribution to global warming. GCB 613 Bioenergy, 3, 413-426. 614
Curley E (2010) Investigate the influence of land spreading organic agricultural nutrients on 615 groundwater quality when applied to establishing energy crops - PhD Thesis. University 616 College Dublin, Dublin. 617
Department of Communications Energy and Natural Resources (2010) National Renewable Energy 618 Action Plan - Ireland. In: Submitted under Article 4 of Directive 2009/28/EC. pp Page. 619
Department of Communications Marine and Natural Resources (2007) Energy White Paper - 620 Delivering A Sustainable Energy Future For Ireland. (ed Department of Communications 621 MaNR) pp Page. 622
Dillon P (2011) Agricultral Bioenergy Policy. In: National Bioenergy Conference. pp Page. 623 Dimitriou I, Aronsson P (2011) Wastewater and sewage sludge application to willows and poplars 624
grown in lysimeters–Plant response and treatment efficiency. Biomass and Bioenergy, 35, 625 161-170. 626

Please cite as: Murphy F, Devlin G, Mcdonnell K (2013) Energy requirements and environmental impacts associated with the production of short rotation willow (Salix sp.) chip in Ireland. GCB Bioenergy, Advance online publication. DOI:10.1111/gcbb.12111.
Dimitriou I, Baum C, Baum S et al. (2011) Quantifying environmental effects of Short Rotation 627 Coppice (SRC) on biodiversity, soil and water. pp Page, IEA Bioenergy: Task 43. 628
Dimitriou I, Rosenqvist H (2011) Sewage sludge and wastewater fertilisation of Short Rotation 629 Coppice (SRC) for increased bioenergy production—Biological and economic potential. 630 Biomass and Bioenergy, 35, 835-842. 631
Djomo SN, Kasmioui OE, Ceulemans R (2011) Energy and greenhouse gas balance of bioenergy 632 production from poplar and willow: a review. GCB Bioenergy, 3, 181-197. 633
Don A, Osborne B, Hastings A et al. (2012) Land-use change to bioenergy production in Europe: 634 implications for the greenhouse gas balance and soil carbon. GCB Bioenergy, 4, 372-391. 635
Dones R, Bauer C, Röder A (2007) Kohle. Final report ecoinvent No. 6. pp Page, Dübendorf, CH, Paul 636 Scherrer Institut Villigen, Swiss Centre for Life Cycle Inventories 637
Dubuisson X, Sintzoff I (1998) Energy and CO2 balances in different power generation routes using 638 wood fuel from short rotation coppice. Biomass and Bioenergy, 15, 379-390. 639
Ericsson T (1994) Nutrient cycling in energy forest plantations. Biomass and Bioenergy, 6, 115-121. 640 European Commission (2007) Renewable Energy Road Map - Renewable energies in the 21st 641
century: building a more sustainable future. pp Page, Brussels, European Commission. 642 European Commission (2009) Directive 2009/28/EC of The European Parliament and of the Council 643
of 23 April 2009 on the promotion of the use of energy from renewable sources and 644 amending and subsequently repealing Directives 2001/77/EC and 2003/30/EC. pp Page. 645
Frischknecht R, Jungbluth N, Althaus H-J et al. (2007) Implementation of Life Cycle Impact 646 Assessment Methods. Final report ecoinvent v2.0 No.3. pp Page, Dübendorf, Swiss Centre 647 for Life Cycle Inventories. 648
Galbally P, Fagan C, Ryan D, Finnan J, Grant J, Mcdonnell K (2012) Biosolids and Distillery Effluent 649 Amendment to Irish Miscanthus ×giganteus Plantations: Impacts on Groundwater and Soil. J. 650 Environ. Qual., 41, 114-123. 651
Garstang J, Weekes A, Poulter R, Bartlett D (2002) Identification and characterisation of factors 652 affecting losses in the large-scale, non-ventilated bulk storage of wood chips and 653 development of best storage practices. pp Page, First Renewables Ltd. 654
Gasol CM, Brun F, Mosso A, Rieradevall J, Gabarrell X (2010) Economic assessment and comparison 655 of acacia energy crop with annual traditional crops in Southern Europe. Energy Policy, 38, 656 592-597. 657
Gilbert P, Thornley P, Riche AB (2011) The influence of organic and inorganic fertiliser application 658 rates on UK biomass crop sustainability. Biomass and Bioenergy, 35, 1170-1181. 659
Goglio P, Bonari E, Mazzoncini M (2012) LCA of cropping systems with different external input levels 660 for energetic purposes. Biomass and Bioenergy, 42, 33-42. 661
Goglio P, Owende PMO (2009) A screening LCA of short rotation coppice willow (Salix sp.) feedstock 662 production system for small-scale electricity generation. Biosystems Engineering, 103, 389-663 394. 664
González-García S, Iribarren D, Susmozas A, Dufour J, Murphy RJ (2012a) Life cycle assessment of 665 two alternative bioenergy systems involving Salix spp. biomass: Bioethanol production and 666 power generation. Applied Energy, 95, 111-122. 667
González-García S, Mola-Yudego B, Dimitriou I, Aronsson P, Murphy R (2012b) Environmental 668 assessment of energy production based on long term commercial willow plantations in 669 Sweden. Science of The Total Environment, 421–422, 210-219. 670
Grogan P, Matthews R (2002) A modelling analysis of the potential for soil carbon sequestration 671 under short rotation coppice willow bioenergy plantations. Soil Use and Management, 18, 672 175-183. 673
Guinée JB, Gorrée M, Heijungs R et al. (2002) Handbook on life cycle assessment. Operational guide 674 to the ISO standards. I: LCA in perspective. IIa: Guide. IIb: Operational annex. III: Scientific 675 background., Dordrecht, Kluwer Academic Publishers. 676
Please cite as: Murphy F, Devlin G, Mcdonnell K (2013) Energy requirements and environmental impacts associated with the production of short rotation willow (Salix sp.) chip in Ireland. GCB Bioenergy, Advance online publication. DOI:10.1111/gcbb.12111.
Hansson P-A, Dahlin B, Blinge M (2003) Air emissions from the fuel supply system of a Swedish CHP 677 plant and the effects of stricter emission regulations. Biomass and Bioenergy, 24, 59-68. 678
Helby P, Börjesson P, Hansen AC, Roos A, Rosenqvist H, Takeuchi L (2004) Market development 679 problems for sustainable bio-energy systems in Sweden. The BIOMARK Project. IMESS/ESS 680 Report 38. pp Page, Lund, Sweden, Environmental and Energy Systems Studies. 681
Hellebrand HJ, Scholz V, Kern J (2008) Nitrogen conversion and nirous oxide hotspots in energy crop 682 cultivation. Research in Agricultural Engineering, 54, 58-67. 683
Heller MC, Keoleian GA, Mann MK, Volk TA (2004) Life cycle energy and environmental benefits of 684 generating electricity from willow biomass. Renewable Energy, 29, 1023-1042. 685
Heller MC, Keoleian GA, Volk TA (2003) Life cycle assessment of a willow bioenergy cropping system. 686 Biomass and Bioenergy, 25, 147-165. 687
Hospido A, Moreira T, Martín M, Rigola M, Feijoo G (2005) Environmental Evaluation of Different 688 Treatment Processes for Sludge from Urban Wastewater Treatments: Anaerobic Digestion 689 versus Thermal Processes (10 pp). The International Journal of Life Cycle Assessment, 10, 690 336-345. 691
Huijbregts MaJ, Rombouts LJA, Hellweg S et al. (2005) Is Cumulative Fossil Energy Demand a Useful 692 Indicator for the Environmental Performance of Products? Environmental Science & 693 Technology, 40, 641-648. 694
Ippc (2006) N2O Emissions from Managed Soils, and CO2 Emissions from Lime and Urea Application. 695 In: Guidelines for national greenhouse gas inventories. Volume 4: Agriculture, Forestry and 696 Other Land Use. pp Page., Intergovernmental Panel on Climate Change. 697
Irish Government (2009) European Communities (Good Agricultural Practice for Protection of 698 Waters) Regulations - S.I. No. 101 of 2009. pp Page, Ireland. 699
Iso 14040 (2006) Environmental management - life cycle assessment - principles and framework. pp 700 Page. 701
Iso 14044 (2006) Environmental management - life cycle assessment - requirements and guidelines. 702 pp Page. 703
Jørgensen RN, Jørgensen BJ, Nielsen NE, Maag M, Lind A-M (1997) N2O emission from energy crop 704 fields of Miscanthus “Giganteus” and winter rye. Atmospheric Environment, 31, 2899-2904. 705
Jørgensen U, Pugesgaard S, Schelde K, Lærke PE, Larsen SU (2013) Nitrate Leaching Was 90% Lower 706 from Willow than from a Traditional Grain Crop Even When Intensively Fertilized. In: 21st EU 707 Biomass and Bioenergy Conference. pp Page, Copenhagen. 708
Jørgensen U, Schelde K (2001) Energy crop water and nutirent use efficiency. In: IEA Bioenergy Task 709 17, Short Rotation Crops. (ed Agency IE) pp Page. 710
Jungbluth N, Frischknecht R, Faist Emmenegger M, Steiner R, Tuchschmid M (2007) Life Cycle 711 Assessment of BTL-fuel production: Inventory Analysis. RENEW – Renewable Fuels for 712 Advanced Powertrains. Sixth Framework Programme: Sustainable Energy Systems. pp Page, 713 Uster, Switzerland, ESU-services Ltd. 714
Klang-Westin E, Eriksson J (2003) Potential of Salix as phytoextractor for Cd on moderately 715 contaminated soils. Plant and Soil, 249, 127-137. 716
Klvac R (2011) Pure Energy Ratio of logging residua processing. In: Formec - 44th International 717 Symposium on Forestry Mechanisation. pp Page, Graz, Austria. 718
Lanigan GJ, Finnan J (2010) Energy Crops and Greenhouse Gases. In: Teagasc Energy Crops Technical 719 Training Day. pp Page, Teagasc Crops Research Centre, Oak Park, Carlow. 720
Lechasseur G, Savoie P (2005) Cutting, bundling and chipping short rotation willow. In: Canadian 721 society for engineering in agricultural, food, and biological systems and La société 722 canadienne de génie agroalimentaire et biologique 2005 Meeting. pp Page, Winnipeg, 723 Manitoba. 724
Lemus R, Lal R (2005) Bioenergy Crops and Carbon Sequestration. Critical Reviews in Plant Sciences, 725 1-21. 726

Please cite as: Murphy F, Devlin G, Mcdonnell K (2013) Energy requirements and environmental impacts associated with the production of short rotation willow (Salix sp.) chip in Ireland. GCB Bioenergy, Advance online publication. DOI:10.1111/gcbb.12111.
Lettens S, Muys B, Ceulemans R, Moons E, Garcia J, Coppin P (2003) Energy budget and greenhouse 727 gas balance evaluation of sustainable coppice systems for electricity production. Biomass 728 and Bioenergy, 24, 179-197. 729
Lindroth A, Båth A (1999) Assessment of regional willow coppice yield in Sweden on basis of water 730 availability. Forest Ecology and Management, 121, 57-65. 731
Mann, Spath (2001) A life cycle assessment of biomass cofiring in a coal-fired power plant. Clean 732 Technologies and Environmental Policy, 3, 81-91. 733
Matthews RW (2001) Modelling of energy and carbon budgets of wood fuel coppice systems. 734 Biomass and Bioenergy, 21, 1-19. 735
Mcgrath D, Postma L, Mccormack RJ, Dowdall C (2000) Analysis of Irish Sewage Sludges: Suitability of 736 Sludge for Use in Agriculture. Irish Journal of Agricultural and Food Research, 39, 73-78. 737
Met Éireann (2012) Rainfall in Ireland - 1961-90 Mean Annual Rainfall (mm). pp Page, Dublin, 738 Ireland. 739
Mola-Yudego B, Pelkonen P (2008) The effects of policy incentives in the adoption of willow short 740 rotation coppice for bioenergy in Sweden. Energy Policy, 36, 3062-3068. 741
Monti A, Fazio S, Venturi G (2009) Cradle-to-farm gate life cycle assessment in perennial energy 742 crops. European Journal of Agronomy, 31, 77-84. 743
Mortensen J, Hauge Nielsen K, Jørgensen U (1998) Nitrate leaching during establishment of willow 744 (Salix viminalis) on two soil types and at two fertilization levels. Biomass and Bioenergy, 15, 745 457-466. 746
Nemecek T, Dubois D, Huguenin-Elie O, Gaillard G (2011) Life cycle assessment of Swiss farming 747 systems: I. Integrated and organic farming. Agricultural Systems, 104, 217-232. 748
Nemecek T, Kägi T, Blaser C (2007) Life Cycle Inventories of Agricultural Production Systems. Final 749 report ecoinvent v2.0 No.15. pp Page, Dübendorf, CH, Swiss Centre for Life Cycle 750 Inventories. 751
Nielsen P, Nielsen A, Weidema B, Dalgaard R, Halberg N (2003) LCA food data base. (ed 752 Www.Lcafood.Dk) pp Page. 753
Perttu KL (1998) Environmental justification for short-rotation forestry in Sweden. Biomass and 754 Bioenergy, 15, 1-6. 755
Plunkett M (2010) Application of Sewage Sludge and Biosolids to Energy Crops. In: Teagasc Energy 756 Crops Technical Training Day. pp Page, Teagasc Crops Research Centre, Oak Park, Carlow. 757
Pré Consultants (2011) Simapro 7.3.2. pp Page. 758 Rafaschieri A, Rapaccini M, Manfrida G (1999) Life Cycle Assessment of electricity production from 759
poplar energy crops compared with conventional fossil fuels. Energy Conversion and 760 Management, 1477-1493. 761
Rosenqvist H, Dawson M (2005) Economics of using wastewater irrigation of willow in Northern 762 Ireland. Biomass and Bioenergy, 29, 83-92. 763
Rowe RL, Street NR, Taylor G (2009) Identifying potential environmental impacts of large-scale 764 deployment of dedicated bioenergy crops in the UK. Renewable and Sustainable Energy 765 Reviews, 13, 271-290. 766
Sage RB (1998) Short rotation coppice for energy: towards ecological guidelines. Biomass and 767 Bioenergy, 15, 39-47. 768
Schlamadinger B, Apps M, Bohlin F et al. (1997) Towards a standard methodology for greenhouse 769 gas balances of bioenergy systems in comparison with fossil energy systems. Biomass and 770 Bioenergy, 13, 359-375. 771
Schulz U, Brauner O, Gruß H (2009) Animal diversity on short-rotation coppices - A review. 772 Landbauforschung Volkenrode, 59, 171-182. 773
Sebastián F, Royo J, Gómez M (2011) Cofiring versus biomass-fired power plants: GHG (Greenhouse 774 Gases) emissions savings comparison by means of LCA (Life Cycle Assessment) methodology. 775 Energy, 36, 2029-2037. 776

Please cite as: Murphy F, Devlin G, Mcdonnell K (2013) Energy requirements and environmental impacts associated with the production of short rotation willow (Salix sp.) chip in Ireland. GCB Bioenergy, Advance online publication. DOI:10.1111/gcbb.12111.
Spielmann M, Bauer C, Dones R, Tuchschmid M (2007) Transport Services. Final report ecoinvent 777 data v2.0 No.14 pp Page, Dubendorf, Swiss Centre for Life Cycle Inventories. 778
Spinelli R, Magagnotti N, Paletto G, Preti C (2011) Determining the Impact of Some Wood 779 Characteristics on the Performance of a Mobile Chipper. Silva Fennica, 45. 780
St. Clair S, Hillier J, Smith P (2008) Estimating the pre-harvest greenhouse gas costs of energy crop 781 production. Biomass and Bioenergy, 32, 442-452. 782
Styles D, Jones MB (2008) Energy crops in Ireland: Quantifying the potential life-cycle greenhouse 783 gas reductions of energy-crop electricity. Biomass and Bioenergy, 31, 759-772. 784
Sugiura A, Tyrrel SF, Seymour I, Burgess PJ (2008) Water Renew systems: wastewater polishing using 785 renewable energy crops. Water Sci Technol, 57, 1421-1428. 786
Teagasc (2010) Short Rotation Coppice Willow Best Practice Guidelines. (ed Barry Caslin DJF, Dr. 787 Alistair Mccracken) pp Page, Teagasc, AFBI. 788
Thornley P (2008) Airborne emissions from biomass based power generation systems. Environmental 789 Research Letters, 3, 014004. 790
Volk TA, Verwijst T, Tharakan PJ, Abrahamson LP, White EH (2004) Growing Fuel: a Sustainability 791 Assessment of Willow Biomass Crops. Frontiers in Ecology and the Environment, 2, 411-418. 792
Werner A, Mccracken A (2008) The use of short rotation coppice poplar and willow for the 793 bioremediation of sewage effluent. 317-324. 794
Werner F, Althaus H-J, Künniger T, Richter K, Jungbluth N (2007) Life Cycle Inventories of Wood as 795 Fuel and Construction Material. Final report ecoinvent data v2.0 No. 9. pp Page, Dübendorf, 796 CH, Swiss Centre for Life Cycle Inventories. 797
798
799
Top Related
Copyright © 2022 FDOKUMEN

