


Bahasa
Halaman
Hukum


2015In cooperatIon wIth:
ASEAN BuSiNESSOutlOOk SurvEy
Our unique Global Mentor Program equips students
Global leaders in business, science, social
enterprise and the Arts invigorate and develop
Stamford students with the skills, mindset and
ambition they require. Sir James Alexander Mirrlees –
1996 Nobel Memorial Prize in Economic Sciences
– will speak with and inspire our students this Fall.
We are ready and waiting to meet your
future Nobel Prize winner.
Please introduce us.
Stamford American is proud
to announce our
Global Mentor Program.
Future Nobel Laureates RequiredAges 2-18
Register to Visit Stamford at www.sais.edu.sg
Stamford American International School CPE Registration Number: 200823594D Period of Registration: August 10, 2010 to August 9, 2014
education for students from 2 to 18 years.
enhanced by American standards and
a focus on languages – to equip your
child for global citizenship.

S07_4350 NH1671 11.07.14 150D66/A5 none 45˚none
CDL14_1505 W AMCHAM Ad 2015_210(w)x297(h)_R1Path.ai 1 11/7/14 9:20 PM

ASEAN Business Outlook Survey 2015 1
The 2015 ASEAN Business Outlook Survey shows that U.S. companies remain optimistic about business prospects in ASEAN, as demonstrated by their expectations for investment expansion, workforce growth, and profit increases in 2014 and 2015. On each of these factors, however, slightly lower percentages of respondents report expected increases as compared to last year’s report. With some variation, optimism generally holds true across all ten ASEAN countries. However, Indonesia, Vietnam, Myanmar, and Malaysia were singled out particularly as targets for investment expansion. A significant minority of executives also report plans for diversifying investments from China into the ASEAN region over the next two years.
As 2015 approaches, regional economic integration issues are in the forefront. While U.S. companies place importance on ASEAN integration and are developing strategies to adapt to it, most executives surveyed doubt that the goals of the ASEAN Economic Community (AEC) will be reached by the end-2015 deadline. In fact, most respondents do not believe that the AEC goals will be realized until 2020 or later.
However, U.S. companies are utilizing ASEAN’s existing free trade agreements with major trading partners including Australia and New Zealand, China, India, Japan, and South Korea. Nearly half of the surveyed manufacturers use the agreements to export from ASEAN to those countries, while fewer services companies report utilizing the provisions of these agreements.
Looking ahead, about one-third of respondents expect that the Regional Comprehensive Economic Partnership (RCEP) will impact their company’s future investments in the region, while 40% say the Trans-Pacific Partnership (TPP) will impact future investment plans.
Executives report a number of positive attributes of ASEAN’s investment environment, including high levels of personal security and generally positive sentiment toward the U.S. Conversely, some of the negative aspects they cite include unstable political conditions, corruption, weak infrastructure, inadequate laws and regulations, and difficulties in moving products through customs.
In some areas, U.S. business sentiment has trended downward over the past five years. For example, the report points to decreased availability of raw materials, trained personnel, and low cost labor as negatives. Executives also report increased office leasing costs, inadequate infrastructure, and insufficient business incentives as growing challenges.
Respondents cite customs departments most frequently as the government agency with which they have the greatest levels of dissatisfaction, though this varied from country to country.
The ASEAN Business Outlook Survey included the responses of 588 executives representing small, medium, and large U.S. companies in all ten ASEAN countries.
CONTENTS
EXECUTIVE SUMMARY
01 Executive Summary 36 Cambodia Summary Report 02 Preface 38 Indonesia Summary Report03 Economic Outlook 40 Laos Summary Report06 Business Expansion in ASEAN 42 Malaysia Summary Report11 Environment for U.S. Business 44 Myanmar Summary Report13 ASEAN Integration & Regional Agreements 46 Philippines Summary Report20 Impact of Future Free Trade Agreements 48 Singapore Summary Report25 Expatriate Recruitment & Retention Factors 50 Thailand Summary Report30 Current Local Business Environment 52 Vietnam Summary Report32 Change in Satisfaction of Local Business 54 Profile of Respondents Environment (2009 vs. 2014) 55 Survey Methodology34 Brunei Summary Report 56 Acknowledgments
ASEAN Business Outlook Survey 20152
The ASEAN Business Outlook Survey is the key barometer of U.S. business sentiment in Southeast Asia. For more than a decade, executives from both American and foreign enterprises have depended on the survey’s timely and reliable business insights, as have leaders from governments, academia, and non-government organizations across the region.
The purpose of the ASEAN Business Outlook Survey is to understand business leaders’ assessments of, and outlooks on, business opportunities in the region. It gauges their perceptions, both positive and negative, of the primary factors that affect business operations in ASEAN. The survey participants are senior executives, working for firms with an American majority interest, in all ten ASEAN countries.
The ASEAN Business Outlook Survey is broken out into several sections. The first section asks a series of questions about the region’s overall economic outlook, and the second section asks about companies’ expansion plans. The third section focuses on the image of U.S. businesses in the region, and the extent to which governments seek private sector input in developing laws and regulations. The fourth section examines U.S. companies’ responses to ASEAN regional economic integration, and the region’s expanding economic ties with other major trading partners, while the fifth section explores the impact of multilateral free trade agreements being negotiated. The sixth looks at factors affecting expatriate recruitment and retention. The seventh and eighth, which are in some ways the heart of the survey, assess executives’ levels of satisfaction with 16 discrete characteristics of the business environment across the region. The final section breaks out the survey results on an individual country basis. Appendices provide aggregated information on the respondents and explain the survey methodology.
The ASEAN Business Outlook Survey is conducted by the American Chamber of Commerce in Singapore (AmCham Singapore) and the U.S Chamber of Commerce, in cooperation with the American Cambodian Business Council, the American Chamber of Commerce in Indonesia, the American Malaysian Chamber of Commerce, the American Chamber of Commerce of the Philippines, the American Chamber of Commerce in Thailand, the American Chamber of Commerce in Vietnam (Ho Chi Minh City), AmCham chapters in Laos and Myanmar, and American business leaders in Brunei. We thank them all for their participation, and we particularly appreciate the efforts of the U.S. Embassy in Brunei in identifying appropriate executives there.
We believe that this year’s ASEAN Business Outlook Survey is our best yet and we encourage you to use it to deepen your understanding of one of the world’s most vibrant and rapidly growing regions.
Sincerely,
PREFACE
Judith FerginExecutive DirectorAmCham Singapore
Tami OverbySenior Vice President, AsiaU.S. Chamber of Commerce
ASEAN Business Outlook Survey 2015 3
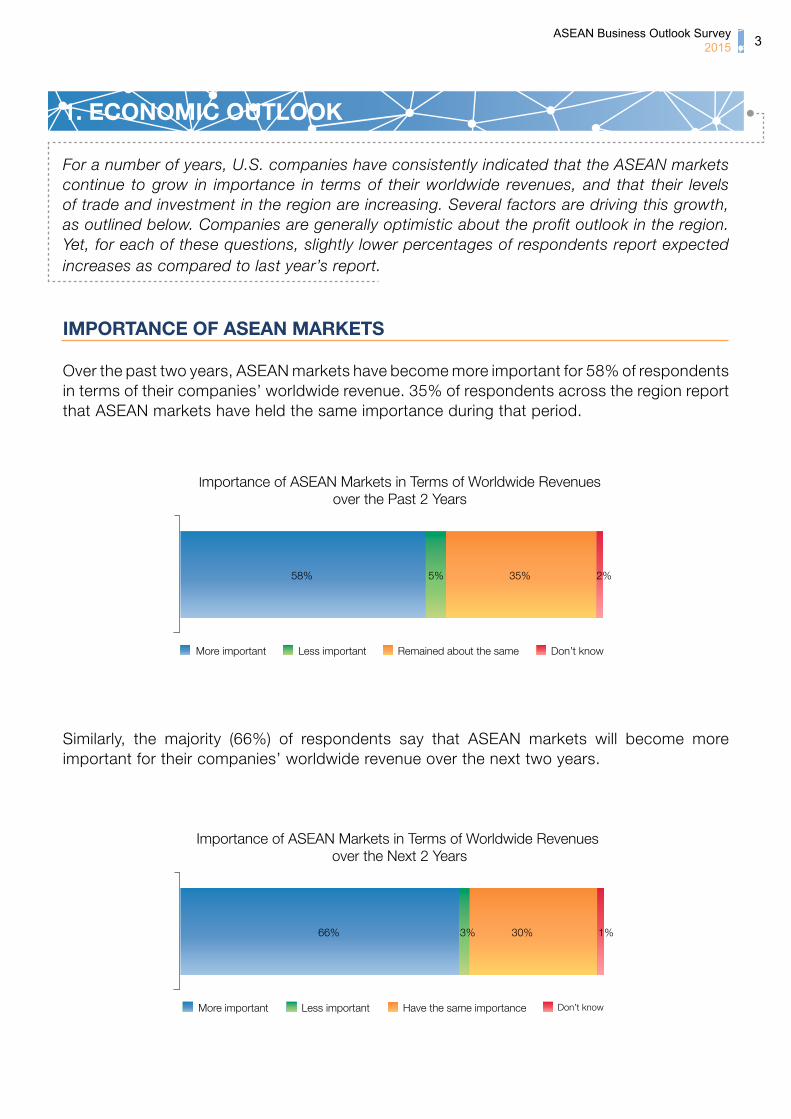
For a number of years, U.S. companies have consistently indicated that the ASEAN markets continue to grow in importance in terms of their worldwide revenues, and that their levels of trade and investment in the region are increasing. Several factors are driving this growth, as outlined below. Companies are generally optimistic about the profit outlook in the region. Yet, for each of these questions, slightly lower percentages of respondents report expected increases as compared to last year’s report.
IMPORTANCE OF ASEAN MARKETS
Over the past two years, ASEAN markets have become more important for 58% of respondents in terms of their companies’ worldwide revenue. 35% of respondents across the region report that ASEAN markets have held the same importance during that period.
Similarly, the majority (66%) of respondents say that ASEAN markets will become more important for their companies’ worldwide revenue over the next two years.
1. ECONOMIC OUTLOOK
More important Remained about the sameLess important Don’t know
58% 35%5% 2%
Importance of ASEAN Markets in Terms of Worldwide Revenues over the Past 2 Years
More important Have the same importanceLess important Don’t know
66% 30%3% 1%
Importance of ASEAN Markets in Terms of Worldwide Revenues over the Next 2 Years

ASEAN Business Outlook Survey 20154
According to surveyed business executives, the top three reasons ASEAN markets will be more important for their companies’ worldwide operations and revenues over the next two years are: economic recovery (61%), limited growth opportunities in other regions (54%) and improvement in infrastructure in ASEAN (48%).
Economic recovery 61%
Limited growth opportunities in other regions 54%
Improvement in infrastructure 48%
Change in business strategy 37%
Top Reasons ASEAN Markets Will be More Important for Worldwide Operations and Revenues over the Next 2 Years
TRADE AND INVESTMENT IN ASEAN
Most (74%) executives report increases in their levels of trade and investment in the ASEAN region over the past two years. In contrast, only 4% report decreases.
74%
Increased Remained about the sameDecreased
22%4%
Level of Trade/Investment in ASEAN over the Past 2 Years

ASEAN Business Outlook Survey 2015 5
According to surveyed executives, the top three reasons their companies’ levels of trade and investment will increase in ASEAN over the next 5 years are: diversification of customer base (58%), reasonable production costs (39%), and stable government and political systems (29%).
89%
Increased Remained about the sameDecreased
9%2%
Level of Trade/Investment in ASEAN over the Next 5 Years
Top Reasons Respondents’ Companies Plan to Increase Trade/Investment in ASEAN
Diversification of customer base 58%
Reasonable production costs 39%
Stable government and political systems 29%
Availability of trained personnel/efficient manpower
Adequate laws and regulations to encourage foreign investment
27%
24%
The overwhelming majority (89%) of respondents expect their companies’ levels of trade and investment in ASEAN to increase over the next 5 years.

ASEAN Business Outlook Survey 20156
PROFIT OUTLOOK
Executives are optimistic about their companies’ profit outlooks in ASEAN for the rest of 2014 compared with 2013. They are even more positive about 2015, with 84% of executives expecting an increase in profits. Respondents in Myanmar lead the way with nearly unanimous optimism for their profit outlook in 2014 and 2015.
2014 Increase 2015 Increase
ASEAN Profit Outlook in 2014 & 2015, Compared to 2013
Laos
46%
62%
Malaysia
53%
77%
Philippines
57%
74%
Singapore
66%
84%
Thailand
66%
82%
Vietnam
66%
82%
Brunei
63%
44%
Cambodia
59%
86%
Indonesia
62%
88%
Myanmar
86%91%
63%
81%
ASEAN
2. BUSINESS EXPANSION IN ASEAN
Consistent with U.S. companies’ generally optimistic view toward ASEAN, a majority of those surveyed plan to expand their operations in the region. They cite a variety of reasons for this, including the need to diversify their customer base, the availability of trained personnel, and reasonable production costs. Accordingly, the majority of respondents in most ASEAN countries expect that their companies will increase the size of their workforce this year, and that financing/borrowing costs are generally not a constraint. Furthermore, a significant minority of respondents in each country expect some diversification of operations from China to ASEAN. While U.S. companies indicate great interest in Myanmar, U.S. sanctions against the country continue to pose a challenge to business expansion there.
ASEAN Business Outlook Survey 2015 7
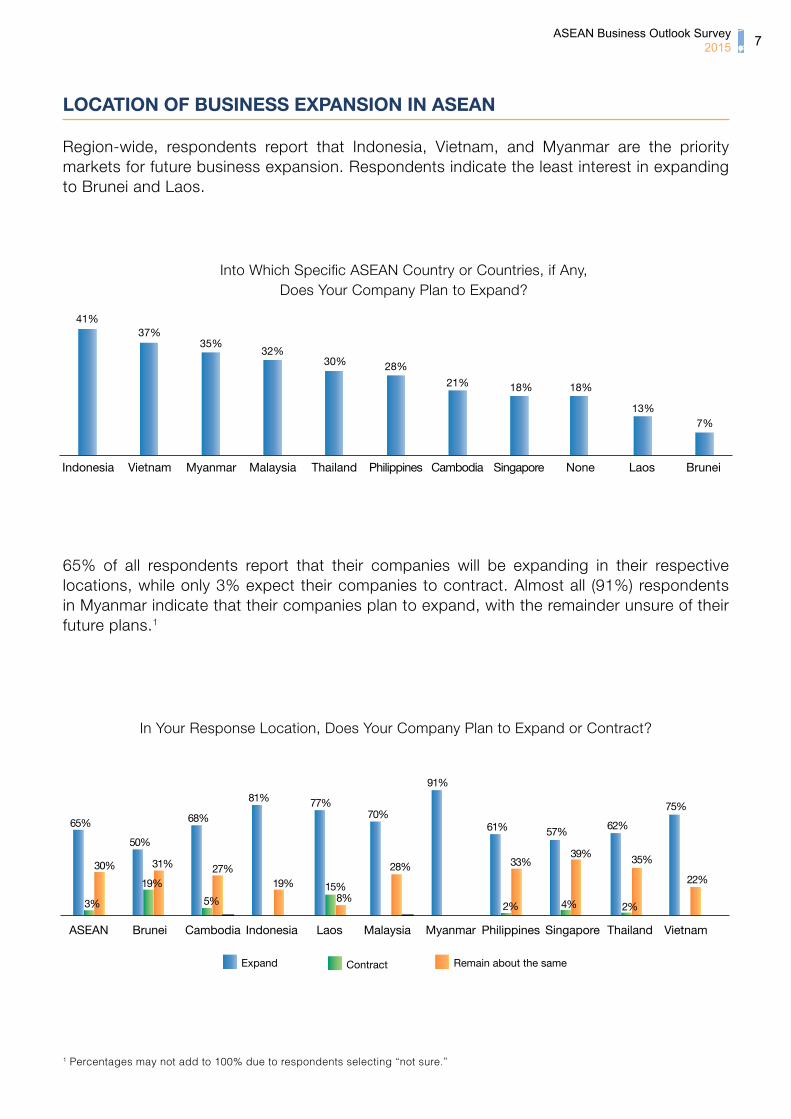
65% of all respondents report that their companies will be expanding in their respective locations, while only 3% expect their companies to contract. Almost all (91%) respondents in Myanmar indicate that their companies plan to expand, with the remainder unsure of their future plans.1
In Your Response Location, Does Your Company Plan to Expand or Contract?
Expand Contract Remain about the same
Brunei
50%
31%
19%
Myanmar
91%
Philippines
61%
33%
Laos
77%
15%8%
Malaysia
70%
28%
Indonesia
81%
Cambodia
68%
5%
27%
ASEAN
65%
30%
3%
Thailand
62%
35%
2%
Vietnam
22%
75%
Singapore
39%
4%
57%
19%
1 Percentages may not add to 100% due to respondents selecting “not sure.”
LOCATION OF BUSINESS EXPANSION IN ASEAN
Region-wide, respondents report that Indonesia, Vietnam, and Myanmar are the priority markets for future business expansion. Respondents indicate the least interest in expanding to Brunei and Laos.
Into Which Specific ASEAN Country or Countries, if Any, Does Your Company Plan to Expand?
Indonesia Vietnam Myanmar Malaysia Thailand Philippines Cambodia Singapore None Laos Brunei
41%37%
35%32%
30% 28%
21% 18% 18%
13%7%
2%

ASEAN Business Outlook Survey 20158
The top three reasons surveyed companies plan to expand in their current locations are: diversification of customer base (49%), availability of trained personnel/efficient manpower (39%), and reasonable production costs (34%).
Top Reasons Respondents’ Companies Plan to Expand in their Current Locations
Diversification of customer base 49%
Availability of trained personnel/efficient manpower 39%
Reasonable production costs 34%
Stable government and political system
Adequate laws and regulations to encourage foreign investment
33%
23%
WORKFORCE EXPANSION
Around half (53%) of the executives surveyed expect their companies’ total number of employees to increase in 2014, but this varies widely depending on the country. 77% of respondents in Myanmar and 73% of respondents in Cambodia expect the number to increase, while only 41% of respondents in Thailand and 31% of respondents in Brunei do.
Do You Expect Your Total Number of Employees in Your Response Location to Increase, Decrease, or Remain about the Same in 2014?
Increase Decrease Remain about the same
ASEAN
53%
41%
5%
Brunei
31%
50%
13%
Cambodia
73%
27%
Indonesia
57%
41%
2%
Malaysia
52%
38%
7%
Myanmar
77%
23%
Philippines
61%
31%
6%
Singapore
52%
45%
3%
Thailand
41%
50%
8%
Vietnam
57%
39%
3%
Laos
69%
16%
15%
ASEAN Business Outlook Survey 2015 9
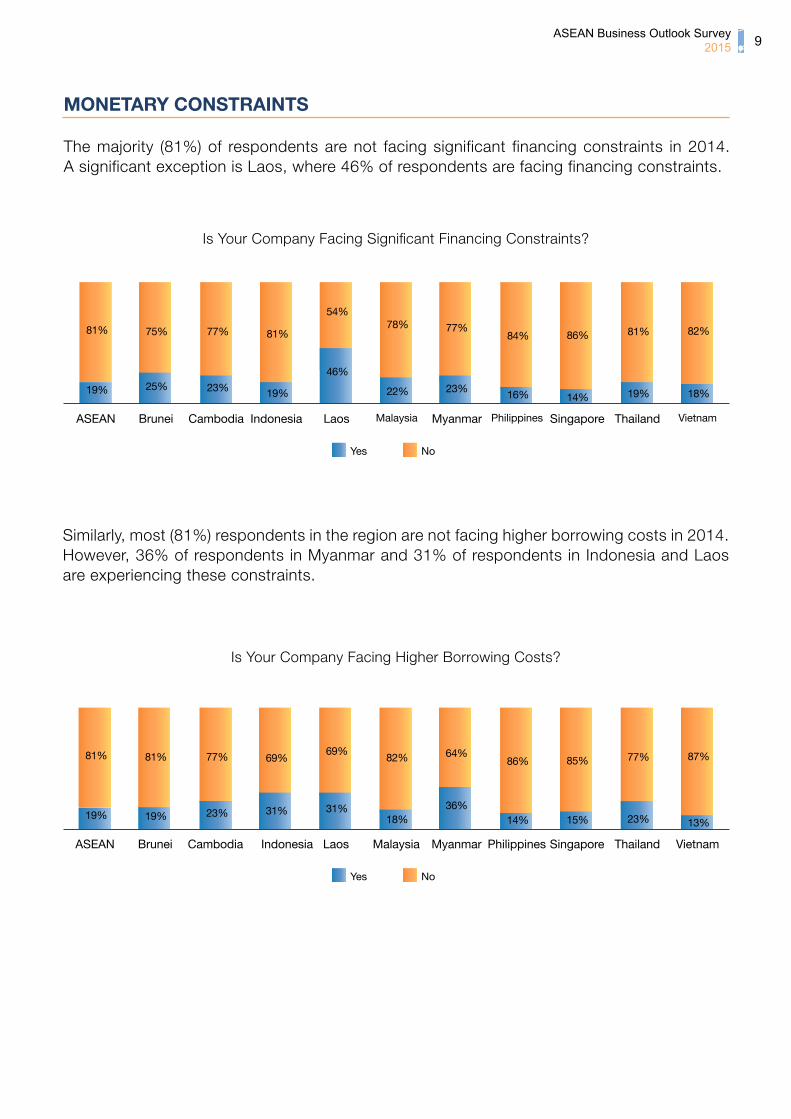
Similarly, most (81%) respondents in the region are not facing higher borrowing costs in 2014. However, 36% of respondents in Myanmar and 31% of respondents in Indonesia and Laos are experiencing these constraints.
MONETARY CONSTRAINTS
The majority (81%) of respondents are not facing significant financing constraints in 2014. A significant exception is Laos, where 46% of respondents are facing financing constraints.
Is Your Company Facing Significant Financing Constraints?
Yes No
ASEAN
19%
81%
Brunei
25%
75%
Cambodia
23%
77%
Indonesia
19%
81%
Laos
46%
54%
Malaysia
22%
78%
Myanmar
23%
77%
Philippines
16%
84%
Singapore
14%
86%
Thailand
19%
81%
Vietnam
18%
82%
Is Your Company Facing Higher Borrowing Costs?
Indonesia
Yes No
ASEAN
19%
81%
Brunei
19%
81%
Cambodia
23%
77%
31%
69%
Laos
31%
69%
Malaysia
18%
82%
Myanmar
36%
64%
Philippines
14%
86%
Singapore
15%
85%
Thailand
23%
77%
Vietnam
13%
87%

ASEAN Business Outlook Survey 201510
DIVERSIFYING OPERATIONS FROM CHINA INTO ASEAN
The percentage of business executives who plan to diversify some of their investments or businesses from China into ASEAN over the next two years has dipped slightly from last year. This is most pronounced in Laos where the number dropped significantly. On the other hand, Vietnam registered the highest percentage of respondents who plan to diversify their investments, with an increase of 5% from last year.
MYANMAR
In this year’s survey, almost half of respondents (44%) report that ongoing U.S. sanctions against Myanmar (SDN list, reporting requirements, prohibition on contracts with the armed forces, jadeite restrictions, etc.) do play a role in their investment decisions.
Percentage of Companies that Plan to Diversify Some Investments or Businesses over the Next 2 Years from China into ASEAN (2013 - 2014)
Yes 2013 Yes 2014
Laos
19%
0%
Malaysia
9%13%
Philippines
26%
16%
Singapore
19%18%
Thailand
21%17%
Vietnam
22%
27%
Brunei
13%9%
Cambodia
10% 9%
Indonesia
18%14%
Myanmar
14%18%19% 17%
ASEAN
How Significant a Role Do Ongoing U.S. Sanctions Against Myanmar Play in Your Investment Decisions?
Very significant Significant Somewhat significant Insignificant No role
32%24%
20%
16%
8%
Selected Insights from Survey Respondents
Opportunities and Investment“Myanmar is a huge investment opportunity for American firms. The sanctions put America at a disadvantage with limited benefit to US policy. Most nations do not have sanctions.”
Legal Engagement and Cost“Understanding the restrictions and what we can do requires legal engagement and added cost.”
Support for Sanctions“I believe the sanctions should remain in place until those on the list earn their right to be removed. There are good partners in Myanmar that are not on the list. US companies should work with them.”
ASEAN Business Outlook Survey 2015 11
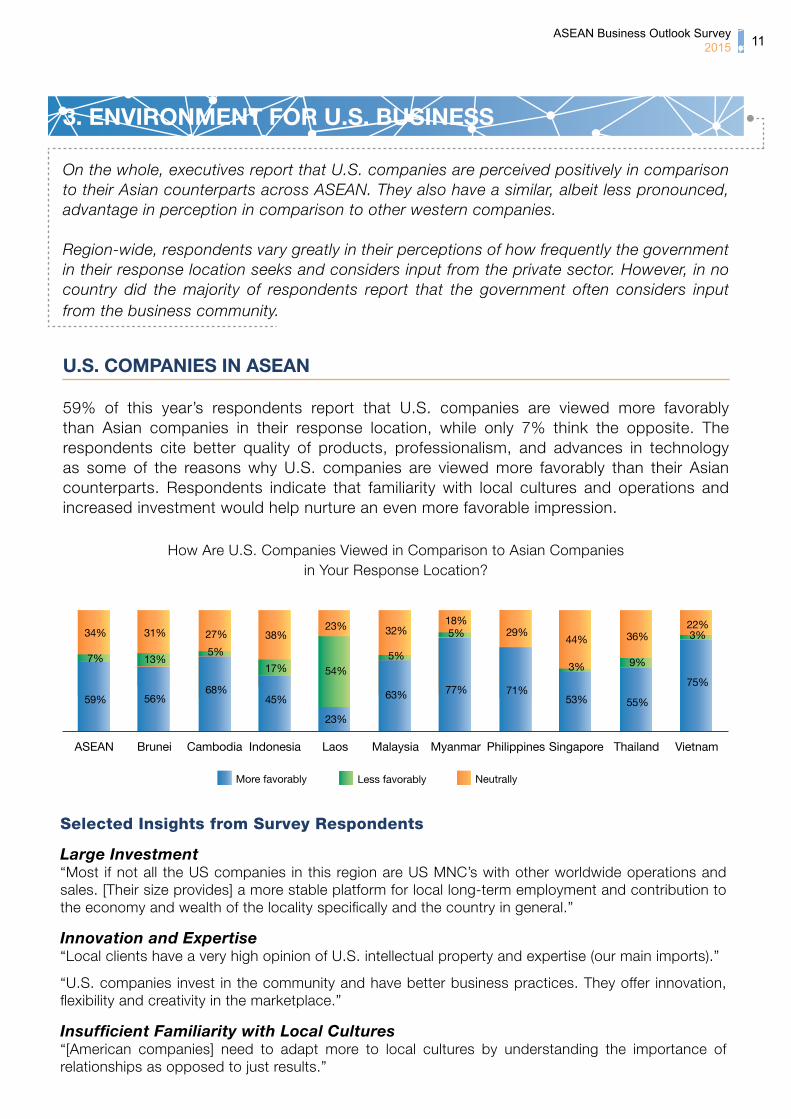
On the whole, executives report that U.S. companies are perceived positively in comparison to their Asian counterparts across ASEAN. They also have a similar, albeit less pronounced, advantage in perception in comparison to other western companies.
Region-wide, respondents vary greatly in their perceptions of how frequently the government in their response location seeks and considers input from the private sector. However, in no country did the majority of respondents report that the government often considers input from the business community.
U.S. COMPANIES IN ASEAN
59% of this year’s respondents report that U.S. companies are viewed more favorably than Asian companies in their response location, while only 7% think the opposite. The respondents cite better quality of products, professionalism, and advances in technology as some of the reasons why U.S. companies are viewed more favorably than their Asian counterparts. Respondents indicate that familiarity with local cultures and operations and increased investment would help nurture an even more favorable impression.
3. ENVIRONMENT FOR U.S. BUSINESS
How Are U.S. Companies Viewed in Comparison to Asian Companies in Your Response Location?
68%
27%
5%
Cambodia
More favorably Less favorably Neutrally
ASEAN
59%
34%
7%
Brunei
56%
31%
13%
Indonesia
45%
38%
17%
Laos
23%
23%
54%
Malaysia
63%
32%
5%
Philippines
71%
29%
Myanmar
77%
18%5%
Singapore
53%
44%
3%
Thailand
55%
36%
9%
Vietnam
75%
22%3%
Selected Insights from Survey Respondents
Large Investment“Most if not all the US companies in this region are US MNC’s with other worldwide operations and sales. [Their size provides] a more stable platform for local long-term employment and contribution to the economy and wealth of the locality specifically and the country in general.”
Innovation and Expertise“Local clients have a very high opinion of U.S. intellectual property and expertise (our main imports).”
“U.S. companies invest in the community and have better business practices. They offer innovation, flexibility and creativity in the marketplace.”
Insufficient Familiarity with Local Cultures“[American companies] need to adapt more to local cultures by understanding the importance of relationships as opposed to just results.”

ASEAN Business Outlook Survey 201512
Similarly, 41% of this year’s respondents say that U.S. companies are viewed more favorably than other Western companies in their response location, while only 5% think the opposite. The respondents attribute this to better employment benefits, respected brands, and transparency in policies. Executives report that more corporate social responsibility activities and local engagement would help U.S. companies to create an even more favorable impression.
How Are U.S. Companies Viewed in Comparison to Western Companies in Your Response Location?
54%
46%
5%
Cambodia
More favorably Less favorably Neutrally
ASEAN
41%
54%
5%
Brunei
44%
56%
Indonesia
45%
45%
10%
Laos
61%
39%
Malaysia
40%
55%
5%
Philippines
55%
43%
2%
Myanmar
64%
36%
Singapore
34%
61%
5%
Thailand
39%
54%
7%
Vietnam
45%
52%
3%
Selected Insights from Survey Respondents
Long History of Investment“This area has had a history of major investments from US companies versus that of other countries and the prosperity of the area has owed more to US companies than any other for the last 41 years or more.”
Transparency and Ethics“US Companies are more ethical when compared to other countries. For example, US companies have very high compliance of the Anti-Trust laws.”
“[U.S. companies] have a longstanding standard of value and have shown commitment to their clients for years with little corruption and proper follow-through.”
Less Refined Image“US companies (F&B aside), are sometimes viewed as less refined compared to other Western (European) companies.”

ASEAN Business Outlook Survey 2015 13
GOVERNMENT CONSULTATION WITH THE PRIVATE SECTOR
40% of respondents state that the government in their response location sometimes seeks and considers input from the private sector when developing new laws and regulations that impact the business environment. Lack of consultation with the private sector was apparent in countries such as Brunei, Indonesia, and Laos, where more than 60% of respondents report that the government rarely or never seeks input from the private sector when developing new laws and regulations. On the other hand, 45% of the companies in Singapore report that the government always or often considers input from the private sector.
As the ASEAN Business Outlook Survey has shown over the past several years, companies see the prospect of ASEAN’s economic integration as an opportunity, but are skeptical that the goals of regional integration will be realized in the near future. At the same time, the steps toward integration are prompting companies to develop regional strategies to adapt to the coming economic landscape. As these changes develop, however, a significant number of U.S. companies are already using existing free trade agreements to export from ASEAN to major trading partners.
4. ASEAN INTEGRATION AND REGIONAL AGREEMENTS
How Frequently Does the Government in Your Response Location Seek and Consider Input from the Private Sector on New Laws and Regulations?
27%
32%
41%
Cambodia
Always/Often Rarely/Never/Not sureSometimes
ASEAN
26%
40%
35%
Brunei
13%13%
74%
Indonesia
29%
7%
45%64%
Laos
31%
69%
Malaysia
27%
45%
28%
Philippines
22%
55%
23%
Myanmar
23%
55%
22%
Singapore
45%
37%
18%
Thailand
12%
36%
52%
Vietnam
25%
48%
27%
ASEAN Business Outlook Survey 201514
Is ASEAN Integration Important to Helping Your Company Do Business in the Region?
Malaysia
87%
13%
Singapore
81%
19%
Philippines
69%
31%
Thailand
78%
22%
Vietnam
84%
16%
Laos
8%
92%
Cambodia
77%
23%
ASEAN
81%
19%
Myanmar
86%
14%
Brunei
69%
31%
Indonesia
86%
14%
Yes No
Selected Insights from Survey Respondents
Hopes“Free flow of merchandise and services will strengthen all the economies within ASEAN.”
“[The a]bility to travel and easily conduct business across the region is critical to [the] execution of our strategy.”
Challenges“Government compliance with ASEAN requirements is intentionally slow or nonexistent.”
“[The b]enefits of integration are still a long way off in terms of people and infrastructure.”
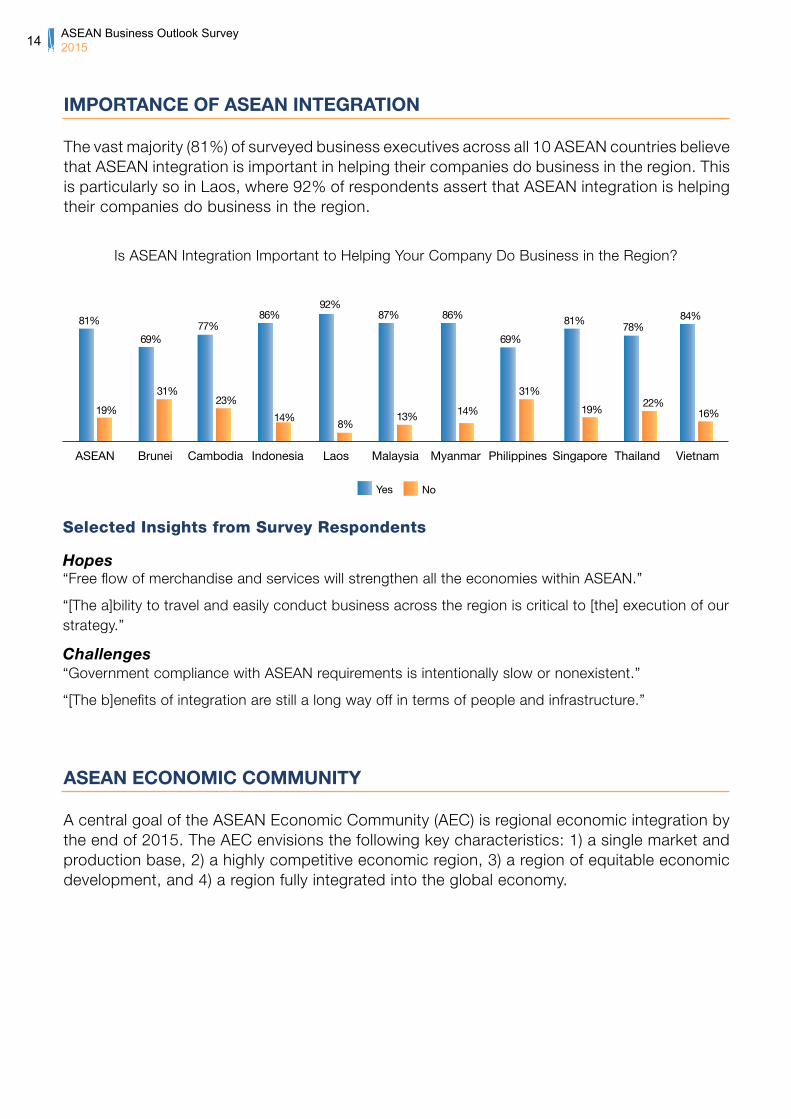
IMPORTANCE OF ASEAN INTEGRATION
The vast majority (81%) of surveyed business executives across all 10 ASEAN countries believe that ASEAN integration is important in helping their companies do business in the region. This is particularly so in Laos, where 92% of respondents assert that ASEAN integration is helping their companies do business in the region.
ASEAN ECONOMIC COMMUNITY
A central goal of the ASEAN Economic Community (AEC) is regional economic integration by the end of 2015. The AEC envisions the following key characteristics: 1) a single market and production base, 2) a highly competitive economic region, 3) a region of equitable economic development, and 4) a region fully integrated into the global economy.
ASEAN Business Outlook Survey 2015 15
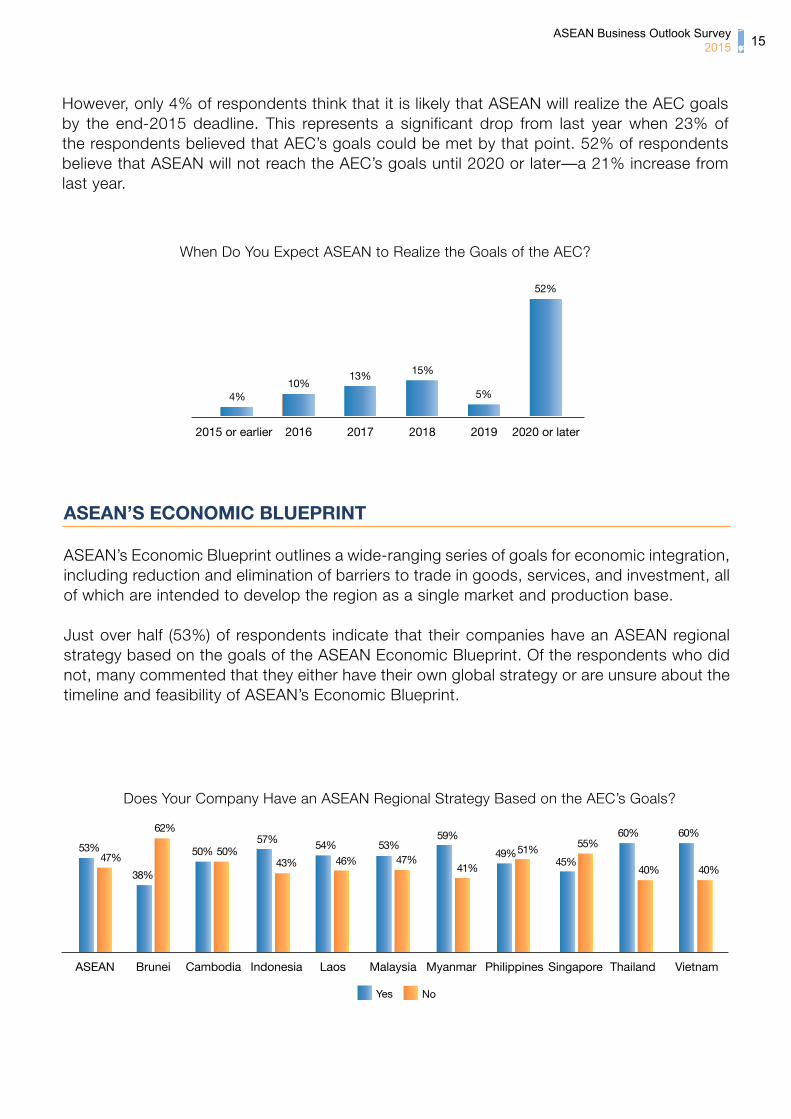
ASEAN’S ECONOMIC BLUEPRINT
ASEAN’s Economic Blueprint outlines a wide-ranging series of goals for economic integration, including reduction and elimination of barriers to trade in goods, services, and investment, all of which are intended to develop the region as a single market and production base.
Just over half (53%) of respondents indicate that their companies have an ASEAN regional strategy based on the goals of the ASEAN Economic Blueprint. Of the respondents who did not, many commented that they either have their own global strategy or are unsure about the timeline and feasibility of ASEAN’s Economic Blueprint.
When Do You Expect ASEAN to Realize the Goals of the AEC?
20162015 or earlier 2017 2018 2019 2020 or later
4%10%
13% 15%
5%
52%
Does Your Company Have an ASEAN Regional Strategy Based on the AEC’s Goals?
Malaysia
53%47%
Singapore
45%
55%
Philippines
49%51%
Thailand
60%
40%
Vietnam
60%
40%
Laos
46%
54%
Cambodia
50% 50%
ASEAN
53%47%
Myanmar
59%
41%
Brunei
38%
62%
Indonesia
57%
43%
Yes No
However, only 4% of respondents think that it is likely that ASEAN will realize the AEC goals by the end-2015 deadline. This represents a significant drop from last year when 23% of the respondents believed that AEC’s goals could be met by that point. 52% of respondents believe that ASEAN will not reach the AEC’s goals until 2020 or later—a 21% increase from last year.

ASEAN Business Outlook Survey 201516
REGIONAL FREE TRADE AGREEMENTS
Business executives in the ASEAN region consider each of the four regional agreements listed below to be important to their companies’ investment plans in the region. Among all respondents, the largest percentage consider the Trade Facilitation Work Program and Strategic Plan of Customs Development to be important (60%), while 40% consider the Trade in Goods Agreement to be important. Among respondents in the services sector, 49% say the Framework Agreement on Services is important, while 58% of manufacturing sector respondents consider the Trade in Goods Agreement important. The overall importance of ASEAN Regional Agreements has diminished from last year’s report, with the greatest drop seen in those rating the Framework Agreement on Services as important, down 23% from the 68% reported by respondents in last year’s report.
Framework Agreement on Services
Trade Facilitation Work Program and Strategic Plan of Customs Development
Comprehensive Investment Agreement
Trade in Goods Agreement
Importance of ASEAN Regional Agreements
Important NeutralUnimportant
45% 47%8%
60% 31%9%
54% 40%6%
40% 43%17%
About half of manufacturing sector respondents report utilizing ASEAN’s FTAs to export goods to partner countries, with China leading the way at 49%. Similar percentages of respondents (43%-47%) utilize each of the other four FTAs.
MANUFACTURING: Does Your Company Utilize ASEAN’s FTAs to Export Goods to the Countries Below?
Yes No
Australia & New Zealand
China India Japan Korea
45%
49%
45% 43%46%
55%51%
55% 57%54%

ASEAN Business Outlook Survey 2015 17
ASEAN FTAs – MANUFACTURING SECTOR UTILIZATION BY AGREEMENT
The following charts display the manufacturing sector responses by the following sub-sectors: consumer goods, food & food products, machinery & equipment, oil & petrochemical, pharmaceuticals & medical and other manufacturing.
For those respondents from either the manufacturing or services sectors that do not currently utilize the ASEAN FTAs, few indicate that they plan to do so in the future. However, a large percentage of the respondents remain unsure about how their companies will use the FTAs in the future. The reasons they cite for the relatively low utilization of the agreements are included in the sub-sections on each of the five agreements.
In contrast, relatively few of the services sector respondents indicate that they currently utilize ASEAN’s FTAs to export services from ASEAN to its FTA partner countries. The services agreements with India and Japan were not officially in place when this survey was conducted.
Yes No
SERVICES: Does Your Company Utilize ASEAN’s FTAs to Export Services to the Countries Below?
Australia & New Zealand
China Korea
16%25% 25%
84%
75% 75%
If Not, Does Your Company Plan to Utilize the Agreements in the Future?
Australia & New Zealand
China India Japan Korea
11%8% 7%7%
46%48% 50%
43% 44% 43% 41% 43%
52% 51%
6%
Not sureYes No

ASEAN Business Outlook Survey 201518
Australia & New Zealand45% of all manufacturing companies surveyed utilize the agreement with Australia and New Zealand. 59% of consumer goods manufacturers utilize it, while only 22% of pharmaceuticals and medical manufacturers do. Many of the companies that do not utilize the agreement are not currently doing business in Australia and New Zealand. Those that do have operations there have local representatives and thus do not use the agreement. Others point to the lack of economic exchange between ASEAN and Australia/New Zealand as a reason for not utilizing the agreement.
ChinaJust under half (49%) of surveyed manufacturing companies utilize the provisions of the agreement with China. This is especially true among electronics manufacturers, 68% of whom report utilizing it. The majority of those respondents not utilizing the agreement report that they already have local offices or that they do not conduct business in China, mainly due to its internal manufacturing capability and market complexity.
Australia and New Zealand:Percentage of Surveyed Manufacturing Companies in ASEAN that Utilize the
Provisions of the Agreement to Export from ASEAN to Australia and New Zealand
45%
59%
40% 37%33%
40%
22%
62%
China:Percentage of Surveyed Manufacturing Companies in ASEAN that Utilize the
Provisions of the Agreement to Export from ASEAN to China
49%
62%68%
33%
44%40%
22%
57%
AllManufacturing
Consumer goods
Electronics Food & FoodProducts
Oil &Petrochemical
Machinery &Equipment
Pharmaceuticals& Medical
Othermanufacturing
AllManufacturing
Consumer goods
Electronics Food & FoodProducts
Oil &Petrochemical
Machinery &Equipment
Pharmaceuticals& Medical
Othermanufacturing

ASEAN Business Outlook Survey 2015 19
JapanA smaller share (43%) of all surveyed manufacturing companies utilize the agreement to export to Japan. More (60%) electronics manufacturers use this agreement than those companies in other sub-sectors. Respondents that do not utilize the agreement note that Japan’s regulatory complexity and its distance from ASEAN serve as deterrents.
India45% of manufacturing companies use the agreement with India. 60% of machinery & equipment manufacturers report that they utilize the agreement to export from ASEAN to India, the highest of any sub-sector. The majority of the respondents that do not utilize the agreement say that they either have limited business there or do not have a customer base in India.
India:Percentage of Surveyed Manufacturing Companies in ASEAN that Utilize the
Provisions of the Agreement to Export from ASEAN to India
45%
52%56%
30%
39%
60%
28%
48%
Japan:Percentage of Surveyed Manufacturing Companies in ASEAN that Utilize the
Provisions of the Agreement to Export from ASEAN to Japan
43%34%
60%
33%
44%
35%
22%
57%
AllManufacturing
Consumer goods
Electronics Food & FoodProducts
Oil &Petrochemical
Machinery &Equipment
Pharmaceuticals& Medical
Othermanufacturing
AllManufacturing
Consumer goods
Electronics Food & FoodProducts
Oil &Petrochemical
Machinery &Equipment
Pharmaceuticals& Medical
Othermanufacturing

ASEAN Business Outlook Survey 201520
Korea46% of surveyed manufacturers utilize the provisions of the agreement with Korea. 64% of electronics manufacturers utilize this agreement to export from ASEAN to Korea, the highest of any sub-sector. A number of respondents report that their companies do not export to Korea due to its intense domestic competition and lack of integration with ASEAN supply chains.
REGIONAL COMPREHENSIVE ECONOMIC PARTNERSHIP (RCEP)
The Regional Comprehensive Economic Partnership (RCEP) was announced in August 2012. RCEP aims to consolidate the various “ASEAN +” FTAs listed above into one broader regional free trade network.
Korea:Percentage of Surveyed Manufacturing Companies in ASEAN that Utilize the
Provisions of the Agreement to Export from ASEAN to Korea
46%
52%
64%
41%
33%25%
39%
55%
AllManufacturing
Consumer goods
Electronics Food & FoodProducts
Oil &Petrochemical
Machinery &Equipment
Pharmaceuticals& Medical
Othermanufacturing
The Regional Comprehensive Economic Partnership (RCEP) and the Trans-Pacific Partnership (TPP) negotiations are advancing on separate paths that many respondents say will alter the future flows of trade and investment in the region. ASEAN members Brunei, Malaysia, Singapore, and Vietnam, along with Australia, Japan, and New Zealand, are negotiating parties to both treaties, while the other six ASEAN countries, China, India, and Korea are only involved in RCEP negotiations. In contrast, on the other side of the Pacific, Canada, Chile, Mexico, Peru, and the United States are only negotiating the TPP. Many executives believe that these treaties, along with bilateral FTAs in the region, will help their companies expand in the future.
5. IMPACT OF FUTURE FREE TRADE AGREEMENTS

ASEAN Business Outlook Survey 2015 21
Selected Insights from Survey Respondents
Opportunities and Increased Investment“[RCEP should] increase [the] attractiveness of [the] region for investment.”
Easier Access“It will help us determine where to get the most out of our investment with respect to which location can most easily / least costly supply others.”
Unclear Impact“The framework is not yet clear enough to judge its impact.”
The plurality (45%) of respondents are not sure about RCEP’s impact on their companies’ future investments in the region. A quarter (25%) believe that RCEP will not impact the location of future investments, while 30% believe that it will.
Yes No Not sure
Will RCEP Impact Where Your Company Plans Future Investments in the Region?
ASEAN
30%
25%
45%
Cambodia
23%
23%
54%
Indonesia
26%
31%
43%
Laos
8%
38%
54%
Malaysia
25%
17%
56%
Myanmar
23%
9%
68%
Philippines
33%
20%
47%
Singapore
34%
25%
41%
Thailand
27%
34%
39%
Vietnam
18%
40%
42%
Brunei
25%
25%
50%
Very few respondents in the region believe that RCEP will hinder their companies’ regional trade and investment as the overwhelming majority (98%) report that RCEP will either help or have a neutral effect on their companies’ trade and investment in the region.
Do You Think RCEP Will Help, Hinder, or Have a Neutral Effect on Your Company’s Regional Trade and Investment?
32%
68%
Cambodia
Help Hinder Neutral Effect
ASEAN
44%
54%
2%
Brunei
38%
62%
Indonesia
50%
50%
Laos
15%
69%
16%
Malaysia
50%
48%
2%
Myanmar
32%
64%
4%
Singapore
41%
59%
Thailand
41%
55%
4%
Vietnam
60%
36%
4%
Philippines
45%
53%
2%

ASEAN Business Outlook Survey 201522
A majority (51%) of respondents in the region think that the TPP will help their companies’ regional trade and investment, with Indonesia, Malaysia, Singapore, and Vietnam leading the way.
TRANS-PACIFIC PARTNERSHIP (TPP)
The Trans-Pacific Partnership (TPP) aims to lay the foundation for a modern, high-standard free trade area of the Asia-Pacific region. Four ASEAN countries (Brunei, Malaysia, Singapore, and Vietnam) are among the twelve partners negotiating the agreement.
The TPP is usually considered a “21st Century” agreement in which high standards are being sought in many new areas that have not been fully addressed in previous agreements, including intellectual property (IP) protection and enforcement, competition with state-owned enterprises, regulatory coherence, trade facilitation and supply chain, and enforceable investment rules. According to respondents, the two most important topics addressed by the TPP are regulatory coherence (65%) and IP protection and enforcement (61%).
What Aspects of the TPP are Important to Your Company?
Regulatory coherence 65%
Intellectual property protection and enforcement 61%
Trade facilitation and logistics/supply chain 53%
Enforceable investment rules and protection
Level playing field with state-owned enterprises
51%
49%
Do You Think the TPP Will Help, Hinder, or Have a Neutral Effect on Your Company’s Regional Trade and Investment?
Help Hinder Neutral Effect
ASEAN
51%
45%
4%
Brunei
38%
62%
Laos
77%
15%
Malaysia
57%
40%
3%
Myanmar
41%
59%
Thailand
42%
51%
7%
Vietnam
79%
20%1%
Philippines
51%
47%
2%68%
Cambodia
23%
Indonesia
55%
43%
2%
Singapore
54%
8%
45%
1%
9%
ASEAN Business Outlook Survey 2015 23
Selected Insights from Survey Respondents
Increase Trade and Investment“[The TPP will] likely result in increased trade and investment between US and AP partners; we service mainly American companies that are very interested in the provisions of the TPP and look to leverage it to increase investment and business in the region.”
Improve Transparency“[The] TPP will result in greater transparency in government processes and decisions.”
Ease Expansion Across the Supply Chain“Though [the] TPP will not impact us directly, it would positively impact our customers, which would create opportunities for us to assist them to compete more effectively in terms of cost containment and revenue enhancement.”
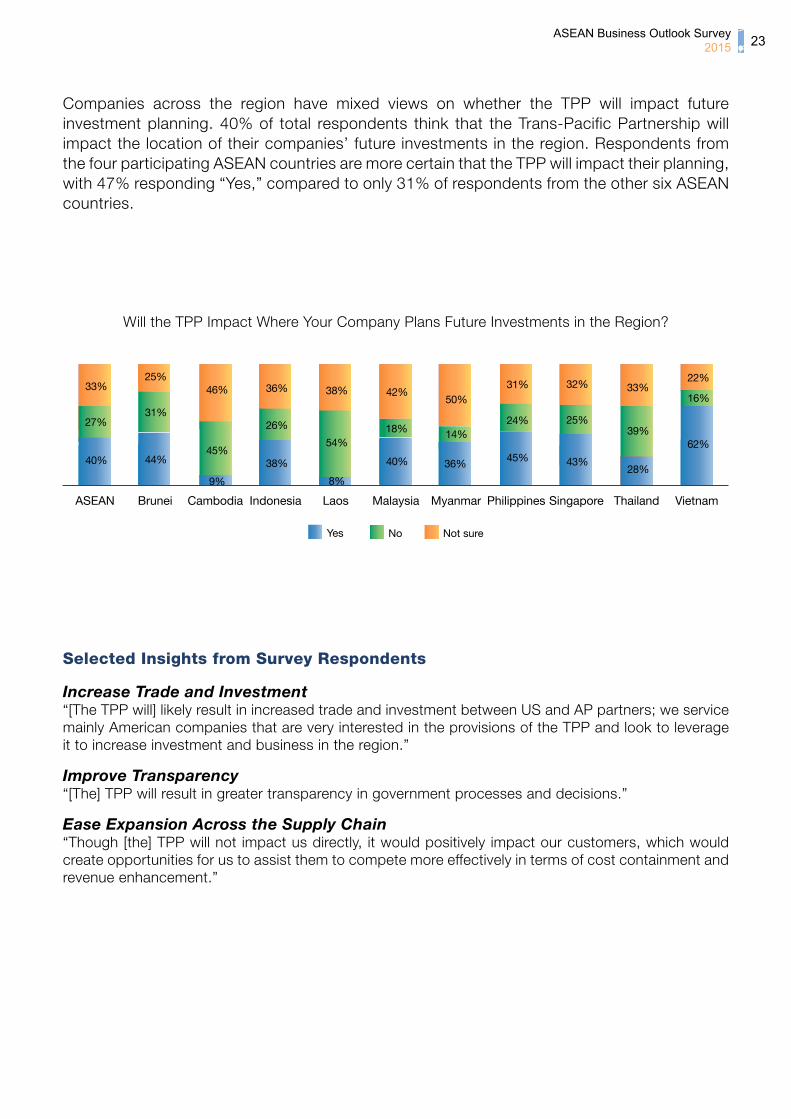
Companies across the region have mixed views on whether the TPP will impact future investment planning. 40% of total respondents think that the Trans-Pacific Partnership will impact the location of their companies’ future investments in the region. Respondents from the four participating ASEAN countries are more certain that the TPP will impact their planning, with 47% responding “Yes,” compared to only 31% of respondents from the other six ASEAN countries.
Yes No Not sure
Will the TPP Impact Where Your Company Plans Future Investments in the Region?
ASEAN
40%
27%
33%
Cambodia
9%
45%
46%
Indonesia
38%
26%
36%
Laos
8%
54%
38%
Malaysia
40%
18%
42%
Myanmar
36%
14%
50%
Philippines
45%
24%
31%
Singapore
43%
25%
32%
Thailand
28%
39%
33%
Vietnam
16%
62%
22%
Brunei
44%
25%
31%

ASEAN Business Outlook Survey 201524
Selected Insights from Survey Respondents
Advantages“In absence of a comprehensive regional trade agreement, [the noodle] bowl allows us to selectively leverage the more suitable FTAs.”
Regulatory Coherence“Regulatory coherence will be helpful to facilitate trade and supply chain within the region.”
Complications“Trade agreements between countries are helpful in defining the rules of the road, but “noodle bowl” does become confusing when dealing with MNCs that have assembly lines and different components within the value chain in multiple countries and thus affects an imports country of origin. So in this sense, it’s both helpful to have individual trade agreements as it helps rationalize rules for trade between two countries, but also unhelpful in the sense that when a product’s origin is somewhat undefined, it can create havoc when trying to apply for certain allowances or lower tariffs.”
In Your Opinion, What is the Practical Impact of the Proliferation of These Agreements on Your Company’s Operations in ASEAN?
Neutral34%
Unhelpful16%
Helpful39%
NotSure11%
THE NOODLE BOWL EFFECT
Preferential trade agreements in Asia have proliferated in recent years. According to the Asian Development Bank, over 100 free trade agreements are currently in effect in Asia, with almost 150 more under negotiation.
Given that these various agreements have different tariff reduction schedules, lists of exclusions, rules of origin, and timelines, some argue that these agreements are creating a confusing “noodle bowl” of trade rules across the region. However, respondents generally do not share this concern, as 73% indicate that these agreements have either a positive or neutral effect on their companies’ operations in ASEAN.
ASEAN Business Outlook Survey 2015 25
Selected Insights from Survey Respondents
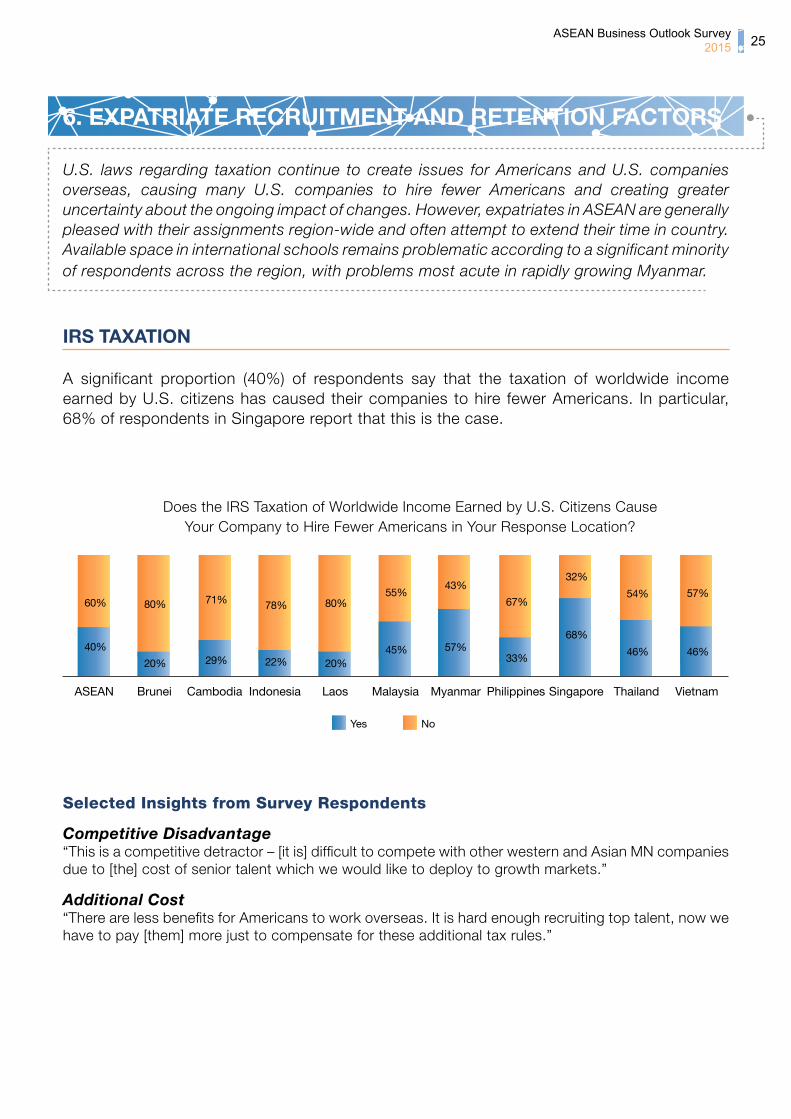
Competitive Disadvantage“This is a competitive detractor – [it is] difficult to compete with other western and Asian MN companies due to [the] cost of senior talent which we would like to deploy to growth markets.”
Additional Cost“There are less benefits for Americans to work overseas. It is hard enough recruiting top talent, now we have to pay [them] more just to compensate for these additional tax rules.”
IRS TAXATION
A significant proportion (40%) of respondents say that the taxation of worldwide income earned by U.S. citizens has caused their companies to hire fewer Americans. In particular, 68% of respondents in Singapore report that this is the case.
Does the IRS Taxation of Worldwide Income Earned by U.S. Citizens Cause Your Company to Hire Fewer Americans in Your Response Location?
Yes No
ASEAN
40%
60%
Brunei
20%
80%
Cambodia
29%
71%
Indonesia
22%
78%
Laos
20%
80%
Malaysia
45%
55%
Myanmar
57%
43%
Philippines
33%
67%
Singapore
68%
32%
Thailand
46%
54%
Vietnam
46%
57%
U.S. laws regarding taxation continue to create issues for Americans and U.S. companies overseas, causing many U.S. companies to hire fewer Americans and creating greater uncertainty about the ongoing impact of changes. However, expatriates in ASEAN are generally pleased with their assignments region-wide and often attempt to extend their time in country. Available space in international schools remains problematic according to a significant minority of respondents across the region, with problems most acute in rapidly growing Myanmar.
6. EXPATRIATE RECRUITMENT AND RETENTION FACTORS

ASEAN Business Outlook Survey 201526
Selected Insights from Survey Respondents
Hurting Expatriates“[FATCA] is hurting the ability of our American expats to open bank accounts, manage their investments and care for their families and their futures.”
Imposing Costs“[It is o]ver-reaching by [the] US Government to impose this cost on local financial institutions.”
EXPATRIATE SATISFACTION
Business executives surveyed overwhelmingly (93%) report that their expatriate employees are generally satisfied with their assignments. The Philippines has the highest percentage of reported expatriate satisfaction (98%), while Brunei has the highest percentage of reported expatriate dissatisfaction (31%), reflecting a drop from 100% satisfaction in last year’s survey.
Are Your Expatriate Employees Generally Satisfied with Their Assignments in Your Response Location?
Yes No
ASEAN
93%
7%
Brunei
69%
31%
Cambodia
91%
9%
Indonesia
91%
9%
Laos
92%
8%
Malaysia
95%
5%
Myanmar
91%
9%
Philippines
98%
2%
Singapore
95%
5%
Thailand
93%
7%
Vietnam
95%
5%
FOREIGN ACCOUNT TAX COMPLIANCE ACT (FATCA)
Only 17% of total respondents think that the Foreign Account Tax Compliance Act (FATCA) regulations have affected or will affect their ability as a company or individual to conduct business or work abroad. While some respondents claim that FATCA could create a burden and add business reporting costs, more than half of the respondents (60%) are unsure, indicating that the United States should consider increasing its outreach efforts in Southeast Asia regarding FATCA.
Will the Foreign Account Tax Compliance Act Regulations Affect Your Ability to Conduct Business?
Yes No Not sure
ASEAN
17%
23%
60%
Cambodia
23%
32%
45%
Indonesia
5%25%
69%
Laos
39%
38%
23%
Malaysia
13%17%
70%
Myanmar
32%
68%
Philippines
23%
18%
59%
Singapore
14%
20%
66%
Thailand
22%
29%
49%
Vietnam
19%
21%
60%
Brunei
50%
44%
6%
ASEAN Business Outlook Survey 2015 27
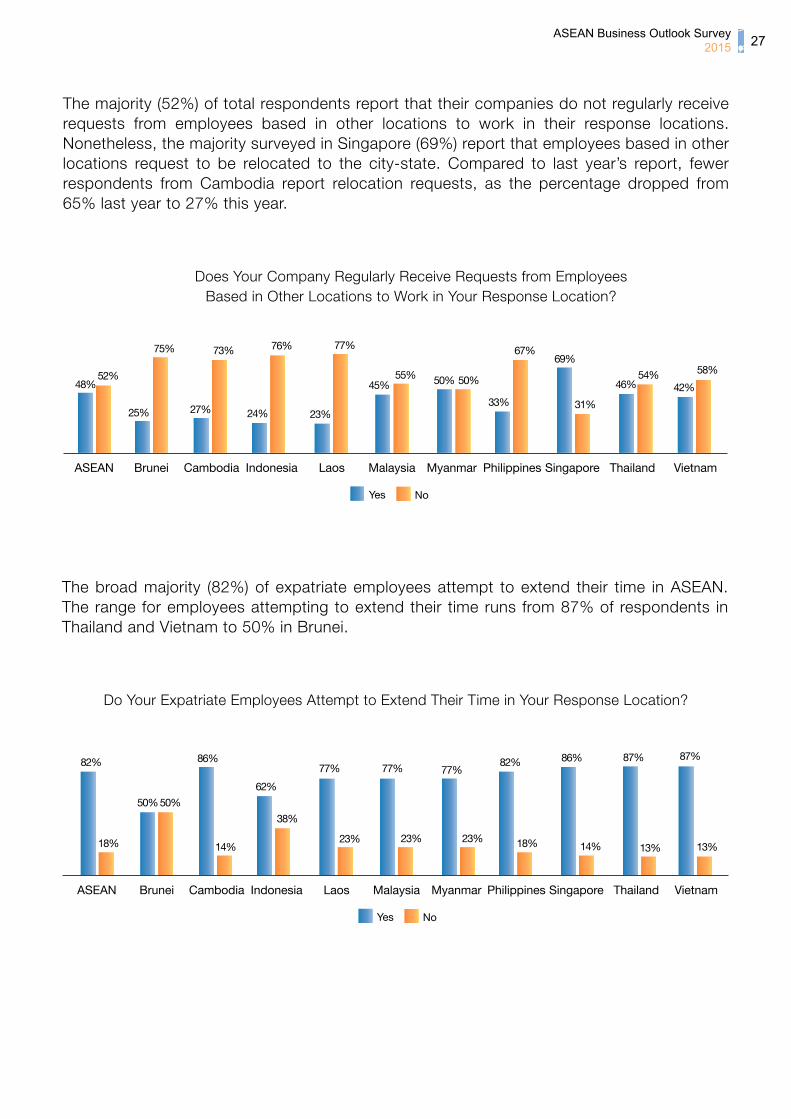
The broad majority (82%) of expatriate employees attempt to extend their time in ASEAN. The range for employees attempting to extend their time runs from 87% of respondents in Thailand and Vietnam to 50% in Brunei.
Do Your Expatriate Employees Attempt to Extend Their Time in Your Response Location?
Malaysia
77%
23%
Singapore
86%
14%
Philippines
82%
18%
Thailand
87%
13%
Vietnam
87%
13%
Laos
23%
77%
Cambodia
86%
14%
ASEAN
82%
18%
Myanmar
77%
23%
Brunei
50%50%
Indonesia
62%
38%
Yes No
The majority (52%) of total respondents report that their companies do not regularly receive requests from employees based in other locations to work in their response locations. Nonetheless, the majority surveyed in Singapore (69%) report that employees based in other locations request to be relocated to the city-state. Compared to last year’s report, fewer respondents from Cambodia report relocation requests, as the percentage dropped from 65% last year to 27% this year.
Does Your Company Regularly Receive Requests from Employees Based in Other Locations to Work in Your Response Location?
Malaysia
45%55%
Singapore
69%
31%
Philippines
33%
67%
Thailand
46%54%
Vietnam
42%
58%
Laos
77%
23%
Cambodia
27%
73%
ASEAN
48%52%
Myanmar
50% 50%
Brunei
25%
75%
Indonesia
24%
76%
Yes No
ASEAN Business Outlook Survey 201528
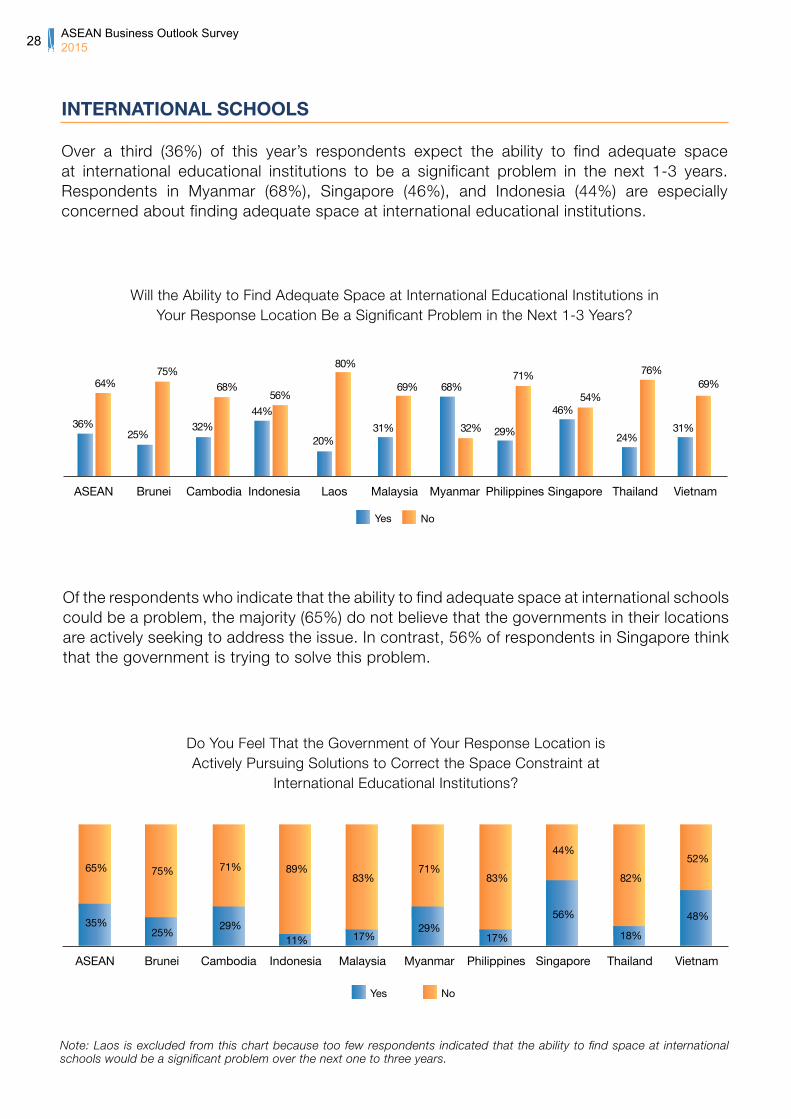
Of the respondents who indicate that the ability to find adequate space at international schools could be a problem, the majority (65%) do not believe that the governments in their locations are actively seeking to address the issue. In contrast, 56% of respondents in Singapore think that the government is trying to solve this problem.
Do You Feel That the Government of Your Response Location is Actively Pursuing Solutions to Correct the Space Constraint at
International Educational Institutions?
Yes No
ASEAN
35%
65%
Brunei
25%
75%
Cambodia
29%
71%
Indonesia
11%
89%
Malaysia
17%
83%
Myanmar
29%
71%
Philippines
17%
83%
Singapore
56%
44%
Thailand
18%
82%
Vietnam
48%
52%
INTERNATIONAL SCHOOLS
Over a third (36%) of this year’s respondents expect the ability to find adequate space at international educational institutions to be a significant problem in the next 1-3 years. Respondents in Myanmar (68%), Singapore (46%), and Indonesia (44%) are especially concerned about finding adequate space at international educational institutions.
Will the Ability to Find Adequate Space at International Educational Institutions in Your Response Location Be a Significant Problem in the Next 1-3 Years?
Malaysia
31%
69%
Singapore
46%54%
Philippines
29%
71%
Thailand
24%
76%
Vietnam
31%
69%
Laos
80%
20%
Cambodia
32%
68%
ASEAN
36%
64%
Myanmar
68%
32%
Brunei
25%
75%
Indonesia
44%
56%
Yes No
Note: Laos is excluded from this chart because too few respondents indicated that the ability to find space at international schools would be a significant problem over the next one to three years.

ASEAN Business Outlook Survey 2015 29
Energy, Mining & Infrastructure
Corporate & Commercial
Project FinanceDeal of the Year
Emerging MarketsLaw Firm of the Year
MyanmarLaw Firm of the Year
Cambodia, Lao PDR, Thailand, Myanmar, Vietnam, Indonesia, Singapore, and Bangladesh, as well as further afield across ASEAN and the Middle East.
Our team of nearly 300 staff, including 140 lawyers and advisers, in 12 offices work closely together to
BANGLADESH | CAMBODIA | INDONESIA* | LAO PDR | MYANMAR SINGAPORE | THAILAND | VIETNAM www.dfdl.com
Excellence . Crea y . TrustSince 1994
ASEAN Business Outlook Survey 201530
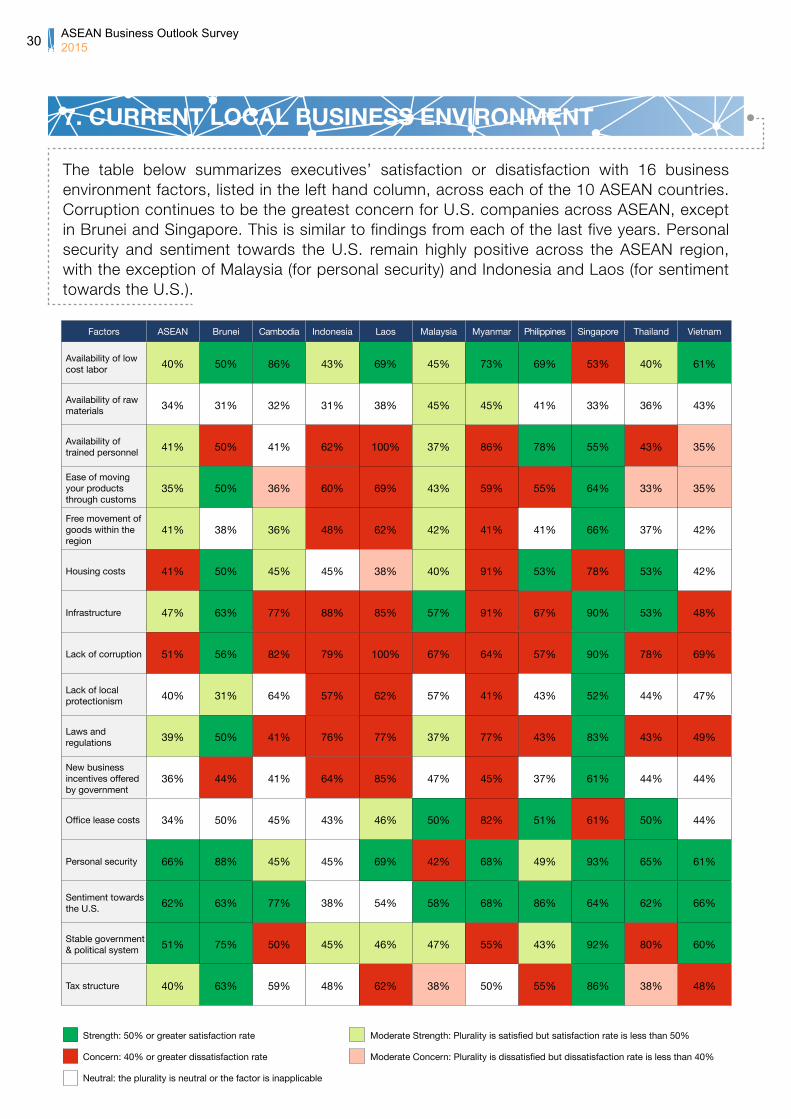
The table below summarizes executives’ satisfaction or disatisfaction with 16 business environment factors, listed in the left hand column, across each of the 10 ASEAN countries. Corruption continues to be the greatest concern for U.S. companies across ASEAN, except in Brunei and Singapore. This is similar to findings from each of the last five years. Personal security and sentiment towards the U.S. remain highly positive across the ASEAN region, with the exception of Malaysia (for personal security) and Indonesia and Laos (for sentiment towards the U.S.).
7. CURRENT LOCAL BUSINESS ENVIRONMENT
Factors ASEAN Brunei Cambodia Indonesia Laos Malaysia Myanmar Philippines Singapore Thailand Vietnam
Availability of low cost labor 40% 50% 86% 43% 69% 45% 73% 69% 53% 40% 61%
Availability of raw materials 34% 31% 32% 31% 38% 45% 45% 41% 33% 36% 43%
Availability of trained personnel 41% 50% 41% 62% 100% 37% 86% 78% 55% 43% 35%
Ease of moving your products through customs
35% 50% 36% 60% 69% 43% 59% 55% 64% 33% 35%
Free movement of goods within the region
41% 38% 36% 48% 62% 42% 41% 41% 66% 37% 42%
Housing costs 41% 50% 45% 45% 38% 40% 91% 53% 78% 53% 42%
Infrastructure 47% 63% 77% 88% 85% 57% 91% 67% 90% 53% 48%
Lack of corruption 51% 56% 82% 79% 100% 67% 64% 57% 90% 78% 69%
Lack of local protectionism 40% 31% 64% 57% 62% 57% 41% 43% 52% 44% 47%
Laws and regulations 39% 50% 41% 76% 77% 37% 77% 43% 83% 43% 49%
New business incentives offered by government
36% 44% 41% 64% 85% 47% 45% 37% 61% 44% 44%
Office lease costs 34% 50% 45% 43% 46% 50% 82% 51% 61% 50% 44%
Personal security 66% 88% 45% 45% 69% 42% 68% 49% 93% 65% 61%
Sentiment towards the U.S. 62% 63% 77% 38% 54% 58% 68% 86% 64% 62% 66%
Stable government & political system 51% 75% 50% 45% 46% 47% 55% 43% 92% 80% 60%
Tax structure 40% 63% 59% 48% 62% 38% 50% 55% 86% 38% 48%
Strength: 50% or greater satisfaction rate Moderate Strength: Plurality is satisfied but satisfaction rate is less than 50%
Concern: 40% or greater dissatisfaction rate Moderate Concern: Plurality is dissatisfied but dissatisfaction rate is less than 40%
Neutral: the plurality is neutral or the factor is inapplicable
ASEAN Business Outlook Survey 2015 31

ASEAN Business Outlook Survey 201532
The following table summarizes executives’ changing views of 16 business environment factors, listed in the left hand column, across each of the countries. The percentages listed show the percentage change in satisfaction between respondents’ answers in 2009 and 2014. The green cells indicate positive percentage changes in satisfaction, while the red cells indicate negative percentage changes in satisfaction. The intensity of the shade of green or red indicates the significance of the change. Unshaded cells indicate minimal change.
Region-wide, changes ranged from 1-6% in either direction with a few exceptions—large decreases in satisfaction in the availability of low cost labor (-13%), availability of raw materials (-10%), availability of trained personnel (-14%), new business incentives offered by government (-11%), and office lease costs (-10%). Respondents in Malaysia reported decreased satisfaction in all factors, while the Philippines saw improvements in 9 factors.
8. CHANGE IN SATISFACTION OF LOCAL BUSINESS ENVIRONMENT (2009 vs. 2014)
Increase: 10% or greater increase in satisfaction Moderate Increase: Between 5% and 9% increase in satisfaction
Decrease: 10% or greater decrease in satisfaction Moderate Decrease: Between 5% and 9% decrease in satisfaction
Minimal Change: the satisfaction percentage has changed less than 5%
5 year data is not available for Brunei, Cambodia, Laos, and Myanmar. Cells measure the change in those reporting that they were satisfied with a given factor, not dissatisfied or neutral.
Factors ASEAN Indonesia Malaysia Philippines Singapore Thailand Vietnam
Availability of low cost labor 13% 18% 18% 2% 19% 26% 10%
Availability of raw materials 10% 10% 14% 4% 11% 11% 11%
Availability of trained personnel 14% 18% 26% 0% 14% 6% 6%
Ease of moving your products through customs 1% 6% 18% 13% 8% 5% 3%
Free movement of goods within the region 3% 1% 8% 0% 8% 6% 1%
Housing costs 5% 20% 23% 10% 9% 2% 18%
Infrastructure 5% 10% 25% 19% 6% 3% 6%
Lack of corruption 4% 1% 21% 13% 0% 3% 1%
Lack of local protectionism 4% 5% 21% 7% 12% 4% 12%
Laws and regulations 2% 9% 21% 1% 5% 5% 1%
New business incentives offered by government 11% 2% 9% 5% 20% 14% 17%
Office lease costs 10% 26% 25% 6% 3% 12% 17%
Personal security 3% 24% 21% 10% 6% 5% 12%
Sentiment towards the U.S. 6% 21% 7% 12% 24% 7% 1%
Stable government & political system 4% 8% 15% 23% 4% 3% 10%
Tax structure 3% 8% 14% 1% 5% 4% 11%

ASEAN Business Outlook Survey 2015 33
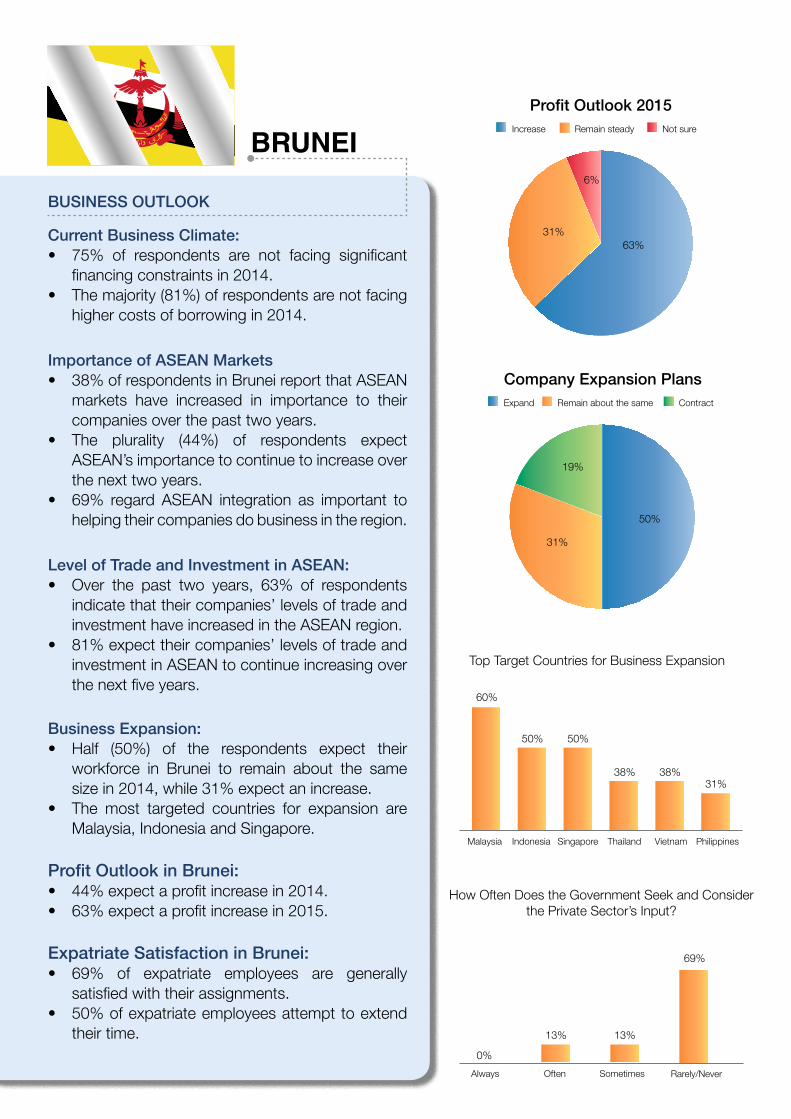
BRUNEI
BUSINESS OUTLOOK
Current Business Climate:• 75% of respondents are not facing significant
financing constraints in 2014.• The majority (81%) of respondents are not facing
higher costs of borrowing in 2014.
Importance of ASEAN Markets• 38% of respondents in Brunei report that ASEAN
markets have increased in importance to their companies over the past two years.
• The plurality (44%) of respondents expect ASEAN’s importance to continue to increase over the next two years.
• 69% regard ASEAN integration as important to helping their companies do business in the region.
Level of Trade and Investment in ASEAN:• Over the past two years, 63% of respondents
indicate that their companies’ levels of trade and investment have increased in the ASEAN region.
• 81% expect their companies’ levels of trade and investment in ASEAN to continue increasing over the next five years.
Business Expansion:• Half (50%) of the respondents expect their
workforce in Brunei to remain about the same size in 2014, while 31% expect an increase.
• The most targeted countries for expansion are Malaysia, Indonesia and Singapore.
Profit Outlook in Brunei:• 44% expect a profit increase in 2014.• 63% expect a profit increase in 2015.
Expatriate Satisfaction in Brunei:• 69% of expatriate employees are generally
satisfied with their assignments.• 50% of expatriate employees attempt to extend
their time.
Profit Outlook 2015Increase Remain steady Not sure
Top Target Countries for Business Expansion
Malaysia Indonesia Singapore Thailand Vietnam Philippines
60%
50% 50%
38% 38%31%
How Often Does the Government Seek and Consider the Private Sector’s Input?
Always Often Sometimes Rarely/Never
0%
13% 13%
69%
Company Expansion PlansExpand Remain about the same Contract
63%
6%
31%
50%
31%
19%
ASEAN Business Outlook Survey 2015 35
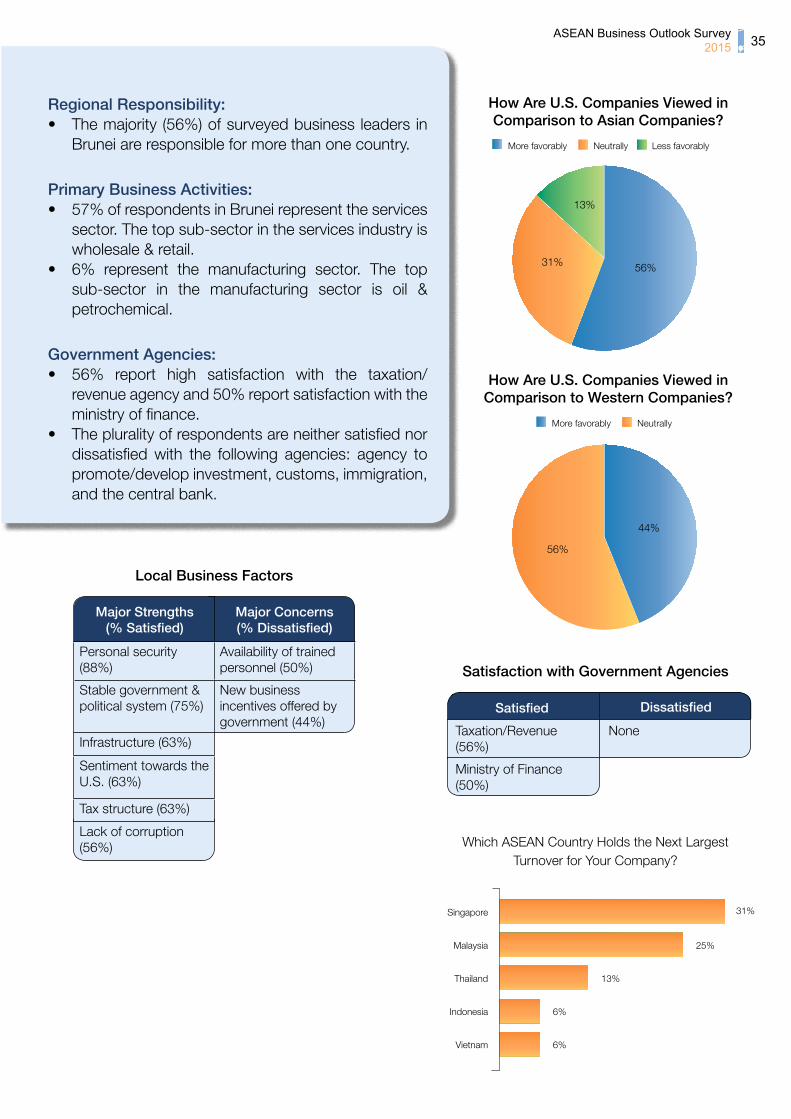
Regional Responsibility:• The majority (56%) of surveyed business leaders in
Brunei are responsible for more than one country.
Primary Business Activities:• 57% of respondents in Brunei represent the services
sector. The top sub-sector in the services industry is wholesale & retail.
• 6% represent the manufacturing sector. The top sub-sector in the manufacturing sector is oil & petrochemical.
Government Agencies:• 56% report high satisfaction with the taxation/
revenue agency and 50% report satisfaction with the ministry of finance.
• The plurality of respondents are neither satisfied nor dissatisfied with the following agencies: agency to promote/develop investment, customs, immigration, and the central bank.
31%
Which ASEAN Country Holds the Next Largest Turnover for Your Company?
Singapore
Malaysia 25%
Thailand 13%
Indonesia 6%
Vietnam 6%
Satisfaction with Government Agencies
Taxation/Revenue (56%)
Ministry of Finance (50%)
None
More favorably Neutrally Less favorably
How Are U.S. Companies Viewed in Comparison to Asian Companies?
More favorably Neutrally
How Are U.S. Companies Viewed in Comparison to Western Companies?
Personal security (88%)
Availability of trained personnel (50%)
Stable government & political system (75%)
New business incentives offered by government (44%)
Infrastructure (63%)
Sentiment towards the U.S. (63%)
Tax structure (63%)
Lack of corruption (56%)
Major Concerns(% Dissatisfied)
Major Strengths(% Satisfied)
Local Business Factors
Satisfied Dissatisfied
56%31%
13%
56%
44%

CAMBODIA
BUSINESS OUTLOOK
Current Business Climate:• 77% of respondents are not facing significant
financing constraints in 2014.• The majority (77%) of respondents are not facing
higher costs of borrowing in 2014.
Importance of ASEAN Markets:• 64% of respondents in Cambodia report that
ASEAN markets have increased in importance to their companies over the past two years.
• The majority (73%) of respondents expect ASEAN’s importance to continue to increase over the next two years.
• 77% regard ASEAN integration as important to helping their companies do business in the region.
Level of Trade and Investment in ASEAN:• Over the past two years, 82% of respondents
indicate that their companies’ levels of trade and investment have increased in the ASEAN region.
• 91% expect their companies’ levels of trade and investment in ASEAN to continue increasing over the next five years.
Business Expansion:• 73% of respondents expect their workforce in
Cambodia to increase in 2014.• The most targeted countries for expansion are
Myanmar and Vietnam.
Profit Outlook in Cambodia:• 59% expect a profit increase in 2014.• 86% expect a profit increase in 2015.
Expatriate Satisfaction in Cambodia:• 91% of expatriate employees are generally
satisfied with their assignments.• The majority (86%) of expatriate employees
attempt to extend their time.
Profit Outlook 2015Increase Remain steady Decrease Not sure
86%
5%5%4%
Top Target Countries for Business Expansion
Myanmar Vietnam Laos Thailand Indonesia Philippines
59%
32%27% 27%
14% 14%
How Often Does the Government Seek and Consider the Private Sector’s Input?
Always Often Sometimes Rarely/Never
5%
23%
32%27%
Company Expansion PlansExpand Remain about the same Contract
68%
27%
5%

ASEAN Business Outlook Survey 2015 37
Regional Responsibility:• The majority (68%) of surveyed business leaders in
Cambodia are not responsible for more than one country.
Primary Business Activities:• 77% of respondents in Cambodia represent the
services sector. The top sub-sectors in the services industry are legal and hospitality/tourism.
• 9% represent the manufacturing sector. The top sub-sector in the manufacturing sector is food & food products.
Government Agencies:• 55% report high satisfaction with the immigration
agency, while 50% report dissatisfaction with customs.
• The plurality of respondents are neither satisfied nor dissatisfied with the following agencies: agency to promote/develop investment, taxation/revenue, the central bank, and the ministry of finance.
27%
Which ASEAN Country Holds the Next Largest Turnover for Your Company?
Myanmar
Singapore 9%
Indonesia 5%
Laos 5%
Philippines 5%
Vietnam 5%
Availability of low cost labor (86%)
Corruption (82%)
Sentiment towards the U.S. (77%)
Infrastructure (77%)
Stable government and political system (50%)
Laws and regulations (41%)
Major Concerns(% Dissatisfied)
Major Strengths(% Satisfied)
Satisfaction with Government Agencies
Immigration (55%) Customs (50%)
More favorably Neutrally Less favorably
68%
27%
5%
How Are U.S. Companies Viewed in Comparison to Asian Companies?
More favorably Neutrally
46%
54%
How Are U.S. Companies Viewed in Comparison to Western Companies?
Local Business Factors
Satisfied Dissatisfied

INDONESIA
BUSINESS OUTLOOK
Current Business Climate:• 81% of respondents are not facing significant
financing constraints in 2014.• The majority (69%) of respondents are not facing
higher costs of borrowing in 2014.
Importance of ASEAN Markets:• 74% of respondents in Indonesia report that
ASEAN markets have increased in importance to their companies over the past two years.
• The majority (81%) of respondents expect ASEAN’s importance to continue to increase over the next two years.
• 86% regard ASEAN integration as important to helping their companies do business in the region.
Level of Trade and Investment in ASEAN:• Over the past two years, 83% of respondents
indicate that their companies’ levels of trade and investment have increased in the ASEAN region.
• 86% expect their companies’ levels of trade and investment in ASEAN to continue increasing over the next five years.
Business Expansion:• 57% of respondents expect their workforce in
Indonesia to increase in 2014.• The most targeted countries for expansion are
Vietnam, followed by Thailand and Myanmar.
Profit Outlook:• 62% expect a profit increase in 2014.• 88% expect a profit increase in 2015.
Expatriate Satisfaction in Indonesia:• 91% of expatriate employees are generally
satisfied with their assignments.• The majority (62%) of expatriate employees
attempt to extend their time.
Profit Outlook 2015Increase Remain steady
Top Target Countries for Business Expansion
Vietnam
43%
Thailand
41%
Myanmar
38%
Philippines
33%
Malaysia
24%
How Often Does the Government Seek and Consider the Private Sector’s Input?
Always Often Sometimes Rarely/Never
2% 5%
29%
62%
Company Expansion PlansExpand Remain about the same
88%
12%
81%
19%

ASEAN Business Outlook Survey 2015 39
Regional Responsibility:• The majority (74%) of surveyed business leaders
in Indonesia are not responsible for more than one country.
Primary Business Activities:• 48% represent the manufacturing sector. The
top sub-sectors in the manufacturing sector are consumer goods and food & food products.
• 36% of respondents in Indonesia represent the services sector. The top sub-sectors in the services industry are consulting and wholesale & retail.
Government Agencies:• 62% report dissatisfaction with customs, 43%
dissatisfaction with the taxation/revenue agency, and 40% with the agency to promote/develop investment.
• The plurality of respondents are neither satisfied nor dissatisfied with the following agencies: immigration, the central bank, and the ministry of finance.
26%
Which ASEAN Country Holds the Next Largest Turnover for Your Company?
Singapore
Thailand 26%
Malaysia 14%
Philippines 10%
Vietnam 7%
Satisfaction with Government Agencies
None Customs (62%)
Taxation/Revenue (43%)
Agency to Promote/Develop Investment (40%)
More favorably Neutrally Less favorably
How Are U.S. Companies Viewed in Comparison to Asian Companies?
More favorably Neutrally Less favorably
How Are U.S. Companies Viewed in Comparison to Western Companies?
Satisfied Dissatisfied
None Infrastructure (88%)
Corruption (79%)
Laws and regulations (76%)
New business incentives offered by government (64%)
Availability of trained personnel (62%)
Ease of moving your products through customs (60%)
Local protectionism (57%)
Free movement of goods within the region (48%)
Major Concerns(% Dissatisfied)
Major Strengths(% Satisfied)
Local Business Factors
45%
38%
17%
10%
45%45%
45%

LAOS
BUSINESS OUTLOOK
Current Business Climate:• 54% of respondents are not facing significant
financing constraints in 2014.• The majority (69%) of respondents are not facing
higher costs of borrowing in 2014.
Importance of ASEAN Markets:• 46% of respondents in Laos report that ASEAN
markets have increased in importance to their companies over the past two years.
• The majority (77%) of respondents expect ASEAN’s importance to continue to increase over the next two years.
• 92% regard ASEAN integration as important to helping their companies do business in the region.
Level of Trade and Investment in ASEAN:• Over the past two years, 62% of respondents
indicate that their companies’ levels of trade and investment have increased in the ASEAN region.
• 77% expect their companies’ levels of trade and investment in ASEAN to continue increasing over the next five years.
Business Expansion:• 69% of respondents expect their workforce in
Laos to increase in 2014.• The most targeted countries for expansion are
Cambodia and Thailand.
Profit Outlook in Laos:• 46% expect a profit increase in 2014.• 62% expect a profit increase in 2015.
Expatriate Satisfaction in Laos:• 92% of expatriate employees are generally
satisfied with their assignments.• The majority (77%) of expatriate employees
attempt to extend their time.
Top Target Countries for Business Expansion
Cambodia Thailand Myanmar Philippines Singapore
69%
54%46%
23% 23%
Profit Outlook 2015Increase Remain steady Decrease
62%
15%
23%
Company Expansion PlansExpand Remain about the same Contract
77%
8%
15%
Always Often Sometimes Rarely/Never
0% 0%
31%
62%
How Often Does the Government Seek and Consider the Private Sector’s Input?

ASEAN Business Outlook Survey 2015 41
Regional Responsibility:• The majority (54%) of surveyed business leaders in
Laos are responsible for more than one country.
Primary Business Activities:• 77% of respondents in Laos represent the services
sector. The top sub-sectors in the services industry are hospitality/tourism, legal, and transportation & logistics.
• 23% represent the manufacturing sector. The top sub-sector in the manufacturing sector is food & food products.
Government Agencies:• 69% report dissatisfaction with the taxation/revenue
agency, 62% with customs, 54% with the ministry of finance, and 46% with the central bank.
• The plurality of respondents are neither satisfied nor dissatisfied with the following agencies: the agency to promote/develop investment and immigration.
Satisfaction with Government Agencies
Satisfied
None Taxation/Revenue(69%)
Ministry of Finance (54%)
Central Bank (46%)
Customs (62%)
Dissatisfied
More favorably Neutrally Less favorably
23%
54%
23%
How Are U.S. Companies Viewed in Comparison to Asian Companies?
Neutrally Less favorably
39%
61%
How Are U.S. Companies Viewed in Comparison to Western Companies?
Availability of low cost labor (69%)
Availability of trained personnel (100%)
Personal security (69%)
Corruption (100%)
Infrastructure (85%)
New business incentives offered by government (85%)
Laws and regulations (77%)
Ease of moving your products through customs (69%)
Free movement of goods within the region (62%)
Local protectionism (62%)
Tax structure (62%)
Major Concerns(% Dissatisfied)
Major Strengths(% Satisfied)
Local Business Factors
Which ASEAN Country Holds the Next Largest Turnover for Your Company?
Cambodia 46%
Philippines 15%
Myanmar 8%
Thailand 8%

MALAYSIA
BUSINESS OUTLOOK
Current Business Climate:• 78% of respondents are not facing significant
financing constraints in 2014.• The majority (82%) of respondents are not facing
higher costs of borrowing in 2014.
Importance of ASEAN:• 55% of respondents in Malaysia report that
ASEAN markets have increased in importance to their companies over the past two years.
• The majority (65%) of respondents expect ASEAN’s importance to continue to increase over the next two years.
• 87% regard ASEAN integration as important to helping their companies do business in the region.
Level of Trade and Investment in ASEAN:• Over the past two years, 67% of respondents
indicate that their companies’ levels of trade and investment have increased in the ASEAN region.
• 87% expect their companies’ levels of trade and investment in ASEAN to continue increasing over the next five years.
Business Expansion:• 52% of respondents expect their workforce in
Malaysia to increase in 2014.• The most targeted countries for expansion are
Indonesia and Thailand.
Profit Outlook in Malaysia:• 53% expect a profit increase in 2014.• 77% expect a profit increase in 2015.
Expatriate Satisfaction in Malaysia:• 95% of expatriate employees are generally
satisfied with their assignments.• The majority (77%) of expatriate employees
attempt to extend their time.
Profit Outlook 2015
Company Expansion PlansExpand Remain about the same Don’t know
Always Often Sometimes Rarely/Never
3%
23%
45%
25%
How Often Does the Government Seek and Consider the Private Sector’s Input?
Increase Remain steady Decrease Not sure
77%
3%5%
15%
70%
28%
2%
Top Target Countries for Business Expansion
Indonesia Thailand Vietnam Myanmar Philippines Singapore
52%
42%
35%28% 27% 27%

ASEAN Business Outlook Survey 2015 43
Regional Responsibility:• The majority (57%) of surveyed business leaders in
Malaysia are responsible for more than one country.
Primary Business Activities:• 53% of respondents in Malaysia represent the
services sector. The top sub-sectors in the services industry are consulting, education, and hospitality/tourism.
• 33% represent the manufacturing sector. The top sub-sectors in the manufacturing sector are electronics and oil & petrochemical.
Government Agencies:• The plurality of respondents are neither satisfied nor
dissatisfied with the following agencies: the agency to promote/develop investment, customs, immigration, taxation/revenue, the central bank, and the ministry of finance.
Satisfaction with Government Agencies
Satisfied
None None
Dissatisfied
More favorably Neutrally Less favorably
How Are U.S. Companies Viewed in Comparison to Asian Companies?
Sentiment towards the U.S. (58%)
Corruption (67%)
Infrastructure (57%) Personal security (42%)
Office lease cost (50%)
Major Concerns(% Dissatisfied)
Major Strengths(% Satisfied)
Local Business Factors
Which ASEAN Country Holds the Next Largest Turnover for Your Company?
Singapore 32%
Thailand
10%Indonesia
10%Philippines
10%
63%
32%
5%
More favorably Neutrally Less favorably
How Are U.S. Companies Viewed in Comparison to Western Companies?
55%
40%
5%
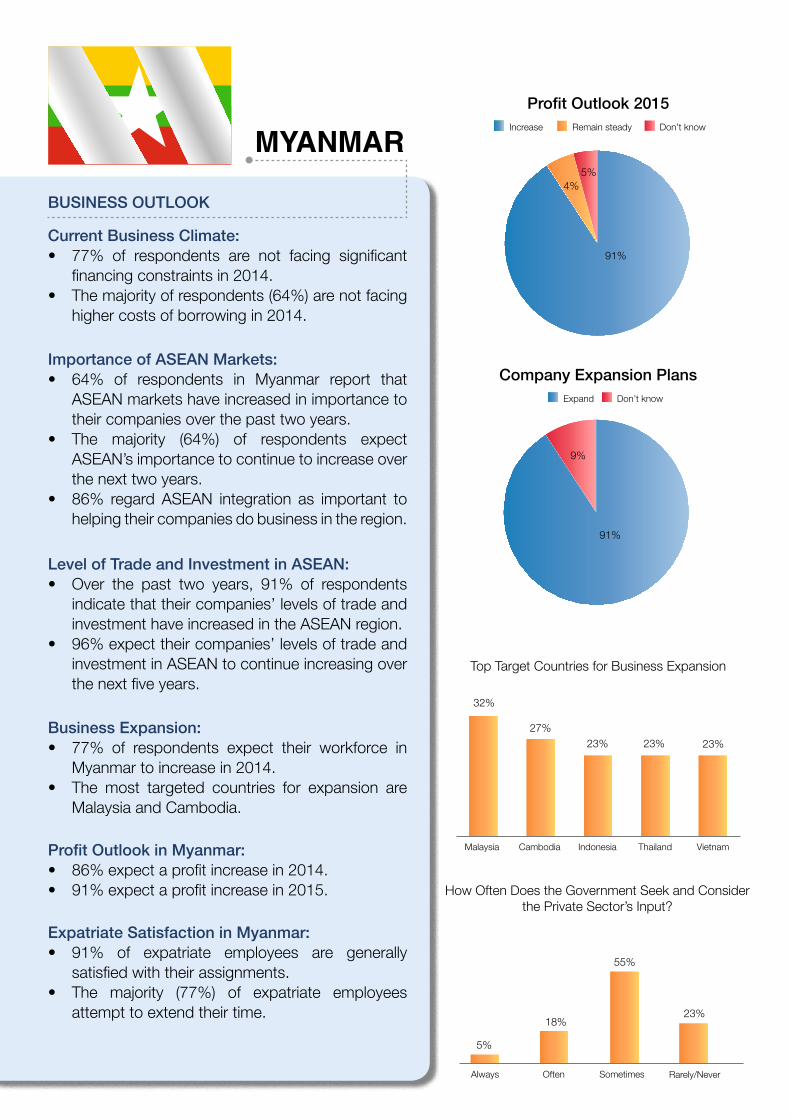
MYANMAR
BUSINESS OUTLOOK
Current Business Climate:• 77% of respondents are not facing significant
financing constraints in 2014.• The majority of respondents (64%) are not facing
higher costs of borrowing in 2014.
Importance of ASEAN Markets:• 64% of respondents in Myanmar report that
ASEAN markets have increased in importance to their companies over the past two years.
• The majority (64%) of respondents expect ASEAN’s importance to continue to increase over the next two years.
• 86% regard ASEAN integration as important to helping their companies do business in the region.
Level of Trade and Investment in ASEAN:• Over the past two years, 91% of respondents
indicate that their companies’ levels of trade and investment have increased in the ASEAN region.
• 96% expect their companies’ levels of trade and investment in ASEAN to continue increasing over the next five years.
Business Expansion:• 77% of respondents expect their workforce in
Myanmar to increase in 2014.• The most targeted countries for expansion are
Malaysia and Cambodia.
Profit Outlook in Myanmar:• 86% expect a profit increase in 2014.• 91% expect a profit increase in 2015.
Expatriate Satisfaction in Myanmar:• 91% of expatriate employees are generally
satisfied with their assignments.• The majority (77%) of expatriate employees
attempt to extend their time.
Top Target Countries for Business Expansion
Malaysia Cambodia Indonesia Thailand Vietnam
32%
27%23% 23% 23%
Profit Outlook 2015Increase Remain steady Don’t know
Company Expansion PlansExpand Don’t know
Always Often Sometimes Rarely/Never
5%
18%
55%
23%
How Often Does the Government Seek and Consider the Private Sector’s Input?
91%
5%4%
91%
9%
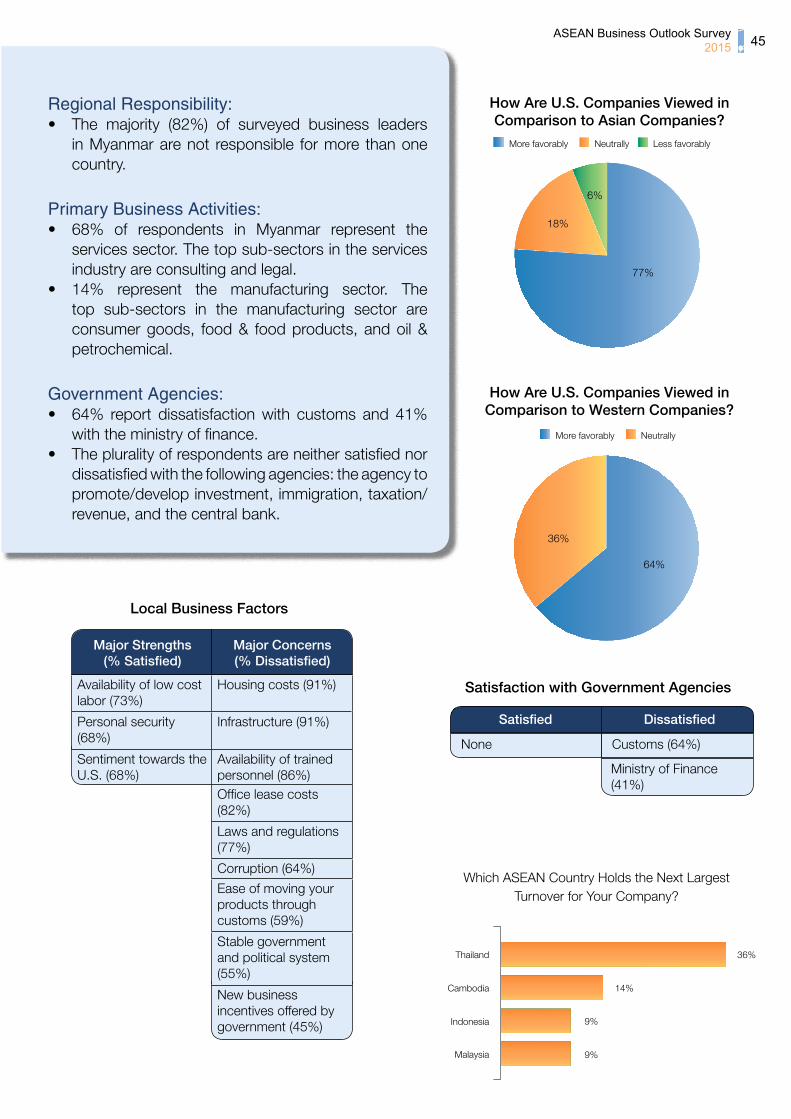
ASEAN Business Outlook Survey 2015 45
Regional Responsibility:• The majority (82%) of surveyed business leaders
in Myanmar are not responsible for more than one country.
Primary Business Activities:• 68% of respondents in Myanmar represent the
services sector. The top sub-sectors in the services industry are consulting and legal.
• 14% represent the manufacturing sector. The top sub-sectors in the manufacturing sector are consumer goods, food & food products, and oil & petrochemical.
Government Agencies:• 64% report dissatisfaction with customs and 41%
with the ministry of finance.• The plurality of respondents are neither satisfied nor
dissatisfied with the following agencies: the agency to promote/develop investment, immigration, taxation/revenue, and the central bank.
Satisfaction with Government Agencies
Satisfied
None
Ministry of Finance(41%)
Customs (64%)
Dissatisfied
More favorably Neutrally Less favorably
How Are U.S. Companies Viewed in Comparison to Asian Companies?
More favorably Neutrally
How Are U.S. Companies Viewed in Comparison to Western Companies?
Availability of low cost labor (73%)
Housing costs (91%)
Personal security (68%)
Infrastructure (91%)
Sentiment towards the U.S. (68%)
Availability of trained personnel (86%)Office lease costs (82%)
Laws and regulations (77%)
Corruption (64%)
Ease of moving your products through customs (59%)
Stable government and political system (55%)
New business incentives offered by government (45%)
Major Concerns(% Dissatisfied)
Major Strengths(% Satisfied)
Local Business Factors
77%
18%
6%
36%
64%
Which ASEAN Country Holds the Next Largest Turnover for Your Company?
Thailand 36%
Cambodia 14%
Indonesia 9%
Malaysia 9%

PHILIPPINES
BUSINESS OUTLOOK
Current Business Climate:• 84% of respondents are not facing significant
financing constraints in 2014.• The majority (86%) of respondents are not facing
higher costs of borrowing in 2014.
Importance of ASEAN Markets:• 61% of respondents in the Philippines report that
ASEAN markets have increased in importance to their companies over the past two years.
• The majority (71%) of respondents expect ASEAN’s importance to continue to increase over the next two years.
• 69% regard ASEAN integration as important to helping their companies do business in the region.
Level of Trade and Investment in ASEAN:• Over the past two years, 74% of respondents
indicate that their companies’ levels of trade and investment have increased in the ASEAN region.
• 88% expect their companies’ levels of trade and investment in ASEAN to continue increasing over the next five years.
Business Expansion:• 61% of respondents expect their workforce in the
Philippines to increase in 2014.• The most targeted countries for expansion are
Indonesia and Vietnam.
Profit Outlook in the Philippines:• 57% expect a profit increase in 2014.• 74% expect a profit increase in 2015.
Expatriate Satisfaction in the Philippines:• 98% of expatriate employees are generally
satisfied with their assignments.• The majority (82%) of expatriate employees
attempt to extend their time.
Top Target Countries for Business Expansion
Indonesia Vietnam Malaysia Thailand Singapore
37%
33%29%
20%18%
Profit Outlook 2015Increase Remain steady Decrease
Company Expansion Plans
Always Often Sometimes Rarely/Never
0%
22%
55%
16%
How Often Does the Government Seek and Consider the Private Sector’s Input?
74%
6%
20%
Expand Remain about the same Contract Don’t know
61%
33%
2%4%
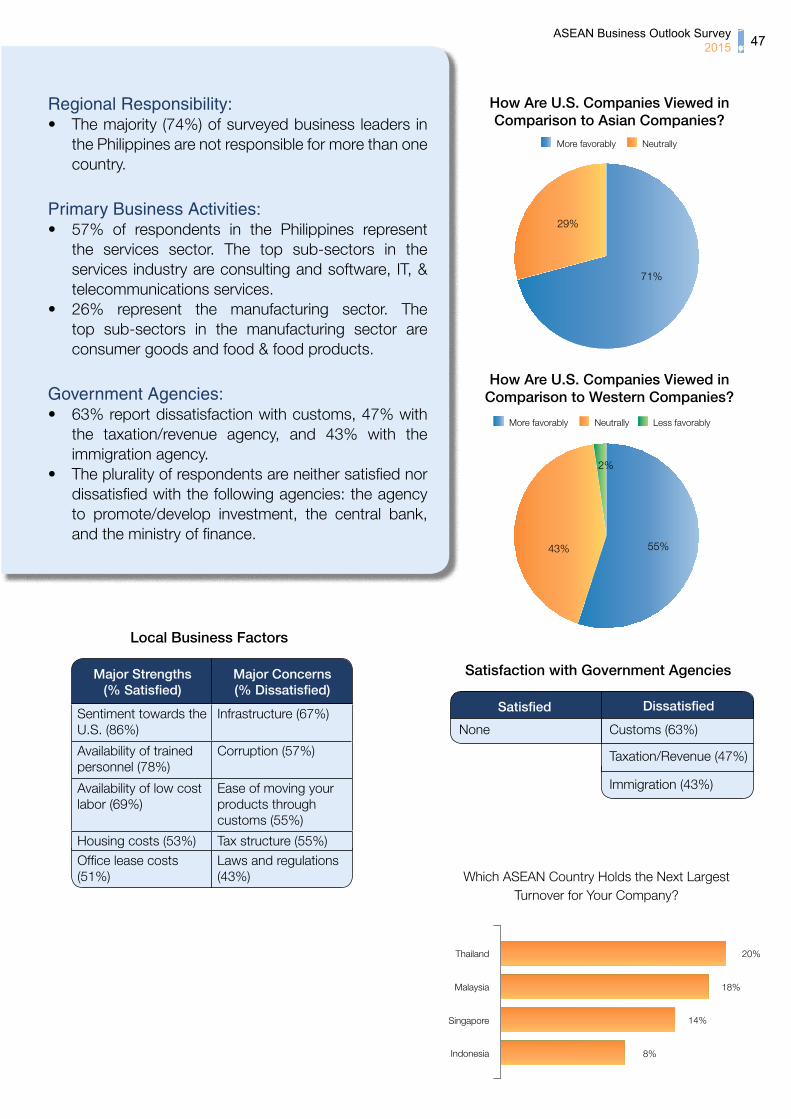
ASEAN Business Outlook Survey 2015 47
Regional Responsibility:• The majority (74%) of surveyed business leaders in
the Philippines are not responsible for more than one country.
Primary Business Activities:• 57% of respondents in the Philippines represent
the services sector. The top sub-sectors in the services industry are consulting and software, IT, & telecommunications services.
• 26% represent the manufacturing sector. The top sub-sectors in the manufacturing sector are consumer goods and food & food products.
Government Agencies:• 63% report dissatisfaction with customs, 47% with
the taxation/revenue agency, and 43% with the immigration agency.
• The plurality of respondents are neither satisfied nor dissatisfied with the following agencies: the agency to promote/develop investment, the central bank, and the ministry of finance.
More favorably Neutrally
How Are U.S. Companies Viewed in Comparison to Asian Companies?
More favorably Neutrally Less favorably
How Are U.S. Companies Viewed in Comparison to Western Companies?
Sentiment towards the U.S. (86%)
Infrastructure (67%)
Availability of trained personnel (78%)
Corruption (57%)
Availability of low cost labor (69%)
Ease of moving your products through customs (55%)
Housing costs (53%) Tax structure (55%)
Office lease costs (51%)
Laws and regulations (43%)
Major Concerns(% Dissatisfied)
Major Strengths(% Satisfied)
Local Business Factors
71%
29%
43% 55%
2%
Satisfaction with Government Agencies
None Customs (63%)
Taxation/Revenue (47%)
Immigration (43%)
Satisfied Dissatisfied
Which ASEAN Country Holds the Next Largest Turnover for Your Company?
Thailand 20%
Malaysia 18%
Singapore 14%
Indonesia 8%

SINGAPORE
BUSINESS OUTLOOK
Current Business Climate:• 86% of respondents are not facing significant
financing constraints in 2014.• The majority (85%) of respondents are not facing
higher costs of borrowing in 2014.
Importance of ASEAN Markets:• 57% of respondents in Singapore report that
ASEAN markets have increased in importance to their companies over the past two years.
• The majority (60%) of respondents expect ASEAN’s importance to continue to increase over the next two years.
• 81% regard ASEAN integration as important to helping their companies do business in the region.
Level of Trade and Investment in ASEAN:• Over the past two years, 77% of respondents
indicate that their companies’ levels of trade and investment have increased in the ASEAN region.
• 89% expect their companies’ levels of trade and investment in ASEAN to continue increasing over the next five years.
Business Expansion:• 52% of respondents expect their workforce in
Singapore to increase in 2014.• The most targeted countries for expansion are
Indonesia, Vietnam, and Malaysia.
Profit Outlook in the Singapore:• 66% expect a profit increase in 2014.• 84% expect a profit increase in 2015.
Expatriate Satisfaction in Singapore:• 95% of expatriate employees are generally
satisfied with their assignments.• The majority (86%) of expatriate employees
attempt to extend their time.
Profit Outlook 2015
Company Expansion PlansExpand Remain about the same Contract
Always Often Sometimes Rarely/Never
10%
35%37%
8%
How Often Does the Government Seek and Consider the Private Sector’s Input?
84%
2%
2%
12%
Increase Remain steady Decrease Not sure
57%
39%
4%
Top Target Countries for Business Expansion
Indonesia Vietnam Malaysia Thailand Philippines Myanmar
63%
51% 50%45%
39%
31%
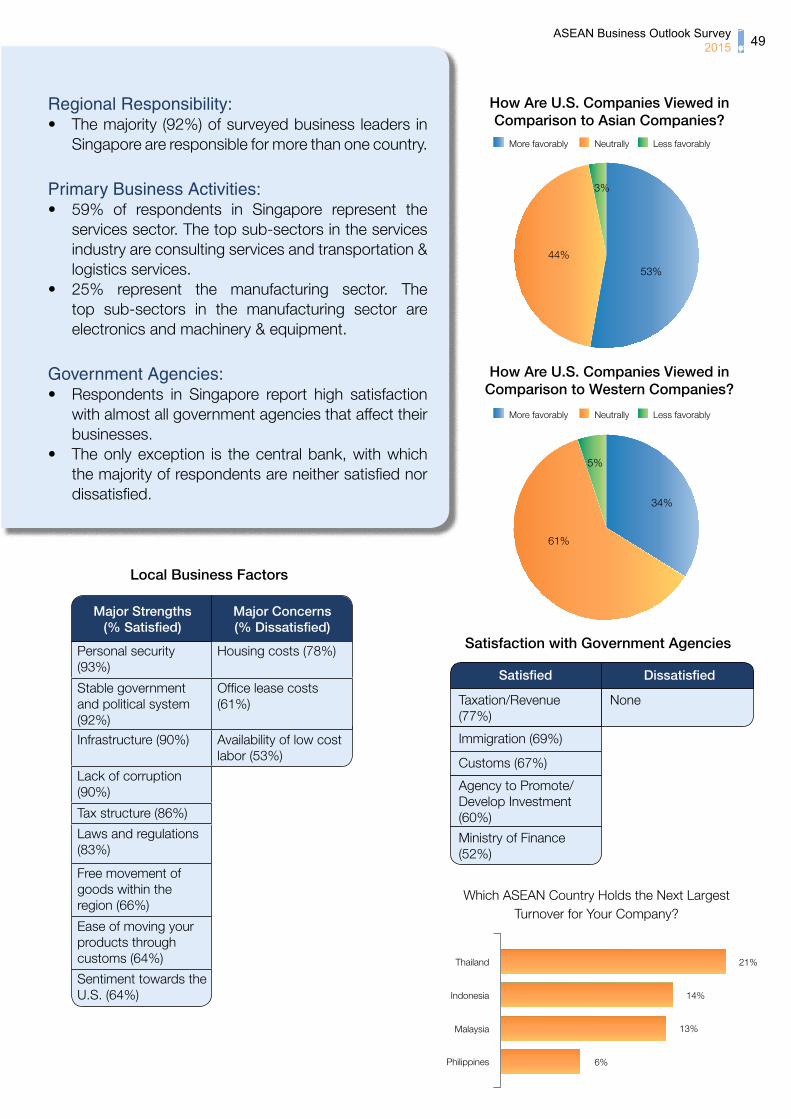
ASEAN Business Outlook Survey 2015 49
Regional Responsibility:• The majority (92%) of surveyed business leaders in
Singapore are responsible for more than one country.
Primary Business Activities:• 59% of respondents in Singapore represent the
services sector. The top sub-sectors in the services industry are consulting services and transportation & logistics services.
• 25% represent the manufacturing sector. The top sub-sectors in the manufacturing sector are electronics and machinery & equipment.
Government Agencies:• Respondents in Singapore report high satisfaction
with almost all government agencies that affect their businesses.
• The only exception is the central bank, with which the majority of respondents are neither satisfied nor dissatisfied.
Satisfaction with Government Agencies
Satisfied
Taxation/Revenue (77%)
Ministry of Finance (52%)
Agency to Promote/Develop Investment (60%)
Immigration (69%)
Customs (67%)
None
Dissatisfied
More favorably Neutrally Less favorably
How Are U.S. Companies Viewed in Comparison to Asian Companies?
More favorably Neutrally Less favorably
How Are U.S. Companies Viewed in Comparison to Western Companies?
Personal security (93%)
Housing costs (78%)
Stable government and political system (92%)
Office lease costs (61%)
Infrastructure (90%) Availability of low cost labor (53%)
Lack of corruption (90%)
Tax structure (86%)
Laws and regulations (83%)
Free movement of goods within the region (66%)
Ease of moving your products through customs (64%)
Sentiment towards the U.S. (64%)
Major Concerns(% Dissatisfied)
Major Strengths(% Satisfied)
Local Business Factors
Which ASEAN Country Holds the Next Largest Turnover for Your Company?
Thailand 21%
Indonesia 14%
Malaysia 13%
Philippines 6%
53%
44%
3%
61%
34%
5%
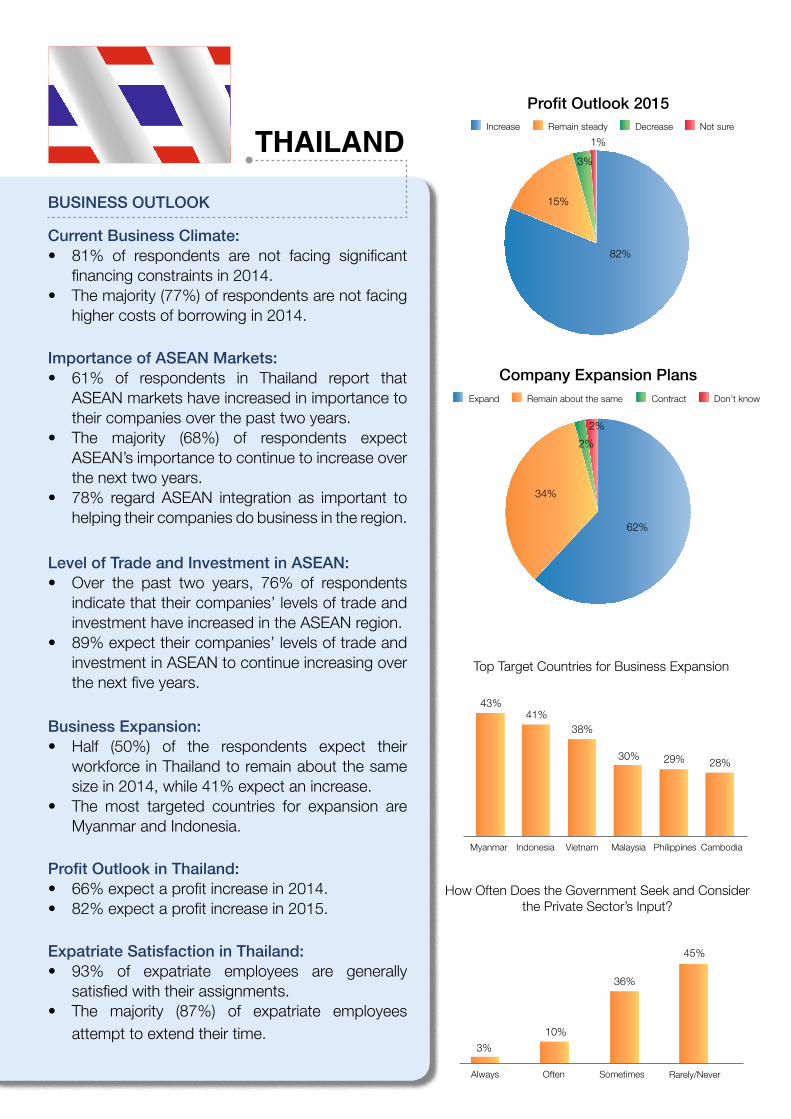
THAILAND
BUSINESS OUTLOOK
Current Business Climate:• 81% of respondents are not facing significant
financing constraints in 2014.• The majority (77%) of respondents are not facing
higher costs of borrowing in 2014.
Importance of ASEAN Markets:• 61% of respondents in Thailand report that
ASEAN markets have increased in importance to their companies over the past two years.
• The majority (68%) of respondents expect ASEAN’s importance to continue to increase over the next two years.
• 78% regard ASEAN integration as important to helping their companies do business in the region.
Level of Trade and Investment in ASEAN:• Over the past two years, 76% of respondents
indicate that their companies’ levels of trade and investment have increased in the ASEAN region.
• 89% expect their companies’ levels of trade and investment in ASEAN to continue increasing over the next five years.
Business Expansion:• Half (50%) of the respondents expect their
workforce in Thailand to remain about the same size in 2014, while 41% expect an increase.
• The most targeted countries for expansion are Myanmar and Indonesia.
Profit Outlook in Thailand:• 66% expect a profit increase in 2014.• 82% expect a profit increase in 2015.
Expatriate Satisfaction in Thailand:• 93% of expatriate employees are generally
satisfied with their assignments.• The majority (87%) of expatriate employees
attempt to extend their time.
Profit Outlook 2015
Company Expansion Plans
Always Often Sometimes Rarely/Never
3%
10%
36%
45%
How Often Does the Government Seek and Consider the Private Sector’s Input?
Increase Remain steady Decrease Not sure
82%
3%
1%
15%
Expand Remain about the same Contract Don’t know
62%
34%
2%
2%
Top Target Countries for Business Expansion
Myanmar Indonesia Vietnam Malaysia Philippines Cambodia
43%41%
38%
30% 29% 28%
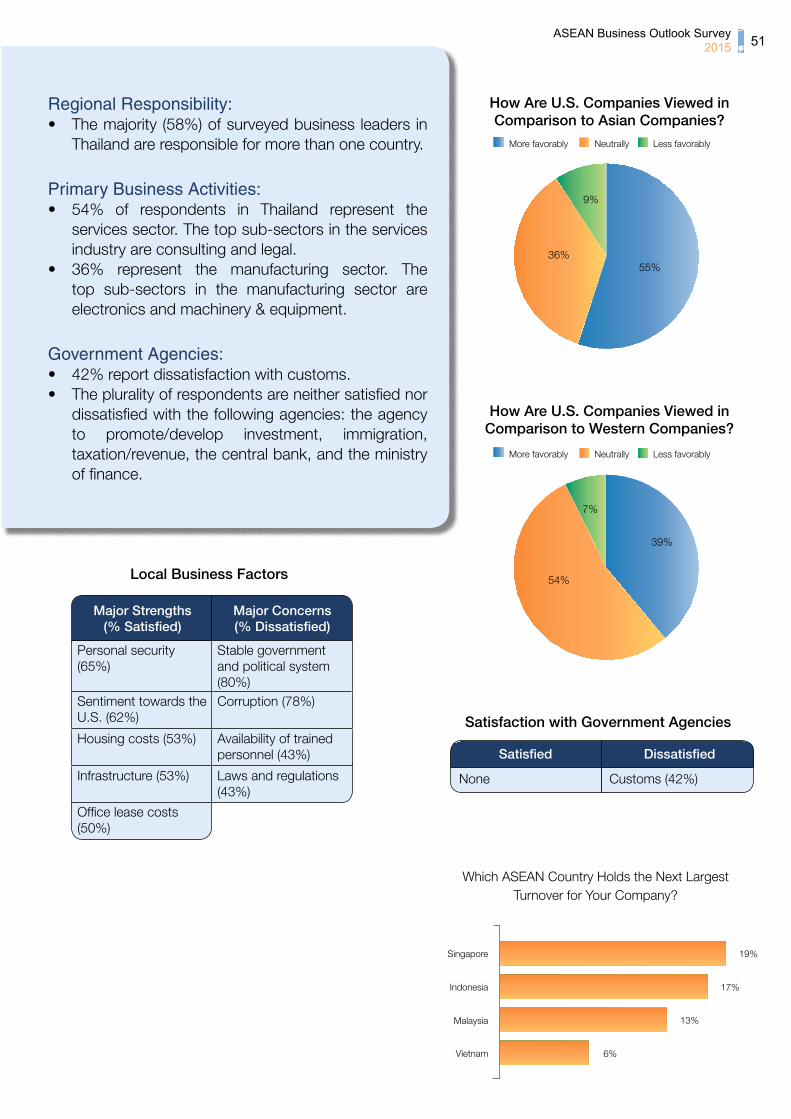
ASEAN Business Outlook Survey 2015 51
Regional Responsibility:• The majority (58%) of surveyed business leaders in
Thailand are responsible for more than one country.
Primary Business Activities:• 54% of respondents in Thailand represent the
services sector. The top sub-sectors in the services industry are consulting and legal.
• 36% represent the manufacturing sector. The top sub-sectors in the manufacturing sector are electronics and machinery & equipment.
Government Agencies:• 42% report dissatisfaction with customs.• The plurality of respondents are neither satisfied nor
dissatisfied with the following agencies: the agency to promote/develop investment, immigration, taxation/revenue, the central bank, and the ministry of finance.
Satisfaction with Government Agencies
Satisfied
None Customs (42%)
Dissatisfied
More favorably Neutrally Less favorably
How Are U.S. Companies Viewed in Comparison to Asian Companies?
More favorably Neutrally Less favorably
How Are U.S. Companies Viewed in Comparison to Western Companies?
Which ASEAN Country Holds the Next Largest Turnover for Your Company?
Singapore 19%
Indonesia 17%
Malaysia 13%
Vietnam 6%
55%36%
9%
54%
39%
7%
Personal security (65%)
Stable government and political system (80%)
Sentiment towards the U.S. (62%)
Corruption (78%)
Housing costs (53%) Availability of trained personnel (43%)
Infrastructure (53%) Laws and regulations (43%)
Office lease costs (50%)
Major Concerns(% Dissatisfied)
Major Strengths(% Satisfied)
Local Business Factors

VIETNAM
BUSINESS OUTLOOK
Current Business Climate:• 82% of respondents are not facing significant
financing constraints in 2014.• The majority (87%) of respondents are not facing
higher costs of borrowing in 2014.
Importance of ASEAN Markets to Global Business:• 55% of respondents in Vietnam report that
ASEAN markets have increased in importance to their companies over the past two years.
• The majority (71%) of respondents expect ASEAN’s importance to continue to increase over the next two years.
• 84% regard ASEAN integration as important to helping their companies do business in the region.
Level of Trade and Investment in ASEAN:• Over the past two years, 65% of respondents
indicate that their companies’ levels of trade and investment have increased in the ASEAN region.
• 92% expect their companies’ levels of trade and investment in ASEAN to continue increasing over the next five years.
Business Expansion:• 57% of respondents expect their workforce in
Vietnam to increase in 2014.• The most targeted countries for expansion are
Myanmar and Cambodia.
Profit Outlook in Vietnam:• 66% expect a profit increase in 2014.• 82% expect a profit increase in 2015.
Expatriate Satisfaction in Vietnam:• 95% of expatriate employees are generally
satisfied with their assignments.• The majority (87%) of expatriate employees
attempt to extend their time.
Top Target Countries for Business Expansion
Myanmar Cambodia Indonesia Thailand
42%
29%25% 22%
Profit Outlook 2015
Company Expansion PlansExpand Remain about the same Don’t know
Always Often Sometimes Rarely/Never
1%
23%
48%
22%
How Often Does the Government Seek and Consider the Private Sector’s Input?
Increase Remain steady Decrease Not sure
82%
5%4%
9%
74%
22%
4%
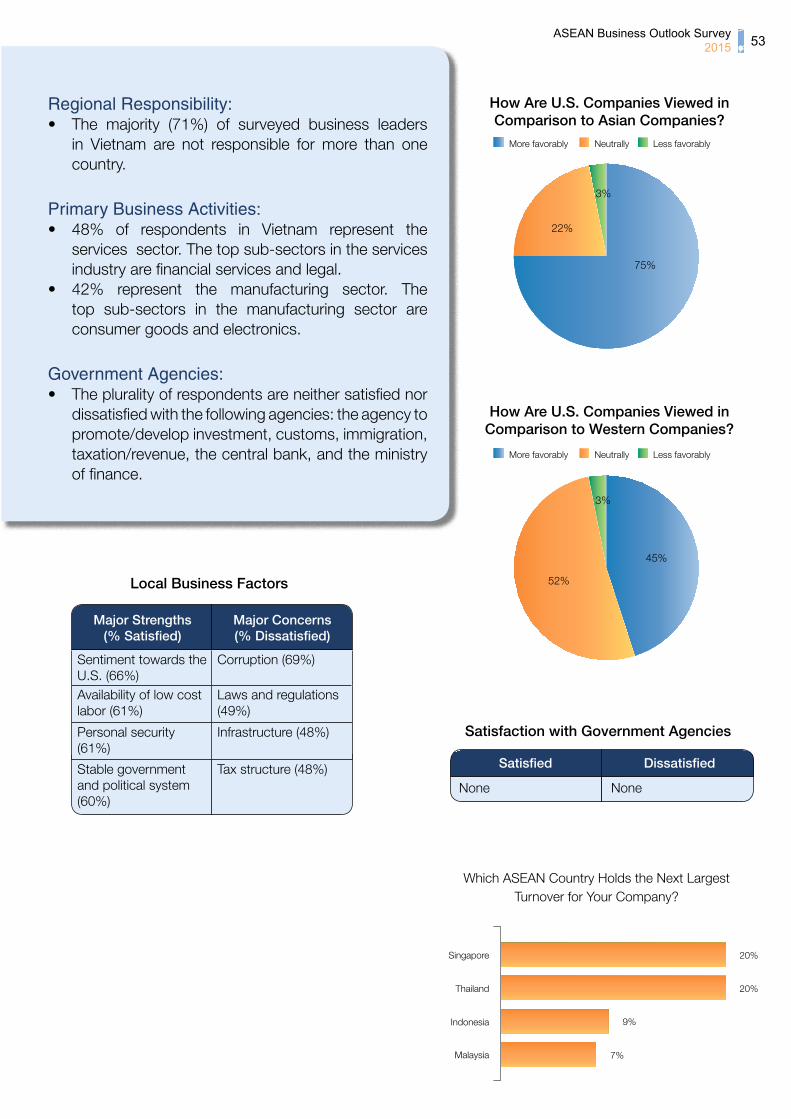
ASEAN Business Outlook Survey 2015 53
Regional Responsibility:• The majority (71%) of surveyed business leaders
in Vietnam are not responsible for more than one country.
Primary Business Activities:• 48% of respondents in Vietnam represent the
services sector. The top sub-sectors in the services industry are financial services and legal.
• 42% represent the manufacturing sector. The top sub-sectors in the manufacturing sector are consumer goods and electronics.
Government Agencies:• The plurality of respondents are neither satisfied nor
dissatisfied with the following agencies: the agency to promote/develop investment, customs, immigration, taxation/revenue, the central bank, and the ministry of finance.
Satisfaction with Government Agencies
Satisfied
None None
Dissatisfied
More favorably Neutrally Less favorably
How Are U.S. Companies Viewed in Comparison to Asian Companies?
Which ASEAN Country Holds the Next Largest Turnover for Your Company?
Singapore
Thailand 20%
20%
Indonesia 9%
Malaysia 7%
75%
22%
3%
More favorably Neutrally Less favorably
How Are U.S. Companies Viewed in Comparison to Western Companies?
52%
45%
3%
Sentiment towards the U.S. (66%)
Corruption (69%)
Availability of low cost labor (61%)
Laws and regulations (49%)
Personal security (61%)
Infrastructure (48%)
Stable government and political system (60%)
Tax structure (48%)
Major Concerns(% Dissatisfied)
Major Strengths(% Satisfied)
Local Business Factors
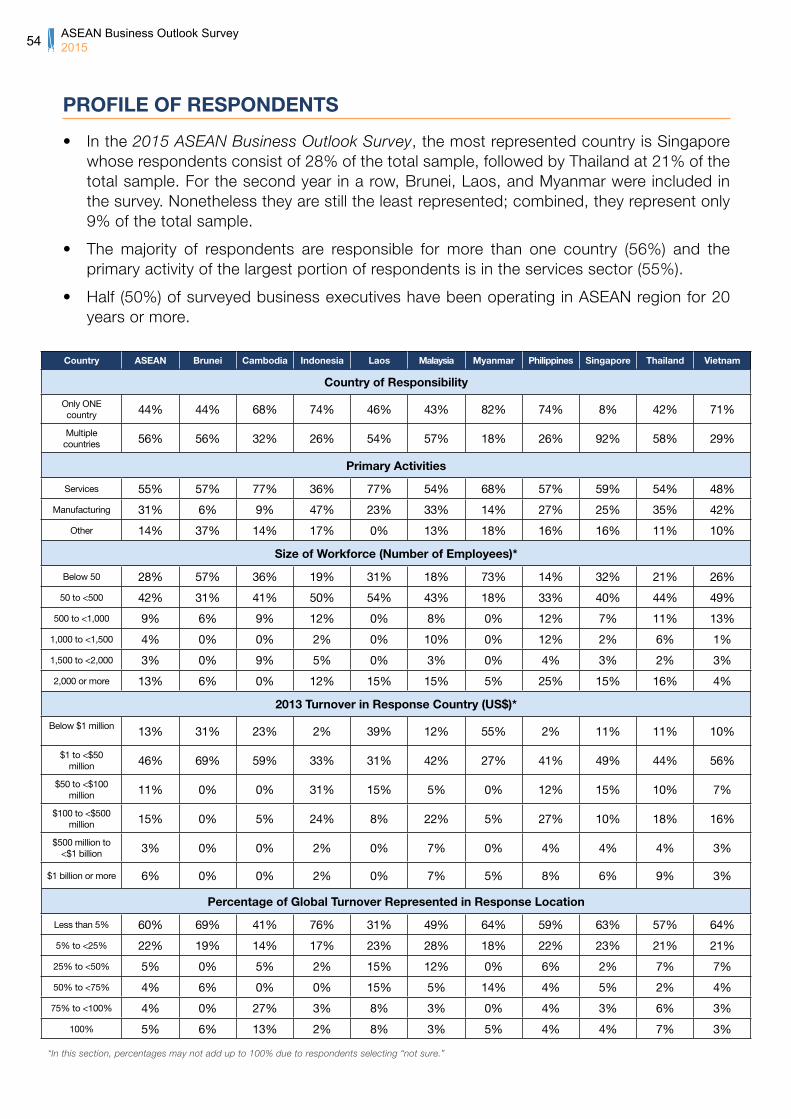
ASEAN Business Outlook Survey 201554
PROFILE OF RESPONDENTS
• In the 2015 ASEAN Business Outlook Survey, the most represented country is Singapore whose respondents consist of 28% of the total sample, followed by Thailand at 21% of the total sample. For the second year in a row, Brunei, Laos, and Myanmar were included in the survey. Nonetheless they are still the least represented; combined, they represent only 9% of the total sample.
• The majority of respondents are responsible for more than one country (56%) and the primary activity of the largest portion of respondents is in the services sector (55%).
• Half (50%) of surveyed business executives have been operating in ASEAN region for 20 years or more.
*In this section, percentages may not add up to 100% due to respondents selecting “not sure.”
Country ASEAN Brunei Cambodia Indonesia Laos Malaysia Myanmar Philippines Singapore Thailand Vietnam
Country of Responsibility
Only ONE country 44% 44% 68% 74% 46% 43% 82% 74% 8% 42% 71%
Multiple countries 56% 56% 32% 26% 54% 57% 18% 26% 92% 58% 29%
Primary Activities
Services 55% 57% 77% 36% 77% 54% 68% 57% 59% 54% 48%
Manufacturing 31% 6% 9% 47% 23% 33% 14% 27% 25% 35% 42%
Other 14% 37% 14% 17% 0% 13% 18% 16% 16% 11% 10%
Size of Workforce (Number of Employees)*
Below 50 28% 57% 36% 19% 31% 18% 73% 14% 32% 21% 26%
50 to <500 42% 31% 41% 50% 54% 43% 18% 33% 40% 44% 49%
500 to <1,000 9% 6% 9% 12% 0% 8% 0% 12% 7% 11% 13%
1,000 to <1,500 4% 0% 0% 2% 0% 10% 0% 12% 2% 6% 1%
1,500 to <2,000 3% 0% 9% 5% 0% 3% 0% 4% 3% 2% 3%
2,000 or more 13% 6% 0% 12% 15% 15% 5% 25% 15% 16% 4%
2013 Turnover in Response Country (US$)*
Below $1 million 13% 31% 23% 2% 39% 12% 55% 2% 11% 11% 10%
$1 to <$50 million 46% 69% 59% 33% 31% 42% 27% 41% 49% 44% 56%
$50 to <$100 million 11% 0% 0% 31% 15% 5% 0% 12% 15% 10% 7%
$100 to <$500 million 15% 0% 5% 24% 8% 22% 5% 27% 10% 18% 16%
$500 million to <$1 billion 3% 0% 0% 2% 0% 7% 0% 4% 4% 4% 3%
$1 billion or more 6% 0% 0% 2% 0% 7% 5% 8% 6% 9% 3%
Percentage of Global Turnover Represented in Response Location
Less than 5% 60% 69% 41% 76% 31% 49% 64% 59% 63% 57% 64%
5% to <25% 22% 19% 14% 17% 23% 28% 18% 22% 23% 21% 21%
25% to <50% 5% 0% 5% 2% 15% 12% 0% 6% 2% 7% 7%
50% to <75% 4% 6% 0% 0% 15% 5% 14% 4% 5% 2% 4%
75% to <100% 4% 0% 27% 3% 8% 3% 0% 4% 3% 6% 3%
100% 5% 6% 13% 2% 8% 3% 5% 4% 4% 7% 3%

ASEAN Business Outlook Survey 2015 55
Country ASEAN Brunei Cambodia Indonesia Laos Malaysia Myanmar Philippines Singapore Thailand Vietnam
Percentage of ASEAN Turnover Represented in Response Location
Less than 5% 21% 63% 14% 19% 23% 22% 44% 25% 18% 12% 30%
5% to <25% 33% 19% 27% 45% 15% 35% 23% 39% 30% 31% 42%
25% to <50% 17% 6% 0% 19% 15% 27% 18% 10% 16% 21% 17%
50% to <75% 8% 6% 0% 10% 8% 8% 5% 4% 11% 11% 3%
75% to <100% 9% 0% 23% 2% 8% 5% 5% 10% 11% 12% 3%
100% 12% 6% 36% 5% 31% 3% 5% 12% 14% 13% 7%
Length of Company’s Time in ASEAN
Less than 2 yrs 3% 6% 5% 0% 0% 2% 23% 2% 4% 2% 0%
2 yrs to <5 yrs 6% 0% 0% 2% 15% 8% 5% 2% 9% 2% 8%
5 yrs to <10 yrs 14% 12% 27% 0% 39% 13% 14% 18% 14% 7% 26%
10 yrs to <20 yrs 26% 19% 41% 14% 23% 32% 14% 35% 22% 30% 23%
20 yrs or longer 50% 63% 14% 83% 23% 45% 41% 41% 49% 59% 43%
Sample Size A list of AmCham members from U.S. companies with email contacts was provided by each American Chamber of Commerce or chapter:
• Cambodia: List of 184 members, response rate was 12% (22)• Indonesia: List of 151 members, response rate was 28% (42)• Malaysia: List of 432 members, response rate was 14% (60)• Myanmar: List of 101 members, response rate was 22% (22)• Laos: List of 39 members, response rate was 33% (13)• Philippines: List of 225 members, response rate was 22% (49)• Singapore: List of 1096 members, response rate was 15% (166)• Thailand: List of 537 members, response rate was 23% (121)• Vietnam: List of 257 members, response rate was 30% (77)
A list of business executives contacted with the help of the U.S. Embassy in the response location:
• Brunei: List of 58 executives, response rate was 28% (16)
Overall: List of 3080 members & executives, response rate was 19% (588)
Data Collection Method Web-based, self-administered survey. No enforcement on participation.
Data Collection Period May 5, 2014 to June 5, 2014
Note: Throughout the report, percentages on graphs may not add to 100% due to respondents selecting multiple answers, respondents selecting “not sure,” or incomplete entries in the data set.
SURVEY METHODOLOGY

ASEAN Business Outlook Survey 201556
ACKNOWLEDGMENTS
This report was compiled and published by the American Chamber of Commerce in Singapore and the U.S. Chamber of Commerce.
Editor-In-Chief:Thomas H. McNutt, Head of Government & Public Affairs, AmCham Singapore
Editors:John Goyer, Senior Director for Southeast Asia, U.S. Chamber of Commerce Jordyn Arndt, Director of Research, AmCham SingaporeClarissa Wong, Communications & Public Affairs Executive, AmCham Singapore
Drafting and Statistical Analysis:Phillip (Changhee) Lee, Government Relations Intern, AmCham Singapore
Statistical Editors:Hamzah Ahmed, Government Relations Intern, AmCham Singapore Stephanie Siow, Government Relations Intern, AmCham SingaporeDerek Yu, Government Relations Intern, AmCham Singapore
We would like to thank Bretton G. Sciaroni, Chairman of the American Cambodian Business Council and the Executive Directors of the following AmChams in the region for their expertise and support:
• Sarah Howe, The American Chamber of Commerce in Indonesia
• Anne Marie Brooks, The American Malaysian Chamber of Commerce
• Ebb Hinchliffe, The American Chamber of Commerce of the Philippines
• Judy Benn, The American Chamber of Commerce in Thailand
• Herb Cochran, The American Chamber of Commerce in Vietnam (Ho Chi Minh City)
For more information on the survey, visit www.amcham.org.sg/aseanoutlook/.
This document contains proprietary research, copyrighted materials, and literary property of The American Chamber of Commerce in Singapore, the U.S. Chamber of Commerce, and the AmChams listed above. It is for the guidance of your company only, and is not to be copied, quoted, published, or divulged to others outside of your organization without the permission of The American Chamber of Commerce in Singapore, the U.S. Chamber of Commerce, and the AmChams listed above.
This document is of great value to The American Chamber of Commerce in Singapore, the U.S. Chamber of Commerce, and the AmChams listed above. Accordingly, international and domestic laws and penalties guaranteeing patent, copyright, trademark, and trade secret protection secure the ideas, concepts, and recommendations related within this document.
No changes may be made to this document without the permission of The American Chamber of Commerce in Singapore, the U.S. Chamber of Commerce, and the AmChams listed above.
Naili Printing Industry MCI (P) 194/07/2014
COPYRIGHT STANDARDS
PRINTER
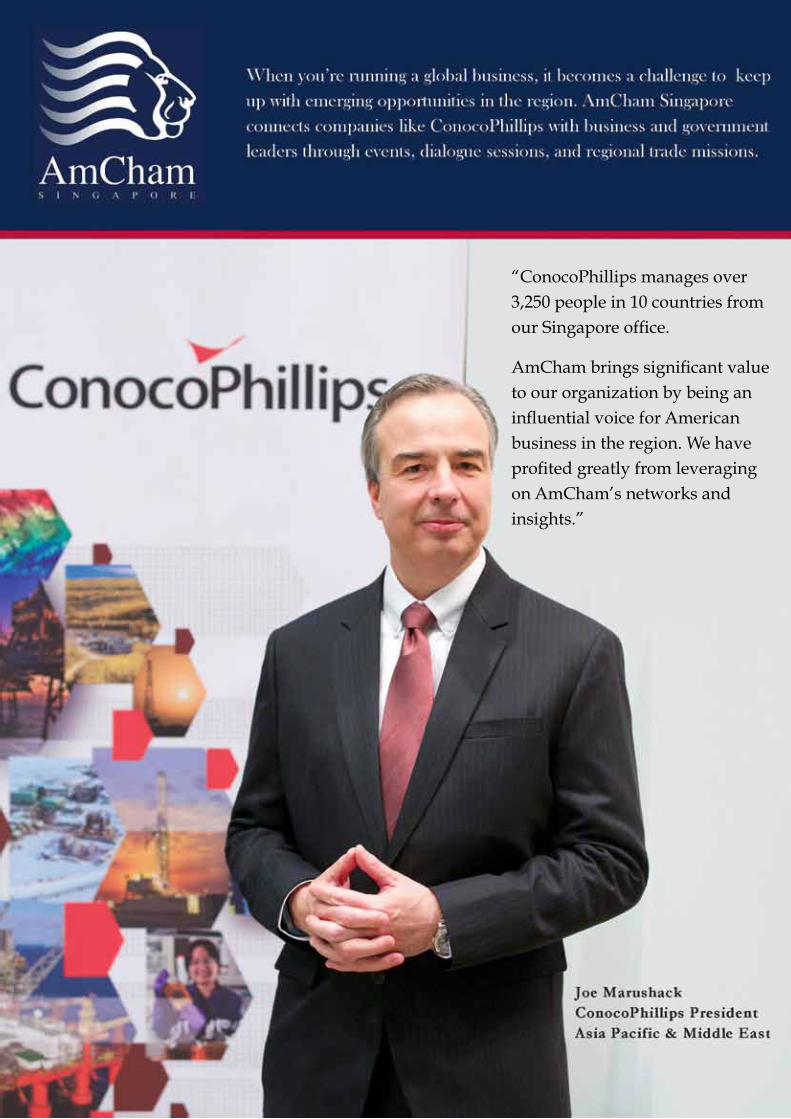
“ConocoPhillips manages over3,250 people in 10 countries fromour Singapore office.
AmCham brings significant valueto our organization by being aninfluential voice for Americanbusiness in the region. We have profited greatly from leveragingon AmCham’s networks andinsights.”
Our unique Global Mentor Program equips students
Global leaders in business, science, social
enterprise and the Arts invigorate and develop
Stamford students with the skills, mindset and
ambition they require. Sir James Alexander Mirrlees –
1996 Nobel Memorial Prize in Economic Sciences
– will speak with and inspire our students this Fall.
We are ready and waiting to meet your
future Nobel Prize winner.
Please introduce us.
Stamford American is proud
to announce our
Global Mentor Program.
Future Nobel Laureates RequiredAges 2-18
Register to Visit Stamford at www.sais.edu.sg
Stamford American International School CPE Registration Number: 200823594D Period of Registration: August 10, 2010 to August 9, 2014
education for students from 2 to 18 years.
enhanced by American standards and
a focus on languages – to equip your
child for global citizenship.
2015In cooperatIon wIth:
ASEAN BuSiNESSOutlOOk SurvEy
Top Related
Copyright © 2022 FDOKUMEN

