


Bahasa
Halaman
Hukum


Mathematics 2022, 10, 860. https://doi.org/10.3390/math10060860 www.mdpi.com/journal/mathematics
Article
Econophysics Techniques and Their Applications
on the Stock Market
Florin Turcaș 1, Florin Cornel Dumiter 2,* and Marius Boiță 2
1 ANEVAR, 011158 Bucharest, Romania; [email protected] 2 Economics and Technical Department, “Vasile Goldiș” Western University of Arad, 310025 Arad, Romania;
[email protected]; [email protected]
* Correspondence: [email protected]
Abstract: Exact sciences have achieved many results, validated in practice. Although their
application in economics is difficult due to the human factor involved, the lack of conservation laws,
and experimental difficulties, it must be highlighted that the consistent bibliography gathered in
recent years in this field encourages the econophysics approach. The objective of this article is to
validate and/or define a few stock strategies, based on known results from mathematics, physics,
and chemistry. The scope of this research demonstrates that statistics (in portfolio theory), geometry
(in technical analysis), or financial mathematics can be used in the capital market. Many of the exact
science results corresponded to strategies applicable to investors. Unlike the material world,
financial markets have additional components that must be considered: human psychology,
sociology at the firm level, and behavioral unpredictability. The findings obtained in this research
enable the enormous vastness of the exact science results that can be a fertile source for new
investment strategies. This article concludes that in order for mathematical theories to be applied to
the stock market, it is essential that the start-up conditions (initial assumptions) are validated in the
market.
Keywords: econophysics; interdisciplinarity; technological strategies; sustainable development;
technical analysis
MSC: 91B80; 46N10; 62P20; 97M40
1. Introduction
“Econophysics represents the ultimate connection between mathematics, physics,
engineering, and economics [1]”.
There are three fundamental differences between natural sciences and economic ones
(with this research mostly analyzing the stock differences).
The first difference is that natural sciences are objective, while economic laws must
consider the subjective side, namely, the human factor. The laws of physics, chemistry, or
mathematics apply universally, regardless of the will of the observer. In quantum
mechanics, it is recognized that some observations influence the results, but not by our
will. In economics, and particularly stock markets, participants’ attitudes are decisive for
the evolution of quotations. Herd behavior, exuberance, panic, confidence,—or the lack
thereof—are drivers, especially in key moments of the stock market development.
Moreover, if scientific observations are quantifiable phenomena, social, behavioral, and
psychological effects are more difficult to express in equations.
The second difference concerns the experimental aspect. In the natural sciences, it is
customary to formulate a hypothesis, which practical experiments then confirm, improve,
or reject. There are also exact science situations where experiments cannot be performed
as the theoreticians would like, e.g., cosmology, anthropology, and geology. However,
the primary theories on which they are based are experimentally verifiable. Science cannot
Citation: Turcas, F.; Dumiter, F.C.;
Boita, M. Econophysics Techniques
and Their Applications on the Stock
Market. Mathematics 2022, 10, 860.
https://doi.org/10.3390/math
10060860
Academic Editors: Gheorghe Săvoiu
and Zhiping Chen
Received: 31 January 2022
Accepted: 4 March 2022
Published: 8 March 2022
Publisher’s Note: MDPI stays
neutral with regard to jurisdictional
claims in published maps and
institutional affiliations.
Copyright: © 2022 by the authors.
Licensee MDPI, Basel, Switzerland.
This article is an open access article
distributed under the terms and
conditions of the Creative Commons
Attribution (CC BY) license
(https://creativecommons.org/license
s/by/4.0/).

Mathematics 2022, 10, 860 2 of 25
experiment on the stock markets. Namely, it cannot separate the facts to demonstrate
precisely that a certain theory is valid. Reverse head and shoulders have no scientific
explanation, with the most plausible being that it is self-confirming: when analysts call it,
most investors become cautious, which automatically leads to a trend shift. We do not
know how to define the expression “there is a 70% chance for the market to grow”. We do
not have 100 cases to count the 70 favorable. The psychological approach “up to what
odds do you bet on growth?” cannot be applied, because it depends essentially on the
amount invested and the attitude of the investor towards risk, much more than on the
opinion of market evolution. It cannot be checked whether the positive growth of a
portfolio is due to the theory applied in the selection of securities or due to the evolution
of the securities (market) itself.
The third difference relates to the basic laws of the theories. In physics, the basics are
the conservation laws: energy, impulse, kinetic momentum, electrical charge, symmetry,
etc. There is also an exception: the second law of thermodynamics, which states that
entropy always increases. In the economy, nothing is constant. In addition to the
continuous growth trend in the overall markets (due to technological development,
expansion into new geographic areas, etc.), no monetary amount is constant, regardless
of the economic area considered. Portfolio values are not constant, and this is the main
reason stocks are bought and sold. The only null result is on the futures market, where
the loss of a part is wholly found in the win of its counterpart. A lack of conservation laws
makes it difficult to formulate theories, including extreme (minimum, maximum) and
optimal trajectory issues.
However, the results of the exact sciences are to be found in economics. Statistics are
the basic method of modeling economic phenomena. On the stock market, it is noted that
many theoretical results start from Gaussian statistics, although statistical data does not
confirm this distribution.
The Black–Scholes–Merton (BSM) model for evaluating options is another example
of mathematical theory (derived from fluid flow physics) applied in the economy.
It is appreciated that the results obtained by exact sciences such as mathematics,
physics, and chemistry can be adapted and applied in the economy, and especially in the
stock market.
The main objective of this paper is to tackle the application of econophysics in the
stock market area, both on the international level and at the Romanian level. In this study,
the most important features that influence the impact of econophysics upon the stock
market are the following: the weather phenomenon; the magnitude of earthquakes; the
complexity of the poker game; the structure, implication, and application of the Le
Chatelier principle; and important features such as random walks and dynamic
phenomena.
In this paper, we have explored a wide range of known theories that started from the
natural sciences, we have resolved their basic rationale, and verified their application in
the stock market. In contrast to the immutable laws of nature, in cases where it is analyzed,
social phenomena (especially the financial ones) appear as events related to the human
participant’s subjectivity. The article did not explore the psychological aspect but only the
application of the objective laws to economic activities. The general conclusion is that
although derived from different knowledge areas and using different methods and
approaches, natural and stock market phenomena share the same common basis:
precision areas and different time correlation, a general legitimacy right in seemingly
chaotic environments, and periodicities. The data analyzed in this article refers, in general,
to stock quotes. The quotes and their history have been accessed from several public
websites. The technical analysis has been conducted by several specialized software that
are freely available, especially Windows Excel.
Regarding the methodology, it can be emphasized that each of the exposed
phenomena had been presented in correlation to their stock market interpretation. The
testing process was an immediate one: at any point, the conditions draw near to those of

Mathematics 2022, 10, 860 3 of 25
the examples enriched in this paper in order to determine whether the suggested theory
can be verified or not. The investment strategies must be subject to other study materials
of a larger scale.
The structure of this paper is as follows: Section 2 highlights the current state of the
art, presenting the theoretical and empirical background for using econophysics related to
stock markets. Section 3 represents the core of the paper, which tackles some important
features related to econophysics applied to the stock market, namely, the weather,
earthquakes, poker, Le Chatelier principle, random walks, dynamic phenomena, and
financial betting. Section 4 presents the conclusions and remarks regarding the main
findings of the empirical research related to the application of econophysics to stock
markets.
2. Literature Review
Fractal theory was the first technique related to the application of econophysics on
the stock market. The pioneering work (Peters, 1994) [2] was continued by Mandelbrot
with the development of an approach capable of explaining market deviations from
Gaussian statistics and accrediting the fractal character of the markets through Hurst’s
exponent. The results are not universally appreciated, although fractal structures can be
identified on the charts of titles’ evolution as the results show in Figure 1. Another highly
important work focuses on the application of thermodynamics in the economy (Sergeev,
2008) [3]. However, the principles of thermodynamics start from the conservation of
energy, but the amount of money in the economy (with which energy is assimilated) is
not preserved.
Figure 1. Fractal structures empirically found on the DJIA course. Source: Authors’ processing is
based on data available on Incredible Charts Pro.
McCauley investigated the lack of a real balance in financial markets in 2004 [4]. It
was intended to explain the real market movement, in contradiction of current theories,
which starts from the premise of how the market should evolve in order to fill certain
mathematical theories. Richmond, Mimkes, and Hutzler (2013) applied more complex
mathematical theories in the economy [5]. A Romanian group of authors made a

Mathematics 2022, 10, 860 4 of 25
compendium on econophysics, edited in 2013 under the direction of Gheorghe Săvoiu [6].
It synthesizes results from various economic and mathematical domains.
Other interesting works in this field include Chakrabarti et al. (2006) [7], Cockshott
et al. (2009) [8], and Roehner (2002) [9]. Preiss (2011) [10] tackles the econophysics
phenomenon throughout the analyses between time series and their correlation of a time
series. The author concludes that time series over a short time scale are influenced by
typical behavioral patterns of the financial market’s participants. Liang et al. (2013) [11]
analyze the Chinese stock markets by the impact of their physical properties and conclude
that econophysics has a direct impact upon the Chinese stock market based on a large
amount of economic data over a long-run time horizon.
Chakrabarti et al. (2011) [12] highlight the econophysics domain within the agent-
based models, concluding that there are three important models which must be taken into
account: an agent-based model of order-driven markets, kinetic theory models, and game
theory models. Other interesting studies developed by Vasconcelos (2004) [13], Choi
(2014) [14], Forte (2017) [15], and Swingler (2017) [16] analyze the application of agent-
based models within the econophysics framework, suggesting the importance of the
impact of this phenomenon upon stock markets.
Bali (2011) [17], Schafer (2012) [18], and Kakarot-Handtke (2013) [19] developed
various studies about the importance of econophysics applied to stock markets within
several features and characteristics in terms of criticisms and opportunities.
Aamir and Ali Shah (2018) [20] analyze the period between 2001 and 2005 in relation
to the Pakistan and Asian emerging economies co-movements through Phillips–Perron
and Dickey–Fuller tests. The authors conclude that there are several important forces of
integration between the Asian emerging stock market and Pakistan. Other authors test the
sustainability of the stock market using the VIX Index and reveal that the market volatility
influence has a great impact among different stock markets through an important feature
such as diversification (Ruan, 2018) [21].
Nasr et al. (2018) [22] provide a qualitative overview regarding the linkages between
BRICS countries and highlight the heterogeneity in stock market returns based on several
underlying criteria. Their main conclusion is that BRICS countries react differently
regarding the rating changes, depending upon their connections with the global market
variables. The usage of mining techniques in measuring the connections between the
impact of social media and stock market modeling suggests that features such as public
opinions, news articles, and technical analyses can result in significant success (Kollintza-
Kyriakoulia et al., 2018) [23].
Li and Wu (2017) [24] link the stock market performance in relation to firm
manufacturing and the wholesale and retail industry in China, revealing that empirical
results are significant in cases where it used the Fama–French factor model. Drezewski et
al. (2018) [25] establish correlations between sustainable development strategies and bio-
inspired trading strategies and conclude that using the Forex market optimization
algorithms can obtain some important future development strategies. The linkage
between forecasting stock prices and neural approaches can be explained by a hybrid
modeling approach combining analytical and computing models (Paluch and Jackowska-
Strumillo, 2018) [26].
Nguyen and Yuun (2019) [27] suggest a different type of approach using transfer
learning in order to determine the market prediction based upon short-term stock price
and conclude that stock relationship information can be a panacea regarding the
improvement of prediction accuracy. Herzog and Osamah (2019) [28] use a reverse
engineering approach in order to determine option pricing and suggest that their
approach is highly significant in establishing important future research directions. The
impact of portfolio diversification has an effect on domestic and foreign stocks, suggesting
that there is a significant impact of correlation volatilities and risks associated with a
diversified portfolio (Nayan, 2019) [29].

Mathematics 2022, 10, 860 5 of 25
The usage of calendar anomalies upon 11 CEE stock markets reveals that the turn-of-
the-month effect affects only market returns. especially in the short periods established at
the end of one month and the start of a new month (Arendas and Kotlebova, 2019) [30].
The significant positive results of stock market analysis by using a Markov chain to
improve future air quality suggest that this can be an important tool to help governments
insert prevention actions during a difficult weather period (Zakaria et al., 2019) [31]. The
market volatility in the conditions of premiums for sustainable and non-sustainable
components highlights that a hedging strategy is needed in order to provide an important
shield against future uncertainty (Thu Truong and Kim, 2019) [32].
Blackledge et al. (2019) [33] provide interesting and important analyses regarding
important features such as econophysics, fractional calculus, fractal market, and future
price predictions. In this study, the authors conclude that econophysics can be applied to
the stock market by using Einstein’s evolution equation, the fractal market hypothesis,
and the fractional Poisson equation. Other authors used a minimum spanning tree and
cross-correlation coefficient in order to determine the statistical properties of the foreign
exchange market and concluded that the results are not stable in the Asia and Latin
America cluster but are stable in the Middle East cluster (Wang et al., 2013) [34].
The applications of econophysics and bio-medical entropy were revealed by using
permutation entropy to understand biomedical systems and the analysis of economic
markets (Zanin et al., 2012) [35]. Fry and Brint (2017) [36] developed a model to investigate
if there are any linkages between bubbles in opinion polls and betting markets before the
23 June 2016 UK vote to remain or not remain in the EU. The authors concluded that their
research had a significant impact in explaining the reasons for the UK voting to leave the
EU.
Ahmad et al. (2016) [37] used graphical representation to examine stock behavior in
relation to several time series. The authors concluded that a certain causal relationship
between stock returns and volatility can be identified in several important Asian stock
markets. Moreover, Rudzkis and Valkaviciene (2014) [38] developed several underlying
regression models to help identify the global and key macroeconomic indicators and their
impact on stock prices indices. The main findings of this study highlight that in the case
of small open economies, the price indices of individual sectors vary upon several
macroeconomic regressors. Vveinhardt et al. (2016) [39] analyze the Mean Reversion
Phenomenon and reveal several investment opportunities and stock prices returns, but
the results have inconsistencies due to the market’s reactions based on different periods.
Ruxanda and Badea (2014) [40] predict stock market conditions by using artificial
neural networks; this study offers a quid pro quo upon the configuring structure of these
networks upon the Romanian BET index. The aftermath of the neural networks reveals
that the direction of the DAX-30 stock market index can be predicted by using hybrid
fuzzy neural networks (Garcia et al., 2018) [41]. Ahmed et al. (2018) [42] examine the
relationship between stock returns and volatilities and suggest that the evolution of a
developed market differs significantly from emerging markets due to the higher returns
of the emerging stock markets. Janda et al. (2014) [43] enables the construction of a
sustainable financial portfolio throughout a microfinance investment funds scheme and
conclude that investors can be socially responsible by using financial indicators in
microfinance.
Ulusoy et al. (2012) [44] tackled the problem of hierarchical tree and minimal
spanning tree approaches in the period 2006–2010 for top 40 UK companies based on the
London Stock Exchange Index. They concluded that financial market dynamics can be
successfully predicted by using information theory and statistical physics. In the
aftermath, Ulusoy (2017) [45] reveals the importance of using econophysics in the financial
market domain due to the complex natural network function of the stock market.
Garcia and Requena (2019) reviewed some of the newest studies in the economic
literature regarding the fractal market hypothesis and proposed an FD4 exponent model
that can lead to the improvement of empirical results [46].

Mathematics 2022, 10, 860 6 of 25
Summarizing, all of this research, as well as numerous articles (especially those
published on Cornell’s arxiv.org platform, but not limited to them), outline the intense
interest of mathematicians and physicists in applying results in the economy. This paper
contributes to applying the theories of exact science when selecting stock market
strategies.
3. Methodology and Empirical Results
In the empirical study methodology, some examples of theories in the exact sciences
and attempts to translate them into stock market strategies are considered. The results are
listed below. Although not spectacular, practical results urge us to continue our
econophysics approach.
3.1. Weather
The connection between meteorology and the capital market is direct: on the Chicago
Mercantile Exchange, betting can be made on climatic derivatives. Climatological values
that are involved include temperature, rainfall, and snowfall, with the most important,
according to the cmegroup.com official site, being Heating Degree Day (HDD) and
Cooling Degree Day (CDD) contracts. Various strategies have been analyzed (Jewson and
Brix, 2005 [47]; Alexandridis and Zapranis, 2013 [48]).
Arbitrage on this market has direct positive effects for hotel managers, tourism
companies, agricultural producers, and insurers; in return, speculators can make
substantial profits. Figure 2 presents an example of how to apply arbitrage on weather
derivatives. A summer hotel owner (or tourist agency) would like summer to be as sunny
as possible. However, if the weather is cool, the hotel owner (or tourist agency) will lose
customers and profit will be reduced. Therefore, speculators can be bet that high
precipitation will occur, the average temperature will be low, or there will be many windy
days, etc. Conversely, a climatologist (or an environmentalist or a meteorologist) who
knows the effects of global warming will bet exactly the opposite: drought, heat, or
scorching heat. Thus, a situation that does not suit anyone can become a solution where
everyone benefits (a win-win situation): the hotelier secures a normal level of earnings (if
not from customers, then from financial derivatives) and environmentalists take
advantage of their studies on climate change (at least financially, if proposed measures to
limit the effects of the greenhouse effect are still to be seen).
Figure 2. Precision of meteorological predictions. Source: Authors’ processing is based on data
available on http://www.weatheronline.co.uk (accessed on 12 July 2016).
Another feature, namely the precision of the results, was pursued in this paper. The
next graph is the forecast for a week, i.e., the exact situation of surface pressure, according

Mathematics 2022, 10, 860 7 of 25
to http://www.weatheronline.co.uk (accessed on 12 July 2016). Weather predictions are
typically valid for a week. Depression has been established in northern Europe, and its
evolution is predicted with acceptable accuracy. However, in surrounding areas, precision
is lacking; for example, Iceland is at the limit, and there predictions become inaccurate.
The link to the capital market is direct and the resulting conclusion is simple: when
the indicators or the technical oscillators are at a limit, their precision is desirable and the
confidence we show must be limited (increased caution). Figure 3 shows that the RSI
oscillator for the BET index of the Bucharest Stock Exchange is generally an excellent
signal to confirm the trend, where the arrow represents the upward trend. However, in
the maximum area, as it can be seen in the circle part of the figure, it indicates many false
sales signals because it is at the upper limit of its relevance. Therefore, just as weather’s
predictions are good overall but not plausible at the extremes, the oscillators of the
technical analysis work well only in the median range of their variation range. The
conclusion is similar to the engineering results valid for any mechanical measuring device:
the precision is higher in the middle of the measuring scale and lower towards the
extremities.
Figure 3. The precision of technical oscillators. Source: Authors’ processing is based on data
available on https://www.ifbfinwest.ro/complexcharts/index.php?id_lista=1786 (accessed on 12
September 2014).
3.2. Earthquakes
Although they cannot be accurately predicted, earthquakes, especially those in active
seismic areas, have a repeatability that allows an estimation of the likelihood of their
occurrence as it is highlighted in Figure 4. Practically, the accumulated tensions tend to
unravel even more violently as more time passes between two successive earthquakes.
Thus, a good indicator of seismic risk is the period between earthquakes and their
frequency. On the stock exchange, this is focused upon the application of the conclusion
regarding concerning crises (downward periods highlighted with blue line). Visually, it
seems natural to define a crisis, being the portion of the graph on which a more
pronounced decrease occurs (some such drops are outlined empirically with black line in
Figure 5).
Mathematically, the loss period is defined in Excel as the area of the chart where
downgrading happens marked with the blue line, and the crises where the minima have
exceeded a certain threshold set a priori established by the red line. To work directly with

Mathematics 2022, 10, 860 8 of 25
relative variations, we considered the logarithmic values in the 10th quote. By plotting the
logarithmical quotient of the day i, the condition that the area of the graph is one of the
losses is 𝑦𝑖+1 < 𝑦𝑖𝑦𝑖 + 1 < 𝑦𝑖 , and one of the crises is 𝑦𝑚𝑎𝑥 − 𝑦𝑘< p, where 𝑦𝑚𝑎𝑥 is the
maximum value previously reached (historical maximum until k) and p is the discomfort
threshold imposed by the investor. Thus, one can check the buy-and-hold stratagem,
which for an ascending market (such as the American one) should bring reasonable
returns. The results are represented in Figure 6, with the discomfort threshold set at 0.065
(about 16%).
Figure 4. Earthquake magnitude worldwide. Source: Authors’ processing is based on data available
on http://earthquake.usgs.gov/earthquakes/eqarchives/year/info_1990s.php (accessed on 20 July
2017).
Figure 5. Periodically, the stock exchange suffers a significant correction. Source: Authors’
processing in Microsoft Excel is based on data available on http://stooq.com/q/?s=%5Edji (accessed
on 20 July 2017).
Figure 6. The crisis periods are analyzed on the DJIA chart. Source: Authors’ processing is based on
data downloaded from http://stooq.com/site (accessed on 20 July 2017).

Mathematics 2022, 10, 860 9 of 25
For an index that experienced a steady growth throughout the analyzed period, the
results are not encouraging as most of the time the market has not risen, with quotes below
the previous historical highs (the red chart). Moreover, for periods marked with green
rectangles, the decrease from the previous maximum exceeded the discomfort threshold
predefined by the investor. It means that if the investor bought the maximum, the investor
would have to wait for a period equal to the width of the rectangle (quite high, in some
cases) for the investment to go into profit. It has been verified for the entire period between
1900 and June 2016 that the definition of the periods of crisis has a more drastic effect on
the buy-and-hold strategy (Figure 7).
Figure 7. Periods of DJIA decline. Source: Authors’ processing is based on data available
http://stooq.com/ (accessed on 20 July 2017).
One can object that the definition of the crisis is not a standardized one. Some
investors buy on a declining market, so those periods of decline and crisis are not defined
between the same values for all investors. Nor does the Rolling Windows method, applied
in the Matlab program according to Tsinaslanidis and Zapranis, produce better results
(2016) [49] (Figure 8).

Mathematics 2022, 10, 860 10 of 25
Figure 8. Maximum and minimum determined by the Rolling Windows method. Source: Authors’
processing is based on graphics generated in Matlab for 200-, 500-, and 1000-day windows using
data available on http://stooq.com/ (accessed on 20 July 2017).
3.3. Poker
Any Texas Hold’em player knows he usually does not play more than 10–15% of his
hands. The main reason is not having wrong hands, but the patience to know opponents
and to wait for a favorable situation (Purdy, 2005) [50]. The players (speculators) on the
stock exchange seem to forget that although the market has a general trend of growth, not
every moment is conducive to investment. A good measure of the reward/risk ratio is
RAROC (Risk Adjusted Return on Capital), defined as the ratio between the estimated
profit (affected by the associated risk) and the invested capital (Prokopczuk, 2004) [51].
The strategy adopted to the capital market could be synthesized as follows: a
variation limit is set and changes the position only when this limit is reached. Profit is
calculated only when the contract is closed because only then is the result (profit or loss)
marked. In practice, this would mean that the investor retains his position as long as the
opposite variation does not exceed the limit he has a priori imposed. When this limit is
reached, the investor closes his position and immediately opens a contrary one. This
ensures that the investor will not remain in the wrong position relative to the market more
than he initially imposed himself (potential losses are limited).
Applied to DJIA, the strategy would lead to the following results, for a required 9%
variation limit (see Figure 9). Where the DJIA (blue) chart is above the “Entry” (red) chart,
the investor’s position is long. Otherwise, it is short. The results are not spectacular at all,
but they depend on the required limit, so the correlation between the predefined variation
and the realized profit was analyzed. The results presented in Figure 10 and Table 1 do
not encourage the application of the strategy, being very sensitive to small variations of
the arbitrarily imposed limit. The brutal variation of profit, based on relatively minor
variations in the stop-loss safety, confirms the nonlinear character of the linkage, similar
to chaos theory (Mandelbrot, 2004) [52].
The key point is that the strategy does NOT yield good returns, even if an investor is
cautious and decides that in a contrary variation on the market (reasonable, around 10%)
to leave the position and take the opposite position. Therefore, the stop-loss technique is
not unbeatable, having previously shown that neither buy-and-hold strategy was. A
poker player would conclude that it is not the luck of having good cards but the style of
play that is decisive. A stockbroker will conclude that gains cannot be achieved simply by
taking a position and expecting it to materialize in a lasting trend. It is recommended that
the position be taken (abandoned) whenever the market demands it, without waiting for
the opposite movement to reach an arbitrarily imposed limit.

Mathematics 2022, 10, 860 11 of 25
Figure 9. Default Output Limit Exit Strategy. Source: Authors’ processing is based on data available
on http://stooq.com/ (accessed on 20 July 2017).
Figure 10. Profit dependency on the predefined stop-loss limit. Source: Authors’ processing is based
on the results obtained in Figure 9.
Table 1. Nonlinear variation of total profit is based on the pre-imposed stop-loss limit.
Per cent stop-loss 7.0% 8.0% 8.5% 9.0% 9.2% 9.5% 9.7% 10.0% 10.5%
Profit −5941.8 794.1 7476.0 7683.3 8595.2 7370.5 5393.1 3787.7 4440.0
Source: Authors’ processing is based on the results obtained in Figure 9.
3.4. Le Chatelier Principle
The principle of Le Chatelier is thus: “If a dynamic equilibrium is disturbed by changing
the conditions, the position of equilibrium moves to counteract the change.” In the economy,
Samuelson first applied this principle in 1947 to explain the dynamic balance between
supply and demand. In the stock market, the best example of this is the placement of large
volume orders as is presented in Figure 11. In the first instance, the market acts to
counteract the disturbance, i.e., attempts to absorb the large volume of bid/ask shares. If
the investor succeeds, the balance is restored. However, if the perturbation is too strong,
the balance can no longer be maintained at the same level of quotations and the market
shifts to another price level.

Mathematics 2022, 10, 860 12 of 25
Figure 11. Volume divergence. Source: Authors’ processing is based on data available on Incredible
Charts Pro.
This approach contradicts an essential assertion of the technical analysis, according
to which volume confirms the trend (Murphy, 1999) [53]; that is, the volume should be
rising when the trend is bull and descending when the trend is bear. The DJIA graph,
drawn with the Incredible Charts Pro program, shows that volume does not oscillate as
Murphy predicted. Volume has grown steadily in the 2000s, then increased dramatically
with the 2007–2009 crisis, so that with the rebound of markets its fall will be even more
pronounced. This evolution can be explained by both the Le Chatelier principle and the
herd spirit, which manifests itself mainly in times of crisis and exuberance.
3.5. Random Walk
A photon that leaves the center of the sun reaches us 100,000–1,000,000 years after it
hits a lot of nuclei in space. We considered the series of DJIA quotations from 2 January
1900 to 24 June 2016. We logged the series and considered daily variations (returns).
Statistically, the mean of the logarithmic differences is 0.00007958 and the standard
deviation of the entire population is 0.00483597. With these parameters, we generated a
similar number (30,248) of random numbers, using the normal probability distribution,
with the same defining parameters (the previously calculated average and dispersion) in
Windows Excel (Random Number Generation). These were considered daily variations
of hypothetical logarithmic series, called Random, which were then reconstituted and
represented on the same graph as the initial DJIA series as is highlithened in Figure 12.
In Figure 12, the results highlight that randomly generated series behave similarly to
actual quotes, showing more or less steep trends, rises, and decreases. Each generation
produces different results, but all have the same characteristics. For securities with a
higher volatility history (SIF1) as it is shown in Figure 13, the situation is different: the
randomly generated series exhibits reasonable deviations from the trend, as opposed to
the actual quote whose fluctuations are far beyond the limits required by the Gaussian
distribution.

Mathematics 2022, 10, 860 13 of 25
Figure 12. DJIA compared to randomly generated series. Source: Authors’ processing is based on
data available on http://stooq.com/ (accessed on 20 July 2017).
Figure 13. SIF1 chart, compared with randomly generated titles. Source: Authors’ processing is
based on data available on www.bvb.ro (accessed on 10 December 2018).
3.6. Dynamic Phenomena
The foundations of catastrophe theory were discovered when it was found that the
evolution of dynamic (nonlinear) systems mainly depends on the initial conditions: a
small deviation could produce results that differ exponentially.
Many areas of physics recognize chaos theory:
• The gravity problem with three bodies;
• The double pendulum;
• The strange attractors;
• Jerk circuit in electronics, etc.
The capital market is a dynamic system, so we expect the Butterfly effect (The flap of
a butterfly’s wings in Brazil set off a tornado in Texas) to apply in practice. Indeed, the initial
conditions accepted for the selection of securities in a portfolio may influence the
investment decision.
Suppose an investor decided on the composition of a portfolio formed from three
titles: SIF1, BRD, and SNP. Based on an analysis of the period 2001–2017, it is evident that
starting from the same point, SIF1 keeps on top of all the other titles, being the most
attractive. If the analyzed period is restricted to 2005–2017, BRD is the best title, and if we
started in 2008, SNP has the best evolution. In the analysis based on the latest period (since
2013), SNP should have been avoided altogether.

Mathematics 2022, 10, 860 14 of 25
The contradiction reached is a paradox, not an error of reasoning. In all analyses
presented in Figure 14, namely (a–d), the graphs started from the same starting point, but
the result and the evolution were different. Thus, the conclusions, all of which are correct,
of four analysts can differ radically, only because the analyzed period is different. No one
is wrong, but no one has the absolute truth either. Nevertheless, this is also the charm of
technical analysis, which is the combination of exact mathematical results and the art of
interpreting them, the analyst’s reasoning, and experience.
(a)
(b)
(c)
(d)

Mathematics 2022, 10, 860 15 of 25
Figure 14. (a–d): Importance of selection of the initial point. Source: Authors’ processing is based on
data available on www.bvb.ro (accessed on 12 February 2018).
3.7. Size Matters
Different behavior produces a physical reality within different scales. Thereby, at the
minimum scale dimensions (on a subatomic scale), strong forces are prevailing (the
connection between quarks). At the atomic level, electromagnetic forces are occurring
which govern the connection of atoms. At the cosmic level, the gravitational force becomes
the most crucial feature, determining the galaxies and solar systems’ evolutions. A similar
conclusion is observed throughout the analysis of the different types of graphical
correlation. In the next example, the Dow Jones index and the gold quotation on the
American market were analyzed according to the Intermarket theory (Murphy). Thus,
these two features must be inversely correlated.
The conclusions differ according to the analyzed period. In Figure 15a, it can be
observed that the two titles are uncorrelated. Beyond a relative increase of both titles, there
are periods in which both graphs have similar variation and other periods in which the
titles vary in opposition, but also other sections in which one is on bearing and the other
has a trend. In this case, the conclusion is that the two titles are uncorrelated. In Figure
15b (drawn on different periods), the graphics are inversely correlated: when one is
decreasing, the other is increasing and vice versa. Finally, in Figure 15c, the graphics are
positively correlated, with both titles simultaneously having the same evolution variation.
In this situation, the results represent a shortcoming of the technical analysis.
Depending on the historical period selection, a technical analyst can graphically
demonstrate the direct correlation, the inverse correlation, or the absence nexus for the
two selected titles. The explanations have both economic and behavioral foundations.
Gold is a limited natural resource. The DJIA stocks are conventional entities theoretically
unlimited, as much as the global production has an increasing trend. Gold cannot
infinitely increase; the stocks are not unlimited, either as number or value. Therefore, in
the long run, the two titles cannot be correlated.
In the short run, if the stock market keeps good time, investors will prefer stocks. In
a case where there are crises signals, investors will flee from gold (which is a defensive
action). According to this view, it can be explained by the inverse correlation. In the
medium run, if the economy registers a soundtrack and there are no danger signs,
investors can diversify their portfolio and will invest in both stock and in gold, especially
if government securities cannot offer an attractive interest rate. Thereby, in periods of
moderate economic growth and economic calm, the two titles can register a direct
correlation.

Mathematics 2022, 10, 860 16 of 25
(a)
(b)
(c)

Mathematics 2022, 10, 860 17 of 25
Figure 15. (a–c): Graphical comparison between titles evolution of different periods. Source:
Authors’ processing is based on data available on Incredible Charts Pro.
3.8. Financial Betting
Even if it seems attractive, there are no financial bets similar to the ones mentioned.
At most, there is financial betting which proposes odds below 50%, if the quotation will
increase or decrease in the next period as is presented in Figure 16.
Figure 16. Explanatory screen binary bet. Source: Authors’ processing is based on data available on
binary.com (accessed on 17 September 2020).
Hedging (arbitrage) is the main barrier to revealing realistic forecasts regarding the
evolution of prices. Hedging supposes the sale (at a higher price) and the purchase (at a
lower price), simultaneously, on two markets, of one and the same title (or a derivative,
directly connected with the basic one). Because the two courses will be mathematically
equal at maturity, the speculator wins the difference regardless of the closing price.
Therefore, whatever the experts’ forecasts regarding the market evolution, the spot course
and futures course may not differ too much (at most with the risk-free interest and the
costs of the operations, or due to the current variations as a consequence of the inertia of
the markets).

Mathematics 2022, 10, 860 18 of 25
The advantage of the financial bets is that the opportunity of hedging does not exist,
therefore, the quotations can be as realistic as possible.
However, the following problem arises: what happens if the real probability, p’i,
known by the gamblers is different to the one calculated by the bookmaker, pi? In a simple
case in which we have two betting options (1 and 2) presented in Figure 16, an elementary
algebraic calculation shows that the maximum potential gain is reached if the available
amount is played in full on the bet that has a higher chance of realization than those listed
(p’i-pi = max).
However, according to Table 2, it can be noted that the potential loss of the gambler
also increases (if the bet does not succeed, the entire invested amount will be lost), but the
probability of failure is smaller.
Table 2. Spot-bet hedging does not bring profit to speculators.
Current price 10.00 Ron/share
Initial investment 200.00 Ron
Number of shares 20.00 Shares
Expected price 9.50 10.00 11.00 Ron/share
Chance 70% 10% 20% 100%
Bet odds 1.43 10.00 5.00
Weighted result without hedging −10.00 0.00 20.00 Ron
−3.00 Ron
Hedging investment 200.00 Ron
Weighted result with hedging 75.71 −200.00 −180.00 Ron
−3.00 Ron
Source: Authors’ own processing.
A little more complicated is the situation in which more variants of betting exist and
the gamblers appreciate quotations differently than the brokers as is revealed by Table 3
and Table 4. As in the case with two betting variants, the entire investment must be
allocated where the actual probabilities are greater than the reversed quotations. An
algebraic calculation reveals, in the case of two increases in the gambler’s probabilities
compared to those of the broker, p’1 > p1 and p’2 > p2, that the entire amount should be
invested when the ratio between growth and the broker’s quotation, p′i−pi
pi, is a maximum.
Table 3. The gain of the gambler appreciates the chances more accurately than the broker.
Variant Betting House Gambler Gain
Probability Odds Probability Bet Absolut Revised
1 40% 2.50 30% 0.00 −1.00 −0.30
2 60% 1.67 70% 1.00 0.67 0.47
TOTAL 100% 1.00 100% 1.00 0.17
Source: Authors’ own processing.
Table 4. How to invest if the broker’s quotation is considered wrong.
Variants Betting House Gambler Gain
Probability Odds Probability Bet Absolut Revised
1 25% 4.00 30% 1.00 3.00 0.90
2 35% 2.86 40% 0.00 −1.00 −0.40
3 40% 2.50 30% 0.00 −1.00 −0.30
TOTAL 100% 1.00 100% 1.00 0.20
Source: Authors’ own processing.
Mathematics 2022, 10, 860 19 of 25
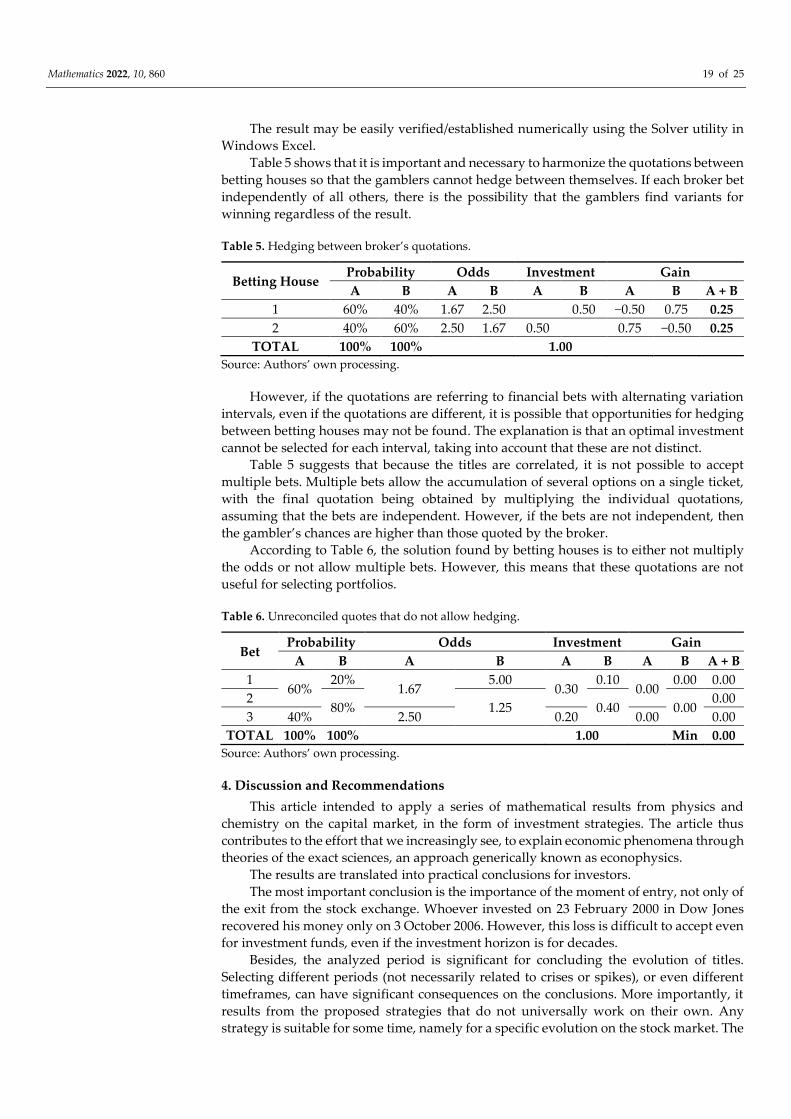
The result may be easily verified/established numerically using the Solver utility in
Windows Excel.
Table 5 shows that it is important and necessary to harmonize the quotations between
betting houses so that the gamblers cannot hedge between themselves. If each broker bet
independently of all others, there is the possibility that the gamblers find variants for
winning regardless of the result.
Table 5. Hedging between broker’s quotations.
Betting House Probability Odds Investment Gain
A B A B A B A B A + B
1 60% 40% 1.67 2.50 0.50 −0.50 0.75 0.25
2 40% 60% 2.50 1.67 0.50 0.75 −0.50 0.25
TOTAL 100% 100% 1.00
Source: Authors’ own processing.
However, if the quotations are referring to financial bets with alternating variation
intervals, even if the quotations are different, it is possible that opportunities for hedging
between betting houses may not be found. The explanation is that an optimal investment
cannot be selected for each interval, taking into account that these are not distinct.
Table 5 suggests that because the titles are correlated, it is not possible to accept
multiple bets. Multiple bets allow the accumulation of several options on a single ticket,
with the final quotation being obtained by multiplying the individual quotations,
assuming that the bets are independent. However, if the bets are not independent, then
the gambler’s chances are higher than those quoted by the broker.
According to Table 6, the solution found by betting houses is to either not multiply
the odds or not allow multiple bets. However, this means that these quotations are not
useful for selecting portfolios.
Table 6. Unreconciled quotes that do not allow hedging.
Bet Probability Odds Investment Gain
A B A B A B A B A + B
1 60%
20% 1.67
5.00 0.30
0.10 0.00
0.00 0.00
2 80% 1.25 0.40 0.00
0.00
3 40% 2.50 0.20 0.00 0.00
TOTAL 100% 100% 1.00 Min 0.00
Source: Authors’ own processing.
4. Discussion and Recommendations
This article intended to apply a series of mathematical results from physics and
chemistry on the capital market, in the form of investment strategies. The article thus
contributes to the effort that we increasingly see, to explain economic phenomena through
theories of the exact sciences, an approach generically known as econophysics.
The results are translated into practical conclusions for investors.
The most important conclusion is the importance of the moment of entry, not only of
the exit from the stock exchange. Whoever invested on 23 February 2000 in Dow Jones
recovered his money only on 3 October 2006. However, this loss is difficult to accept even
for investment funds, even if the investment horizon is for decades.
Besides, the analyzed period is significant for concluding the evolution of titles.
Selecting different periods (not necessarily related to crises or spikes), or even different
timeframes, can have significant consequences on the conclusions. More importantly, it
results from the proposed strategies that do not universally work on their own. Any
strategy is suitable for some time, namely for a specific evolution on the stock market. The

Mathematics 2022, 10, 860 20 of 25
investor should continually analyze the applicability of the theory and the market trend,
to decide when to apply a specific strategy and when to leave the market.
From a theoretical point of view, in this study, it has been worthwhile trying to apply
mathematical (physical) theories, with a large number of participants, diversity of
concepts, and multitude of factors of influence often causing the market to behave as a
complex physical system. The main issues are the adequacy of theory to market reality
(for example, Gaussian statistics are not appropriate, so most statistical conclusions—
including VaR—do not apply in practice), the absence of conservation laws (as a basis for
mathematical physics), and the difficulty of quantifying the influence of the human factor.
The study directions opened by econophysics are broad; practically, any theory in the
exact sciences can have a correspondent in the economy, with the art being in adapting
them to reflect the realities of the market. This article also proposes a practical side: the
establishment of strategies based on mathematical theories. Although the conclusion is
that the application is not direct and purely objective, the subjective side of the investment
process can be greatly reduced and improved.
Regarding recommendations for future research, the following suggestions should
be emphasized. In the first place, on what should be focused the forecast of future
quotations and related probabilities? On technical analysis, of course. The fact that the
market is moving in (Murphy, 1999) [53] is a truth that has been repeatedly demonstrated.
Nor should the fundamental analysis be omitted, given that the issuers tend to have
quotations that bring indicators to the values close to those of the market (Rossi and Forte,
2016) [54]. For those who use automated trading or a computerized selection of titles,
statistical analysis and game theory are essential. Taking into account that there are
millions of sites and even books (Pesavento, 2015) [55] that recommend esoteric methods,
behavioral analysis should not be neglected.
However, the approaches using different reasoning can lead to different results. An
eloquent example presented in Figure 17 is represented by a series of bets which, although
they refer to the same final result (0–0), because they start from different premises, lead to
unequal probabilities.
The question is whether it is a big mistake if it is determined that the probabilities for
investment decisions do not strictly respect the principles of No Dutch Book. Does it seem
to be wrong to quote 50% long chances and 51% short chances (probabilities coming from
different reasoning)? However, these probabilities are not meant for betting, but only for
your own investment decision. In addition, these situations are not totally wrong: after
all, the mathematical probability is defined as limN→∞
n
N, where n is the number of favorable
cases divided by the total number of cases N. Mathematically, the condition of
complementarity must be respected only at infinity. It is as equally likely that the next roll
of a coin will be Heads or Tails. However, it is very likely that after six rolls, consecutive
series of similar results appear. To what probability should it be given priority?
Figure 17. Different odds for the same bet. Source: Authors’ processing is based on data available
on unibet.ro (accessed on 20 February 2020).

Mathematics 2022, 10, 860 21 of 25
It can be noticed that even more interesting is the fact that the stock exchange is being
manipulated. It runs large investors, large arbitrators, speculators, brokerage houses,
high-speed automated trading systems, ordinary citizens persuaded by telephone to
“invest”, etc. Consciously or not, hostile or not, every transaction is a manipulation of the
price. The buyer wants to acquire a price as low as possible, to the detriment of the seller.
In addition, the buyer does this to then sell more expensively when he thinks the price
will decrease. It is not illegal, immoral, or unfair. Simply, the market is made up of actors
who try to use randomness in their favor.
This observation could change the basic perspective of probabilities. The ideal toss of
a coin or the perfect throw of a dice has been scientifically studied. However, what if the
producer confessed to cheating the coin? Unfortunately, the person died before specifying
in which way and how large the asymmetry is. Specific devices that make a non-
destructive analysis and lead us to a deterministic result cannot be identified. However,
if the records of the last 100 throws exist, can the probability of the 101st throw be
estimated? In theory, it is 50–50%, although it is known that this is not right, but it is not
known how wrong it is. Or 52–48% in favor of the first throws, although it is known that
100 throws are not statistically relevant (they do not meet the Law of Large Numbers or
the central limit theorem)?
Applied on the stock exchange, the observation gives rise to further reasoning. It
cannot be precisely determined if the coin is ideal or fake. It can be identified that there
are 55–45 H–T cases after 100 throws. In what hypothesis can be established the
probability of 101 attempts? If one number is drawn more frequently than another in the
lottery, is it reasonable to assume that the balls were not manufactured perfectly equal?
Returning to the subject of the problem: if it is noticed that a certain phenomenon related
to an issuer, can it be believed (is there an associated logic?) or not? Do fractals have a say
here?
Another problem would be the adjustment, via the application of Bayesian models
to re-evaluate the probabilities based on events that have already occurred (Grover, 2013)
[56]. Here, however, a problem can already be identified (Tijms, 2019) [57]: an initial
intuited probability of 20% (prior probability) leads to a deduced probability (posterior
probability) of 52.2%, while an initial probability of 50% leads to a final one of 81.4%, with
a chance factor (likelihood factor) of 35/8. In this example, the psychological (subjective)
effect of mistrust is amplified if a practical result is negative, which is neither logical nor
beneficial.
5. Conclusions
The main conclusion of the article is that all possible knowledge from other areas
(mathematics, physics, chemistry, sociology, and psychology) should be used to shape the
capital market. Current economic assumptions are:
• Investors act rationally;
• Profit must be maximized (the worst strategy is to try and sell at the highest and buy
at the lowest price);
• Rational report between economy and consumption;
• Static equilibrium theories;
They are not applicable to financial markets.
It is likely that financial markets are the most complex scientific phenomenon
possible, because of acts that are objective, natural laws (statistical laws, economic and
financial realities, and automated trading programs), and random opinions and impulsive
actions from a multitude of investors and speculators, with the most diverse professional
qualifications, perceptions, styles, and possible conceptions.
Comments were received during the presentation of the paper at different
conferences that neural networks and cyberlearning systems are the solution to market
success. Undeniably, they have practical applicability, as long as automated systems make

Mathematics 2022, 10, 860 22 of 25
most of the transactions, with the majority of them working in the feedback loop
(learning). Their deficiency is that they use past situations to make decisions; this is where
the tsunami example came in.
Another example is added to this study. The creators of the AlphaGo (Netflix Reportage:
AlphaGo) program succeeded in defeating the Go world champion, Lee Sodol, 4–1. Go is
a game that is suitable for modern cyber systems because the analysis of 50 moves forward
gives a clear advantage to the computer. Furthermore, the algorithm is the learning one:
thousands of games were introduced into the memory of the computer and it was
programmed to conclude its preparatory games. In this sense, it is not a thought process
but a data processing one. In the only game he won, Lee Sedol made an unexpected move.
It is not known whether it was a good or bad one, but the computer was confused and lost
lamentably, making incredible mistakes. Is it still necessary to compare the crisis when
people simply lose their heads?
The conclusions of this study reveal that the best evidence that the stock market
mechanism had been understood would come if a bookmaker would open quotas for an
average period: not one day, because it would be a lottery; not one year, because it has to
react to market movements. Do not let speculators bet these odds because it would only
be another venue for derivatives. Odds should be established by the professional house,
which has sufficient interest to be fair: without excessive regulations and supervision,
with only the usual precautions in the industry, and with slight chances of arbitrage.
Based on what will the bookmaker act?
• On probabilities, of course. Nevertheless, they are limited: they operate on a
subatomic level (quantum mechanics) or molecular (gas theory), where an
astronomical number of physical events need to be processed statistically. On the
capital market, the best evidence of non-adaptation is that VaR did not work in crisis:
simply, the decreases exceeded the statistical threshold.
• On the technical analysis, obviously. Strong trends beat everything, so they cannot
be overlooked. However, this is again limited. When trying to obtain results only
from the study of graphs, my colleagues received an unpleasant surprise.
• Financial (fundamental) analyses are mandatory. Quotations shall take account of
the results of issuers, but in a manner that is neither linear nor immediate and
sometimes irrelevant.
• On other considerations, yes. Market sentiment (measured by established indices:
SWFX, Sentix, SSI, ISE), macroeconomic trends, and the behavioral study of the
relevant market can all provide valuable information, even if they are very hard to
quantify numerically.
• Would corrections be necessary? Of course: feedback loops, machine learning, and
Bayes.
• Besides, it is considered that the market stage can be determinant (it cannot be
accepted that periods of soars, stagnation, or collapse can be integrated into a single
strategy).
Fractal principles also apply to the capital market. Elliott’s waves are an elegant
example: each wave consists of subwaves, in the same structure. There are five
movements in the direction of the trend and three in the opposite direction.
As with the technique (the accuracy of the measuring devices is superior in the
middle of the scale), on the major part of strong trends, the results of the technical analysis
are applied much better than at the ends (at the beginning or finish of the trend).
Although the market is on an upward secular trend, crises, declines, or even periods
of marasmus (trading) exist and are unpredictable in duration and intensity. Like
earthquakes, it is known for sure that they will happen, but not when and with what
strength.

Mathematics 2022, 10, 860 23 of 25
The comparison with poker is almost trivial. There are also people in the markets
who have different strategies, who try to manipulate the market, and who enter or exit
the investments in an unpredictable way compared to other participants.
Obviously, each individual transaction is part of a random walk of the fight between
bid and ask. However, just as obvious is that, overall, the market is moving in waves,
according to the Dow theory. The physical laws of the Brownian movement are known;
those of the capital markets remain to be determined.
There are no good or bad stocks; there are only appropriate entry/exit times in/from
the market. At different times, different stocks perform well or poorly; investors turn their
eyes from those that have already performed excellently to those that are lagging behind.
Over different periods, things happen similarly: some stocks rise thanks to speculators;
others grow more slowly, thanks to investors who capitalize them.
Financial bets are prohibited or restricted and cannot be “marketed” similarly to
sports betting. However, similar mathematical reasoning may be beneficial in estimating
future developments, provided that a system is found for assigning probabilities for
future quotations and performances. Moreover, the system is compatible with evaluation
theories, which recommend mediating the results of scenarios weighted with their
probability.
The extension of the approach for studying the applicability of the laws of physics,
chemistry, biology, etc. (not only mathematics) on the capital market is limited only by
the knowledge in the field and by interdisciplinary collaboration, which is increasingly
used in the contemporary sciences.
The methodology enriched in this paper deals with several themes and subjects
which had been treated into general shape, without entering into the minor details. It can
be noted that technical analyses also treat hundreds of graphical formations, indicators,
and oscillators, each with its own mentality and, in most cases, without any
interconnection between them. These features have not solely any yield but are correlated
and can lead to investment strategies and tactics of real success.
The article methodology proposes to review, evaluate, and assess a wide range of
ideas regarding the econophysics phenomenon which have not been explored in similar
academic papers. Any of these ideas can be extended and investigated in detail and/or
adapted. The presentation is general in nature in order to convey to the reader the basic
ideas for possible stock market theories that they may be interested in investigating in
detail. Some of these ideas, plus similar ones, will be developed further by the authors in
future papers. The scope of this paper is to encourage researchers to bend down upon
mathematical, physical, and engineering dedicated theories that can also be applied in
economics, especially on the stock market.
In conclusion, econophysics is the first step towards diversifying research directions.
The way we see the possibility of adopting new theories is the collaboration between
specialists from various fields of science and capital market practitioners. Take any
scientific field and you will find similarities with the stock exchange; you may even find
appropriate strategies.
Author Contributions: Conceptualization, F.T. and F.C.D.: design, F.T. and F.C.D.; data collection,
F.T. and F.C.D.; data analysis—development, F.T. and F.C.D.; data analysis—interpretation, F.T.
and F.C.D.; literature review, M.B. All authors have read and agreed to the published version of the
manuscript.
Funding: This research received no external funding.
Institutional Review Board Statement: Not applicable.
Informed Consent Statement: Not applicable.
Data Availability Statement: Not applicable.
Acknowledgments: The authors thank the anonymous reviewers and editor for their valuable
contribution.

Mathematics 2022, 10, 860 24 of 25
Conflicts of Interest: The authors do have not any competing financial, professional, or personal
interests from other parties.
References
1. Slanina, F. Essentials of Econophysics Modelling; Oxford University Press: Oxford, UK, 2014.
2. Peters, E.E. Fractal Market Analysis; John Wiley & Sons, Inc.: Hoboken, NJ, USA, 1994.
3. Sergeev, V. The Thermodynamic Approach to Market; 2008. Available online: arXiv:0803.3432v1[physics.soc-ph] (accessed on 7
October 2017).
4. McCauley, J.L. Dynamics of Markets. Econophysics and Finance; Cambridge University Press: Cambriege, UK, 2004.
5. Richmond, P.J.; Mimkes, J.; Hutzler, S. Econophysics and Physical Economics; Oxford University Press: Oxford, UK, 2013.
6. Săvoiu, G. Econophysics. Background and Applications in Economics, Finance, and Sociophysics; Academic Press, Elsevier: Cambridge,
MA, USA, 2013.
7. Chakrabarti, B.K.A.; Chakrabortiand, A.C. Econophysics and Sociophysics. Trends and Perspectives; Wiley-VCH Verlag GmbH & Co.
KGaA: Weinheim, Germany, 2006.
8. Cockshott, W.P.; Cottrell, A.F.; Michaelson, G.J.; Wright, I.P.; Yakovenko, V.M. Classical Econophysics; Taylor & Francis Group,
Oxfordshire, UK, 2009.
9. Roehner, B.M. Patterns of Speculation. A Study in Observational Econophysics; Cambridge University Press: Cambriege, UK, 2002.
10. Preiss, T. Econophysics-complex correlations and trend switchings in financial time series. Eur. Phys. J.-Spec. Top. 2011, 194, 5–86,
doi:10.1140/epjst/e2011-01397-y.
11. Liang, Y.; Yang, G.; Huang, J.P. Progress in physical properties of Chinese stock market. Front. Phys. 2013, 8, 438–450,
doi:10.1007/s11467-013-0366-0.
12. Chakrabarti, A.; Toke, I.M.; Patriarca, M.; Aberger, F. Econophysics review: II. Agent-based models. Quant. Financ. Taylor Fr. 2011,
11, 1013–1041. https://doi.org/10.1080/14697688.2010.539249
13. Vasconcelos, G.L. A Guided Walk Down Wall Street: An Introduction to Econophysics. Braz. J. Phys. 2004, 34, 1039–1065.
14. Choi, J. Application of Physics and Geometry to Finance; 2014. Available online:
https://pdfs.semanticscholar.org/5784/6ba194cc0f664d0e547b85d8f1d3542ea256.pdf (accessed on 7.10.2017).
15. Forte, U. Econophysics: The Emergence of Complexity Patterns in a Stock Market Using Agent Based Models; 2017. Available online:
http://terna.to.it/tesineEconofisica/The%20emergence%20of%20complexity%20patterns%20in%20a%20stock%20market%20using
%20agent%20based%20models.pdf (accessed on 7.10.2017).
16. Swingler, A.J. An Econophysics Approach to Short Time-Scale Dynamics of the Equities Markets; 2017. Available online:
https://dukespace.lib.duke.edu/dspace/bitstream/.../Swingler_duke_0066D_14101.pdf? (accessed on 7.10.2017).
17. Bali, S. Econophysics, Thermoeconomics and Phynance. J. Int. Soc. Res. 2011, 4, 379–388.
18. Schafer, R. Econophysics: Quantitative Studies of Equity and Credit Markets; 2012. Available online: https://duepublico.uni-duisburg-
essen.de/servlets/DerivateServlet/Derivate-34569/Schaefer_Rudi_Habil.pdf (accessed on 7.10.2017).
19. Kakarot-Handtke, E. Toolism! A Critique of Econophysics; MPRA Paper No. 46630; 2013. Available online: http://mpra.ub.uni-
muenchen.de/46630/ (accessed on 7.10.2017).
20. Aamir, M.; Ali Shah, S.Z. Determinants of Stock Market Co-Movements between Pakistan and Asian Emerging Economies. J. Risk
Financ. Manag. 2018, 11, 1–14.
21. Ruan, L. Research on Sustainable Development of the Stock Market Based on VIX Index. Sustainability 2018, 10, 4113.
22. Nasr, A.B.; Cunado, J.; Demirer, R.; Gupta, R. Country Risk Ratings and Stock Market Returns in Brazil, Russia, India, and China
(BRICS) Countries: A Nonlinear Dynamic Approach. Risks 2018, 6, 1–22.
23. Kollintza-Kyriakoulia, F.; Maragoudakis, M.; Krithara, A. Measuring the Impact of Financial News and Social Media on Stock
Market Modeling Using Time Series Mining Techniques. Algorithms 2018, 11, 1–24.
24. Li., B.; Wu, K. The Price of Environmental Sustainability: Empirical Evidence from Stock Market Performance in China.
Sustainability 2017 9, 1452.
25. Drezewski, R.; Dziuban, G.; Pajak, K. The Bio-Inspired Optimization of Trading Strategies and its Impact on the Efficient Market
Hypothesis and Sustainable Development Strategies. Sustainability 2018, 10, 1460.
26. Paluch, M.; Jackowska-Strumillo, L. Hybrid Models Combining Technical and Fractal Analysis with ANN for Short-Term
Prediction of Close Values on the Warsaw Stock Exchange. Appl. Sci. 2018, 8, 2473.
27. Nguyen, T.T.; Yoon, S. A Novel Approach to Short-Term Stock Price Movement Prediction using Transfer Learning. Appl. Sci. 2019,
9, 4745.
28. Herzog, B.; Osamah, S. Reverse Engineering of Option Pricing: An AI Application. Int. J. Financ. Stud. 2019, 7, 1–12.
29. Nayan, S. The Influence of Domestic and Foreign Shocks on Portfolio Diversification Gains and the Associated Risks. J. Risks Financ.
Manag. 2019, 12, 1–26.
30. Arendas, P.; Kotlebova, J. The Turn of the Month Effect on CEE Stock Markets. Int. J. Financ. Stud. 2019, 7, 1–19.
31. Zakaria, N.N.; Othman, M.; Sokkalingam, R.; Daud, H.; Abdullah, L.; Kadir, E.A. Markov Chain Model Development for
Forecasting Air Pollution Index of Miri, Sarawak. Sustainability 2019, 11, 5190.
32. Thu Truong, T.T.; Kim, J. Premium for Non-Sustainable and Sustainable Components of Market Volatility: Evidence from the
Korean Stock Market. Sustainability 2019, 11, 5123.

Mathematics 2022, 10, 860 25 of 25
33. Blackledge, J.; Kearney, D.; Lamphiere, M.; Rani, R.; Walsh, P. Econophysics and Fractional Calculus: Einstein’s Evolution
Equation, the Fractal Market Hypothesis, Trend Analysis and Future Price Prediction. Mathematics 2019, 7, 1057.
34. Wang, G.J.; Xie, C.; Chen, Y.J.; Chen, S. Statistical Properties of the Foreign Exchange Network at Different Time Scales: Evidence
from Detrended Cross-Correlation Coefficient and Minimum Spanning Tree. Entrophy 2013, 15, 1643–1662.
35. Zanin, M.; Zunino, L.; Rosso, O.A.; Papo, D. Permutation Entropy and Its Main Biomedical and Econophysics Application: A
Review. Entropy 2012, 14, 1553–1577.
36. Fry, J.; Brint, A. Bubbles, Blind-Spots and Brexit. Risks 2017, 5, 1–15.
37. Ahmad, N.; Raheem Ahmed, R.; Streimikiene, D. Empirical Analysis of Stock Returns and Volatility: Evidence from Asian Stock
Markets. Technol. Econ. Dev. Econ. 2016, 22, 808–829, doi:10.3846/20294913.2016.1213204.
38. Rudzikis, R.; Valkaviciene, R. Econometric Models for the Impact of Macroeconomic Processes on the Stock Market in Baltic
Countries. Technol. Econ. Dev. Econ. 2014, 20, 783–800, doi:10.3846/20294913.2014.949901.
39. Vveinhardt, J.; Streimikiene, D.; Rizwan, A.R.; Nawaz, A.; Rehman, A. Mean Reversion: An Investigation from Karachi Stock
Exchange Sectors. Technol. Econ. Dev. Econ. 2016, 22, 493–511, doi:10.3846/20294913.2016.1181685.
40. Ruxanda, G.; Badea, L.M. Configuring Artificial Neural Networks for Stock Market Predictions. Technol. Econ. Dev. Econ. 2014,
20, 116–132, doi:10.3846/20294913.2014.889051.
41. Garcia, F.; Guijarro, F.; Oliver, J.; Tamosiuniene, R. Hybrid Fuzzy Neural Network to Predict Price Direction in the German
DAX-30 Index. Technol. Econ. Dev. Econ. 2018, 24, 2161–2178. https://doi.org/10.3846/tede.2018.6394.
42. Ahmed, R.R.; Vveinhardt, J.; Streimikiene, D.; Ghauri, S.P.; Ashraf, M. Stock Returns, Volatility and Mean Reversion in
Emerging and Developed Financial Markets. Technol. Econ. Dev. Econ. 2018, 24, 1149–1177.
https://doi.org/10.3846/20294913.2017.1323317.
43. Janda, K.; Rausser, G.; Svarovska, B. Can Investment in Microfinance Funds Improve Risk-Return Characteristics of a
Portfolio?” Technol. Econ. Dev. Econ. 2014, 20, 673–695, doi:10.3846/20294913.2013.869514.
44. Ulusoy, T.; Kekin, M.; Shirvani, A.; Deviren, B.; Kantar, E.; Donmez, C.C. Complexity of Major UK Companies between 2006
and 2010: Hierarchical Structure Method Approach. Phys. Stat. Mech. Appl. 2012, 391, 5212–5131.
45. Ulusoy, T. Price Fluctuations in Econophysics. In Global Financial Crises and its Ramifications on Capital Markets; Hacioglu, U.,
Dincer, H., Eds. Springer Cham: Cham, Switzerland, 2017; pp. 459–474.
46. Garcia, M.D.L.N.L.; Requena, J.P.R. Different Methodologies and uses of the Hurst Exponent in Econophysics. Stud. Appl. Econ.
2019, 37, 96–108.
47. Jewson, S.; Brix, A. Weather Derivative Valuation. The Meteorological, Statistical, Financial and Mathematical Foundations; Cambridge
University Press: Cambriege, UK, 2005.
48. Alexandridis, A.K.; Zapranis, A.D. Weather Derivatives. Modeling and Pricing Weather-Related Risk; Springer Science & Business
Media: New York, NY, USA, 2013.
49. Tsinaslanidis, P.E.; Zapranis, A.D. Technical Analysis for Algorithmic Pattern Recognition; Springer International Publishing:
Switzerland, doi:10.1007/978-3-319-23636-0.
50. Purdy, D. The Illustrated Guide to Texas Hold’em; Sourcebooks, Inc.: Naperville, IL, USA, 2005.
51. Prokopczuk, M.; Rachev, S.; Trück, S. Quantifying Risk in the Electricity Business: A RAROC-Based Approach; 2004. Available online:
http://www.pstat.ucsb.edu/about/research/papers/report10_2004%5b1%5d.pdf (accessed on 7.10.2017).
52. Mandelbrot, B.B.; Hudson, R.L. The (mis)Behavior of Markets; Basic Books: New York, NY, USA, 2004.
53. Murphy, J.J. Technical Analysis of the Financial Markets; New York Institute of Finance: New York, NY, USA, 1999.
54. Rossi, E.; Forte, G. Assessing Relative Valuation in Equity Markets; Palgrave Macmillan: London, UK, 2016.
55. Pesavento, L. A Trader’s Guide to Financial Astrology. Forecasting Market Cycles Using Planetary and Lunar Moments; John Wiley &
Sons, Inc.: Hoboken, NJ, USA, 2015.
56. Grover, J. Strategic Economic Decision-Making; New York Springer Science and Business Media: New York, NY, USA, 2013.
57. Tijms, H. Surprises in Probability. Seventeen Short Stories; CRC Press Taylor & Francis Group: Boca Raton, FL, USA, 2019.
Top Related
Copyright © 2022 FDOKUMEN

