


Bahasa
Halaman
Hukum

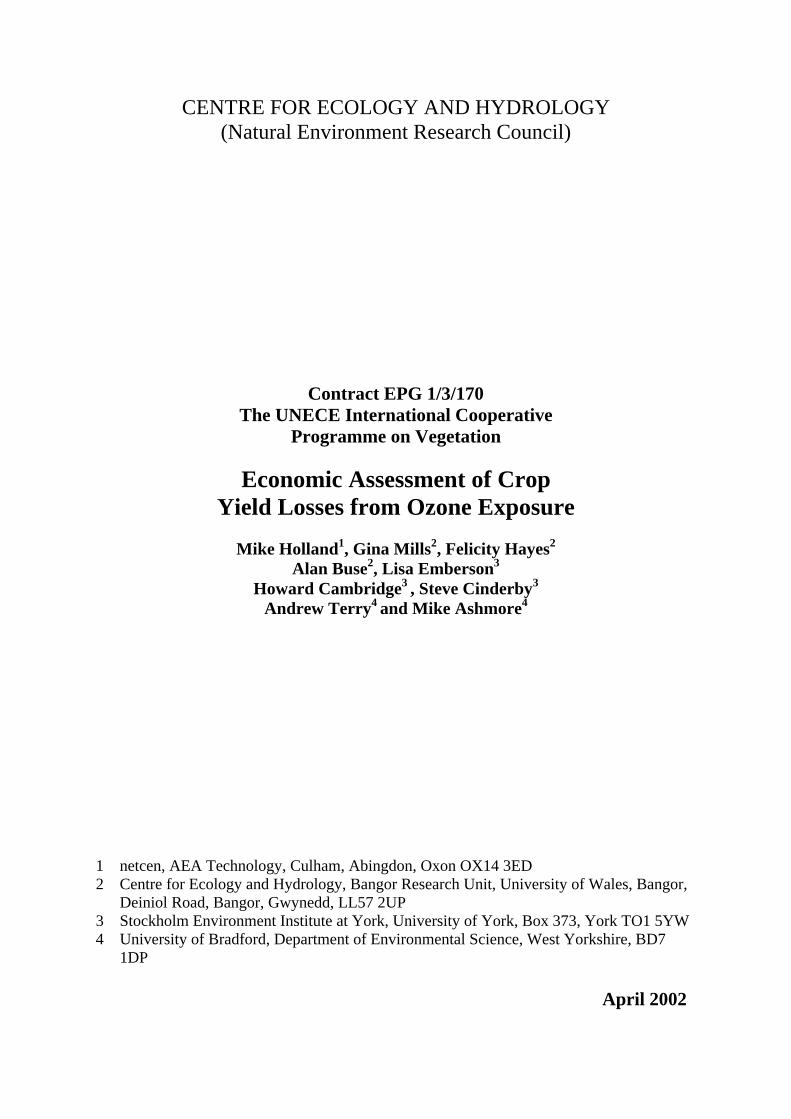
CENTRE FOR ECOLOGY AND HYDROLOGY(Natural Environment Research Council)
Contract EPG 1/3/170The UNECE International Cooperative
Programme on Vegetation
Economic Assessment of CropYield Losses from Ozone Exposure
Mike Holland1, Gina Mills2, Felicity Hayes2
Alan Buse2, Lisa Emberson3
Howard Cambridge3 , Steve Cinderby3
Andrew Terry4 and Mike Ashmore4
1 netcen, AEA Technology, Culham, Abingdon, Oxon OX14 3ED2 Centre for Ecology and Hydrology, Bangor Research Unit, University of Wales, Bangor,
Deiniol Road, Bangor, Gwynedd, LL57 2UP3 Stockholm Environment Institute at York, University of York, Box 373, York TO1 5YW4 University of Bradford, Department of Environmental Science, West Yorkshire, BD7
1DP
April 2002
ACKNOWLEDGEMENT
We wish to thank the UK Department for Environment,Food and Rural Affairs for the continued financial
support of the ICP Vegetation (Contract EPG 1/3/170).The support of the Scottish Executive, the National
Assembly for Wales and the Department of Environmentin Northern Ireland is acknowledged.
This report is an official report prepared under contractbetween DEFRA and the Natural Environment ResearchCouncil. It should not be quoted without the permission
of both the Centre for Ecology and Hydrology and DEFRA.
ICP Vegetation, April 2002, part of Contract EPG 1/3/170
i
CONTENTS
EXECUTIVE SUMMARY ....................................................................................................II
1 INTRODUCTION............................................................................................................1
1.1 Past economic analyses of crop losses from exposure to ozone....................................11.2 Scoping the Analysis......................................................................................................2
2 EXPOSURE-RESPONSE FUNCTIONS FOR YIELD LOSS ....................................7
3 SCENARIOS AND OZONE DATA.............................................................................17
4 MAPPING OF AGRICULTURAL AREAS AND CROP YIELD DATA ...............21
4.1 Agricultural areas.........................................................................................................214.2 Linking the revised agricultural map to agricultural production statistics ..................22
5 RESULTS OF ECONOMIC ASSESSMENT .............................................................25
5.1 Results by crop, scenario and country .........................................................................255.2 Impacts on production of meat and milk .....................................................................25
6 DEALING WITH UNCERTAINTIES ........................................................................31
7 FUTURE WORK...........................................................................................................33
8 CONCLUSIONS ............................................................................................................35
9 REFERENCES...............................................................................................................37
APPENDIX 1: DETAILED RESULTS ...............................................................................49
ICP Vegetation, April 2002, part of Contract EPG 1/3/170
ii
THE UNECE INTERNATIONAL COOPERATIVE PROGRAMMEON VEGETATION
CONTRACT EPG 1/3/170
ECONOMIC ASSESSMENT OF CROP YIELD LOSSES FROM OZONEEXPOSURE
EXECUTIVE SUMMARY
An economic assessment of the impacts of ozone on crop yield in Europe has been carriedout as part of Contract EPG 1/3/170 (The UNECE International Cooperative Programme onVegetation). This assessment is more detailed and substantially refines previous workperformed in this field for UNECE. Crop response functions were derived from acomprehensive literature review conducted by Alan Buse (CEH Bangor). Maps of cropdistribution were developed at SEI-Y by Howard Cambridge and Steve Cinderby. Data oncrop distribution, concentration-response, and value, were then translated into an economicassessment of the impacts of ozone on agriculture by Mike Holland, netcen, AEAT. Thisstudy will in future allow more confidence to be placed in estimates of the benefits toagriculture of European abatement strategies for air pollution.
Refinements to the analysis, in comparison with earlier pan-European estimates, included:
• Updating of exposure-response functions used in the analysis;• The use of detailed databases to assess crop distribution , with resolution of the mapping
being improved by a factor of 9, from 150 x 150 km to 50x50 km;• Differences in the growing season in different parts of Europe being taken into account;• Updating of crop valuations.
Through these improvements the assessment moves closer to a Level II analysis. Furtherinformation could in future be integrated with the modelling framework developed in thisstudy to move closer to a Level II analysis.
Impacts and costs were quantified for ozone exposures under four of the NOx/VOC emissionscenarios considered in the development of the Gothenburg Protocol:
• 1990 Baseline scenario;• 2010 Reference scenario - essentially business as usual, with legislation that is already in
place or in the pipeline taking full effect;• Gothenburg Protocol - with each country precisely meeting its Gothenburg targets in 2010;• J1 scenario – the main scenario for 2010 considered in negotiations on the Protocol, that
would have required a greater level of abatement than was finally agreed.
Ozone data for this study, taken from the EMEP model, were available only on the 150 x150 km EMEP grid, though the modelling framework is able to integrate the finer resolution50 x 50 km data when it becomes available.
ICP Vegetation, April 2002, part of Contract EPG 1/3/170
iii
Results are listed in detail at the end of the report by country, crop and scenario. Results forthe 1990 scenario found damages of £4.3 billion, declining to £2.8 billion in scenario J1 (thescenario with the highest level of abatement). Of these damages, 32% was attributed towheat, 21% to potato and 9% to sugar beet. Inclusion of reductions in meat and milkproduction, through effects on grass production could raise these damages by up to 68%,though further discussion on methods is needed in this area.
Future research should concentrate on the following:• Enhancement of the Level II approach;• Development of methods for assessment of damages to meat and milk production.
ICP Vegetation, April 2002, part of Contract EPG 1/3/170
1
1 INTRODUCTION
1.1 Past economic analyses of crop losses from exposure to ozone
Economic assessments of the effects of ozone on crop yields have been undertaken in theUSA since the mid-1980s (as reviewed by Heck, 1989). The first such analysis in Europewas performed by van der Eerden et al in 1988 for the Netherlands, considering the effectsnot just of ozone, but also of SO2 and HF. This was followed by:
• Work in the Andalusian Region of Spain (AED, 1991)• The ExternE Project (European Commission, 1995, 1998)• The Green Accounting Research Project (GARP, Markandya and Pavan, eds., 1999)• Numerous analyses during discussions of the EU’s Directives on air quality limits for
ozone and national emission ceilings (AEA Technology, 1998; 1999a)• Assessment of the UNECE’s Gothenburg Protocol (AEA Technology, 1999b)• Assessment of the UK’s National Air Quality Strategy (IGCB, 1999, 2001)• An updated analysis of pollution impacts on yield in the Netherlands.
Van der Eerden (1988) valued the effects of air pollution - ozone, SO2, and HF - upon theyield of 14 crop species. All three pollutants were considered to occur in sufficiently highconcentrations to cause adverse effects. To establish monetary values, an inventory wasmade of the cropped area per species for each province and the yield at ambient concentrationlevels. New prices were calculated for any changes in supply taking into account the priceelasticity per species. Estimated yields were not simply valued using current market prices,but a model of supply and demand was used to obtain estimates in the changes in producers’and consumers’ surpluses. The study found that pollution affected total production valueonly marginally because price changes offset production changes. If air pollution werereduced to baseline levels, producer surplus would only decrease by DFL 73 million (aboutEuro 30 million). Consumers, however, could receive a net loss of as much as DFL 701million (Euro 300 million) nationally, due to a 5% drop in yield of sensitive crops. Of this5%, ozone accounted for 3.4% of the loss, SO2 for 1.2% and HF for 0.4% of the loss. (Allfigures are in 1990 prices). Although some adjustments were made to allow for price effects,some other effects were ignored. The supply functions were not derived from an overallprofit maximisation model of farmer response, so cropping patterns were not fully adjusted toallow for the differential environmental impacts of changes in pollutants on yields. Non-linearity in dose-response relationships will affect the grossing-up of national estimates.Finally the extrapolation of available concentration-response data would have introducedadditional error. Another issue is that the type of modelling undertaken in the study requiredsimulation of behaviour in the agricultural sector. Suitable models for this are not availableat the European level.
AED (1991) found that the crop loss in the Andalusian region of Spain was in the order of930 million Pesetas (Euro 8.7 million, 1987). This result was obtained using market pricesonly. Using market prices in conjunction with a demand and supply model, another estimateof 1.7 billion Pesetas (Euro 15.8 million, 1987) was found (including wheat and corn, allfigures in 1987 prices). This indicates that, as in the van Eerden study, the consumer lossesfrom price rises are a significant part of the costs of the air pollution.
A similar pattern has been observed in the USA (Adams et al, 1982, 1986; Adams andMcCarl, 1985; Shortle et al, 1986). In short, a simple model that does not include changes inprice, etc., with variation in yield, will in theory provide a less accurate estimate than a more
ICP Vegetation, April 2002, part of Contract EPG 1/3/170
2
comprehensive economic model, provided of course that the economic model is adequatelyparameterised.
The analyses using the ExternE and GARP methodologies, including those for the EuropeanCommission and UNECE, have been unable to apply a general equilibrium model forassessment of air pollution impacts on agriculture. Instead they have simply applied worldmarket prices (i.e. prices that are little affected by subsidy, see Squire and van der Tak, 1975)to estimates of yield change. This approach was accepted by the UNECE Task Force onEconomic Aspects of Abatement Strategies in the discussions that fed into the developmentof the Gothenburg Protocol as the only practicable approach at the pan-European scale.Given that this is the approach that will be followed here, it is necessary to ask at this earlystage what effect there might be on the reliability of the results. There are several reasons forthis analysis to be less concerned about the problem. Most importantly, Protocols andDirectives bring about incremental changes in production resulting from relatively smallchanges in air quality, not to the total damage attributable to all air pollution. On this basis,the damage avoided by legislation tends to be much less significant than might be suggestedby the work of van der Eerden and others. Another factor is that the European agriculturalsystem may well undergo fundamental change over the next 10 or so years, as a result ofreform (of whatever nature) to the Common Agricultural Policy. Models developed now maytherefore not be relevant by 2010, or whatever year future analysis is required for. Overall,the simple application of world market prices may not be perfect, but it is transparent, and atthe very minimum a useful starting point for analysis.
Some work on refinement of the methods, particularly with respect to the modelling ofagricultural economics, is currently being performed by Mr Harris Neeliah at the Universityof Reading.
The studies for the Commission and UNECE were criticised by some experts in the field asgoing further than was reasonable given limitations on the state of science. However, theproblem faced at the time was that decisions on legislation were to be taken, whether or notthe science was able to provide an answer to the magnitude of the benefits of abatement.Against this background it is justifiable to apply the data that are available to at least gaugethe order of magnitude of impacts, to see whether they are likely to account for a significantportion of the costs of abatement.
1.2 Scoping the Analysis
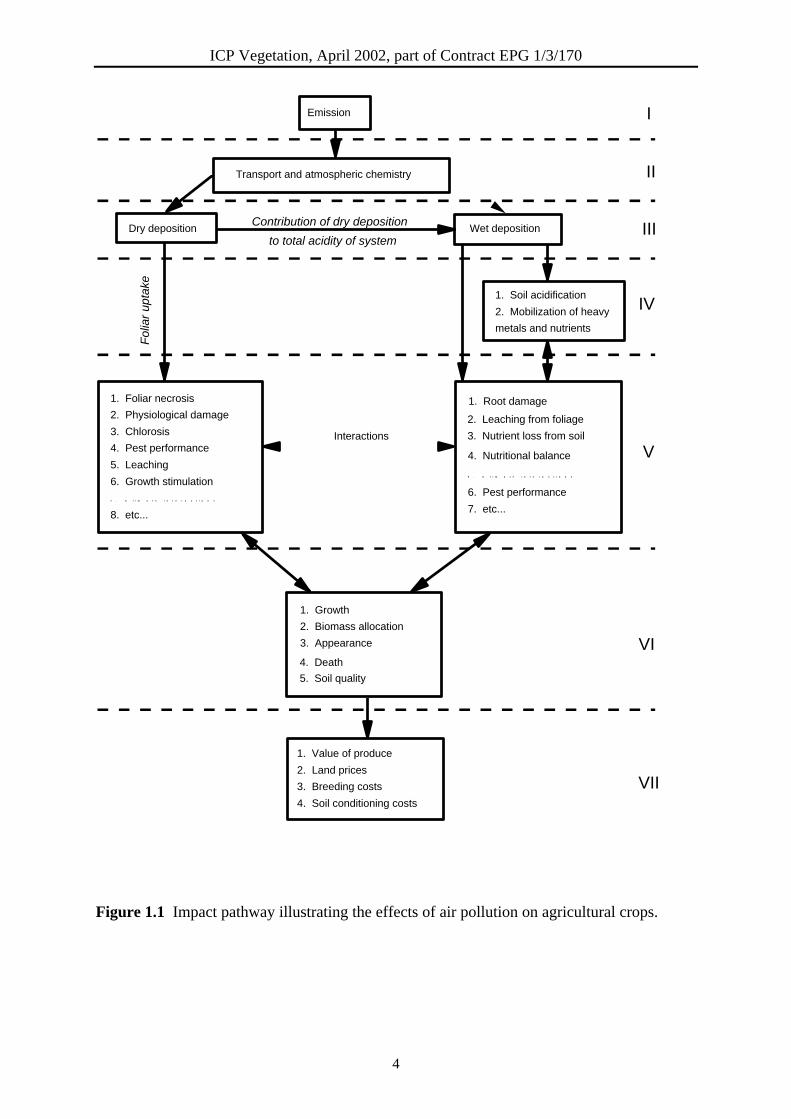
The ExternE Project developed the ‘Impact Pathway Approach’ for assessment of the effectsof energy systems on health, amenity and the environment. The pathway for agriculturalcrops is shown in Figure 1.1. It includes effects not just of ozone, but of SO2 andacidification also (a simplified version specifically for ozone has not been produced for thisstudy because of the potential for interaction between the different pollutants). All knowneffects, including feed-backs, have been included, whether or not these are thought to bequantifiable at the current time. On the basis of a multiple-stress hypothesis it should beassumed that each effect on an organism may interact with any other impact on thatorganism, whether they are joined by an arrow or not (depiction of all potential interactionswould be confusing). The comprehensive nature of these pathways is intended to allow theeffects that have been quantified to be put into perspective with those that have not.Consideration of all potential impacts will also assist in the identification of priorities forfuture research.
ICP Vegetation, April 2002, part of Contract EPG 1/3/170
3
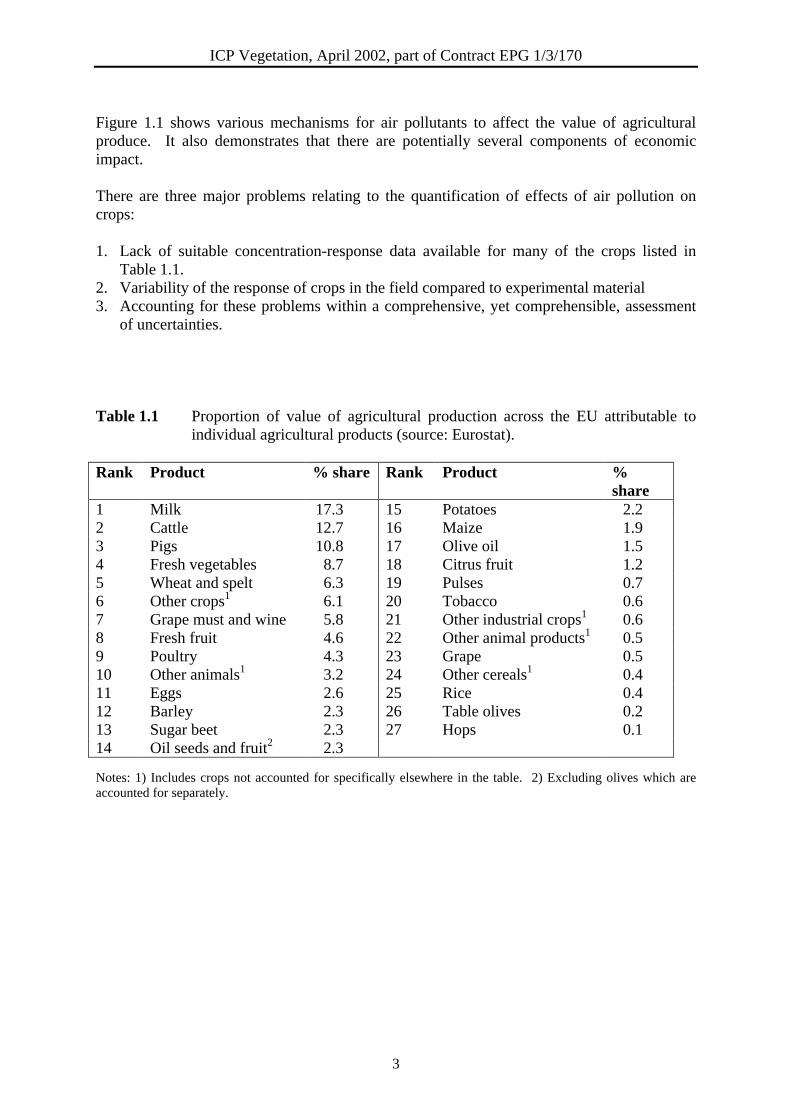
Figure 1.1 shows various mechanisms for air pollutants to affect the value of agriculturalproduce. It also demonstrates that there are potentially several components of economicimpact.
There are three major problems relating to the quantification of effects of air pollution oncrops:
1. Lack of suitable concentration-response data available for many of the crops listed inTable 1.1.
2. Variability of the response of crops in the field compared to experimental material3. Accounting for these problems within a comprehensive, yet comprehensible, assessment
of uncertainties.
Table 1.1 Proportion of value of agricultural production across the EU attributable toindividual agricultural products (source: Eurostat).
Rank Product % share Rank Product %share
1 Milk 17.3 15 Potatoes 2.22 Cattle 12.7 16 Maize 1.93 Pigs 10.8 17 Olive oil 1.54 Fresh vegetables 8.7 18 Citrus fruit 1.25 Wheat and spelt 6.3 19 Pulses 0.76 Other crops1 6.1 20 Tobacco 0.67 Grape must and wine 5.8 21 Other industrial crops1 0.68 Fresh fruit 4.6 22 Other animal products1 0.59 Poultry 4.3 23 Grape 0.510 Other animals1 3.2 24 Other cereals1 0.411 Eggs 2.6 25 Rice 0.412 Barley 2.3 26 Table olives 0.213 Sugar beet 2.3 27 Hops 0.114 Oil seeds and fruit2 2.3
Notes: 1) Includes crops not accounted for specifically elsewhere in the table. 2) Excluding olives which areaccounted for separately.
ICP Vegetation, April 2002, part of Contract EPG 1/3/170
4
Emission
Transport and atmospheric chemistry
Dry deposition Wet deposition
1. Foliar necrosis
2. Physiological damage
3. Chlorosis
4. Pest performance
5. Leaching
1. Soil acidification
2. Mobilization of heavy
metals and nutrients
1. Root damage
2. Leaching from foliage
3. Nutrient loss from soil
4. Nutritional balance
6. Growth stimulation
7 . C l i m a t e i n t e r a c t i o n s
5 . C l i m a t e i n t e r a c t i o n s
8. etc...
6. Pest performance
1. Growth
2. Biomass allocation
3. Appearance
4. Death
Interactions
7. etc...
1. Value of produce
2. Land prices
3. Breeding costs
4. Soil conditioning costs
5. Soil quality
I
II
III
IV
V
VI
VII
Fol
iar
upta
ke
Contribution of dry deposition
to total acidity of system
Figure 1.1 Impact pathway illustrating the effects of air pollution on agricultural crops.
ICP Vegetation, April 2002, part of Contract EPG 1/3/170
5
Most research in this area has investigated the direct effects of pollutants on crops underconditions that are to a greater or lesser extent artificial. Less effort has been applied toinvestigation of interactions between pollutants and other stresses, or to experiments undernear natural conditions. A given dose of a pollutant will produce a variable responsedepending on a wide range of factors, including:
1. Age of organism/tissue at time of exposure (Shaw et al, 1993; Pääkkonen et al, 1995;Kelly et al, 1995; Kelting et al, 1995; Vandermeiren and De Temmerman, 1996);
2. Other pollutants (Mansfield and McCune, 1988; Jäger and Schulze, 1988; Adaros et al,1991a; b; Ashenden et al, 1996);
3. Temporal issues, such as time of day or season, duration of exposure, frequency ofepisodes (Baker and Fullwood, 1986; Baker et al, 1986);
4. Differences in temperature and light levels (Mansfield et al, 1986), which is particularlyrelevant when extrapolating from material exposed in greenhouses or open top chambers;
5. Water status and relative humidity (Mansfield et al, 1986; Keller and Hasler, 1988;Somerville et al, 1989; Heck, 1989; Freer-Smith and Dobson, 1989; Wieser andHavranek, 1993; Fuhrer, 1995);
6. Soil and plant nutrient status (Schulze et al, 1989);7. Species/cultivar (Taylor et al, 1986);8. Interactions with pests and pathogens (Bolsinger and Flukiger, 1989; Riemer and
Whittaker, 1989; Warrington, 1989; Houlden et al, 1990);9. Possible acclimation of plants to higher ambient concentrations (Davison and Reiling,
1995).
Discussion of approaches for describing uncertainties is provided in Section 6.
The scope for the work would ideally cover all agricultural production and account for all ofthe interactions identified in this section. This will not be possible, but advances in thisdirection are achievable, most notably with respect to phenology and soil moisture deficit.Whilst previous work has sought to move towards a more comprehensive assessmentcovering all agricultural production, it is anticipated that this study provides a better forumfor discussion of the way that this can best be achieved than earlier work. With respect tovaluation there will remain significant gaps. Here, the study is more likely to provide a basisfor defining the state of knowledge, and suggesting ways forward and priorities for futureresearch.

ICP Vegetation, April 2002, part of Contract EPG 1/3/170
6
ICP Vegetation, April 2002, part of Contract EPG 1/3/170
7
2 EXPOSURE-RESPONSE FUNCTIONS FOR YIELD LOSS
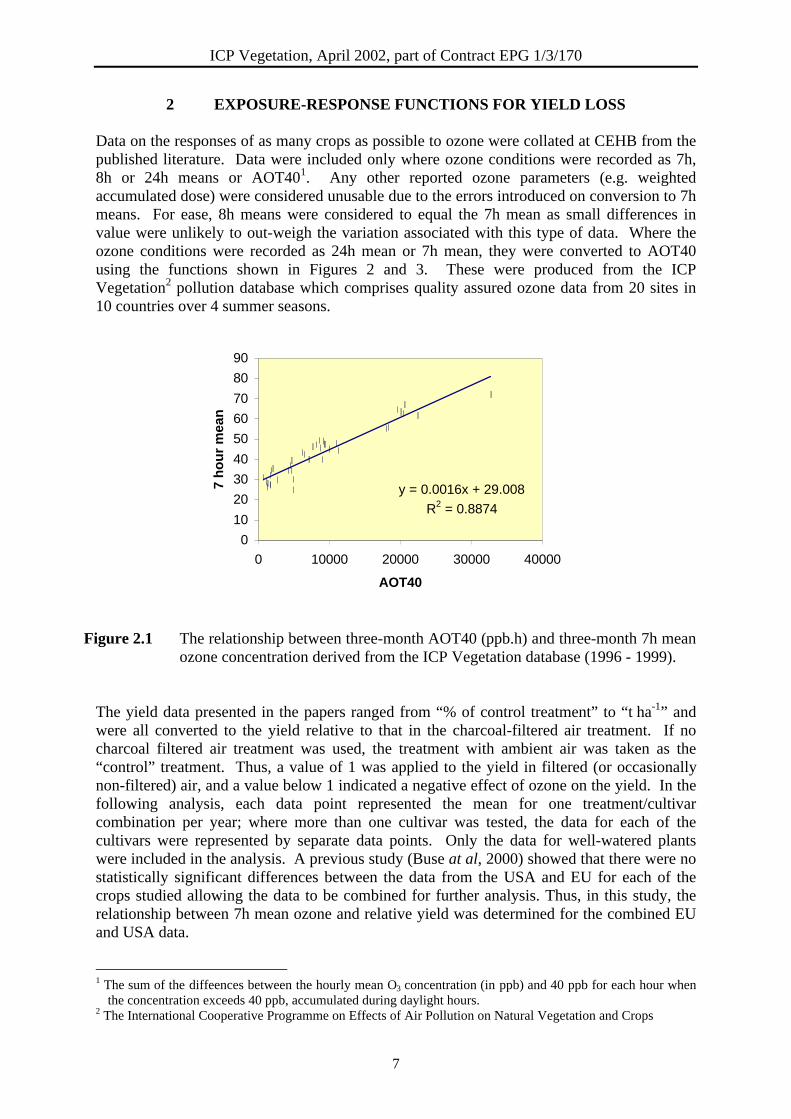
Data on the responses of as many crops as possible to ozone were collated at CEHB from thepublished literature. Data were included only where ozone conditions were recorded as 7h,8h or 24h means or AOT401. Any other reported ozone parameters (e.g. weightedaccumulated dose) were considered unusable due to the errors introduced on conversion to 7hmeans. For ease, 8h means were considered to equal the 7h mean as small differences invalue were unlikely to out-weigh the variation associated with this type of data. Where theozone conditions were recorded as 24h mean or 7h mean, they were converted to AOT40using the functions shown in Figures 2 and 3. These were produced from the ICPVegetation2 pollution database which comprises quality assured ozone data from 20 sites in10 countries over 4 summer seasons.
Figure 2.1 The relationship between three-month AOT40 (ppb.h) and three-month 7h meanozone concentration derived from the ICP Vegetation database (1996 - 1999).
The yield data presented in the papers ranged from “% of control treatment” to “t ha-1” andwere all converted to the yield relative to that in the charcoal-filtered air treatment. If nocharcoal filtered air treatment was used, the treatment with ambient air was taken as the“control” treatment. Thus, a value of 1 was applied to the yield in filtered (or occasionallynon-filtered) air, and a value below 1 indicated a negative effect of ozone on the yield. In thefollowing analysis, each data point represented the mean for one treatment/cultivarcombination per year; where more than one cultivar was tested, the data for each of thecultivars were represented by separate data points. Only the data for well-watered plantswere included in the analysis. A previous study (Buse at al, 2000) showed that there were nostatistically significant differences between the data from the USA and EU for each of thecrops studied allowing the data to be combined for further analysis. Thus, in this study, therelationship between 7h mean ozone and relative yield was determined for the combined EUand USA data.
1 The sum of the diffeences between the hourly mean O3 concentration (in ppb) and 40 ppb for each hour when
the concentration exceeds 40 ppb, accumulated during daylight hours.2 The International Cooperative Programme on Effects of Air Pollution on Natural Vegetation and Crops
y = 0.0016x + 29.008
R2 = 0.8874
0
10
20
30
40
50
60
70
80
90
0 10000 20000 30000 40000
AOT40
7 h
ou
r m
ean
ICP Vegetation, April 2002, part of Contract EPG 1/3/170
8
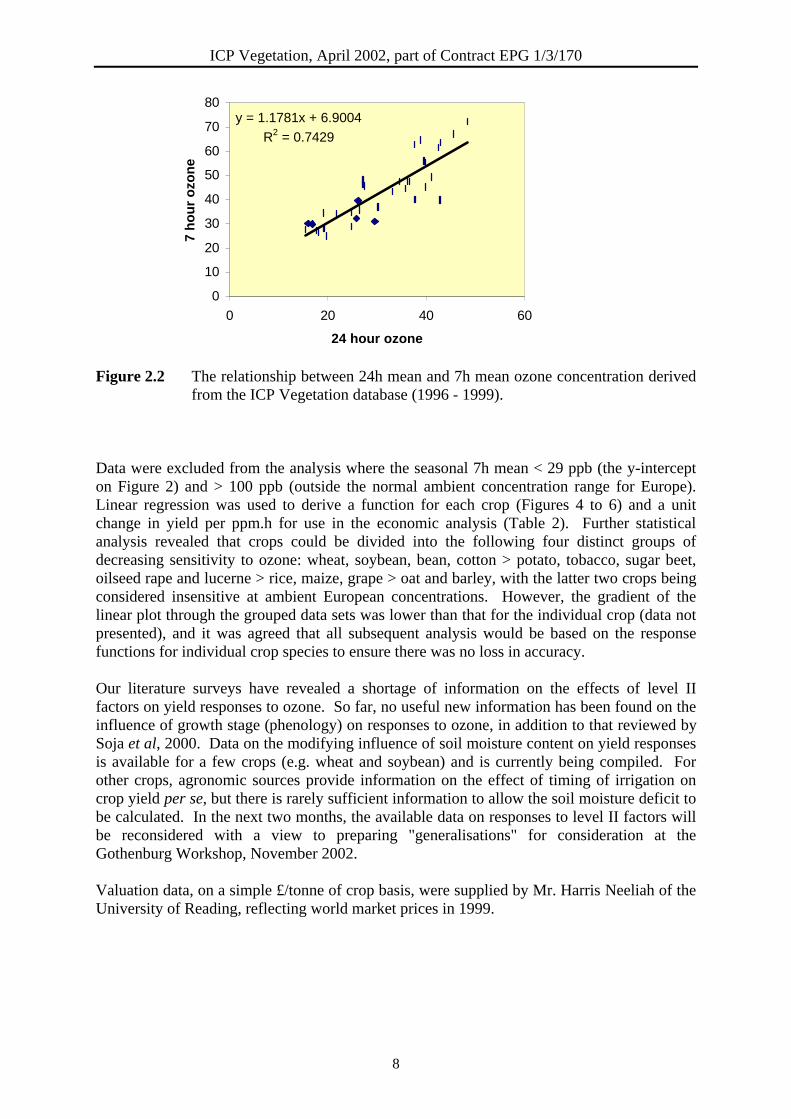
Figure 2.2 The relationship between 24h mean and 7h mean ozone concentration derivedfrom the ICP Vegetation database (1996 - 1999).
Data were excluded from the analysis where the seasonal 7h mean < 29 ppb (the y-intercepton Figure 2) and > 100 ppb (outside the normal ambient concentration range for Europe).Linear regression was used to derive a function for each crop (Figures 4 to 6) and a unitchange in yield per ppm.h for use in the economic analysis (Table 2). Further statisticalanalysis revealed that crops could be divided into the following four distinct groups ofdecreasing sensitivity to ozone: wheat, soybean, bean, cotton > potato, tobacco, sugar beet,oilseed rape and lucerne > rice, maize, grape > oat and barley, with the latter two crops beingconsidered insensitive at ambient European concentrations. However, the gradient of thelinear plot through the grouped data sets was lower than that for the individual crop (data notpresented), and it was agreed that all subsequent analysis would be based on the responsefunctions for individual crop species to ensure there was no loss in accuracy.
Our literature surveys have revealed a shortage of information on the effects of level IIfactors on yield responses to ozone. So far, no useful new information has been found on theinfluence of growth stage (phenology) on responses to ozone, in addition to that reviewed bySoja et al, 2000. Data on the modifying influence of soil moisture content on yield responsesis available for a few crops (e.g. wheat and soybean) and is currently being compiled. Forother crops, agronomic sources provide information on the effect of timing of irrigation oncrop yield per se, but there is rarely sufficient information to allow the soil moisture deficit tobe calculated. In the next two months, the available data on responses to level II factors willbe reconsidered with a view to preparing "generalisations" for consideration at theGothenburg Workshop, November 2002.
Valuation data, on a simple £/tonne of crop basis, were supplied by Mr. Harris Neeliah of theUniversity of Reading, reflecting world market prices in 1999.
y = 1.1781x + 6.9004
R2 = 0.7429
0
10
20
30
40
50
60
70
80
0 20 40 60
24 hour ozone
7 h
ou
r o
zon
e
ICP Vegetation, April 2002, part of Contract EPG 1/3/170
9
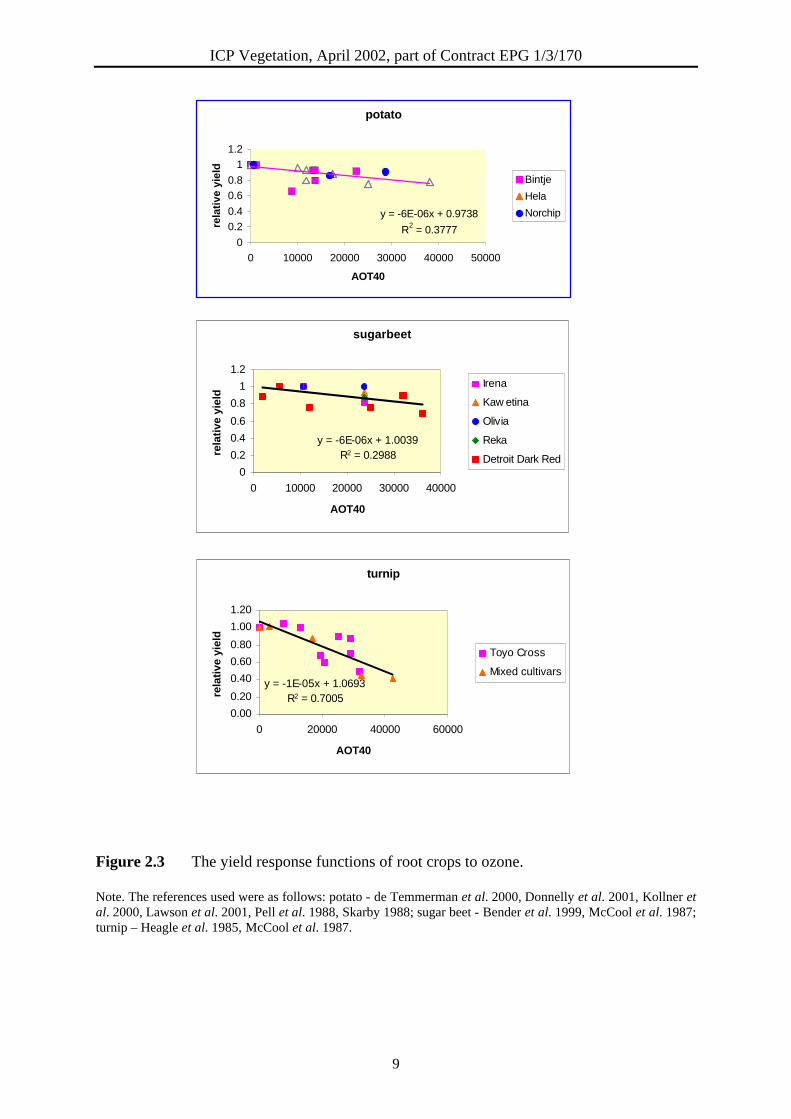
Figure 2.3 The yield response functions of root crops to ozone.
Note. The references used were as follows: potato - de Temmerman et al. 2000, Donnelly et al. 2001, Kollner etal. 2000, Lawson et al. 2001, Pell et al. 1988, Skarby 1988; sugar beet - Bender et al. 1999, McCool et al. 1987;turnip – Heagle et al. 1985, McCool et al. 1987.
sugarbeet
y = -6E-06x + 1.0039R2 = 0.2988
0
0.2
0.4
0.6
0.8
1
1.2
0 10000 20000 30000 40000
AOT40
rela
tive
yie
ld
Irena
Kaw etina
Olivia
Reka
Detroit Dark Red
potato
y = -6E-06x + 0.9738
R2 = 0.37770
0.2
0.4
0.6
0.8
1
1.2
0 10000 20000 30000 40000 50000
AOT40
rela
tive
yie
ld
Bintje
Hela
Norchip
turnip
y = -1E-05x + 1.0693R2 = 0.7005
0.00
0.20
0.40
0.60
0.80
1.00
1.20
0 20000 40000 60000
AOT40
rela
tive
yie
ld
Toyo Cross
Mixed cultivars
ICP Vegetation, April 2002, part of Contract EPG 1/3/170
10
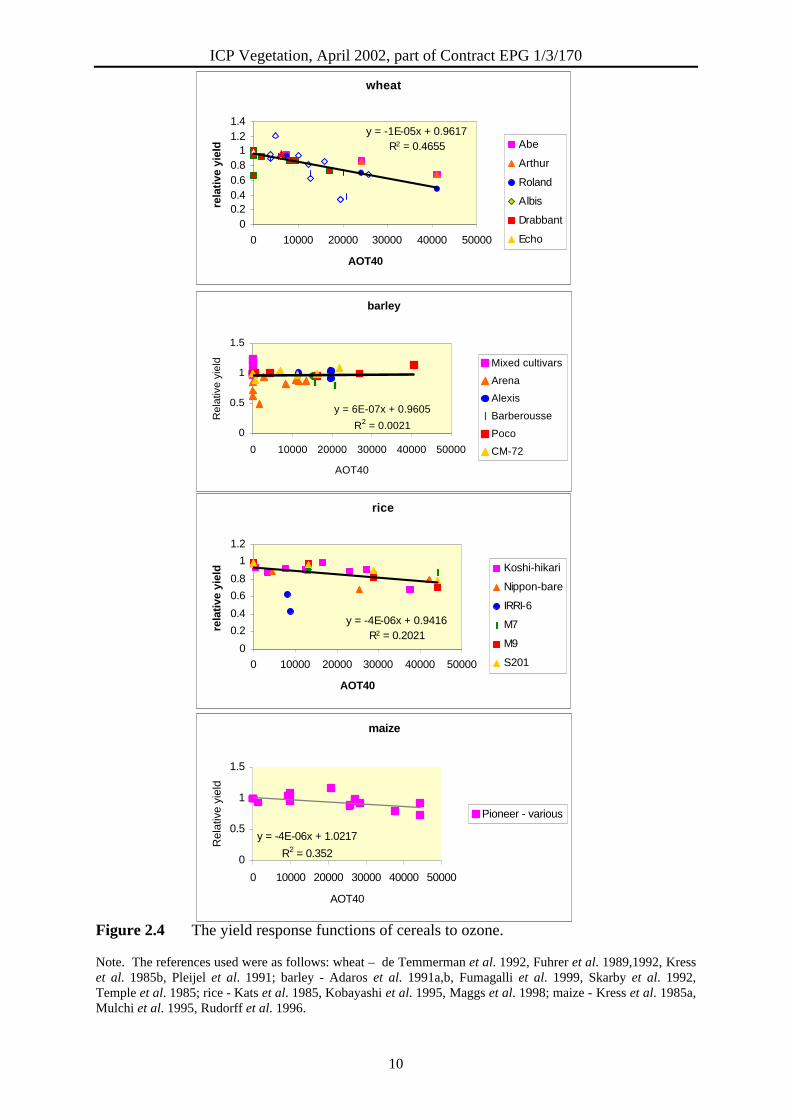
Figure 2.4 The yield response functions of cereals to ozone.
Note. The references used were as follows: wheat – de Temmerman et al. 1992, Fuhrer et al. 1989,1992, Kresset al. 1985b, Pleijel et al. 1991; barley - Adaros et al. 1991a,b, Fumagalli et al. 1999, Skarby et al. 1992,Temple et al. 1985; rice - Kats et al. 1985, Kobayashi et al. 1995, Maggs et al. 1998; maize - Kress et al. 1985a,Mulchi et al. 1995, Rudorff et al. 1996.
wheat
y = -1E-05x + 0.9617R2 = 0.4655
00.20.40.60.8
11.21.4
0 10000 20000 30000 40000 50000
AOT40
rela
tive
yie
ld Abe
Arthur
Roland
Albis
Drabbant
Echo
rice
y = -4E-06x + 0.9416R2 = 0.2021
0
0.2
0.4
0.6
0.8
1
1.2
0 10000 20000 30000 40000 50000
AOT40
rela
tive
yie
ld Koshi-hikari
Nippon-bare
IRRI-6
M7
M9
S201
maize
y = -4E-06x + 1.0217
R2 = 0.3520
0.5
1
1.5
0 10000 20000 30000 40000 50000
AOT40
Rel
ativ
e yi
eld
Pioneer - various
barley
y = 6E-07x + 0.9605
R2 = 0.00210
0.5
1
1.5
0 10000 20000 30000 40000 50000
AOT40
Rel
ativ
e yi
eld Mixed cultivars
Arena
Alexis
Barberousse
Poco
CM-72
ICP Vegetation, April 2002, part of Contract EPG 1/3/170
11
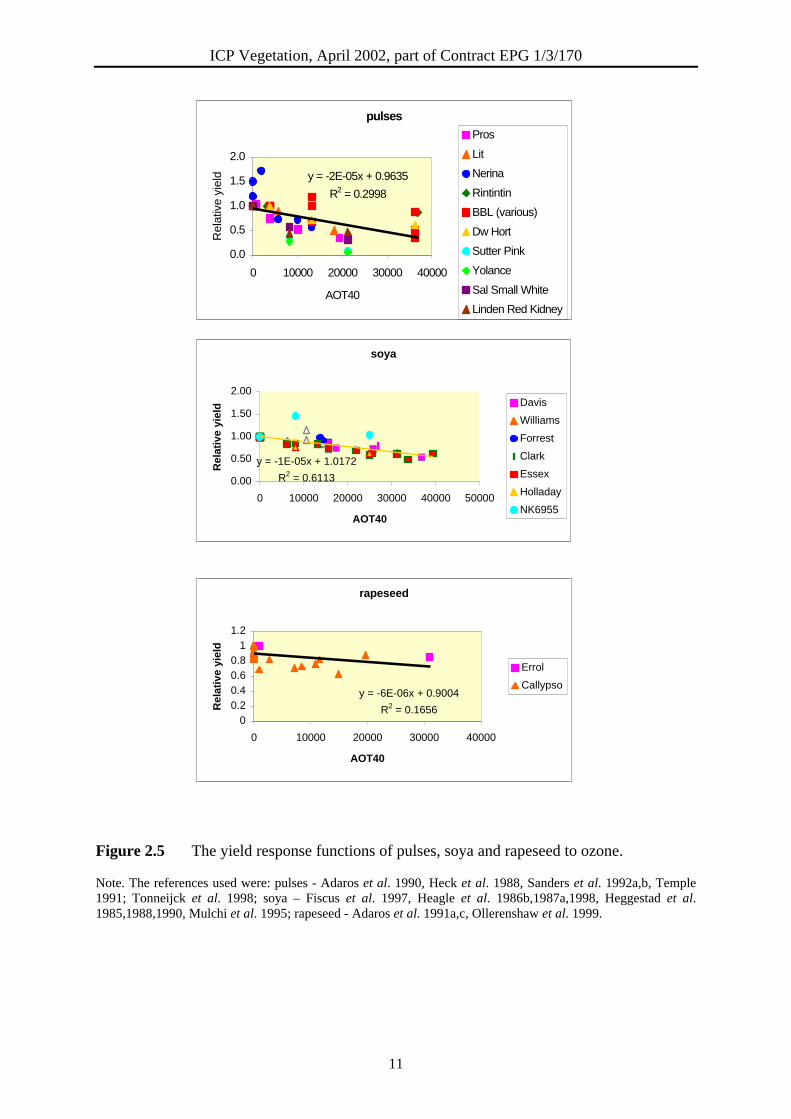
Figure 2.5 The yield response functions of pulses, soya and rapeseed to ozone.
Note. The references used were: pulses - Adaros et al. 1990, Heck et al. 1988, Sanders et al. 1992a,b, Temple1991; Tonneijck et al. 1998; soya – Fiscus et al. 1997, Heagle et al. 1986b,1987a,1998, Heggestad et al.1985,1988,1990, Mulchi et al. 1995; rapeseed - Adaros et al. 1991a,c, Ollerenshaw et al. 1999.
pulses
y = -2E-05x + 0.9635
R2 = 0.2998
0.0
0.5
1.0
1.5
2.0
0 10000 20000 30000 40000
AOT40
Rel
ativ
e yi
eld
Pros
Lit
Nerina
Rintintin
BBL (various)
Dw Hort
Sutter Pink
Yolance
Sal Small White
Linden Red Kidney
rapeseed
y = -6E-06x + 0.9004
R2 = 0.16560
0.2
0.4
0.6
0.8
1
1.2
0 10000 20000 30000 40000
AOT40
Rel
ativ
e yi
eld
Errol
Callypso
soya
y = -1E-05x + 1.0172
R2 = 0.61130.00
0.50
1.00
1.50
2.00
0 10000 20000 30000 40000 50000
AOT40
Rel
ativ
e yi
eld Davis
Williams
Forrest
Clark
Essex
Holladay
NK6955
ICP Vegetation, April 2002, part of Contract EPG 1/3/170
12
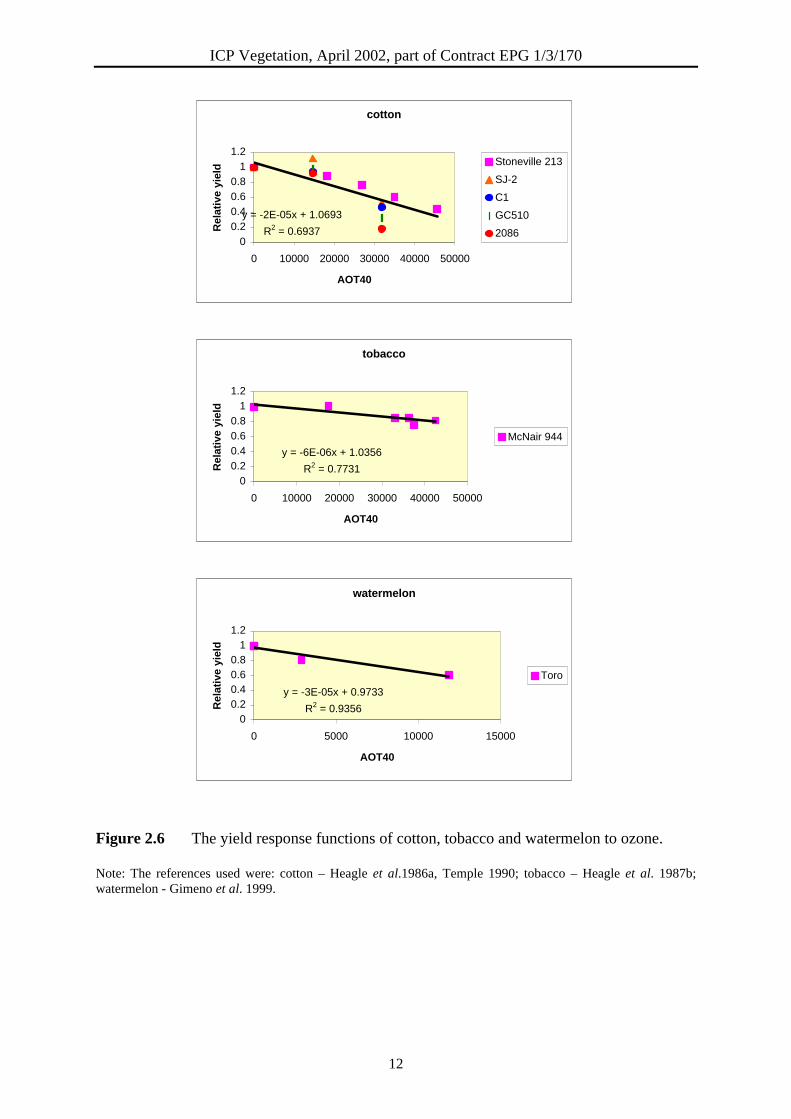
Figure 2.6 The yield response functions of cotton, tobacco and watermelon to ozone.
Note: The references used were: cotton – Heagle et al.1986a, Temple 1990; tobacco – Heagle et al. 1987b;watermelon - Gimeno et al. 1999.
cotton
y = -2E-05x + 1.0693
R2 = 0.69370
0.2
0.4
0.6
0.8
1
1.2
0 10000 20000 30000 40000 50000
AOT40
Rel
ativ
e yi
eld Stoneville 213
SJ-2
C1
GC510
2086
tobacco
y = -6E-06x + 1.0356
R2 = 0.77310
0.2
0.4
0.6
0.8
1
1.2
0 10000 20000 30000 40000 50000
AOT40
Rel
ativ
e yi
eld
McNair 944
watermelon
y = -3E-05x + 0.9733
R2 = 0.93560
0.20.40.60.8
11.2
0 5000 10000 15000
AOT40
Rel
ativ
e yi
eld
Toro
ICP Vegetation, April 2002, part of Contract EPG 1/3/170
13
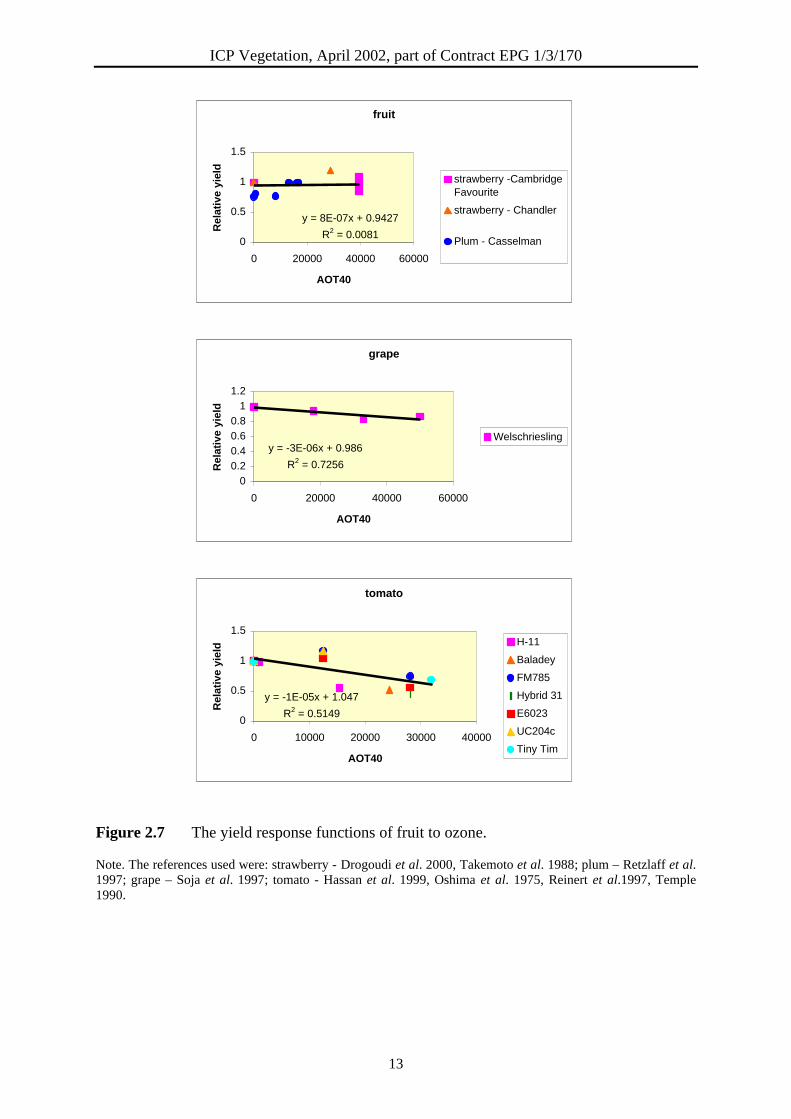
Figure 2.7 The yield response functions of fruit to ozone.
Note. The references used were: strawberry - Drogoudi et al. 2000, Takemoto et al. 1988; plum – Retzlaff et al.1997; grape – Soja et al. 1997; tomato - Hassan et al. 1999, Oshima et al. 1975, Reinert et al.1997, Temple1990.
fruit
y = 8E-07x + 0.9427
R2 = 0.00810
0.5
1
1.5
0 20000 40000 60000
AOT40
Rel
ativ
e yi
eld
strawberry -CambridgeFavourite
strawberry - Chandler
Plum - Casselman
grape
y = -3E-06x + 0.986
R2 = 0.7256
0
0.2
0.4
0.6
0.8
1
1.2
0 20000 40000 60000
AOT40
Rel
ativ
e yi
eld
Welschriesling
tomato
y = -1E-05x + 1.047
R2 = 0.51490
0.5
1
1.5
0 10000 20000 30000 40000
AOT40
Rel
ativ
e yi
eld H-11
Baladey
FM785
Hybrid 31
E6023
UC204c
Tiny Tim
ICP Vegetation, April 2002, part of Contract EPG 1/3/170
14
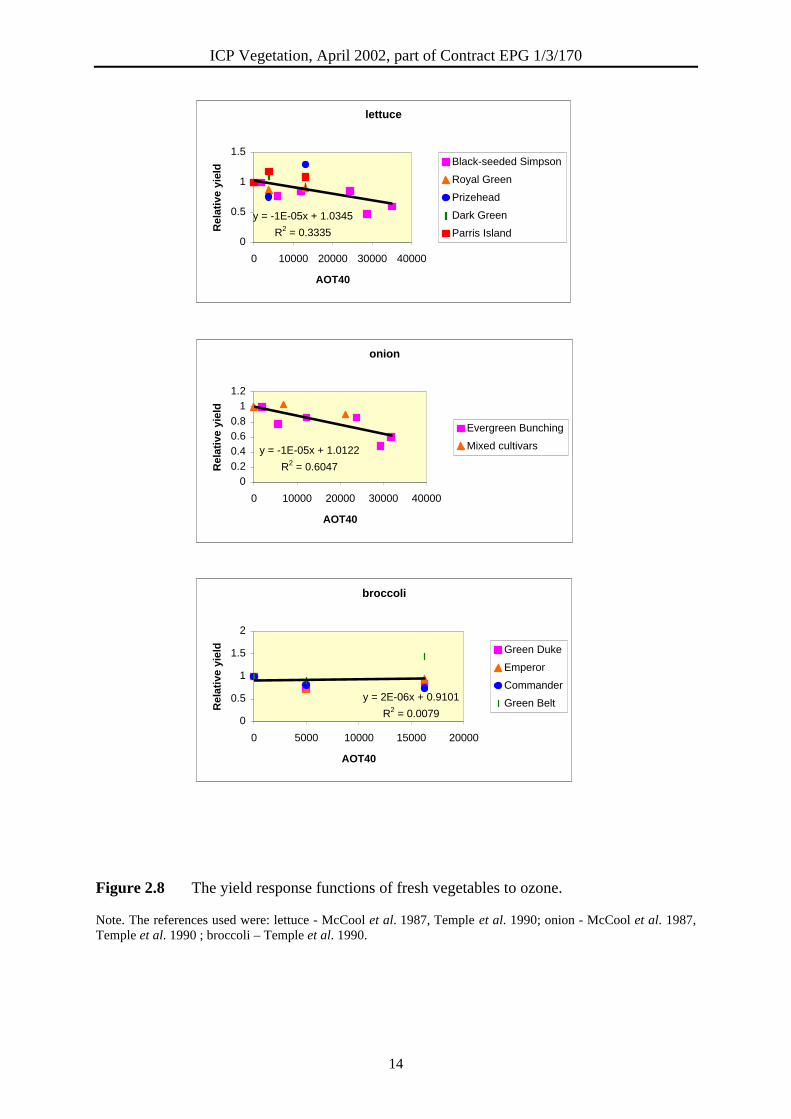
Figure 2.8 The yield response functions of fresh vegetables to ozone.
Note. The references used were: lettuce - McCool et al. 1987, Temple et al. 1990; onion - McCool et al. 1987,Temple et al. 1990 ; broccoli – Temple et al. 1990.
lettuce
y = -1E-05x + 1.0345
R2 = 0.33350
0.5
1
1.5
0 10000 20000 30000 40000
AOT40
Rel
ativ
e yi
eld Black-seeded Simpson
Royal Green
Prizehead
Dark Green
Parris Island
onion
y = -1E-05x + 1.0122
R2 = 0.60470
0.2
0.4
0.6
0.8
1
1.2
0 10000 20000 30000 40000
AOT40
Rel
ativ
e yi
eld
Evergreen Bunching
Mixed cultivars
broccoli
y = 2E-06x + 0.9101
R2 = 0.00790
0.5
1
1.5
2
0 5000 10000 15000 20000
AOT40
Rel
ativ
e yi
eld Green Duke
Emperor
Commander
Green Belt
ICP Vegetation, April 2002, part of Contract EPG 1/3/170
15
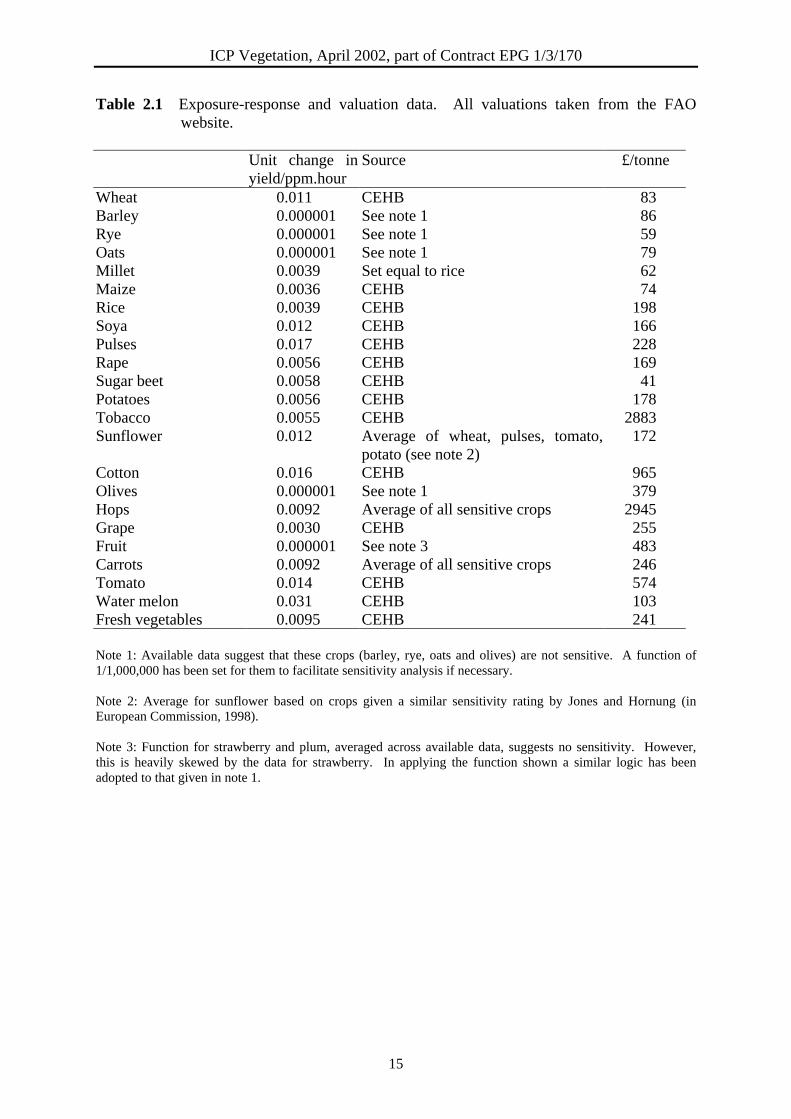
Table 2.1 Exposure-response and valuation data. All valuations taken from the FAOwebsite.
Unit change inyield/ppm.hour
Source £/tonne
Wheat 0.011 CEHB 83Barley 0.000001 See note 1 86Rye 0.000001 See note 1 59Oats 0.000001 See note 1 79Millet 0.0039 Set equal to rice 62Maize 0.0036 CEHB 74Rice 0.0039 CEHB 198Soya 0.012 CEHB 166Pulses 0.017 CEHB 228Rape 0.0056 CEHB 169Sugar beet 0.0058 CEHB 41Potatoes 0.0056 CEHB 178Tobacco 0.0055 CEHB 2883Sunflower 0.012 Average of wheat, pulses, tomato,
potato (see note 2)172
Cotton 0.016 CEHB 965Olives 0.000001 See note 1 379Hops 0.0092 Average of all sensitive crops 2945Grape 0.0030 CEHB 255Fruit 0.000001 See note 3 483Carrots 0.0092 Average of all sensitive crops 246Tomato 0.014 CEHB 574Water melon 0.031 CEHB 103Fresh vegetables 0.0095 CEHB 241
Note 1: Available data suggest that these crops (barley, rye, oats and olives) are not sensitive. A function of1/1,000,000 has been set for them to facilitate sensitivity analysis if necessary.
Note 2: Average for sunflower based on crops given a similar sensitivity rating by Jones and Hornung (inEuropean Commission, 1998).
Note 3: Function for strawberry and plum, averaged across available data, suggests no sensitivity. However,this is heavily skewed by the data for strawberry. In applying the function shown a similar logic has beenadopted to that given in note 1.

ICP Vegetation, April 2002, part of Contract EPG 1/3/170
16
ICP Vegetation, April 2002, part of Contract EPG 1/3/170
17
3 SCENARIOS AND OZONE DATA
Crop yield changes have been assessed against four of the scenarios used in the negotiationson the Gothenburg Protocol:
• 1990 baseline – ozone levels in Europe with emissions of NOx and VOCs at 1990 levels.• 2010 Reference - ozone levels in Europe with emissions of NOx and VOCs at levels
forecast for 2010 if all legislation current and in the pipeline prior to Gothenburg isimplemented according to IIASA’s estimates.
• GP (Gothenburg Protocol) – ozone levels in 2010 with exact compliance againstGothenburg limits.
• J1 – ozone levels in 2010 under the original proposal for Gothenburg.
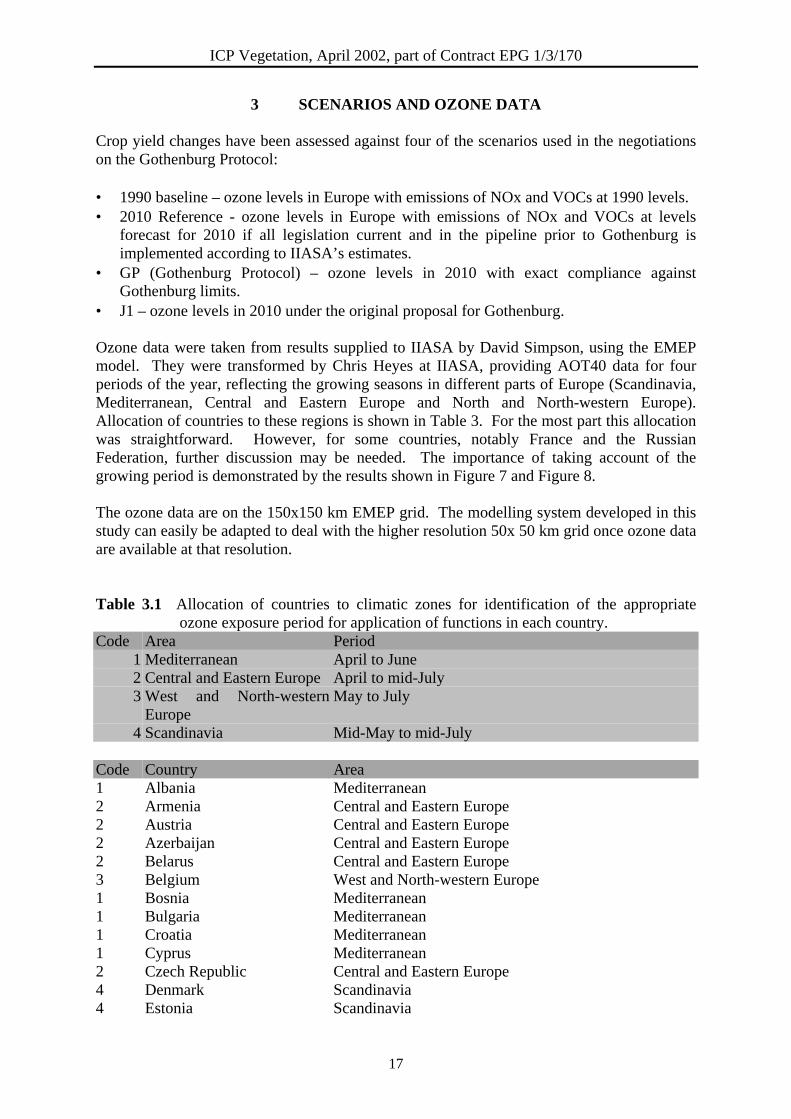
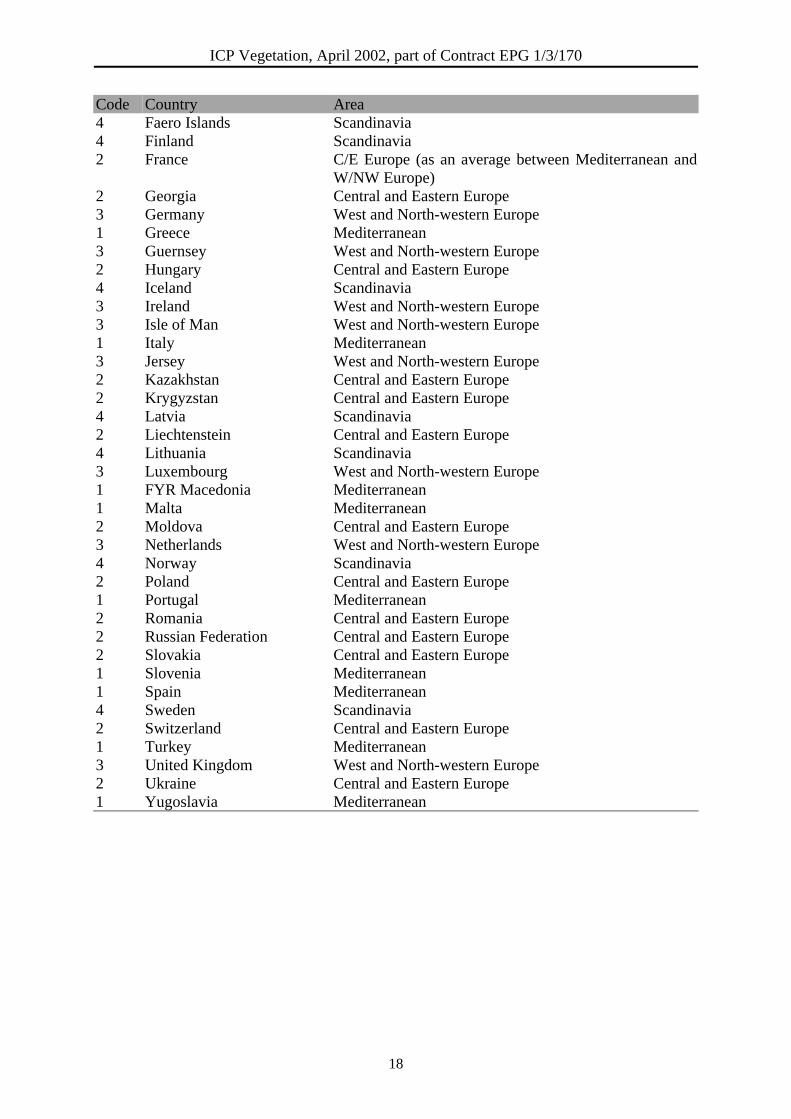
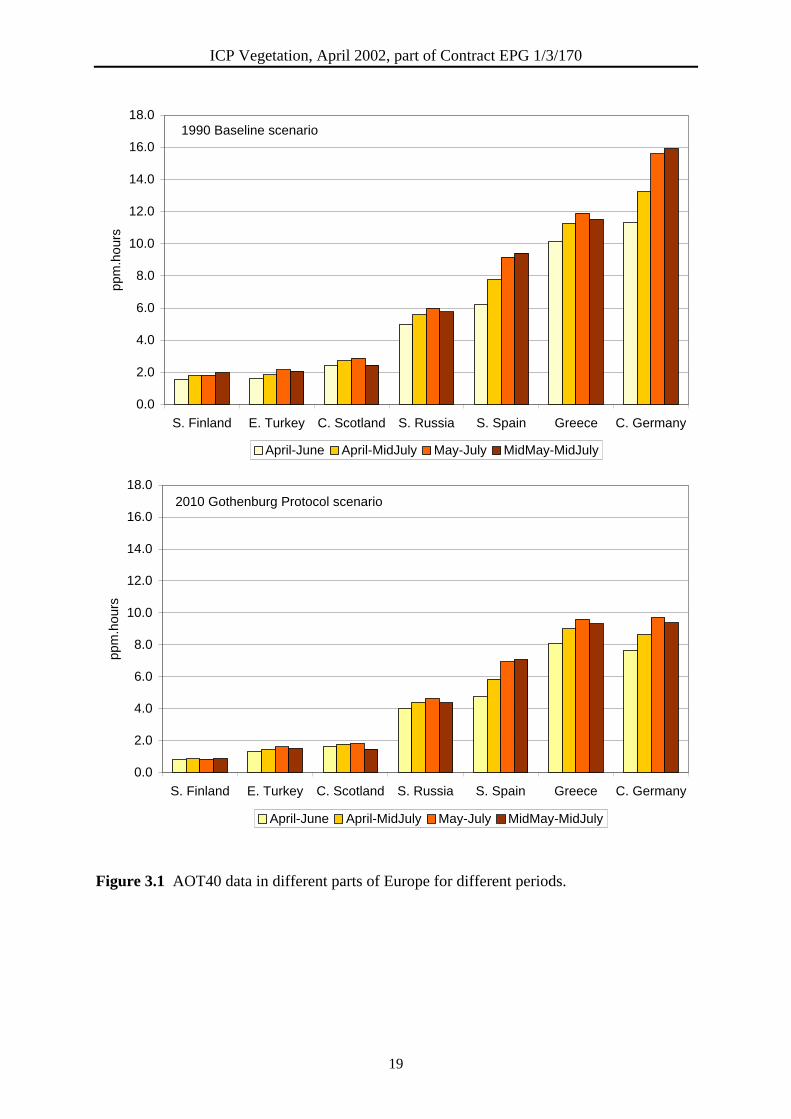
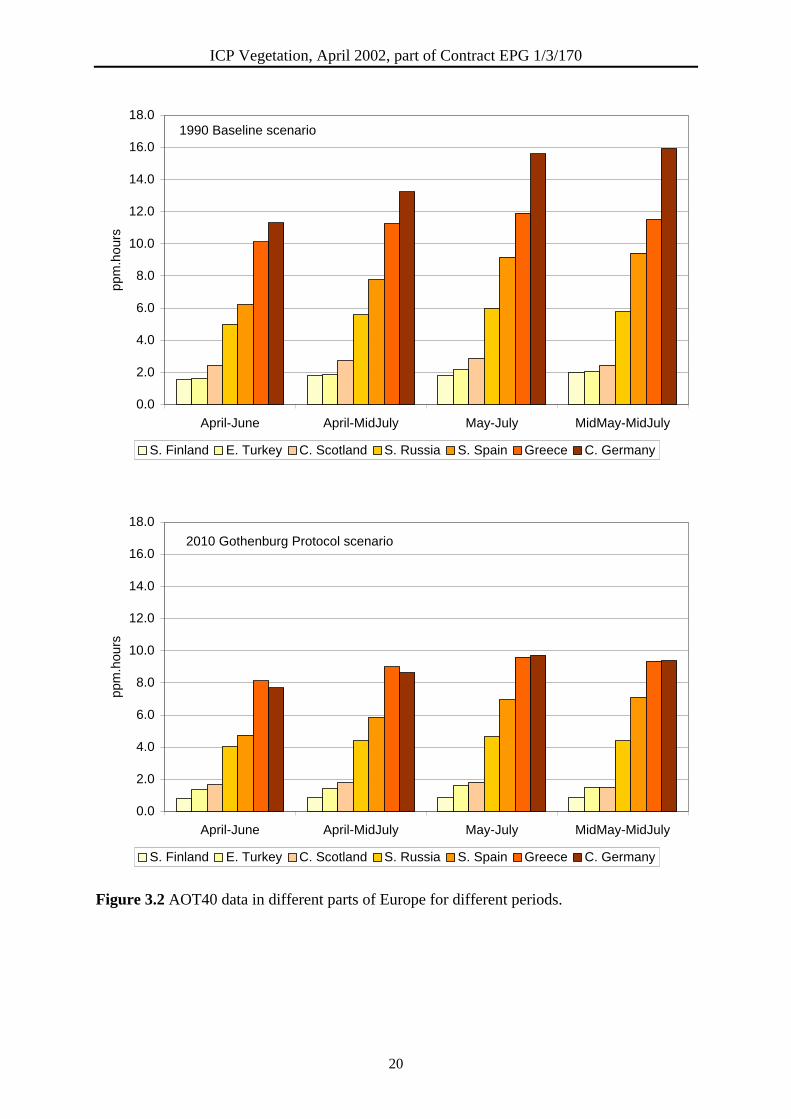
Ozone data were taken from results supplied to IIASA by David Simpson, using the EMEPmodel. They were transformed by Chris Heyes at IIASA, providing AOT40 data for fourperiods of the year, reflecting the growing seasons in different parts of Europe (Scandinavia,Mediterranean, Central and Eastern Europe and North and North-western Europe).Allocation of countries to these regions is shown in Table 3. For the most part this allocationwas straightforward. However, for some countries, notably France and the RussianFederation, further discussion may be needed. The importance of taking account of thegrowing period is demonstrated by the results shown in Figure 7 and Figure 8.
The ozone data are on the 150x150 km EMEP grid. The modelling system developed in thisstudy can easily be adapted to deal with the higher resolution 50x 50 km grid once ozone dataare available at that resolution.
Table 3.1 Allocation of countries to climatic zones for identification of the appropriateozone exposure period for application of functions in each country.
Code Area Period1 Mediterranean April to June2 Central and Eastern Europe April to mid-July3 West and North-western
EuropeMay to July
4 Scandinavia Mid-May to mid-July
Code Country Area1 Albania Mediterranean2 Armenia Central and Eastern Europe2 Austria Central and Eastern Europe2 Azerbaijan Central and Eastern Europe2 Belarus Central and Eastern Europe3 Belgium West and North-western Europe1 Bosnia Mediterranean1 Bulgaria Mediterranean1 Croatia Mediterranean1 Cyprus Mediterranean2 Czech Republic Central and Eastern Europe4 Denmark Scandinavia4 Estonia Scandinavia
ICP Vegetation, April 2002, part of Contract EPG 1/3/170
18
Code Country Area4 Faero Islands Scandinavia4 Finland Scandinavia2 France C/E Europe (as an average between Mediterranean and
W/NW Europe)2 Georgia Central and Eastern Europe3 Germany West and North-western Europe1 Greece Mediterranean3 Guernsey West and North-western Europe2 Hungary Central and Eastern Europe4 Iceland Scandinavia3 Ireland West and North-western Europe3 Isle of Man West and North-western Europe1 Italy Mediterranean3 Jersey West and North-western Europe2 Kazakhstan Central and Eastern Europe2 Krygyzstan Central and Eastern Europe4 Latvia Scandinavia2 Liechtenstein Central and Eastern Europe4 Lithuania Scandinavia3 Luxembourg West and North-western Europe1 FYR Macedonia Mediterranean1 Malta Mediterranean2 Moldova Central and Eastern Europe3 Netherlands West and North-western Europe4 Norway Scandinavia2 Poland Central and Eastern Europe1 Portugal Mediterranean2 Romania Central and Eastern Europe2 Russian Federation Central and Eastern Europe2 Slovakia Central and Eastern Europe1 Slovenia Mediterranean1 Spain Mediterranean4 Sweden Scandinavia2 Switzerland Central and Eastern Europe1 Turkey Mediterranean3 United Kingdom West and North-western Europe2 Ukraine Central and Eastern Europe1 Yugoslavia Mediterranean
ICP Vegetation, April 2002, part of Contract EPG 1/3/170
19
0.0
2.0
4.0
6.0
8.0
10.0
12.0
14.0
16.0
18.0
S. Finland E. Turkey C. Scotland S. Russia S. Spain Greece C. Germany
ppm
.hou
rs
April-June April-MidJuly May-July MidMay-MidJuly
1990 Baseline scenario
0.0
2.0
4.0
6.0
8.0
10.0
12.0
14.0
16.0
18.0
S. Finland E. Turkey C. Scotland S. Russia S. Spain Greece C. Germany
ppm
.hou
rs
April-June April-MidJuly May-July MidMay-MidJuly
2010 Gothenburg Protocol scenario
Figure 3.1 AOT40 data in different parts of Europe for different periods.
ICP Vegetation, April 2002, part of Contract EPG 1/3/170
20
0.0
2.0
4.0
6.0
8.0
10.0
12.0
14.0
16.0
18.0
April-June April-MidJuly May-July MidMay-MidJuly
ppm
.hou
rs
S. Finland E. Turkey C. Scotland S. Russia S. Spain Greece C. Germany
1990 Baseline scenario
0.0
2.0
4.0
6.0
8.0
10.0
12.0
14.0
16.0
18.0
April-June April-MidJuly May-July MidMay-MidJuly
ppm
.hou
rs
S. Finland E. Turkey C. Scotland S. Russia S. Spain Greece C. Germany
2010 Gothenburg Protocol scenario
Figure 3.2 AOT40 data in different parts of Europe for different periods.
ICP Vegetation, April 2002, part of Contract EPG 1/3/170
21
4 MAPPING OF AGRICULTURAL AREAS AND CROP YIELD DATA
4.1 Agricultural areas
The spatial delimitation of agricultural areas has formed one component of the updated landcover mapping performed at SEIY by Howard Cambridge and Steve Cinderby. The updatedland cover mapping has been completed in discrete data layers (forests, semi-naturalvegetation, urban, water bodies etc.). Each data layer has been created by combining variousexisting land cover data sets using the most appropriate method of combination. For thedelimitation of agricultural areas and their linkage to the crop production statistics three datalayers were combined:
Data Layers IGBP Global Land Cover (GLC) agricultural informationSEI Land Cover agricultural informationBartholomew Country and NUTS region boundaries
Areas of potential agriculture across Europe were identified by excluding polygonsclassified on the updated SEI land cover map as forest, semi-natural vegetation, urban andwater. The extent of agriculture in the remaining areas was then determined by combiningthe GLC agricultural data with the existing SEI agricultural map.
The GLC classification of agricultural classes has been the dominant data source used tospatially delimit the distribution and type of crop lands across Europe. The existing SEI landcover map originally only contained information on the dominant crop by country generatedfrom FAO and EU statistics. This classification has now been superseded.
The GLC map was converted into three data layers. Firstly the areas which were purelyagricultural were identified, for example, "Cropland (Winter Wheat, Small Grains)".Secondly the areas that were of mixed classes combined with forestry were delimited, forexample, "Cropland (Rice, Wheat) with Woodland". For these polygons the areas thatoverlapped with forestry (as previously identified on an updated land cover layer) wereexcluded with the remaining areas classified as agriculture (with the classification obtainedfrom the GLC land cover class). Thirdly, areas that were mixed classes of agriculture,forestry and grassland were identified, for example, "Cropland and Pasture (Wheat, Orchards,Vineyards) with Woodland". In these polygons the area that overlapped with the existingforestry layer were excluded. The existing SEI agriculture map was then used to differentiatethe extent of cropland from pasture.
The existing SEI land cover map was used to identify the extent of agriculture across Europebut with no classification of the type of cropland. The distribution and classification ofhorticulture was derived from the existing SEI land cover data base.
The five maps were combined in the geographic information system (GIS) using uniqueconditions modelling and the resulting table exported in a spreadsheet to determine theclassification and distribution of agriculture and horticulture. The classes obtained from theGLC map took precedence in the revised data set except for the areas horticulture which wereidentified from the SEI data layer. The reclassified data contained approximately 250discrete classes. This spatial database was then combined with the agricultural statistics to
ICP Vegetation, April 2002, part of Contract EPG 1/3/170
22
obtain an assessment of the location, type and yield of crop in countries and regions acrossEurope.
4.2 Linking the revised agricultural map to agricultural production statistics
In order to combine the spatial database with the statistical crop information the agriculturalmap was overlaid with data sets showing the distribution of country boundaries, distributionof European NUTS level II areas and the EMEP 50km grid using unique conditionmodelling. This produced a database onto which country and NUTS specific information onyield and crop coverage could be appended and the results analysed by EMEP grid square.This data was then combined with statistical information from the EUROSTAT AgriculturalStatistics for EU NUTS Level II and the FAO AGROSTAT Agricultural Statistics for theremaining European Countries.
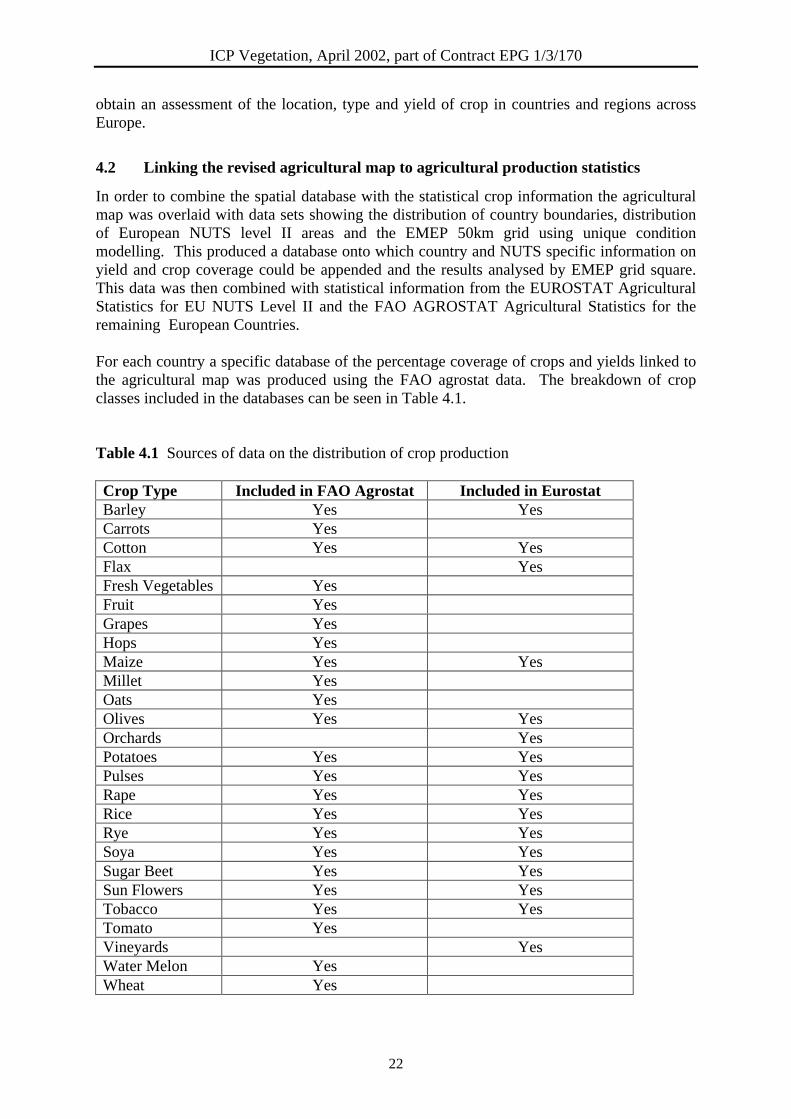
For each country a specific database of the percentage coverage of crops and yields linked tothe agricultural map was produced using the FAO agrostat data. The breakdown of cropclasses included in the databases can be seen in Table 4.1.
Table 4.1 Sources of data on the distribution of crop production
Crop Type Included in FAO Agrostat Included in EurostatBarley Yes YesCarrots YesCotton Yes YesFlax YesFresh Vegetables YesFruit YesGrapes YesHops YesMaize Yes YesMillet YesOats YesOlives Yes YesOrchards YesPotatoes Yes YesPulses Yes YesRape Yes YesRice Yes YesRye Yes YesSoya Yes YesSugar Beet Yes YesSun Flowers Yes YesTobacco Yes YesTomato YesVineyards YesWater Melon YesWheat Yes
ICP Vegetation, April 2002, part of Contract EPG 1/3/170
23
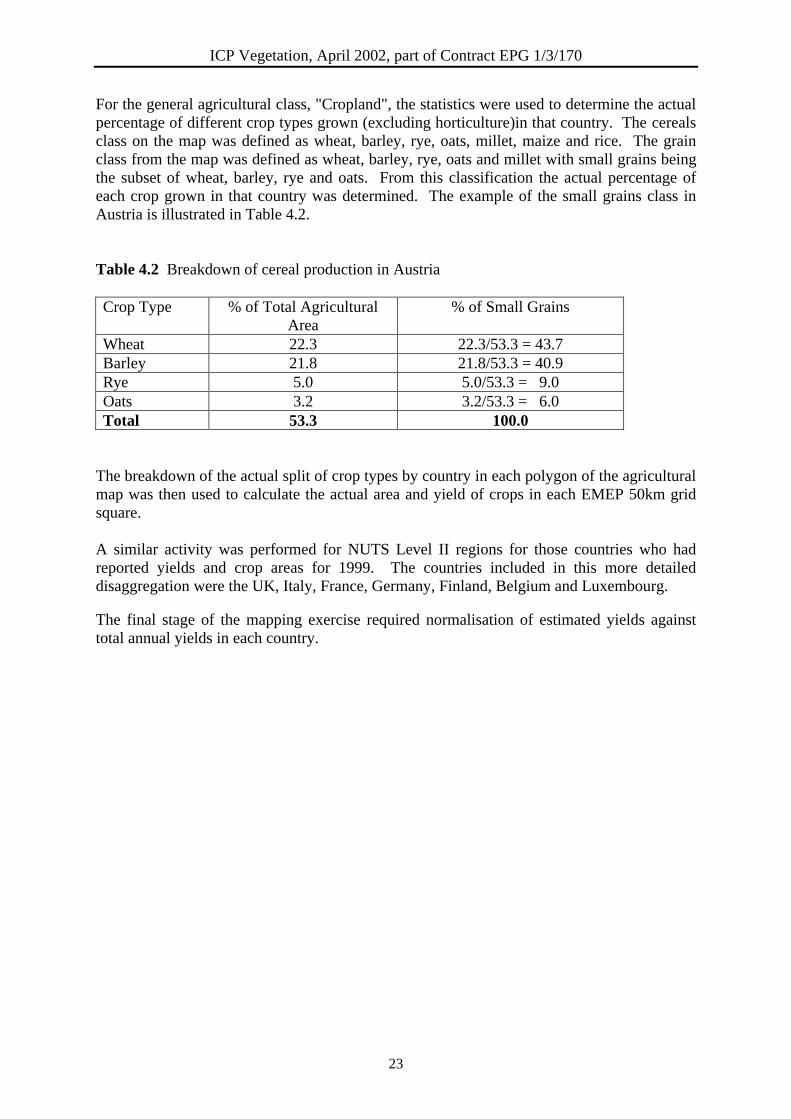
For the general agricultural class, "Cropland", the statistics were used to determine the actualpercentage of different crop types grown (excluding horticulture)in that country. The cerealsclass on the map was defined as wheat, barley, rye, oats, millet, maize and rice. The grainclass from the map was defined as wheat, barley, rye, oats and millet with small grains beingthe subset of wheat, barley, rye and oats. From this classification the actual percentage ofeach crop grown in that country was determined. The example of the small grains class inAustria is illustrated in Table 4.2.
Table 4.2 Breakdown of cereal production in Austria
Crop Type % of Total AgriculturalArea
% of Small Grains
Wheat 22.3 22.3/53.3 = 43.7Barley 21.8 21.8/53.3 = 40.9Rye 5.0 5.0/53.3 = 9.0Oats 3.2 3.2/53.3 = 6.0Total 53.3 100.0
The breakdown of the actual split of crop types by country in each polygon of the agriculturalmap was then used to calculate the actual area and yield of crops in each EMEP 50km gridsquare.
A similar activity was performed for NUTS Level II regions for those countries who hadreported yields and crop areas for 1999. The countries included in this more detaileddisaggregation were the UK, Italy, France, Germany, Finland, Belgium and Luxembourg.
The final stage of the mapping exercise required normalisation of estimated yields againsttotal annual yields in each country.

ICP Vegetation, April 2002, part of Contract EPG 1/3/170
24
ICP Vegetation, April 2002, part of Contract EPG 1/3/170
25
5 RESULTS OF ECONOMIC ASSESSMENT
5.1 Results by crop, scenario and country
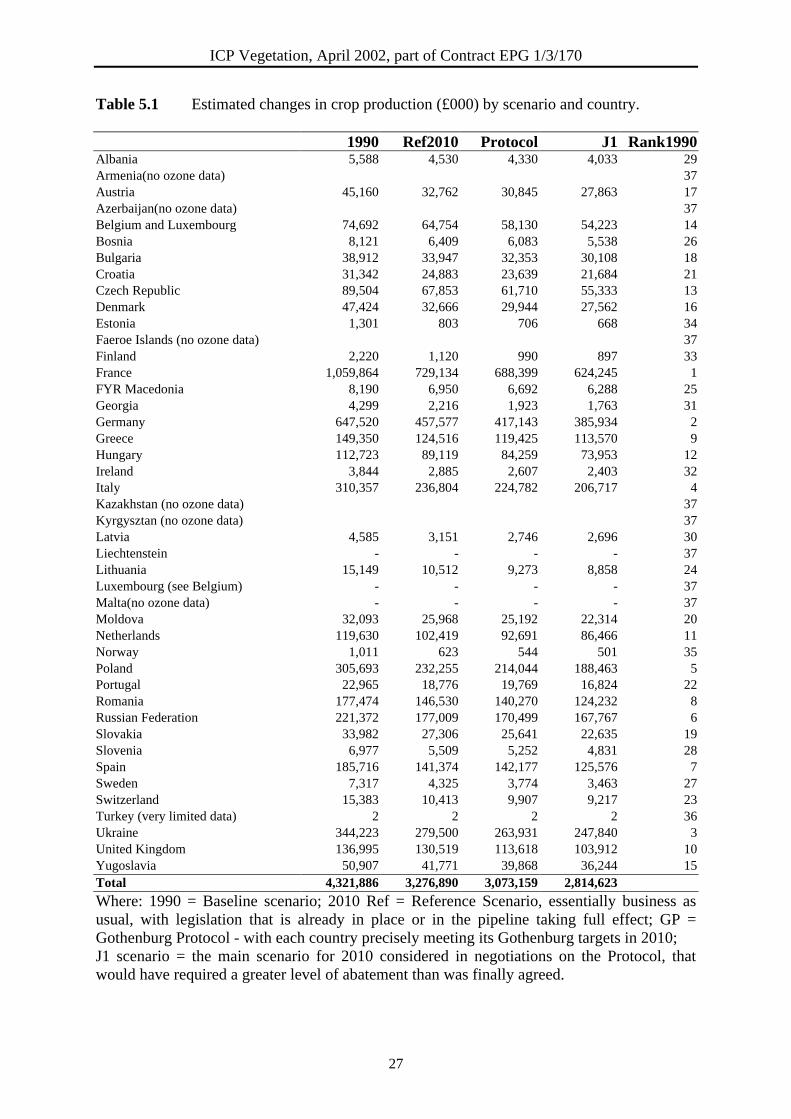
The results by scenario and country are summarised in Table 6 for 1990 and the three 2010emission scenarios. Losses for agricultural and horticultural crops are included, but anyeffects of reductions in pasture quality/quantity on animal and milk production are not(however, see section 6.2).
Losses for 1990 are estimated at £4.3 billion across Europe, falling to £3.1 billion assumingimplementation of the Gothenburg protocol across Europe in 2010. The highest losses incrop production for 1990, the reference year, are predicted for France (£1.1 billion) andGermany (£0.6 billion), with losses of over £136 million predicted for the UK. Thedifferences between individual countries reflect the crops grown, level of agriculturalproduction, timing of crop growth in relation to the months with the highest ozoneconcentration, climate and location in Europe in relation to emission sources, with thosecountries closest to central Europe experiencing the greatest losses in production. Thebenefits of moving to the different 2010 scenarios are shown in Table 7. Benefits are greatestin France, followed by Germany, Poland, Italy and Ukraine, reflecting the reasons just given.
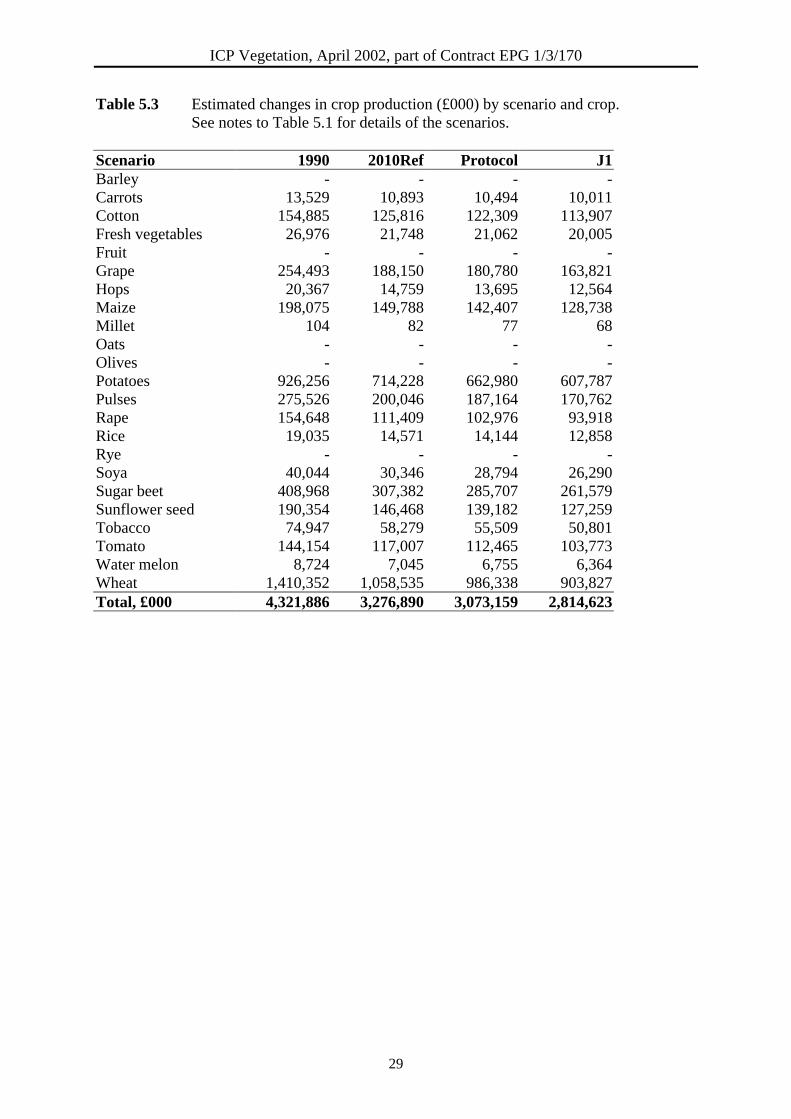
Table 8 shows total damages for each crop, by scenario. Table 9 then clearly shows thatmore than half of the damages are attributed to wheat (32%) and potato (21%). The othercrops for which damages account for more than 5% of the total are sugar beet, pulses andgrape. Whilst wheat has been studied extensively, potatoes and sugar beet have attractedlittle attention in the past. Further work on them is clearly warranted.
Appendix 1 provides a more detailed breakdown of the results, by country, emission scenarioand crop type.
5.2 Impacts on production of meat and milk
Production of meat and milk accounts for more than half of European agricultural production,so their exclusion from the analysis may lead to a significant underestimation of impacts.This section seeks to underline the need to include meat and milk and to raise discussion ofthe methods of their analysis.
In assessment of impacts to animal production (in its widest sense), it seems appropriate toexclude production of eggs, chicken, pigs and some other groups, where production is notlinked to open grazing. The impact on animals given processed feed should be minimal, tothe extent that the price of the feed is not affected by wider impacts of ozone on agriculturalproduction. These groups account for 18% of production, leaving 33% in the categories meatand milk, compared to 49% from crop production.
If it is assumed that pasture has average sensitivity compared to the other crops assessed, andthat changes in meat and milk production are linearly related with changes in pastureproduction, total damages would rise by 68% (33/49, the share of meat and milk productiondivided by crop production). This would lead to total damages (i.e. crops + meat + milk) of£7.2 billion in 1990 and £5.2 billion in 2010 under the Gothenburg Protocol, compared to£4.3 and 3.1 billion respectively (increases of £2.9 and 2.1 billion). This underlines the needto account fully for agricultural production in such assessment.
ICP Vegetation, April 2002, part of Contract EPG 1/3/170
26
Further refinements of these methods is clearly needed, drawing on the experience of expertsin animal production. Whilst the figures given here provide a ball park guide to the possiblemagnitude of impacts it must be said that it is quite possible that impacts of ozone on pasturedo not lead to any change in meat and milk production. With this in mind, it is probablyappropriate to quote changes to meat and milk production in response to the effects ofexposure to ozone as a range from £0 to 2.9 billion in 1990, and £0 to 2.1 billion in 2010under Gothenburg.
ICP Vegetation, April 2002, part of Contract EPG 1/3/170
27
Table 5.1 Estimated changes in crop production (£000) by scenario and country.
1990 Ref2010 Protocol J1 Rank1990Albania 5,588 4,530 4,330 4,033 29Armenia(no ozone data) 37Austria 45,160 32,762 30,845 27,863 17Azerbaijan(no ozone data) 37Belgium and Luxembourg 74,692 64,754 58,130 54,223 14Bosnia 8,121 6,409 6,083 5,538 26Bulgaria 38,912 33,947 32,353 30,108 18Croatia 31,342 24,883 23,639 21,684 21Czech Republic 89,504 67,853 61,710 55,333 13Denmark 47,424 32,666 29,944 27,562 16Estonia 1,301 803 706 668 34Faeroe Islands (no ozone data) 37Finland 2,220 1,120 990 897 33France 1,059,864 729,134 688,399 624,245 1FYR Macedonia 8,190 6,950 6,692 6,288 25Georgia 4,299 2,216 1,923 1,763 31Germany 647,520 457,577 417,143 385,934 2Greece 149,350 124,516 119,425 113,570 9Hungary 112,723 89,119 84,259 73,953 12Ireland 3,844 2,885 2,607 2,403 32Italy 310,357 236,804 224,782 206,717 4Kazakhstan (no ozone data) 37Kyrgysztan (no ozone data) 37Latvia 4,585 3,151 2,746 2,696 30Liechtenstein - - - - 37Lithuania 15,149 10,512 9,273 8,858 24Luxembourg (see Belgium) - - - - 37Malta(no ozone data) - - - - 37Moldova 32,093 25,968 25,192 22,314 20Netherlands 119,630 102,419 92,691 86,466 11Norway 1,011 623 544 501 35Poland 305,693 232,255 214,044 188,463 5Portugal 22,965 18,776 19,769 16,824 22Romania 177,474 146,530 140,270 124,232 8Russian Federation 221,372 177,009 170,499 167,767 6Slovakia 33,982 27,306 25,641 22,635 19Slovenia 6,977 5,509 5,252 4,831 28Spain 185,716 141,374 142,177 125,576 7Sweden 7,317 4,325 3,774 3,463 27Switzerland 15,383 10,413 9,907 9,217 23Turkey (very limited data) 2 2 2 2 36Ukraine 344,223 279,500 263,931 247,840 3United Kingdom 136,995 130,519 113,618 103,912 10Yugoslavia 50,907 41,771 39,868 36,244 15Total 4,321,886 3,276,890 3,073,159 2,814,623
Where: 1990 = Baseline scenario; 2010 Ref = Reference Scenario, essentially business asusual, with legislation that is already in place or in the pipeline taking full effect; GP =Gothenburg Protocol - with each country precisely meeting its Gothenburg targets in 2010;J1 scenario = the main scenario for 2010 considered in negotiations on the Protocol, thatwould have required a greater level of abatement than was finally agreed.

ICP Vegetation, April 2002, part of Contract EPG 1/3/170
28
Table 5.2 Estimated benefits of each scenario compared to 1990 (£000) by country.See notes to Table 5.1 for details of the scenarios.
Ref2010 Protocol J1 Albania 1,059 1,258 1,556 Armenia (no ozone data) - - - Austria 12,398 14,315 17,297 Azerbaijan (no ozone data) - - - Belgium and Luxembourg 9,938 16,562 20,469 Bosnia 1,712 2,039 2,583 Bulgaria 4,965 6,559 8,805 Croatia 6,458 7,702 9,658 Czech Republic 21,651 27,793 34,170 Denmark 14,759 17,480 19,862 Estonia 498 595 633 Faeroe Islands (no ozone data) - - - Finland 1,100 1,230 1,323 France 330,730 371,465 435,619 FYR Macedonia 1,240 1,498 1,902 Georgia 2,083 2,376 2,536 Germany 189,943 230,377 261,586 Greece 24,834 29,924 35,779 Hungary 23,605 28,464 38,770 Ireland 959 1,237 1,441 Italy 73,552 85,575 103,640 Kazakhstan (no ozone data) - - - Kyrgysztan (no ozone data) - - - Latvia 1,434 1,839 1,889 Liechtenstein - - - Lithuania 4,637 5,876 6,291 Luxembourg (see Belgium) - - - Malta (no ozone data) - - - Moldova 6,126 6,901 9,779 Netherlands 17,211 26,939 33,164 Norway 389 467 510 Poland 73,438 91,649 117,230 Portugal 4,189 3,196 6,141 Romania 30,944 37,204 53,241 Russian Federation 44,363 50,873 53,605 Slovakia 6,676 8,341 11,347 Slovenia 1,468 1,725 2,145 Spain 44,342 43,539 60,140 Sweden 2,993 3,543 3,855 Switzerland 4,969 5,476 6,166 Turkey (very limited data) 0 0 0 Ukraine 64,724 80,292 96,384 United Kingdom 6,476 23,376 33,083 Yugoslavia 9,135 11,039 14,662 Total 1,044,995 1,248,726 1,507,262
ICP Vegetation, April 2002, part of Contract EPG 1/3/170
29
Table 5.3 Estimated changes in crop production (£000) by scenario and crop.See notes to Table 5.1 for details of the scenarios.
Scenario 1990 2010Ref Protocol J1Barley - - - -Carrots 13,529 10,893 10,494 10,011Cotton 154,885 125,816 122,309 113,907Fresh vegetables 26,976 21,748 21,062 20,005Fruit - - - -Grape 254,493 188,150 180,780 163,821Hops 20,367 14,759 13,695 12,564Maize 198,075 149,788 142,407 128,738Millet 104 82 77 68Oats - - - -Olives - - - -Potatoes 926,256 714,228 662,980 607,787Pulses 275,526 200,046 187,164 170,762Rape 154,648 111,409 102,976 93,918Rice 19,035 14,571 14,144 12,858Rye - - - -Soya 40,044 30,346 28,794 26,290Sugar beet 408,968 307,382 285,707 261,579Sunflower seed 190,354 146,468 139,182 127,259Tobacco 74,947 58,279 55,509 50,801Tomato 144,154 117,007 112,465 103,773Water melon 8,724 7,045 6,755 6,364Wheat 1,410,352 1,058,535 986,338 903,827Total, £000 4,321,886 3,276,890 3,073,159 2,814,623

ICP Vegetation, April 2002, part of Contract EPG 1/3/170
30
Table 5.4 % damage for each scenario by crop.See notes to Table 5.1 for details of the scenarios.
Scenario 1990 2010 Ref Protocol J1Wheat 32.6% 32.3% 32.1% 32.1%Potatoes 21.4% 21.8% 21.6% 21.6%Sugar beet 9.5% 9.4% 9.3% 9.3%Pulses 6.4% 6.1% 6.1% 6.1%Grape 5.9% 5.7% 5.9% 5.8%Maize 4.6% 4.6% 4.6% 4.6%Sunflower 4.4% 4.5% 4.5% 4.5%Cotton 3.6% 3.8% 4.0% 4.0%Rape 3.6% 3.4% 3.4% 3.3%Tomato 3.3% 3.6% 3.7% 3.7%Tobacco 1.7% 1.8% 1.8% 1.8%Soya 0.9% 0.9% 0.9% 0.9%Fresh vegetables 0.6% 0.7% 0.7% 0.7%Hops 0.5% 0.5% 0.4% 0.4%Rice 0.4% 0.4% 0.5% 0.5%Carrots 0.3% 0.3% 0.3% 0.4%Water melon 0.2% 0.2% 0.2% 0.2%Millet 0.0% 0.0% 0.0% 0.0%Barley 0.0% 0.0% 0.0% 0.0%Fruit 0.0% 0.0% 0.0% 0.0%Oats 0.0% 0.0% 0.0% 0.0%Olives 0.0% 0.0% 0.0% 0.0%Rye 0.0% 0.0% 0.0% 0.0%Total, £000 100.0% 100.0% 100.0% 100.0%
ICP Vegetation, April 2002, part of Contract EPG 1/3/170
31
6 DEALING WITH UNCERTAINTIES
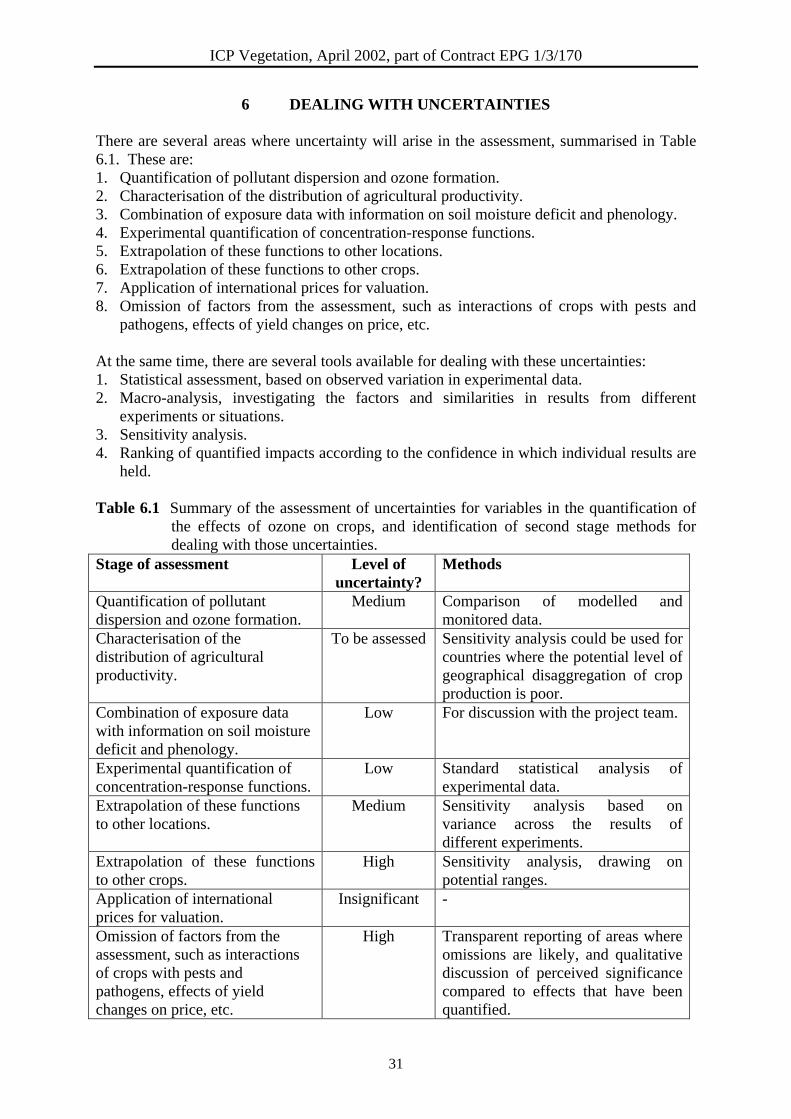
There are several areas where uncertainty will arise in the assessment, summarised in Table6.1. These are:1. Quantification of pollutant dispersion and ozone formation.2. Characterisation of the distribution of agricultural productivity.3. Combination of exposure data with information on soil moisture deficit and phenology.4. Experimental quantification of concentration-response functions.5. Extrapolation of these functions to other locations.6. Extrapolation of these functions to other crops.7. Application of international prices for valuation.8. Omission of factors from the assessment, such as interactions of crops with pests and
pathogens, effects of yield changes on price, etc.
At the same time, there are several tools available for dealing with these uncertainties:1. Statistical assessment, based on observed variation in experimental data.2. Macro-analysis, investigating the factors and similarities in results from different
experiments or situations.3. Sensitivity analysis.4. Ranking of quantified impacts according to the confidence in which individual results are
held.
Table 6.1 Summary of the assessment of uncertainties for variables in the quantification ofthe effects of ozone on crops, and identification of second stage methods fordealing with those uncertainties.
Stage of assessment Level ofuncertainty?
Methods
Quantification of pollutantdispersion and ozone formation.
Medium Comparison of modelled andmonitored data.
Characterisation of thedistribution of agriculturalproductivity.
To be assessed Sensitivity analysis could be used forcountries where the potential level ofgeographical disaggregation of cropproduction is poor.
Combination of exposure datawith information on soil moisturedeficit and phenology.
Low For discussion with the project team.
Experimental quantification ofconcentration-response functions.
Low Standard statistical analysis ofexperimental data.
Extrapolation of these functionsto other locations.
Medium Sensitivity analysis based onvariance across the results ofdifferent experiments.
Extrapolation of these functionsto other crops.
High Sensitivity analysis, drawing onpotential ranges.
Application of internationalprices for valuation.
Insignificant -
Omission of factors from theassessment, such as interactionsof crops with pests andpathogens, effects of yieldchanges on price, etc.
High Transparent reporting of areas whereomissions are likely, and qualitativediscussion of perceived significancecompared to effects that have beenquantified.
ICP Vegetation, April 2002, part of Contract EPG 1/3/170
32
The ideal treatment of each of the areas listed above where uncertainty will appear variesfrom case to case. For example, consideration of the error in exposure-response functionsfrom experimental observation should be carried out using standard statistical techniques.Extrapolation of the results cannot be done this way because it involves application of data tosituations where (presumably) there is no specific data available. Under this circumstance itwould be more appropriate to use the results of a macro-analysis (if possible) or sensitivityanalysis. A quantified treatment of uncertainty is not presented here as the importance of thevarious elements of uncertainty needs to be debated by a wider audience, and because therelative importance of the uncertainties in the assessment of ozone damage to crops needs tobe put in the context of pollution abatement costs and the benefits of reducing other impacts,for example on health. However, the study has succeeded in elaborating a framework fordescribing uncertainty when it is needed.
ICP Vegetation, April 2002, part of Contract EPG 1/3/170
33
7 FUTURE WORK
The study has focussed on developing the computational framework for the analysis. Theframework developed can easily be adapted to accept new data as needed, includingextension of the crops and other agricultural products covered.
Future work will need to address the following issues in particular:1. Irrigation of crops;2. Higher resolution ozone data;3. The consequences of visible injury on price;4. Interactions between ozone and pests and pathogens;5. Impacts on livestock;6. Consideration of the wider economic consequences of yield changes. Here, analysis has
simply multiplied changes in crop yield by world market price to assess the reduction indamages as emissions fall.
With respect to experimental work it is suggested that the relative importance of the differentcrops as estimated here be used as input to deciding which should be used in futureexperimental work. We suggest that potatoes, in particular, need further assessment.
The first three of these improvements can easily be factored in once data are available. Withrespect to issue 4, available data suggest that ozone signifiantly worsens the effects of pests.Further work on issue 6 (broader economic changes) is currently being undertaken by HarrisNeeliah at the University of Reading.
ICP Vegetation, April 2002, part of Contract EPG 1/3/170
34
ICP Vegetation, April 2002, part of Contract EPG 1/3/170
35
8 CONCLUSIONS
This substantial undertaking has involved the joining of three areas of work:• Derivation of crop response functions from information published in over 800 journal
papers and reports (by Alan Buse, CEHB);• Mapping of agricultural areas by crops and compilation of production data (by Howard
Cambridge and Steve Cinderby, SEI-Y); and• Use of EMEP 2010 emission scenarios to calculate ozone-induced losses for each crop in
each LRTAP country in Europe for 2010Ref (business as usual with current legislation),implementation of the Gothenburg Protocol, and J1 (a scenario considered in the Protocolnegotiations that required greater commitment) against 1990 as a baseline.
Results show that ozone impacts on crops are estimated to reduce production by severalbillion £ per year across Europe. Significant reductions in damage will result from existinglegislation through to 2010, though there is scope for further benefit from reducing cropexposure to ozone beyond then.
A number of areas have been identified for further work. Development of the Level IIapproach and inclusion of changes to livestock production are probably the most important ofthese. Actions are already underway elsewhere (e.g. as part of this overall project, at EMEPand at the University of Reading) that will further advance this work, when they arecomplete.
The framework that has been developed will allow predictions of ozone effects on cropproduction to be made with both more accuracy and confidence than has been possible in thepast. Although the computational demands of the system are high, the flexibility of theframework will permit future improvements in data and methods to be factored in very easily.

ICP Vegetation, April 2002, part of Contract EPG 1/3/170
36
ICP Vegetation, April 2002, part of Contract EPG 1/3/170
37
9 REFERENCES
Adams, R.M. and McCarl, B. (1985) Assessing the Benefits of Alternative Oxidant Standardson Agriculture: The role of Response Information. Journal of Environmental Economics andManagement 12: pp.264-276.
Adams, R.M., Crocker, T.D. and Thanavibulchai, N. (1982) An Economic Assessment of AirPollution Damages to Selected Annual Crops in Southern California. Journal of EnvironmentalEconomics and Management, 9 pp.42-58.
Adams, R.M., Glyer, J.D. & McCarl, B.A. (1988): The NCLAN economic assessment;approach, findings and implications. In: Assessment of Crop Loss from Air Pollutants. editedby Heck, WW. pp. 484-491. Elsevier: London.
Adams, R.M., Hamilton, S.A. and McCarl, B.A. (1985) An assessment of the economic effectsof ozone on US agriculture. Journal of the Air Pollution Control Association 35, pp.938-943.
Adaros, G., Weigel, H.J. and J≅ger, H.-J. (1990). Effects of incremental ozone concentrationson the yield of bush beans (Phaseolus vulgaris var. nanus (L.) Aschers.).Gartenbauwissenschaft 55: 162-167.
Adaros, G., Weigel, H.J. and J≅ger, H.-J. (1991a). Growth and yield of spring rape and springbarley as affected by chronic ozone stress. Zeitschrift F�r Pflanzenkrankheiten undPflanzenschutz 98: 513-525.
Adaros, G., Weigel, H. J. and Jager, H. J. (1991b) Concurrent exposure to SO2 and/or NO2
alters growth and yield responses of wheat and barley to low concentrations of O3. NewPhytologist, 118, 581 - 591.
Adaros, G., Weigel, H.-J. and J≅ger, H.J. (1991c). Single and interactive effects of low levelsof ozone, sulphur dioxide and nitrogen dioxide on the growth and yield of spring rape.Environmental Pollution 72: 269-286.
AEA Technology (1998) Economic Evaluation of Proposals for Ozone Air Quality Limits.Contract Report for European Commission DGXI.
AEA Technology (1999a) Economic Evaluation of Proposals for Emission Ceilings forAtmospheric Pollutants. Contract Report for European Commission DGXI.
AEA Technology (1999b) Cost-Benefit Analysis for the Protocol to Abate Acidification,Eutrophication and Ground Level Ozone in Europe. Report Number: Air and Energy 133,Ministry of Housing, Spatial Planning and Environment (MVROM), Directorate Air andEnergy, ipc 640, P.O. Box 30945, 2500 GX The Hague, The Netherlands.
AED (1991) Economic Benefits of Improved Air and Water Quality on the Agricultural Sector:The Case of the Andulucian Region of Spain. Report Analysis Estadistico de Datos (AED).
Ashenden, T.W., Bell, S.A. & Rafarel, C.R. (1996a): Interactive effects of gaseous airpollutants and acid mist on two major pasture grasses. Agriculture, Ecosystems andEnvironment, 57, 1-8.
ICP Vegetation, April 2002, part of Contract EPG 1/3/170
38
Ashenden, T.W., Hunt, R., Bell, S.A., Williams, T.G., Mann, A., Booth, R.E. & Poorter, L.(1996b). Responses to SO2 pollution in 41 British herbaceous species. Functional Ecology,10, 483-490.
Ashmore, M.R. & Ainsworth, N. (1995): The effects of ozone and cutting on speciescomposition of artificial grassland communities. Functional Ecology, 9, 708-712.
Ashmore, M.R. (1984): Effects of ozone on vegetation in the United Kingdom. In: Ozone.edited by Grennfelt, P. pp. 92-104. Swedish Env. Res. Inst.: Sweden.
Ayazloo, M. and Bell, J.N.B. (1981) Studies on the tolerance to sulphur dioxide of grasspopulations in polluted areas. I. Identification of tolerant populations. New Phytologist, 83,627-643.
Badiani, M., Paolacci, A.R. Rossini, F., Bignami, C., Perani, C., Porri, A., D’Annibale, A.,Falesiedi, Maggini, A., Sermanni, G.G. & Ambrogi, R. (1996): Critical levels for the effectson durum wheat and peach trees grown in a Mediterranean environment. In: Critical levelsfor ozone in Europe: Testing and finalizing the concepts. (A UN-ECE Workshop Report).edited by Kärenlampi, L & Skärby, L. pp. 199-204. Dept. of Ecol. & Environ. Science:University of Kuopio.
Baker, C.K. and Fullwood, A.E. (1986) Leaf damage following crop spraying in winterbarley exposed to sulphur dioxide. Crop Protection 5, 365-367.
Baker, C.K., Colls, J.J., Fullwood, A.E. and Seaton, G.G.R. (1986) Depression of growth andyield in winter barley exposed to sulphur dioxide in the field. New Phytologist 104, 233-241.
Becker, K., Saurer, M., Egger, A. & Fuhrer, J. (1989): Sensitivity of white clover to ambientozone in Switzerland. New Phytologist, 112, 235-242.
Bell, J.N.B., McNeill, S., Houlden, G., Brown, V.C. & Mansfield, P.J. (1993): Atmosphericchange effect on plant pests and diseases. Parasitology, 106, 511-524.
Bell, J.N.B., Rutter, A.J. & Relton, J. (1979): Studies on the effects of low levels of SO2 onthe growth of Lolium perenne L. New Phytologist, 83, 627-643.
Bender, J. & Weigel, H.J. (1993). Crop responses to mixtures of air pollutants. In: TheEuropean Open-Top Chamber Project: Assessment of the effects of air pollutants onagricultural crops. CEC Air Pollution Research Report 48. pp. 131-139.
Bender, J., Bramm, A. and Weigel, H.J. (1999). On the importance of cultivar, growthduration, sink capacity, and yield quality for the sensitivity of sugar beet to ozone. In: CriticalLevels for Ozone - Level II. Environmental Documentation No. 115. Swiss Agency forEnvironment, Forest and Landscape, Bern, Switzerland, 215-218.
Benton, J., Fuhrer, J., Gimeno, B.S., Skärby, L. & Sanders, G. (1995): Results from theUN/ECE ICP-crops indicate the extent of exceedance of the critial levels of ozone in Europe.Water, Air and Soil Pollution, 85, 1473-1478.
Bermejo, V., Sánchez, S., Alonso, R., Elvira, S., Inclán, R., Gil, J.M. & Gimeno, B.S.(1996). Effects of ozone on the productivity of a sensitive cultivar of tomato (Lycopersicon
ICP Vegetation, April 2002, part of Contract EPG 1/3/170
39
esculentum Mill. cv. Tiny Tim) in semi-controlled conditions in the Ebro delta. PIE131.103.
Bolsinger, M. and Flukiger, W. (1989) Amino-acids changes by air pollution and aphidinfestation. Environ. Pollut., 56, 209-216.
Braun, S. & Flückiger, W. (1994): Critical levels of ambient ozone for growth of treeseedlings. In: Critical levels for ozone (A UN-ECE workshop report). Number 16. Edited byFuhrer, J & Achermann, B. pp. 88-97. Federal Research Station for Agricultural Chemistryand Environmental Hygiene: Liebefeld-Bern, Switzerland.
Braun, S. & Flückiger, W. (1995): Effects of ambient ozone on seedlings of Fagus sylvaticaand Picea abies Karst. New Phytologist, 129, 33-44.
Brewer, F., Parkhurst, W.J. & Meeks, T.K. (1988): Crop loss due to ambient ozone in theTennessee valley. Environmental Pollution, 53, 273-284.
Brown, M., Cox, R., Bull, K.R., Dyke, H., Sanders, G., Fowler, D., Smith, R. & Ashmore,M.R. (1995): Quantifying the fine scale (1 km x 1 km) exposure, dose and effects of ozone:Part 2 estimating yield losses for agricultural crops. Water, Air and Soil Pollution, 85,1485-1490.
Buse, A., Hayes, F., Posch, M. and Mills, G. (2000) An assessment of crop losses in Europedue to ozone. A report by CEH Bangor.
Colls, J.J., Sanders, G.E., Geissler, P.A., Boute, J., Galaup, S., Weigel, H.J., Brown, V.C. &Jones, M. (1993): The responses of beans exposed to air pollution in open top chambers. In:The European Open-Top Chamber Project: Assessment of the Effects of Air Pollutants onAgricultural crops. (Air Pollution Research Report, 48). pp. 65-84. EEC: .
Colvill, K.E., Bell, R.M., Roberts, T.M. and Bradshaw, A.D. (1983) The use of open-top-chambers to study the effects of air pollutants in particular SO2 on growth of ryegrass LoliumPerenne. Environmental Pollution, 31, 35-55.
Cure, W.W., Sanders, J.S. & Heagle, A.S. (1986): Crop yield response predicted withdifferent characterizations of the same ozone treatments. Journal of Environmental Quality,15, 251-254.
Davison, A.W. & Reiling, K. (1995): A rapid change in ozone resistance of Plantago majorafter summers with high ozone concentrations. New Phytologist, 131, 337-344.
De Temmerman, L., Bindi, M., Craigon, J., Fangmeier, A., Hacour, A., Pleijel, H.Vandermeiren, K, Vorne, V. and Wolf, J. (2000). CHIP – Cnamging climate and potentialimpacts on potato yield and quality. Final Report for Environment and Climate ResearchProgramme, Commission of the European Union. Veterinary and Agrochemical ResearchCentre, Tervuren.
De Temmerman, L., Vandermeiren, K. and Guns, M. (1992). Effects of air filtration onspring wheat grown in open-top field chambers at a rural site: I. Effect on growth, yield anddry matter partitioning. Environmental Pollution 77: 1-5.
ICP Vegetation, April 2002, part of Contract EPG 1/3/170
40
Donnelly, A., Craigon, J., Black, C.R., Colls, J.J. and Landon, G. (2001). Elevated CO2
increases biomass and tuber yield in potato even at high ozone concentrations. NewPhytologist 149: 265-274.
Drogoudi, P.D. and Ashmore, M.R. (2000). Does elevated ozone have differing effects inflowering and deblossomed strawberry? New Phytologist 147: 561-569.
Eason, G., Reinert, R.A. & Simon, J.E. (1996): Sulfur dioxide-enhanced phytotoxicity ofozone to watermelon. Journal of the American Society for Horticultural Science, 121,716-721.
Eerden, L. Van Der, and Tonneijck, A. (1988) Economische Schade Door LuchtverontreinigingAnn De Gewasteelt in Nederland. Ministry of Public Housing, Physical Planning andEnvironmental Management: Leidschendam.
Elvira, S. & Gimeno, B.S. (1996): A contribution to the set up of ozone critical levels forforest trees in Mediterranean areas. Results from the exposure of Aleppo pine (Pinushalepensis Mill.) seedlings in open-top chambers. In: Critical levels for ozone in Europe.Testing and finalizing the concepts. (UN-ECE Workshop Report). edited by Kärenlampi, L& Skärby, L. pp. 169-182. Dept. of Ecol. & Environ. Sci.: University of Kuopio.
European Commission, DGXII, Science, Research and Development, JOULE (1995).Externalities of Energy - ‘ExternE’ Project, Report Number 2, Methodology.
European Commission, DGXII, Science, Research and Development, JOULE (1998).Externalities of Energy - ‘ExternE’ Project, Report Number 7, Methodology Update 1998.
Fangmeier, A. (1989) Effects of open-top fumigations with sulfur dioxide, nitrogen dioxideand ozone on the native herb layer of a beech forest. Environ. Exp. Bot. 29, 199-214.
Fiscus, E.L., Reid, C.D., Miller, J.E., and Heagle, A.S. (1997). Elevated CO2 reduced O3 fluxand O3-induced yield losses in soybeans: Possible implications for elevated CO2 studies.Journal of Experimental Botany 48: 307-313.
Freer-Smith, P.H. & Dobson, M.C. (1989): Ozone flux to Picea sitchensis (Bong.) Carr, andPicea abies (L.) Karst. during short episodes and the effects of these on transpiration andphotosynthesis. Environmental Pollution, 59, 161-176.
Fuhrer, J. & Achermann, B. (1994): Critical levels for ozone: a UN-ECE Workshop Reportno. 16. Federal Research Station for Agricultural Chemistry and Environmental Hygiene:328pp.
Fuhrer, J. (1995): Critical levels for ozone to protect agricultural crops: Interaction withwater availability. Water, Air and Soil Pollution, 85, 1355-1360.
Fuhrer, J. (1996). The critical level for effects of ozone on crops and the transfer to mapping.In: Critical levels for ozone: testing and finalising the concepts. A UN-ECE WorkshopReport. Editors: Kärenlampi, L. & Skärby, L. Department of Ecology and EnvironmentalScience: University of Kuopio. pp. 27-43.
ICP Vegetation, April 2002, part of Contract EPG 1/3/170
41
Fuhrer, J., Egger, A., Lehnherr, B., Grandjean, A. and Tschannen, W. (1989). Effects ofozone on the yield of Spring Wheat (Triticum aestivum cv. Albis) grown in open-top fieldchambers. Environmental Pollution 60, 273-289.
Fuhrer, J., Grimm, A.G., Tschannen, W., and Shariat-Madari, H. (1992). The response ofspring wheat (Triticum aestivum L.) to ozone at higher elevations: II. Changes in yield, yieldcomponents and grain quality in response to ozone flux. New Phytologist 121: 211-219.
Fumagalli, I., Ambrogi, R. and Mignanego, L. (1999). Ozone in southern Europe: UN/ECEexperiments in Italy suggest a new approach to critical levels. In: Critical Levels for ozone -Level II. Environmental Documentation No. 115. Swiss Agency for Environment, Forestsand Landscape, Berne, Switzerland, 239-242.
Gate, I.M., McNeill, S. & Ashmore, M.R. (1995): Effects of air pollution on the searchingbehaviour of an insect parasitoids. Water, Air and Soil Pollution, 85, 1425-1430.
Gerant, D., Podor, M., Grieu, P., Afif, D., Cornu, S., Morabito, D., Banvoy, J., Robin, C. &Dizegremel, P. (1996). Carbon metabolism enzyme activities and carbon partitioning inPinus halepensis Mill. exposed to mild drought and ozone. J. Plant Physiol. 148, 142-147.
Gimeno, B.S., Bermejo, V., Reinert, R.A., Zheng, Y. and Barnes, J. (1999). Adverse effectsof ambient ozone on watermelon yield and physiology at a rural site in Eastern Spain. NewPhytologist 144, 245-260.
Gimeno, B.S., Peñuelas, J., Porcuna, J.L. & Reinert, R.A. (1995): Biomonitoring ozonephytotoxicity in eastern Spain. Water, Air and Soil Pollution, 85, 1521-1526.
Gimeno, B.S., Velissariou, D., Schenone, G. & Guardans, R. (1994) Ozone effects on theMediterranean region: An overview. In: Fuhrer, J. & Acherman (eds.). Critical levels forozone. An UN-ECE workshop report. Bern, 1994.
Hassan, I.A., Bender, J. and Weigel, H.J. (1999). Effects of ozone and drought stress ongrowth, yield and physiology of tomatoes (Lycopersicon esculentum Mill. Cv. Baladey).Gartenbauwissenschaft 64: 152-157.
Heagle, A.S. & Johnson, J.W. (1979): Variable responses of soybeans to mixtures of ozoneand sulphur dioxide. Journal of Air Pollution Control Association, 29, 729.
Heagle, A.S. & Letchworth, M.B. (1982): Relationships among injury, growth and yieldresponses of soybean cultivars exposed to ozone at different light intensities. Journal ofEnvironmental Quality, 11, 690-694.
Heagle, A.S. (1989): Ozone and crop yield. Annual Review Phytopathology, 27, 397-423.
Heagle, A.S., Cure, W.W. and Rawlings, J.O. (1985). Response of turnips to chronic doses ofozone in open-top field chambers. Environmental Pollution (Series A) 38: 305-319.
Heagle, A.S., Flagler, R.B., Patterson, R.P., Lesser, V.M., Shafer, S.R. & Heck, W.W.(1987a): Injury and yield response of soybean to chronic doses of ozone and soil moisturedeficit. Crop Science, 27, 1016-1024.

ICP Vegetation, April 2002, part of Contract EPG 1/3/170
42
Heagle, A.S., Heck, W.W., Lesser, V.M. & Rawlings, J.O. (1987b): Effects of daily ozoneexposure duration and concentration fluctuation on yield of tobacco. Phytopathology, 77,856-862.
Heagle, A.S., Heck, W.W., Lesser, V.M., Rawlings, J.O. and Mowry, F.L. (1986a). Injuryand yield response of cotton to chronic doses of ozone and sulfur dioxide. Journal ofEnvironmental Quality 15: 375-382.
Heagle, A.S., Kress, L.W., Temple, P.J., Kohnt, R.J., Miller, J.E. & Heggestad, H.E. (1987c):Factors influencing ozone dose-yield response relationships in open-top field chamberstudies. In: Assessment of crop loss from air pollutants. edited by Heck, WW; Taylor, OC& Tingey, DT. pp. 141-179. Elsevier: London and New York.
Heagle, A.S., Lesser, V.M., Rawlings, J.O., Heck, W.W. and Philbeck,R.B. (1986b).Response of soybeans to chronic doses of ozone applied as constant or proportional additionsto ambient air. Phytopathology 76: 51-56.
Heagle, A.S., Miller, J.E. and Pursley, W.A. (1998). Influence of ozone stress on soybeanresponse to carbon dioxide enrichment: III. Yield and seed quality. Crop Science 38: 128-134.
Heck, W.W. (1989) Crop losses from air pollutants in the United States. In ‘Air Pollution’sToll on Forests and Crops’ (J.J. MacKenzie and M.T. El-Ashry, eds.), pp. 235-315, YaleUniversity Press, New Haven.
Heck, W.W., Cure, W.W., Rawlings, J.O., Zaragoza, L.J., Heagle, A.S., Heggestad, H.E.,Kohut, R.J., Kress, L.W. & Temple, P.J. (1984): Assessing impacts of ozone on agriculturalcrops: 1. Overview. Journal of Air Pollution Control Association, 34, 729-735.
Heck, W.W., Dunning, J.A., Reinert, R.A., Prior, S.A., Rangappa, M. and Benepal, P.S.(1988). Differential responses of four bean cultivars to chronic doses of ozone. Journal ofAmerican Society for Horticultural Science 113: 46-51.
Heck, W.W., Heagle, A.S. & Shriner, D.S. (1986): Effects on vegetation: native, crops,forests. In: Air Pollution. (Supplement to air pollutants, their transformation, transport andeffects). Third edition. Volume VI. edited by Stern, AC. pp. 247-349. Academic Press Inc:London.
Heggestad, H.E. (1988). Reduction in soybean seed yields by ozone air pollution? Journal ofthe Air Pollution Control Association 38: 1040-1041.
Heggestad, H.E. and Lesser, V.M. (1990). Effects of ozone, sulphur dioxide, soil waterdeficit, and cultivar on yields of soybean. Journal of Environmental Quality 19: 488-495.
Heggestad, H.E., Gish, T.J., Lee, E.H., Bennett, J.H. and Douglass, L.W. (1985). Interactionof soil moisture stress and ambient ozone on growth and yield of soybeans Glycine max.Phytopathology 75: 474-477.
Horsman, D.C., Roberts, T.M., Lambert, M. and Bradshaw, A.D. (1979) Studies on the effectof sulphur dioxide on perrennial ryegrass (Lolium perenne L.). I. Characterisitics offumigation system and preliminary experiments. Journal of Experimental Botany 30, 485-493.

ICP Vegetation, April 2002, part of Contract EPG 1/3/170
43
Houlden, G., McNeill, S., Aminu-Kano, M. and Bell, J.N.B. (1990) Air pollution andagricultural aphid pests. I. Fumigation experiments with SO2 and NO2. EnvironmentalPollution 67, 305-314.
Inclán, R., Alonso, R., Pujadas, M., Terés, J. & Gimeno, B.S. (1996): Ozone and droughtstress-interactive effects on gas exchange rates of Aleppo pine (Pinus halepensis Mill.)Chemosphere (in press).
Jager, H.-J. and Schulze, E. (1988) Critical levels for effects of SO2 - working paper. ECECritical Levels Workshop, Bad Harzburg, 14 - 18 March, 1988, p. 15 - 50.
Johnson, B.G., Hale, B.A. & Ormrod, D.P. (1996): Carbon dioxide and ozone effects ofgrowth of a legume-grass mixture. Journal of Environmental Quality, 25, 908-916.
Kats, G., Dawson, P.J., Bytnerowicz, A., Wolf, J.W., Thompson, C.R. and Olszyk, D.M.(1985). Effects of ozone or sulphur dioxide on growth and yield of rice. Agriculture,Ecosystems and Environment 14: 103-118.
Keller, T. & Hasler, R. (1988): Some effects of long term fumigations with ozone on spruce(Picea abies (L.) Karst.). Geojournal, 17, 277-278.
Kelly, J.M., Samuelson, L., Edwards, G., Hanson, P., Kelting, D., Mays, A. & Wullschleger,S. (1995): Are seedlings reasonable surrogates for trees? An analysis of ozone impacts onQuercus rubra. Water, Air and Soil Pollution, 85, 1317-1324.
Kelting, D.L., Burger, J.A. & Edwards, G.S. (1995): The effects of ozone on the rootdynamics on seedlings and mature red oak Quercus rubra. Forest Ecology and Management,79, 197-206.
Kobayashi, K., Okada, M. and Nouchi, I. (1995). Effects of ozone on dry matter partitioningand yield of Japanese cultivars of rice (Oryza sativa L.). Agriculture, Ecosystems andEnvironment 53: 109-122.
Kohut, R.J., Amundson, R.G., Laurence, J.A., Colavito, L., Van Lenten, P. & King, P.(1987): Effects of ozone and sulphur dioxide on yield of winter wheat. Phytopathology, 77,71-74.
Köllner, B. and Krause, G.H.M. (2000). Changes in carbohydrates, leaf pigments and yield inpotatoes induced by different ozone exposure regimes. Agriculture, Ecosystems andEnvironment 78: 149-158.
Kress, L.W. and Miller, J.E. (1985a). Impact of ozone on field-corn yield. Canadian Journalof Botany 63: 2408-2415.
Kress, L.W., Miller, J.E. and Smith, H.J. (1985b). Impact of ozone on winter wheat yield.Environmental and Experimental Botany 25: 211-228.
Lawson, T., Craigon, J., Black, C.R., Colls, J.J., Tulloch, A.-M. and Landon, G. (2000).Effects of elevated carbon dioxide and ozone on the growth and yield of potatoes (Solanumtuberosum) grown in open-top chambers. Environmental Pollution 111: 479-491.
ICP Vegetation, April 2002, part of Contract EPG 1/3/170
44
Lesser, V.M., Rawlings, J.O., Spruill, S.E. & Somerville, M.C. (1990): Ozone effects onagricultural crops: Statistical methodologies and estimates dose-response relationships. CropScience, 30, 148-155.
Maggs, R. and Ashmore, M.R. (1998). Growth and yield responses of Pakistan rice (Oryzasativa L.) cultivars to O3 and NO2. Environmental Pollution 103: 159-170.
Mansfield, T.A. and McCune, D.C. (1988) Problems of crop loss assessment when there isexposure to two or more gaseous pollutants. In: "Assessment of crop loss from airpollutants", W.W. Heck, O.C. Taylor and D.T. Tingey (Eds.) Elsevier Applied Science, Lon-don.
Mansfield, T.A., Davies, W.J. and Whitmore, M.E. (1986) Interactions between theresponses of plants to pollution and other environmental factors such as drought, light andtemperature. In "How are the effects of air pollutants on agricultural crops influenced by theinteraction with other limiting factors?". Proceedings of a CEC workshop within theframework of the Concerted Action "Effects of Air Pollution on Terrestrial and AquaticEcosystems", Riso, Denmark, pp 2-15.
Masters, G.J. & McNeill, S. (1996): Evidence that plant varieties respond differently to NO2
pollution as indicated by resistance to insect herbivores. Environmental Pollution, 3,351-354.
McCool, P.M., Musselman, R.C. and Teso, R.R. (1987). Air pollutant yield-loss assessmentfor four vegetable crops. Agriculture, Ecosystems and Environment 20, 11-21.
Mortensen, L. & Bastrup-Birk, A. (1996): Critical levels for ozone for biomass production inwhite clover. In: Critical levels for ozone in Europe. Testing and finalizing the concepts.(UN-ECE Workshop Report). edited by Kärenlampi, L & Skärby,, L. pp. 285-289. Dept. ofEcol. & Environ. Sci: University of Kuopio.
Mortensen, L., Bastrup-Birk, A. & Ro-Poulsen, H. (1995): Critical levels of O3 for woodproduction of European beech Fagus sylvatica. Water, Air and Soil Pollution, 85, 1349-1354.
Moser, TJ (1988): Drought stress and ozone induced effects in bush bean. In: Assessment ofcrop loss from air pollutants. Edited by Heck, WW; Taylor, OT & Tingey, DT. pp. 348-364.Elsevier: London & NY.
Mulchi, C., Rudorff, B., Lee, E., Rowland, R. and Pausch, R. (1995). Morphologicalresponses among crop species to full-season exposures to enhanced concentrations ofatmospheric CO2 and O3. Water, Air and Soil Pollution 85: 1379-1386.
Murray, F., Wilson. S. & Monk. R. (1992). Nitrogen dioxide and sulphur dioxide mixturesstimulate barley grain production but depress clover growth. Environ. Exp. Bot. 32, 185-192.
Ollerenshaw, J.H. and Lyons, T. (1999). Impacts of ozone on the growth and yield of field-grown winter wheat. Environmental Pollution 106: 67-72.
Olszyk, D.M., Thompson, C.R. & Poe, M.P. (1988): Crop loss assessment for California:Modelling losses with different ozone standard scenarios. Environmental Pollution, 53,303-311.
ICP Vegetation, April 2002, part of Contract EPG 1/3/170
45
Omasa, K. (1990) Study on changes in stomata and their surrounding cells using anondestructive light micrscope system. Responses to air pollutants. J. Agric. Meteorol.45,251-257.
Oshima, R.J., Taylor, O.C., Braegelmann, P.K. and Baldwin, D.W. (1975). Effect of ozoneon the yield and plant biomass of a commercial variety of tomato. Journal of EnvironmentalQuality 4: 463-464.
Pääkkönen, E., Holopainen, T. & Kärenlampi, L. (1995): Effects of ozone on birch Betulapendula Roth. clones. Water, Air and Soil Pollution, 85, 1331-1336.
Pääkkönen, E., Metsärinne, S., Holopainen, T. & Kärenlampi, L. (1995): The ozonesensitivity of birch Betula pendula in relation to the developmental stage of leaves. NewPhytologist, 132, 145-154.
Pande, P.C. and Mansfield, T.A. (1985) Responses of winter barley to SO2 and NO2 aloneand in combination. Environmental Pollutution Series A, 39, 281-291.
Pell, E.J., Pearson, N.S. and Vinten-Johansen, C. (1988). Qualitative and quantitative effectsof ozone and/or sulphur dioxide on field-grown potato plants. Environmental Pollution 53:171-186.
Pleijel, H., Karlsson, G.P., Sild, E., Danielsson, H., Skärby, L. & Selldén, G. (1996):Exposure of a grass-clover mixture to ozone in open top chambers - effect on yield, qualityand botanical composition. Agriculture, Ecosystems and Environment, 59, 55-62.
Pleijel, H., Skärby, L., Wallin, G., and Selldén, G. (1991). Yield and grain quality of springwheat exposed to different concentrations of ozone in open-top chambers. EnvironmentalPollution 69: 151-168.
Pleijel, H., Wallin, G., Karlsson, P., Skärby, L. & Selldén, G. (1995): Gradients of ozone at aforest site and over a field crop- consequences for the AOT40 concept of critical level. Water,Air and Soil Pollution, 85, 2033-2038.
Reinert, R., Sanchez, B., Salleras, J.M., Bermejo, V., Ochoa, M.J. & Tarrnel, A. (1992).Ozone effects on watermelon plants at the Ebro Delta (Spain): Symptomatology.Agriculture, Ecosystems and Environment, 38, 41-49.
Reinert, R.A., Eason, G. and Barton, J. (1997). Growth and fruiting of tomato as influencedby elevated carbon dioxide and ozone. New Phytologist 137: 411-420.
Retzlaff, W.A., Williams,L.E. and DeJong, T.M. (1997). Growth and yield response ofcommercial bearing-age ‘Casselman’ plum trees to various ozone partial pressures. Journal ofEnvironmental Quality 26: 858-865.
Riemer, J. and Whittaker, J.B. (1989) Air pollution and insect herbivores: Observedinteractions and possible mechanisms. Insect Plant Interactions 1, 73-105.
Roberts, T.M. (1984) Long term effects of SO2 on crops; an analysis of dose - responserelations. Philosophical Transactions of the Royal Society, London, Series B 305, 299-316.
ICP Vegetation, April 2002, part of Contract EPG 1/3/170
46
Rudorff, B.F.T., Mulchi, C.L., Lee, E.H., Rowland, R. and Pausch, R. (1996). Effects ofenhanced O3 and CO2 enrichment on plant characteristics in wheat and corn. EnvironmentalPollution 94: 53-60.
Salam, M.A. & Soja, G. (1995): Bush bean Phaseolus vulgaris leaf injury, photosynthesis andstomatal functions under elevated ozone levels. Water, Air and Soil Pollution, 85,1533-1538.
Sanders, G.E., Colls, J.J., Clark, A.G., Galaup, S., Bonte, J. and Cantuel, J. (1992a).Phaseolus vulgaris and ozone: results from open-top chamber experiments in France andEngland. Agriculture, Ecosystems and Environment 38: 31-40.
Sanders, G.E., Robinson, A.D., Geissler, P.A. and Colls, J.J. (1992b). Yield stimulation of acommonly grown cultivar of Phaseolus vulgaris L. at near ambient ozone concentrations.New Phytologist 122: 63-70.
Shaw, P.J.A., Holland, M.R. and McLeod, A.R. (1993) The occurrence of SO2 related foliarsymptoms on Scots pine (Pinus sylvestris L.) in an open air fumigation experiment. NewPhytologist, 123, 143-152.
Shortle, S., Dunn, J.W. and Philips, M. (1986) Economic Assessment of Crop Damage due toAir Pollution: The Role of Quality Effects. Staff paper 118. Department of AgriculturalEconomics, Pennsylvania State University, State College, P.A
Skärby, L. & Karlsson, P.E. (1996): Critical level for ozone to protect forest trees - bestavailable knowledge from the Nordic countries and the rest of Europe. In: Critical levels forozone in Europe: Testing and finalizing the concepts. (UN-ECE Workshop Report). editedby Kärenlampi, L & Skärby, L. pp. 72-85. Dept. of Ecol. & Environ. Sci.: University ofKuopio.
Skärby, L. and Jnsson, B. (1988) Effects of ozone on crops in Sweden. EnvironmentalPollution 53: 461-462.
Skärby, L., Sellden, G., Mortensen, L., Bender, J., Jones, M., De Temmermann, L. Wenzel,A. and Fuhrer, J. (1993) Responses of cereals exposed to air pollutants in open-top chambers.In: Effects of Air Pollution on Agricultural Crops in Europe (Jager, H.-J., Unsworth, M. H.,De Temmerman, L. and Mathy, P. (Eds.). Air Pollution Research Report 46, EuropeanCommission, Brussels, 241-259.
Skärby, L., Selldén, G., Mortensen, L., Bender, J., Jones, M., De Temmerman, L., Wenzel, L.and Fuhrer, J. (1992). Responses of cereals exposed in open-top chambers to air pollutants.In: Air Pollution Research Report 46. Effects of Air Pollution on Agricultural Crops inEurope. Commission of the European Communities, 241-260.
Skärby, L., Wallin, G., Selldén, G., Karlsson, P.E., Ottosson, S., Sutinen, S. & Grennfelt, P.(1995): Tropospheric ozone - a stress factor for Norway spruce in Sweden. EcologicalBulletins, 44, 133-146.
Soja, G. (1997): Poster presented at the ICP-Crops meeting held in Bern, January 1997.
Soja, G. & Soja, A.M. (1995): Wheat as an ozone sensitive crop. Acta PhytopathologiaEntomologica Hungarica, 30, 59-70.
ICP Vegetation, April 2002, part of Contract EPG 1/3/170
47
Soja, G., Eid, M., Gangl, H. and Redl, H. (1997). Ozone sensitivity of grapevine (Vitisvinifera L.): Evidence for a memory effect in a perennial crop plant? Phyton 37: 265-270.
Somerville, M.C., Spruill, S.E., Rawlings, J.O. and Lesser, V.M. (1989) Impact of ozone andsulfur dioxide on the yield of agricultural crops. Technical Bulletin 292, North CarolinaAgricultural Research Service, Raleigh, North Carolina.
Squire, L. and H. van der Tak (1975) Economic Analysis of Projects, Johns Hopkins Press,Baltimore, USA.
Takemoto, B.K., Olszyk, D.M., Johnson, A.G. and Parada, C.R. (1988). Yield responses offield-grown crops to acidic fog and ambient ozone. Journal of Environmental Quality 17:192-197.
Taylor, HJ, Ashmore, MR and Bell, JNB (1986) Air Pollution Injury to Vegetation (aguidance manual commissioned by HM Industrial Air Pollution Inspectorate of the Healthand Safety Executive). IEHO, London, 68pp.
Temmermann, L. de, K. Vandermeiren and Guns, M. (1992) Effects of air filtration on springwheat grown in open-top chambers at a rural site. I. Effect on growth, yield and dry matterpartitioning. Environmental Pollution, 77, 1-5.
Temple, P.J. (1990a). Growth and yield responses of processing tomato (Lycopersiconesculentum Mill.) cultivars to ozone. Environmental and Experimental Botany 30: 283-291.
Temple, P.J. (1990b). Growth form and yield responses of four cotton cultivars to ozone.Agronomy Journal 82: 1045-1050.
Temple, P.J. (1991). Variations in responses of dry bean (Phaseolus vulgaris) cultivars toozone. Agriculture, Ecosystems and Environment 36: 1-11.
Temple, P.J., Clifton-Taylor, O. and Benoit, L.F. (1985). Effects of ozone on yield of twofield grown barley cultivars. Environmental Pollution 39: 217-225.
Temple, P.J., Jones, T.E., and Lennox, R.W. (1990). Yield loss assessments for cultivars ofbrocolli, lettuce, and onion exposed to ozone. Environmental Pollution 66: 289-299.
Tonneijck, A.E.G. and Van Dijk, C.J. (1998). Responses of bean (Phaseolus vulgaris L. cv.Pros) to chronic ozone exposure at two levels of atmospheric ammonia. EnvironmentalPollution 99: 45-51.
UK TERG (1988). (United Kingdom Terrestrial Effects Review Group). First report.Prepared at the request of the Department of the Environment, HMSO, London.
Van der Eerden, L.J., Dueck, T.A., Elderson, J., van Dobben, H.F., Berdowski, J.J.M.,Latuhinin, M. and Prins, A.H. (1990). Effects of NH3 and (NH4)2SO4 deposition onterrestrial semi-natural vegetation on nutrient-poor soils. Project 124/125, phase II DutchPriority Programme on Acidification. IPO report R 90/06 Research Institute for PlantProtection, Wageningen, Netherlands.
Van der Eerden, L.J., Tonneijck, A.E.G. and Wijnands, J.H.M. (1988) Crop loss due to airpollution in the Netherlands. Environmental Pollution 53, 365-376.
ICP Vegetation, April 2002, part of Contract EPG 1/3/170
48
Vandermeiren, K. & De Temmerman, L. (1996): Different responses of Phaseolus vulgaris tosub-acute and chronic ozone fumigation at an equal AOT 40 level. In: Critical levels forozone in Europe. Testing and finalizing the concepts. (UN-ECE Workshop Report). Editedby Kärenlampi, L & Skärby, L. pp. 337-342. Dept. of Ecol. & Environ. Sci.: University ofKuopio.
Vandermeiren, K., Temmermann, L. de, Staquet, A. and Baeten, H. (1992) Effects of airfiltration on spring wheat grown in open-top chambers at a rural site. II. Effects on mineralpartitioning, sulphur and nitrogen metabolism and on grain quality. Environmental Pollution,77, 7-14.
Velissariou, D., Gimeno, B.S., Badiani, M., Fumagalli, I. & Davison, A.W. (1996): Recordsof visible injuries in the ECE Mediterranean region. In: Kärenlampi, L. & Skärby, L. (eds.).Critical levels for ozone in Europe: Testing and finalising the concepts. UNECE WorkshopReport, Univ. of Kuopio, 1996.
Warrington, S. (1989) Ozone enhances the growth rate of cereal aphids. AgricultureEcosystems and Environment 26, 65-68.
Wieser, G. & Havranek, W.M. (1993): Ozone uptake in the sun and shade crown of spruce:quantifying the physiological effects of ozone exposure. Trees Structure and Function, 7,227-232.
Wolfenden, J., Pearson, M. & Francis, B. J. (1991) Effects of over-winter fumigation withsulphur and nitrogen dioxides on biochemical parameters and spring growth in red sprucePicea rubens Sarg. Plant Cell Environment 14, 35-46.
ICP Vegetation, April 2002, part of Contract EPG 1/3/170
49
APPENDIX 1: DETAILED RESULTS
Detailed results by country and crop, all expressed in units of £ thousands, are shown in threeblocks, comprised of the following crops:Block 1: Wheat, Barley, Rye, Oats, Millet, Maize, Rice, Soya, Pulses, Oilseed rapeBlock 2:, Sugar beet, Potatoes, Tobacco, Sunflower seed and Cotton Olives, Hops, Grape,Fruit, CarrotsBlock 3: Tomato, Water melons and Fresh Vegetables

ICP Vegetation, April 2002, part of Contract EPG 1/3/170
50
Block 1, results for wheat, barley, rye, oats, millet, maize, rice, soya, pulses and rape, all results in £000Albania Total, £000 Wheat Barley Rye Oats Millet Maize Rice Soya Pulses Rape
1990 5,588 1,830 - 0 0 - 386 - 16 765 -Ref2010 4,530 1,485 - 0 0 - 313 - 13 620 -
GP 4,330 1,420 - 0 0 - 299 - 12 592 -J1 4,033 1,323 - 0 0 - 279 - 11 552 -
Austria Total, £000 Wheat Barley Rye Oats Millet Maize Rice Soya Pulses Rape1990 45,160 14,524 1 0 0 - 4,778 - 992 2,677 1,900
Ref2010 32,762 10,516 1 0 0 - 3,464 - 717 1,937 1,375GP 30,845 9,867 1 0 0 - 3,270 - 677 1,829 1,299J1 27,863 8,873 1 0 0 - 2,968 - 616 1,661 1,179
Belgium and Luxembourg Total, £000 Wheat Barley Rye Oats Millet Maize Rice Soya Pulses Rape1990 74,692 17,046 0 0 0 - 1,280 - - 691 319
Ref2010 64,754 14,778 0 0 0 - 1,110 - - 599 277GP 58,130 13,267 0 0 0 - 996 - - 538 248J1 54,223 12,375 0 0 0 - 929 - - 502 232
Bosnia Total, £000 Wheat Barley Rye Oats Millet Maize Rice Soya Pulses Rape1990 8,121 2,013 0 0 0 - 2,035 - 143 531 10
Ref2010 6,409 1,588 0 0 0 - 1,603 - 113 419 8GP 6,083 1,507 0 0 0 - 1,522 - 107 398 8J1 5,538 1,371 0 0 0 - 1,386 - 98 362 7
Bulgaria Total, £000 Wheat Barley Rye Oats Millet Maize Rice Soya Pulses Rape1990 38,912 16,610 0 0 0 - 3,118 37 62 995 -
Ref2010 33,947 14,482 0 0 0 - 2,719 32 54 868 -GP 32,353 13,806 0 0 0 - 2,593 30 51 827 -J1 30,108 12,834 0 0 0 - 2,410 28 48 770 -
Croatia Total, £000 Wheat Barley Rye Oats Millet Maize Rice Soya Pulses Rape1990 31,342 5,200 0 0 0 0 5,937 - 2,316 1,024 322
Ref2010 24,883 4,130 0 0 0 0 4,715 - 1,839 813 255GP 23,639 3,920 0 0 0 0 4,478 - 1,746 772 242J1 21,684 3,582 0 0 0 0 4,103 - 1,603 709 223
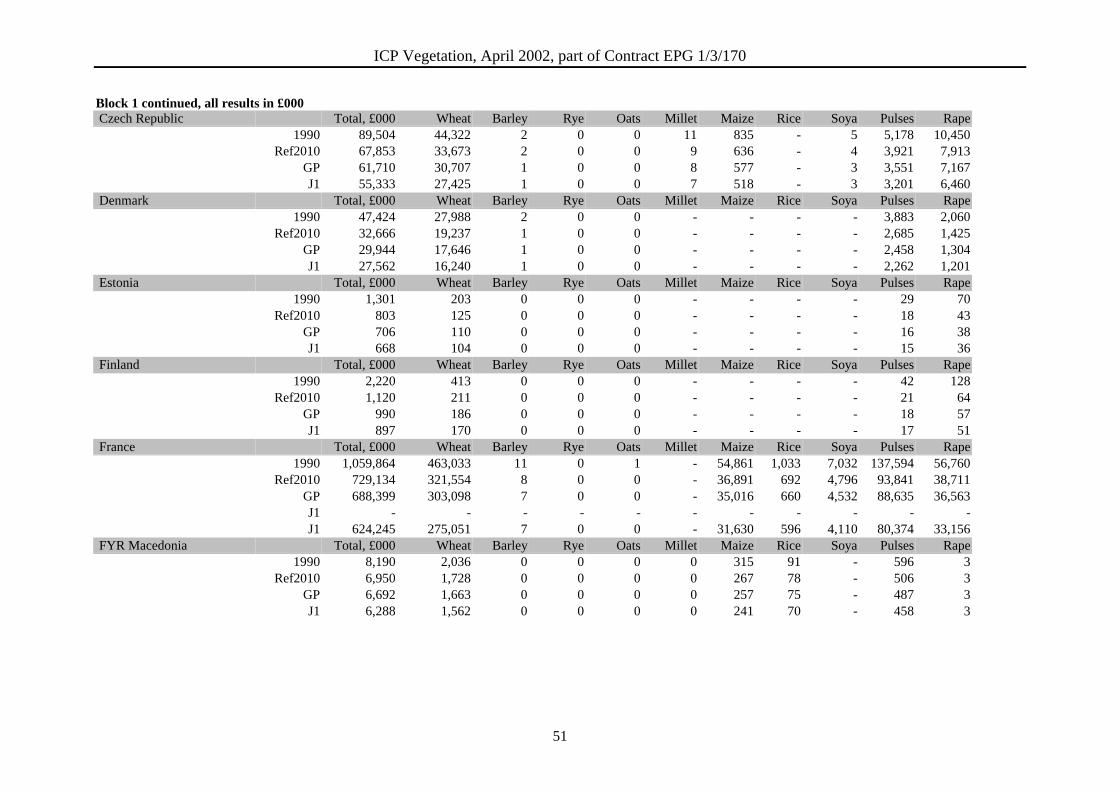
ICP Vegetation, April 2002, part of Contract EPG 1/3/170
51
Block 1 continued, all results in £000 Czech Republic Total, £000 Wheat Barley Rye Oats Millet Maize Rice Soya Pulses Rape
1990 89,504 44,322 2 0 0 11 835 - 5 5,178 10,450Ref2010 67,853 33,673 2 0 0 9 636 - 4 3,921 7,913
GP 61,710 30,707 1 0 0 8 577 - 3 3,551 7,167J1 55,333 27,425 1 0 0 7 518 - 3 3,201 6,460
Denmark Total, £000 Wheat Barley Rye Oats Millet Maize Rice Soya Pulses Rape1990 47,424 27,988 2 0 0 - - - - 3,883 2,060
Ref2010 32,666 19,237 1 0 0 - - - - 2,685 1,425GP 29,944 17,646 1 0 0 - - - - 2,458 1,304J1 27,562 16,240 1 0 0 - - - - 2,262 1,201
Estonia Total, £000 Wheat Barley Rye Oats Millet Maize Rice Soya Pulses Rape1990 1,301 203 0 0 0 - - - - 29 70
Ref2010 803 125 0 0 0 - - - - 18 43GP 706 110 0 0 0 - - - - 16 38J1 668 104 0 0 0 - - - - 15 36
Finland Total, £000 Wheat Barley Rye Oats Millet Maize Rice Soya Pulses Rape1990 2,220 413 0 0 0 - - - - 42 128
Ref2010 1,120 211 0 0 0 - - - - 21 64GP 990 186 0 0 0 - - - - 18 57J1 897 170 0 0 0 - - - - 17 51
France Total, £000 Wheat Barley Rye Oats Millet Maize Rice Soya Pulses Rape1990 1,059,864 463,033 11 0 1 - 54,861 1,033 7,032 137,594 56,760
Ref2010 729,134 321,554 8 0 0 - 36,891 692 4,796 93,841 38,711GP 688,399 303,098 7 0 0 - 35,016 660 4,532 88,635 36,563J1 - - - - - - - - - - -J1 624,245 275,051 7 0 0 - 31,630 596 4,110 80,374 33,156
FYR Macedonia Total, £000 Wheat Barley Rye Oats Millet Maize Rice Soya Pulses Rape1990 8,190 2,036 0 0 0 0 315 91 - 596 3
Ref2010 6,950 1,728 0 0 0 0 267 78 - 506 3GP 6,692 1,663 0 0 0 0 257 75 - 487 3J1 6,288 1,562 0 0 0 0 241 70 - 458 3
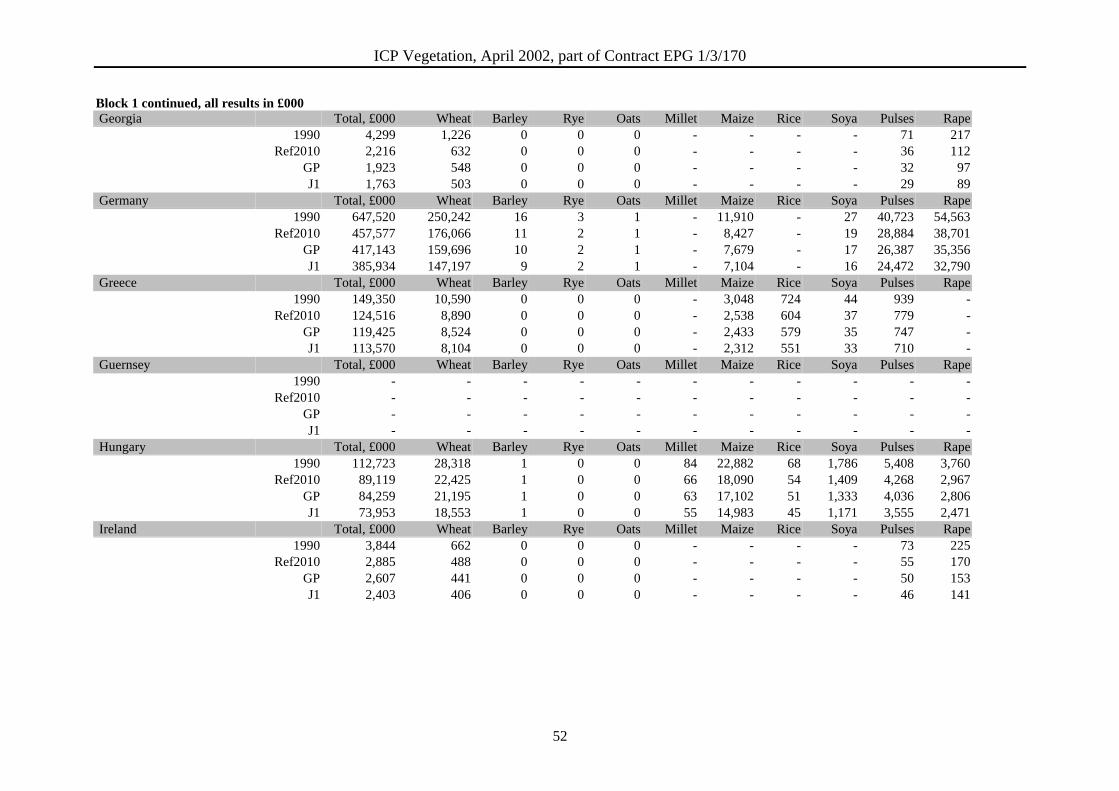
ICP Vegetation, April 2002, part of Contract EPG 1/3/170
52
Block 1 continued, all results in £000 Georgia Total, £000 Wheat Barley Rye Oats Millet Maize Rice Soya Pulses Rape
1990 4,299 1,226 0 0 0 - - - - 71 217Ref2010 2,216 632 0 0 0 - - - - 36 112
GP 1,923 548 0 0 0 - - - - 32 97J1 1,763 503 0 0 0 - - - - 29 89
Germany Total, £000 Wheat Barley Rye Oats Millet Maize Rice Soya Pulses Rape1990 647,520 250,242 16 3 1 - 11,910 - 27 40,723 54,563
Ref2010 457,577 176,066 11 2 1 - 8,427 - 19 28,884 38,701GP 417,143 159,696 10 2 1 - 7,679 - 17 26,387 35,356J1 385,934 147,197 9 2 1 - 7,104 - 16 24,472 32,790
Greece Total, £000 Wheat Barley Rye Oats Millet Maize Rice Soya Pulses Rape1990 149,350 10,590 0 0 0 - 3,048 724 44 939 -
Ref2010 124,516 8,890 0 0 0 - 2,538 604 37 779 -GP 119,425 8,524 0 0 0 - 2,433 579 35 747 -J1 113,570 8,104 0 0 0 - 2,312 551 33 710 -
Guernsey Total, £000 Wheat Barley Rye Oats Millet Maize Rice Soya Pulses Rape1990 - - - - - - - - - - -
Ref2010 - - - - - - - - - - -GP - - - - - - - - - - -J1 - - - - - - - - - - -
Hungary Total, £000 Wheat Barley Rye Oats Millet Maize Rice Soya Pulses Rape1990 112,723 28,318 1 0 0 84 22,882 68 1,786 5,408 3,760
Ref2010 89,119 22,425 1 0 0 66 18,090 54 1,409 4,268 2,967GP 84,259 21,195 1 0 0 63 17,102 51 1,333 4,036 2,806J1 73,953 18,553 1 0 0 55 14,983 45 1,171 3,555 2,471
Ireland Total, £000 Wheat Barley Rye Oats Millet Maize Rice Soya Pulses Rape1990 3,844 662 0 0 0 - - - - 73 225
Ref2010 2,885 488 0 0 0 - - - - 55 170GP 2,607 441 0 0 0 - - - - 50 153J1 2,403 406 0 0 0 - - - - 46 141
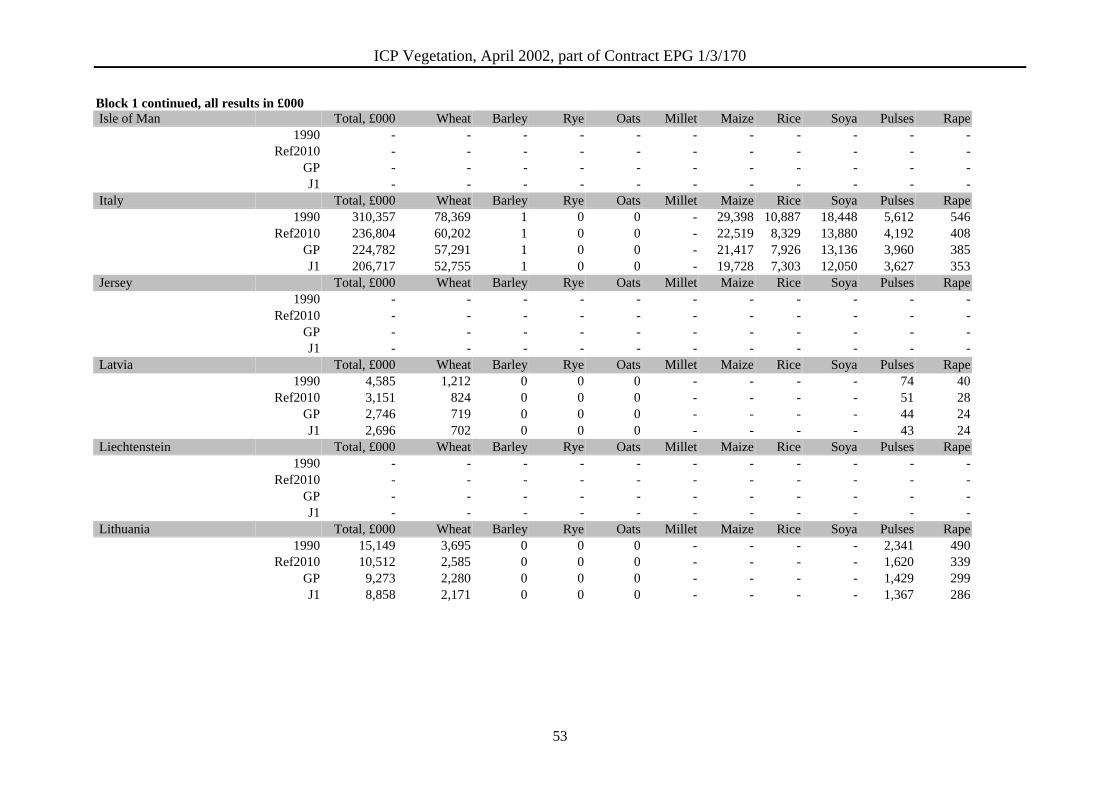
ICP Vegetation, April 2002, part of Contract EPG 1/3/170
53
Block 1 continued, all results in £000 Isle of Man Total, £000 Wheat Barley Rye Oats Millet Maize Rice Soya Pulses Rape
1990 - - - - - - - - - - -Ref2010 - - - - - - - - - - -
GP - - - - - - - - - - -J1 - - - - - - - - - - -
Italy Total, £000 Wheat Barley Rye Oats Millet Maize Rice Soya Pulses Rape1990 310,357 78,369 1 0 0 - 29,398 10,887 18,448 5,612 546
Ref2010 236,804 60,202 1 0 0 - 22,519 8,329 13,880 4,192 408GP 224,782 57,291 1 0 0 - 21,417 7,926 13,136 3,960 385J1 206,717 52,755 1 0 0 - 19,728 7,303 12,050 3,627 353
Jersey Total, £000 Wheat Barley Rye Oats Millet Maize Rice Soya Pulses Rape1990 - - - - - - - - - - -
Ref2010 - - - - - - - - - - -GP - - - - - - - - - - -J1 - - - - - - - - - - -
Latvia Total, £000 Wheat Barley Rye Oats Millet Maize Rice Soya Pulses Rape1990 4,585 1,212 0 0 0 - - - - 74 40
Ref2010 3,151 824 0 0 0 - - - - 51 28GP 2,746 719 0 0 0 - - - - 44 24J1 2,696 702 0 0 0 - - - - 43 24
Liechtenstein Total, £000 Wheat Barley Rye Oats Millet Maize Rice Soya Pulses Rape1990 - - - - - - - - - - -
Ref2010 - - - - - - - - - - -GP - - - - - - - - - - -J1 - - - - - - - - - - -
Lithuania Total, £000 Wheat Barley Rye Oats Millet Maize Rice Soya Pulses Rape1990 15,149 3,695 0 0 0 - - - - 2,341 490
Ref2010 10,512 2,585 0 0 0 - - - - 1,620 339GP 9,273 2,280 0 0 0 - - - - 1,429 299J1 8,858 2,171 0 0 0 - - - - 1,367 286
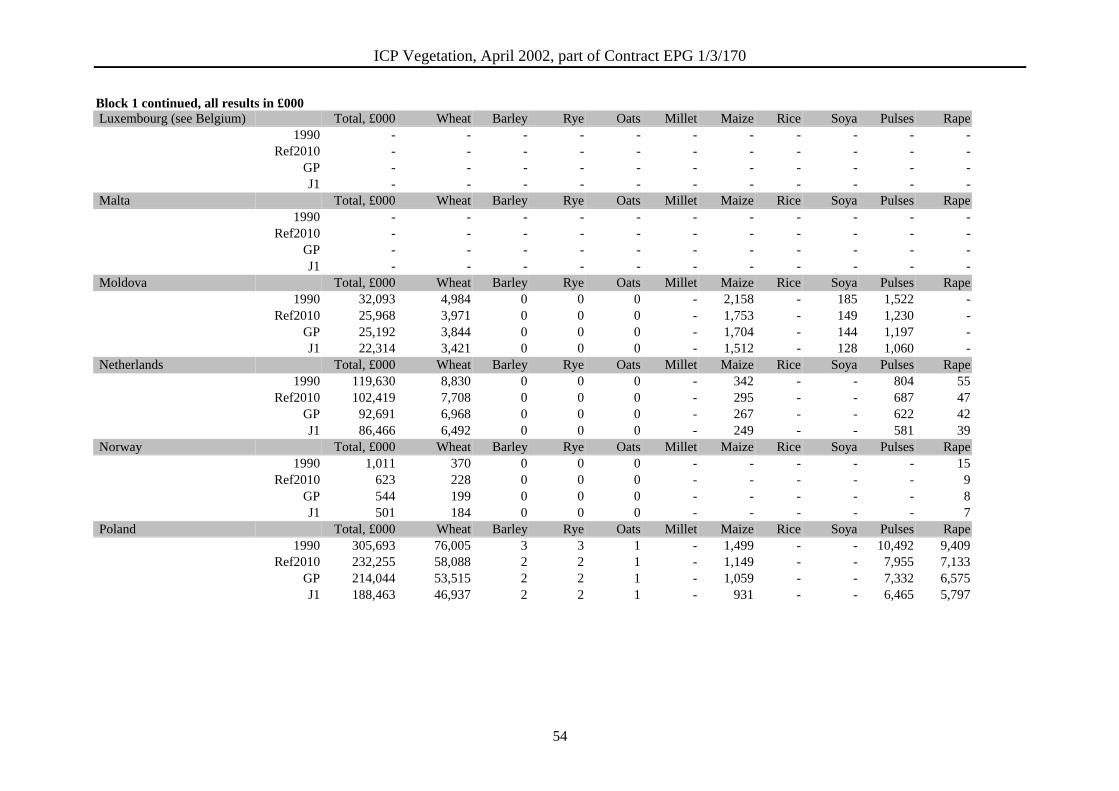
ICP Vegetation, April 2002, part of Contract EPG 1/3/170
54
Block 1 continued, all results in £000 Luxembourg (see Belgium) Total, £000 Wheat Barley Rye Oats Millet Maize Rice Soya Pulses Rape
1990 - - - - - - - - - - -Ref2010 - - - - - - - - - - -
GP - - - - - - - - - - -J1 - - - - - - - - - - -
Malta Total, £000 Wheat Barley Rye Oats Millet Maize Rice Soya Pulses Rape1990 - - - - - - - - - - -
Ref2010 - - - - - - - - - - -GP - - - - - - - - - - -J1 - - - - - - - - - - -
Moldova Total, £000 Wheat Barley Rye Oats Millet Maize Rice Soya Pulses Rape1990 32,093 4,984 0 0 0 - 2,158 - 185 1,522 -
Ref2010 25,968 3,971 0 0 0 - 1,753 - 149 1,230 -GP 25,192 3,844 0 0 0 - 1,704 - 144 1,197 -J1 22,314 3,421 0 0 0 - 1,512 - 128 1,060 -
Netherlands Total, £000 Wheat Barley Rye Oats Millet Maize Rice Soya Pulses Rape1990 119,630 8,830 0 0 0 - 342 - - 804 55
Ref2010 102,419 7,708 0 0 0 - 295 - - 687 47GP 92,691 6,968 0 0 0 - 267 - - 622 42J1 86,466 6,492 0 0 0 - 249 - - 581 39
Norway Total, £000 Wheat Barley Rye Oats Millet Maize Rice Soya Pulses Rape1990 1,011 370 0 0 0 - - - - - 15
Ref2010 623 228 0 0 0 - - - - - 9GP 544 199 0 0 0 - - - - - 8J1 501 184 0 0 0 - - - - - 7
Poland Total, £000 Wheat Barley Rye Oats Millet Maize Rice Soya Pulses Rape1990 305,693 76,005 3 3 1 - 1,499 - - 10,492 9,409
Ref2010 232,255 58,088 2 2 1 - 1,149 - - 7,955 7,133GP 214,044 53,515 2 2 1 - 1,059 - - 7,332 6,575J1 188,463 46,937 2 2 1 - 931 - - 6,465 5,797
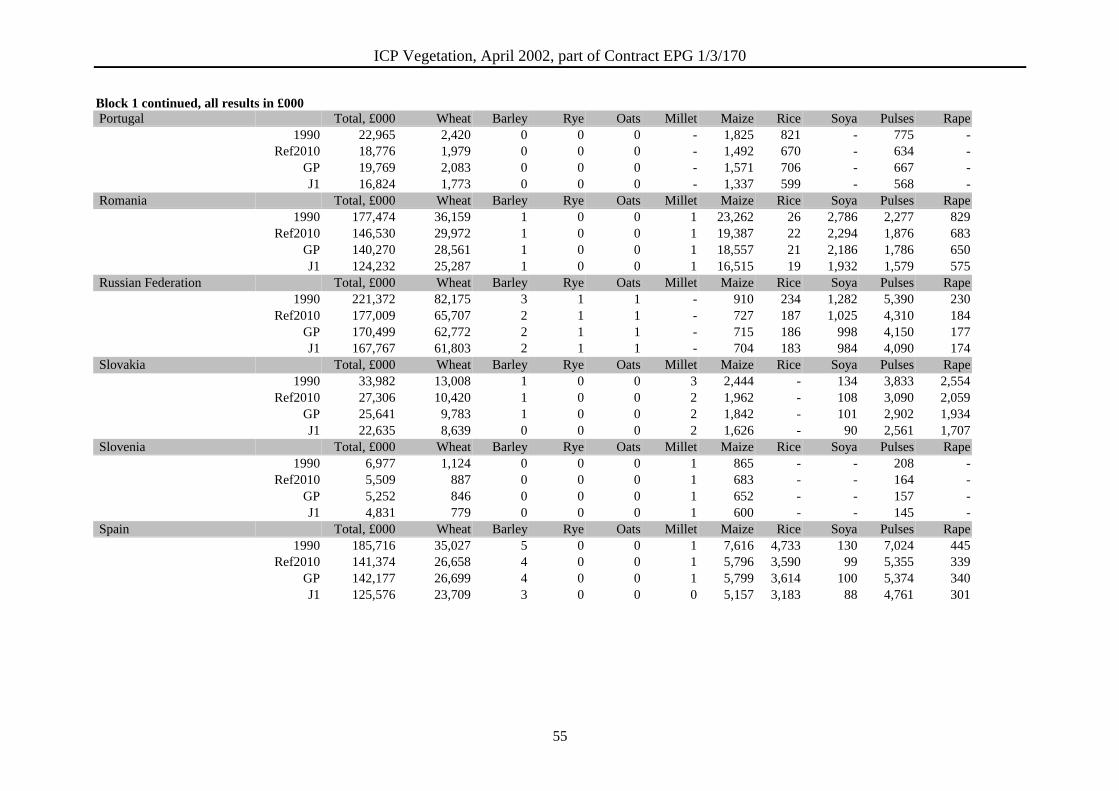
ICP Vegetation, April 2002, part of Contract EPG 1/3/170
55
Block 1 continued, all results in £000 Portugal Total, £000 Wheat Barley Rye Oats Millet Maize Rice Soya Pulses Rape
1990 22,965 2,420 0 0 0 - 1,825 821 - 775 -Ref2010 18,776 1,979 0 0 0 - 1,492 670 - 634 -
GP 19,769 2,083 0 0 0 - 1,571 706 - 667 -J1 16,824 1,773 0 0 0 - 1,337 599 - 568 -
Romania Total, £000 Wheat Barley Rye Oats Millet Maize Rice Soya Pulses Rape1990 177,474 36,159 1 0 0 1 23,262 26 2,786 2,277 829
Ref2010 146,530 29,972 1 0 0 1 19,387 22 2,294 1,876 683GP 140,270 28,561 1 0 0 1 18,557 21 2,186 1,786 650J1 124,232 25,287 1 0 0 1 16,515 19 1,932 1,579 575
Russian Federation Total, £000 Wheat Barley Rye Oats Millet Maize Rice Soya Pulses Rape1990 221,372 82,175 3 1 1 - 910 234 1,282 5,390 230
Ref2010 177,009 65,707 2 1 1 - 727 187 1,025 4,310 184GP 170,499 62,772 2 1 1 - 715 186 998 4,150 177J1 167,767 61,803 2 1 1 - 704 183 984 4,090 174
Slovakia Total, £000 Wheat Barley Rye Oats Millet Maize Rice Soya Pulses Rape1990 33,982 13,008 1 0 0 3 2,444 - 134 3,833 2,554
Ref2010 27,306 10,420 1 0 0 2 1,962 - 108 3,090 2,059GP 25,641 9,783 1 0 0 2 1,842 - 101 2,902 1,934J1 22,635 8,639 0 0 0 2 1,626 - 90 2,561 1,707
Slovenia Total, £000 Wheat Barley Rye Oats Millet Maize Rice Soya Pulses Rape1990 6,977 1,124 0 0 0 1 865 - - 208 -
Ref2010 5,509 887 0 0 0 1 683 - - 164 -GP 5,252 846 0 0 0 1 652 - - 157 -J1 4,831 779 0 0 0 1 600 - - 145 -
Spain Total, £000 Wheat Barley Rye Oats Millet Maize Rice Soya Pulses Rape1990 185,716 35,027 5 0 0 1 7,616 4,733 130 7,024 445
Ref2010 141,374 26,658 4 0 0 1 5,796 3,590 99 5,355 339GP 142,177 26,699 4 0 0 1 5,799 3,614 100 5,374 340J1 125,576 23,709 3 0 0 0 5,157 3,183 88 4,761 301
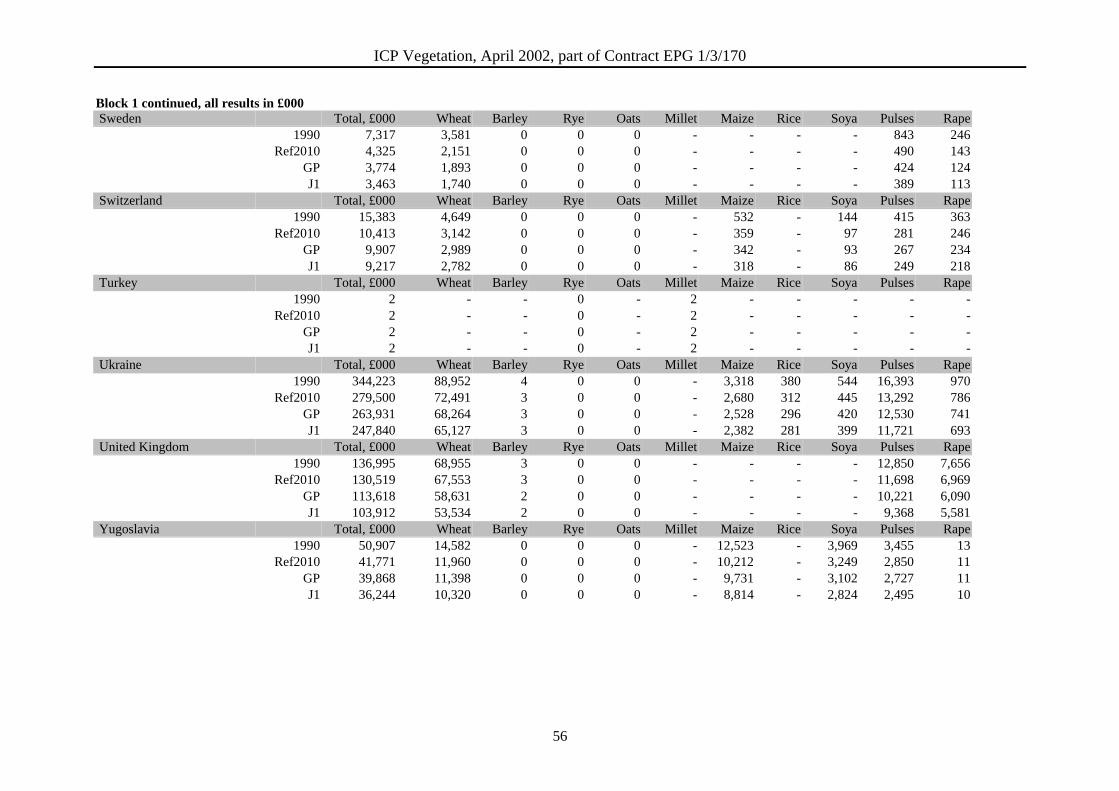
ICP Vegetation, April 2002, part of Contract EPG 1/3/170
56
Block 1 continued, all results in £000 Sweden Total, £000 Wheat Barley Rye Oats Millet Maize Rice Soya Pulses Rape
1990 7,317 3,581 0 0 0 - - - - 843 246Ref2010 4,325 2,151 0 0 0 - - - - 490 143
GP 3,774 1,893 0 0 0 - - - - 424 124J1 3,463 1,740 0 0 0 - - - - 389 113
Switzerland Total, £000 Wheat Barley Rye Oats Millet Maize Rice Soya Pulses Rape1990 15,383 4,649 0 0 0 - 532 - 144 415 363
Ref2010 10,413 3,142 0 0 0 - 359 - 97 281 246GP 9,907 2,989 0 0 0 - 342 - 93 267 234J1 9,217 2,782 0 0 0 - 318 - 86 249 218
Turkey Total, £000 Wheat Barley Rye Oats Millet Maize Rice Soya Pulses Rape1990 2 - - 0 - 2 - - - - -
Ref2010 2 - - 0 - 2 - - - - -GP 2 - - 0 - 2 - - - - -J1 2 - - 0 - 2 - - - - -
Ukraine Total, £000 Wheat Barley Rye Oats Millet Maize Rice Soya Pulses Rape1990 344,223 88,952 4 0 0 - 3,318 380 544 16,393 970
Ref2010 279,500 72,491 3 0 0 - 2,680 312 445 13,292 786GP 263,931 68,264 3 0 0 - 2,528 296 420 12,530 741J1 247,840 65,127 3 0 0 - 2,382 281 399 11,721 693
United Kingdom Total, £000 Wheat Barley Rye Oats Millet Maize Rice Soya Pulses Rape1990 136,995 68,955 3 0 0 - - - - 12,850 7,656
Ref2010 130,519 67,553 3 0 0 - - - - 11,698 6,969GP 113,618 58,631 2 0 0 - - - - 10,221 6,090J1 103,912 53,534 2 0 0 - - - - 9,368 5,581
Yugoslavia Total, £000 Wheat Barley Rye Oats Millet Maize Rice Soya Pulses Rape1990 50,907 14,582 0 0 0 - 12,523 - 3,969 3,455 13
Ref2010 41,771 11,960 0 0 0 - 10,212 - 3,249 2,850 11GP 39,868 11,398 0 0 0 - 9,731 - 3,102 2,727 11J1 36,244 10,320 0 0 0 - 8,814 - 2,824 2,495 10
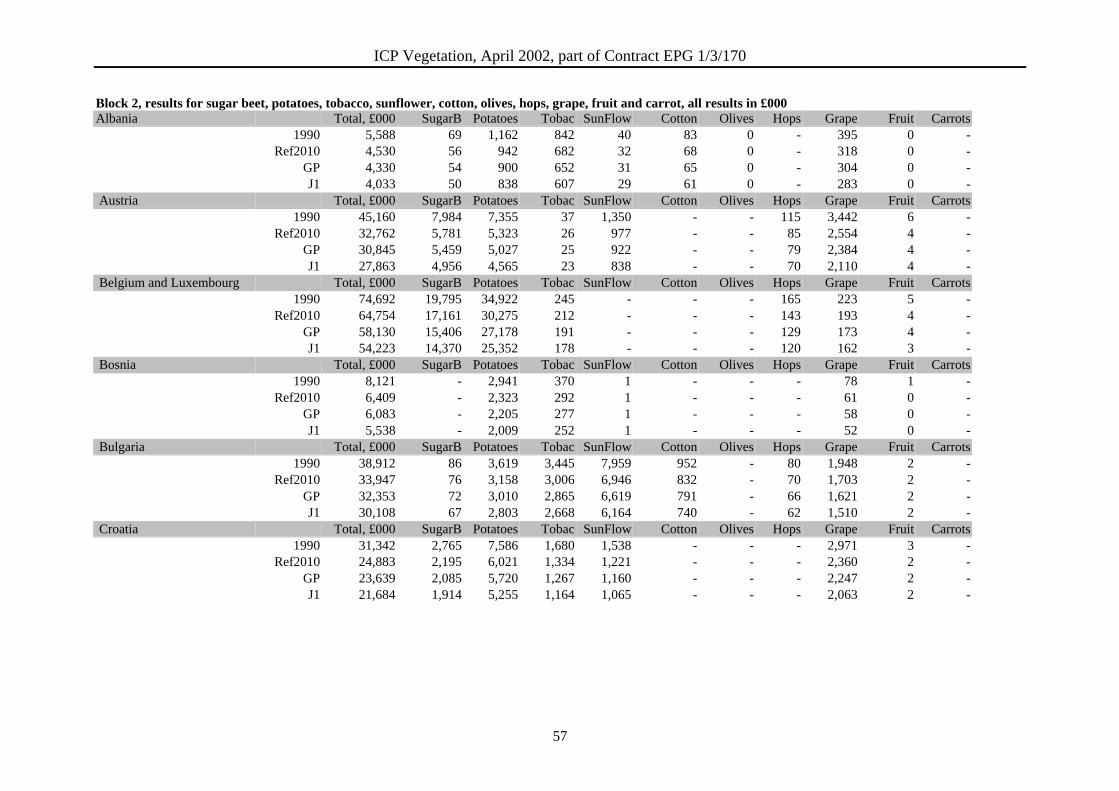
ICP Vegetation, April 2002, part of Contract EPG 1/3/170
57
Block 2, results for sugar beet, potatoes, tobacco, sunflower, cotton, olives, hops, grape, fruit and carrot, all results in £000Albania Total, £000 SugarB Potatoes Tobac SunFlow Cotton Olives Hops Grape Fruit Carrots
1990 5,588 69 1,162 842 40 83 0 - 395 0 -Ref2010 4,530 56 942 682 32 68 0 - 318 0 -
GP 4,330 54 900 652 31 65 0 - 304 0 -J1 4,033 50 838 607 29 61 0 - 283 0 -
Austria Total, £000 SugarB Potatoes Tobac SunFlow Cotton Olives Hops Grape Fruit Carrots1990 45,160 7,984 7,355 37 1,350 - - 115 3,442 6 -
Ref2010 32,762 5,781 5,323 26 977 - - 85 2,554 4 -GP 30,845 5,459 5,027 25 922 - - 79 2,384 4 -J1 27,863 4,956 4,565 23 838 - - 70 2,110 4 -
Belgium and Luxembourg Total, £000 SugarB Potatoes Tobac SunFlow Cotton Olives Hops Grape Fruit Carrots1990 74,692 19,795 34,922 245 - - - 165 223 5 -
Ref2010 64,754 17,161 30,275 212 - - - 143 193 4 -GP 58,130 15,406 27,178 191 - - - 129 173 4 -J1 54,223 14,370 25,352 178 - - - 120 162 3 -
Bosnia Total, £000 SugarB Potatoes Tobac SunFlow Cotton Olives Hops Grape Fruit Carrots1990 8,121 - 2,941 370 1 - - - 78 1 -
Ref2010 6,409 - 2,323 292 1 - - - 61 0 -GP 6,083 - 2,205 277 1 - - - 58 0 -J1 5,538 - 2,009 252 1 - - - 52 0 -
Bulgaria Total, £000 SugarB Potatoes Tobac SunFlow Cotton Olives Hops Grape Fruit Carrots1990 38,912 86 3,619 3,445 7,959 952 - 80 1,948 2 -
Ref2010 33,947 76 3,158 3,006 6,946 832 - 70 1,703 2 -GP 32,353 72 3,010 2,865 6,619 791 - 66 1,621 2 -J1 30,108 67 2,803 2,668 6,164 740 - 62 1,510 2 -
Croatia Total, £000 SugarB Potatoes Tobac SunFlow Cotton Olives Hops Grape Fruit Carrots1990 31,342 2,765 7,586 1,680 1,538 - - - 2,971 3 -
Ref2010 24,883 2,195 6,021 1,334 1,221 - - - 2,360 2 -GP 23,639 2,085 5,720 1,267 1,160 - - - 2,247 2 -J1 21,684 1,914 5,255 1,164 1,065 - - - 2,063 2 -
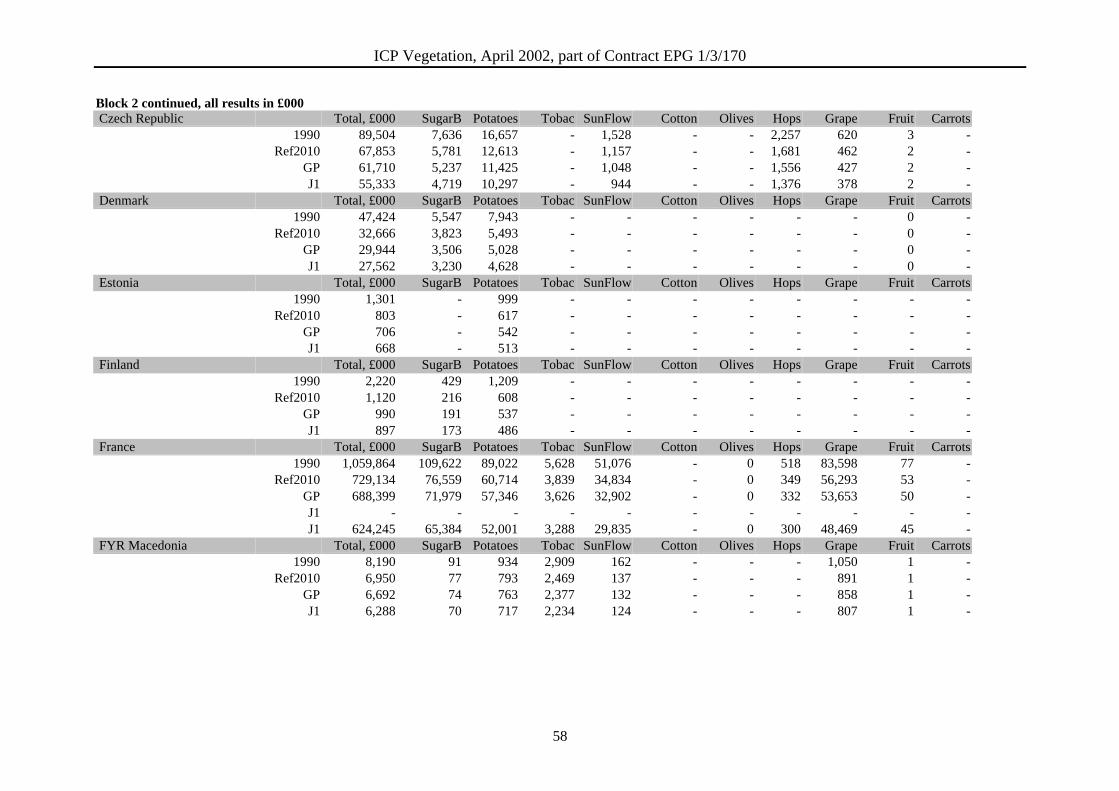
ICP Vegetation, April 2002, part of Contract EPG 1/3/170
58
Block 2 continued, all results in £000 Czech Republic Total, £000 SugarB Potatoes Tobac SunFlow Cotton Olives Hops Grape Fruit Carrots
1990 89,504 7,636 16,657 - 1,528 - - 2,257 620 3 -Ref2010 67,853 5,781 12,613 - 1,157 - - 1,681 462 2 -
GP 61,710 5,237 11,425 - 1,048 - - 1,556 427 2 -J1 55,333 4,719 10,297 - 944 - - 1,376 378 2 -
Denmark Total, £000 SugarB Potatoes Tobac SunFlow Cotton Olives Hops Grape Fruit Carrots1990 47,424 5,547 7,943 - - - - - - 0 -
Ref2010 32,666 3,823 5,493 - - - - - - 0 -GP 29,944 3,506 5,028 - - - - - - 0 -J1 27,562 3,230 4,628 - - - - - - 0 -
Estonia Total, £000 SugarB Potatoes Tobac SunFlow Cotton Olives Hops Grape Fruit Carrots1990 1,301 - 999 - - - - - - - -
Ref2010 803 - 617 - - - - - - - -GP 706 - 542 - - - - - - - -J1 668 - 513 - - - - - - - -
Finland Total, £000 SugarB Potatoes Tobac SunFlow Cotton Olives Hops Grape Fruit Carrots1990 2,220 429 1,209 - - - - - - - -
Ref2010 1,120 216 608 - - - - - - - -GP 990 191 537 - - - - - - - -J1 897 173 486 - - - - - - - -
France Total, £000 SugarB Potatoes Tobac SunFlow Cotton Olives Hops Grape Fruit Carrots1990 1,059,864 109,622 89,022 5,628 51,076 - 0 518 83,598 77 -
Ref2010 729,134 76,559 60,714 3,839 34,834 - 0 349 56,293 53 -GP 688,399 71,979 57,346 3,626 32,902 - 0 332 53,653 50 -J1 - - - - - - - - - - -J1 624,245 65,384 52,001 3,288 29,835 - 0 300 48,469 45 -
FYR Macedonia Total, £000 SugarB Potatoes Tobac SunFlow Cotton Olives Hops Grape Fruit Carrots1990 8,190 91 934 2,909 162 - - - 1,050 1 -
Ref2010 6,950 77 793 2,469 137 - - - 891 1 -GP 6,692 74 763 2,377 132 - - - 858 1 -J1 6,288 70 717 2,234 124 - - - 807 1 -
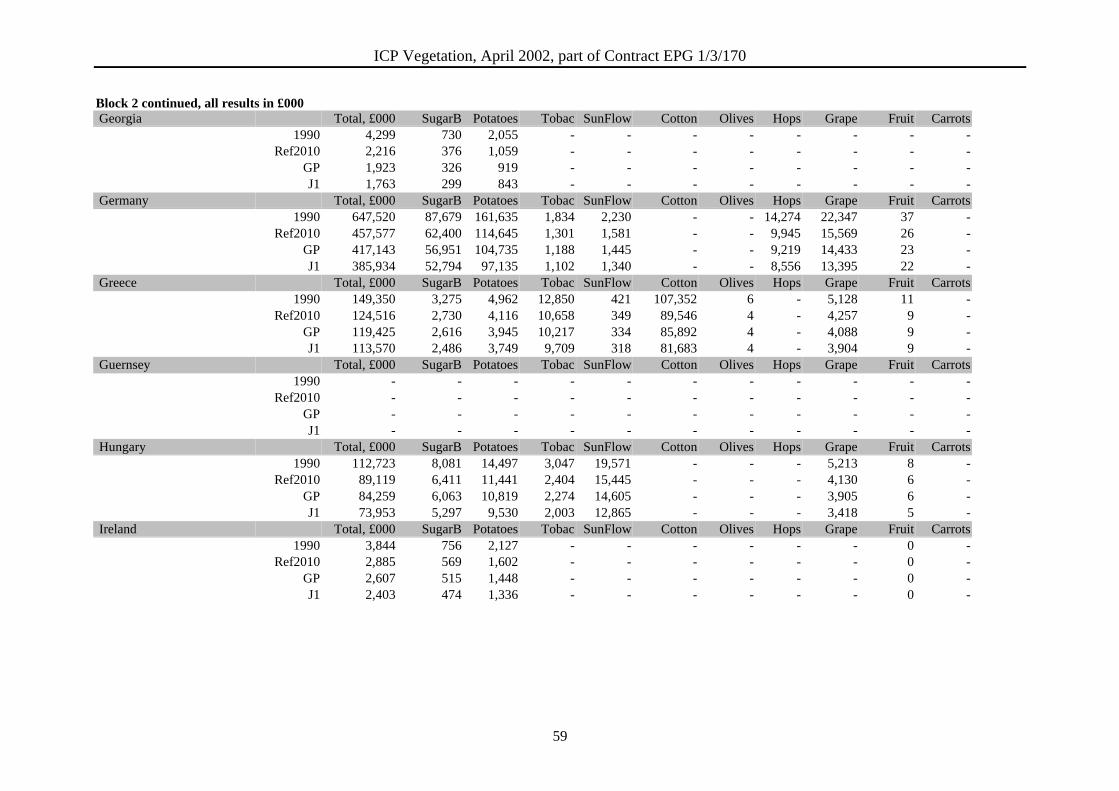
ICP Vegetation, April 2002, part of Contract EPG 1/3/170
59
Block 2 continued, all results in £000 Georgia Total, £000 SugarB Potatoes Tobac SunFlow Cotton Olives Hops Grape Fruit Carrots
1990 4,299 730 2,055 - - - - - - - -Ref2010 2,216 376 1,059 - - - - - - - -
GP 1,923 326 919 - - - - - - - -J1 1,763 299 843 - - - - - - - -
Germany Total, £000 SugarB Potatoes Tobac SunFlow Cotton Olives Hops Grape Fruit Carrots1990 647,520 87,679 161,635 1,834 2,230 - - 14,274 22,347 37 -
Ref2010 457,577 62,400 114,645 1,301 1,581 - - 9,945 15,569 26 -GP 417,143 56,951 104,735 1,188 1,445 - - 9,219 14,433 23 -J1 385,934 52,794 97,135 1,102 1,340 - - 8,556 13,395 22 -
Greece Total, £000 SugarB Potatoes Tobac SunFlow Cotton Olives Hops Grape Fruit Carrots1990 149,350 3,275 4,962 12,850 421 107,352 6 - 5,128 11 -
Ref2010 124,516 2,730 4,116 10,658 349 89,546 4 - 4,257 9 -GP 119,425 2,616 3,945 10,217 334 85,892 4 - 4,088 9 -J1 113,570 2,486 3,749 9,709 318 81,683 4 - 3,904 9 -
Guernsey Total, £000 SugarB Potatoes Tobac SunFlow Cotton Olives Hops Grape Fruit Carrots1990 - - - - - - - - - - -
Ref2010 - - - - - - - - - - -GP - - - - - - - - - - -J1 - - - - - - - - - - -
Hungary Total, £000 SugarB Potatoes Tobac SunFlow Cotton Olives Hops Grape Fruit Carrots1990 112,723 8,081 14,497 3,047 19,571 - - - 5,213 8 -
Ref2010 89,119 6,411 11,441 2,404 15,445 - - - 4,130 6 -GP 84,259 6,063 10,819 2,274 14,605 - - - 3,905 6 -J1 73,953 5,297 9,530 2,003 12,865 - - - 3,418 5 -
Ireland Total, £000 SugarB Potatoes Tobac SunFlow Cotton Olives Hops Grape Fruit Carrots1990 3,844 756 2,127 - - - - - - 0 -
Ref2010 2,885 569 1,602 - - - - - - 0 -GP 2,607 515 1,448 - - - - - - 0 -J1 2,403 474 1,336 - - - - - - 0 -
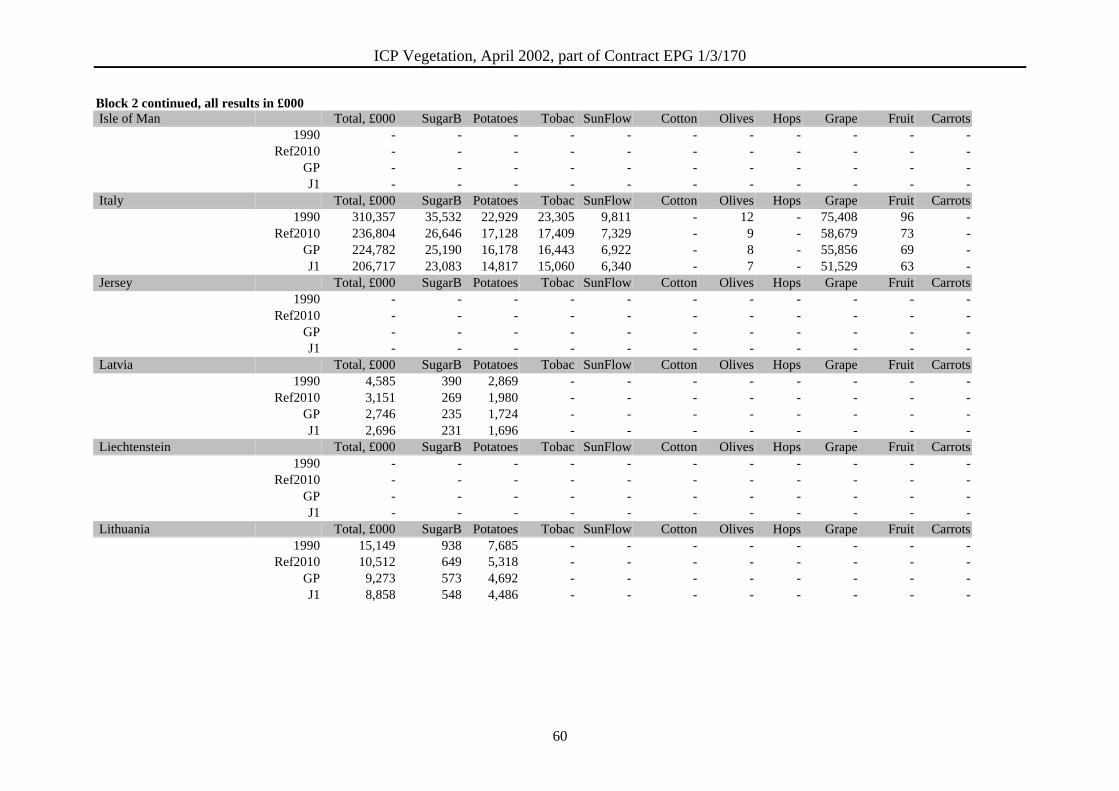
ICP Vegetation, April 2002, part of Contract EPG 1/3/170
60
Block 2 continued, all results in £000 Isle of Man Total, £000 SugarB Potatoes Tobac SunFlow Cotton Olives Hops Grape Fruit Carrots
1990 - - - - - - - - - - -Ref2010 - - - - - - - - - - -
GP - - - - - - - - - - -J1 - - - - - - - - - - -
Italy Total, £000 SugarB Potatoes Tobac SunFlow Cotton Olives Hops Grape Fruit Carrots1990 310,357 35,532 22,929 23,305 9,811 - 12 - 75,408 96 -
Ref2010 236,804 26,646 17,128 17,409 7,329 - 9 - 58,679 73 -GP 224,782 25,190 16,178 16,443 6,922 - 8 - 55,856 69 -J1 206,717 23,083 14,817 15,060 6,340 - 7 - 51,529 63 -
Jersey Total, £000 SugarB Potatoes Tobac SunFlow Cotton Olives Hops Grape Fruit Carrots1990 - - - - - - - - - - -
Ref2010 - - - - - - - - - - -GP - - - - - - - - - - -J1 - - - - - - - - - - -
Latvia Total, £000 SugarB Potatoes Tobac SunFlow Cotton Olives Hops Grape Fruit Carrots1990 4,585 390 2,869 - - - - - - - -
Ref2010 3,151 269 1,980 - - - - - - - -GP 2,746 235 1,724 - - - - - - - -J1 2,696 231 1,696 - - - - - - - -
Liechtenstein Total, £000 SugarB Potatoes Tobac SunFlow Cotton Olives Hops Grape Fruit Carrots1990 - - - - - - - - - - -
Ref2010 - - - - - - - - - - -GP - - - - - - - - - - -J1 - - - - - - - - - - -
Lithuania Total, £000 SugarB Potatoes Tobac SunFlow Cotton Olives Hops Grape Fruit Carrots1990 15,149 938 7,685 - - - - - - - -
Ref2010 10,512 649 5,318 - - - - - - - -GP 9,273 573 4,692 - - - - - - - -J1 8,858 548 4,486 - - - - - - - -
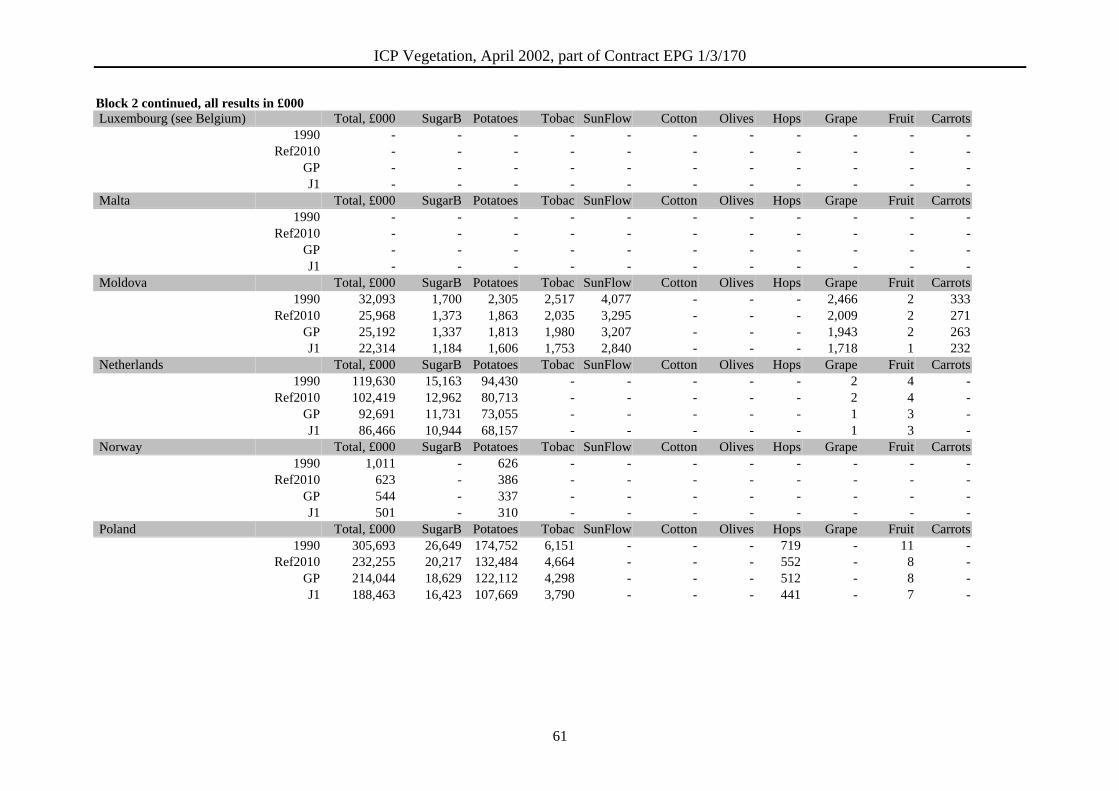
ICP Vegetation, April 2002, part of Contract EPG 1/3/170
61
Block 2 continued, all results in £000 Luxembourg (see Belgium) Total, £000 SugarB Potatoes Tobac SunFlow Cotton Olives Hops Grape Fruit Carrots
1990 - - - - - - - - - - -Ref2010 - - - - - - - - - - -
GP - - - - - - - - - - -J1 - - - - - - - - - - -
Malta Total, £000 SugarB Potatoes Tobac SunFlow Cotton Olives Hops Grape Fruit Carrots1990 - - - - - - - - - - -
Ref2010 - - - - - - - - - - -GP - - - - - - - - - - -J1 - - - - - - - - - - -
Moldova Total, £000 SugarB Potatoes Tobac SunFlow Cotton Olives Hops Grape Fruit Carrots1990 32,093 1,700 2,305 2,517 4,077 - - - 2,466 2 333
Ref2010 25,968 1,373 1,863 2,035 3,295 - - - 2,009 2 271GP 25,192 1,337 1,813 1,980 3,207 - - - 1,943 2 263J1 22,314 1,184 1,606 1,753 2,840 - - - 1,718 1 232
Netherlands Total, £000 SugarB Potatoes Tobac SunFlow Cotton Olives Hops Grape Fruit Carrots1990 119,630 15,163 94,430 - - - - - 2 4 -
Ref2010 102,419 12,962 80,713 - - - - - 2 4 -GP 92,691 11,731 73,055 - - - - - 1 3 -J1 86,466 10,944 68,157 - - - - - 1 3 -
Norway Total, £000 SugarB Potatoes Tobac SunFlow Cotton Olives Hops Grape Fruit Carrots1990 1,011 - 626 - - - - - - - -
Ref2010 623 - 386 - - - - - - - -GP 544 - 337 - - - - - - - -J1 501 - 310 - - - - - - - -
Poland Total, £000 SugarB Potatoes Tobac SunFlow Cotton Olives Hops Grape Fruit Carrots1990 305,693 26,649 174,752 6,151 - - - 719 - 11 -
Ref2010 232,255 20,217 132,484 4,664 - - - 552 - 8 -GP 214,044 18,629 122,112 4,298 - - - 512 - 8 -J1 188,463 16,423 107,669 3,790 - - - 441 - 7 -
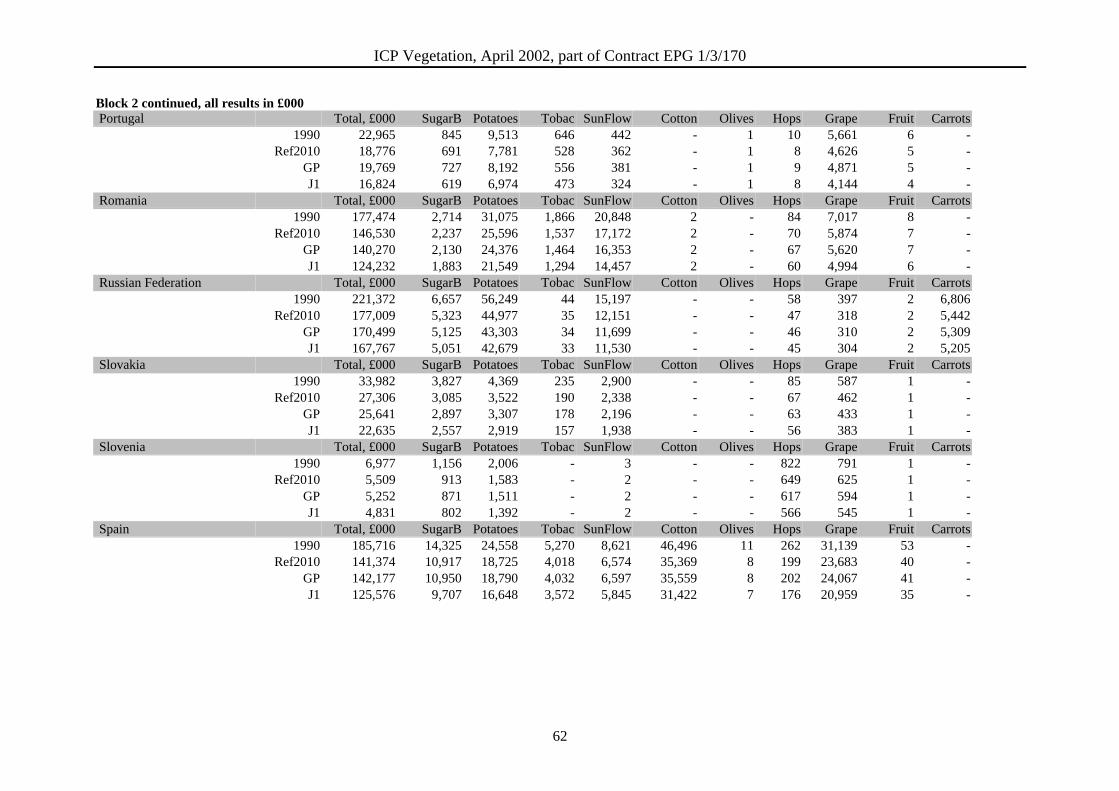
ICP Vegetation, April 2002, part of Contract EPG 1/3/170
62
Block 2 continued, all results in £000 Portugal Total, £000 SugarB Potatoes Tobac SunFlow Cotton Olives Hops Grape Fruit Carrots
1990 22,965 845 9,513 646 442 - 1 10 5,661 6 -Ref2010 18,776 691 7,781 528 362 - 1 8 4,626 5 -
GP 19,769 727 8,192 556 381 - 1 9 4,871 5 -J1 16,824 619 6,974 473 324 - 1 8 4,144 4 -
Romania Total, £000 SugarB Potatoes Tobac SunFlow Cotton Olives Hops Grape Fruit Carrots1990 177,474 2,714 31,075 1,866 20,848 2 - 84 7,017 8 -
Ref2010 146,530 2,237 25,596 1,537 17,172 2 - 70 5,874 7 -GP 140,270 2,130 24,376 1,464 16,353 2 - 67 5,620 7 -J1 124,232 1,883 21,549 1,294 14,457 2 - 60 4,994 6 -
Russian Federation Total, £000 SugarB Potatoes Tobac SunFlow Cotton Olives Hops Grape Fruit Carrots1990 221,372 6,657 56,249 44 15,197 - - 58 397 2 6,806
Ref2010 177,009 5,323 44,977 35 12,151 - - 47 318 2 5,442GP 170,499 5,125 43,303 34 11,699 - - 46 310 2 5,309J1 167,767 5,051 42,679 33 11,530 - - 45 304 2 5,205
Slovakia Total, £000 SugarB Potatoes Tobac SunFlow Cotton Olives Hops Grape Fruit Carrots1990 33,982 3,827 4,369 235 2,900 - - 85 587 1 -
Ref2010 27,306 3,085 3,522 190 2,338 - - 67 462 1 -GP 25,641 2,897 3,307 178 2,196 - - 63 433 1 -J1 22,635 2,557 2,919 157 1,938 - - 56 383 1 -
Slovenia Total, £000 SugarB Potatoes Tobac SunFlow Cotton Olives Hops Grape Fruit Carrots1990 6,977 1,156 2,006 - 3 - - 822 791 1 -
Ref2010 5,509 913 1,583 - 2 - - 649 625 1 -GP 5,252 871 1,511 - 2 - - 617 594 1 -J1 4,831 802 1,392 - 2 - - 566 545 1 -
Spain Total, £000 SugarB Potatoes Tobac SunFlow Cotton Olives Hops Grape Fruit Carrots1990 185,716 14,325 24,558 5,270 8,621 46,496 11 262 31,139 53 -
Ref2010 141,374 10,917 18,725 4,018 6,574 35,369 8 199 23,683 40 -GP 142,177 10,950 18,790 4,032 6,597 35,559 8 202 24,067 41 -J1 125,576 9,707 16,648 3,572 5,845 31,422 7 176 20,959 35 -
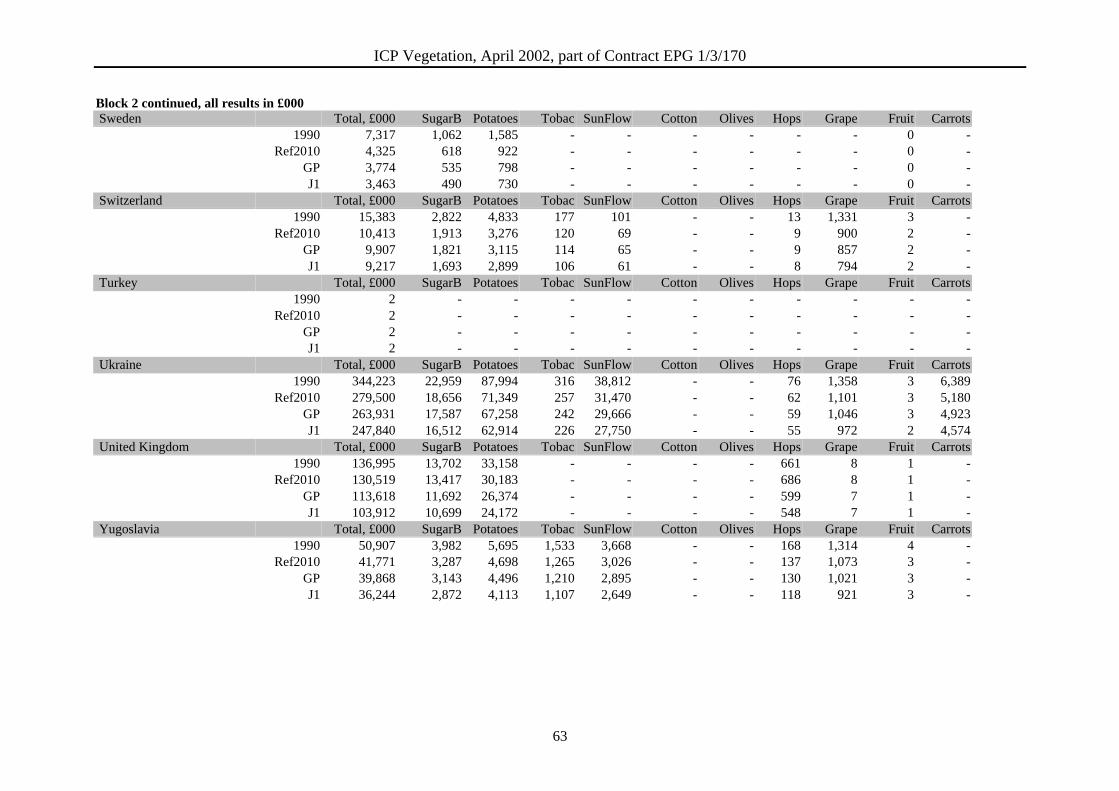
ICP Vegetation, April 2002, part of Contract EPG 1/3/170
63
Block 2 continued, all results in £000 Sweden Total, £000 SugarB Potatoes Tobac SunFlow Cotton Olives Hops Grape Fruit Carrots
1990 7,317 1,062 1,585 - - - - - - 0 -Ref2010 4,325 618 922 - - - - - - 0 -
GP 3,774 535 798 - - - - - - 0 -J1 3,463 490 730 - - - - - - 0 -
Switzerland Total, £000 SugarB Potatoes Tobac SunFlow Cotton Olives Hops Grape Fruit Carrots1990 15,383 2,822 4,833 177 101 - - 13 1,331 3 -
Ref2010 10,413 1,913 3,276 120 69 - - 9 900 2 -GP 9,907 1,821 3,115 114 65 - - 9 857 2 -J1 9,217 1,693 2,899 106 61 - - 8 794 2 -
Turkey Total, £000 SugarB Potatoes Tobac SunFlow Cotton Olives Hops Grape Fruit Carrots1990 2 - - - - - - - - - -
Ref2010 2 - - - - - - - - - -GP 2 - - - - - - - - - -J1 2 - - - - - - - - - -
Ukraine Total, £000 SugarB Potatoes Tobac SunFlow Cotton Olives Hops Grape Fruit Carrots1990 344,223 22,959 87,994 316 38,812 - - 76 1,358 3 6,389
Ref2010 279,500 18,656 71,349 257 31,470 - - 62 1,101 3 5,180GP 263,931 17,587 67,258 242 29,666 - - 59 1,046 3 4,923J1 247,840 16,512 62,914 226 27,750 - - 55 972 2 4,574
United Kingdom Total, £000 SugarB Potatoes Tobac SunFlow Cotton Olives Hops Grape Fruit Carrots1990 136,995 13,702 33,158 - - - - 661 8 1 -
Ref2010 130,519 13,417 30,183 - - - - 686 8 1 -GP 113,618 11,692 26,374 - - - - 599 7 1 -J1 103,912 10,699 24,172 - - - - 548 7 1 -
Yugoslavia Total, £000 SugarB Potatoes Tobac SunFlow Cotton Olives Hops Grape Fruit Carrots1990 50,907 3,982 5,695 1,533 3,668 - - 168 1,314 4 -
Ref2010 41,771 3,287 4,698 1,265 3,026 - - 137 1,073 3 -GP 39,868 3,143 4,496 1,210 2,895 - - 130 1,021 3 -J1 36,244 2,872 4,113 1,107 2,649 - - 118 921 3 -
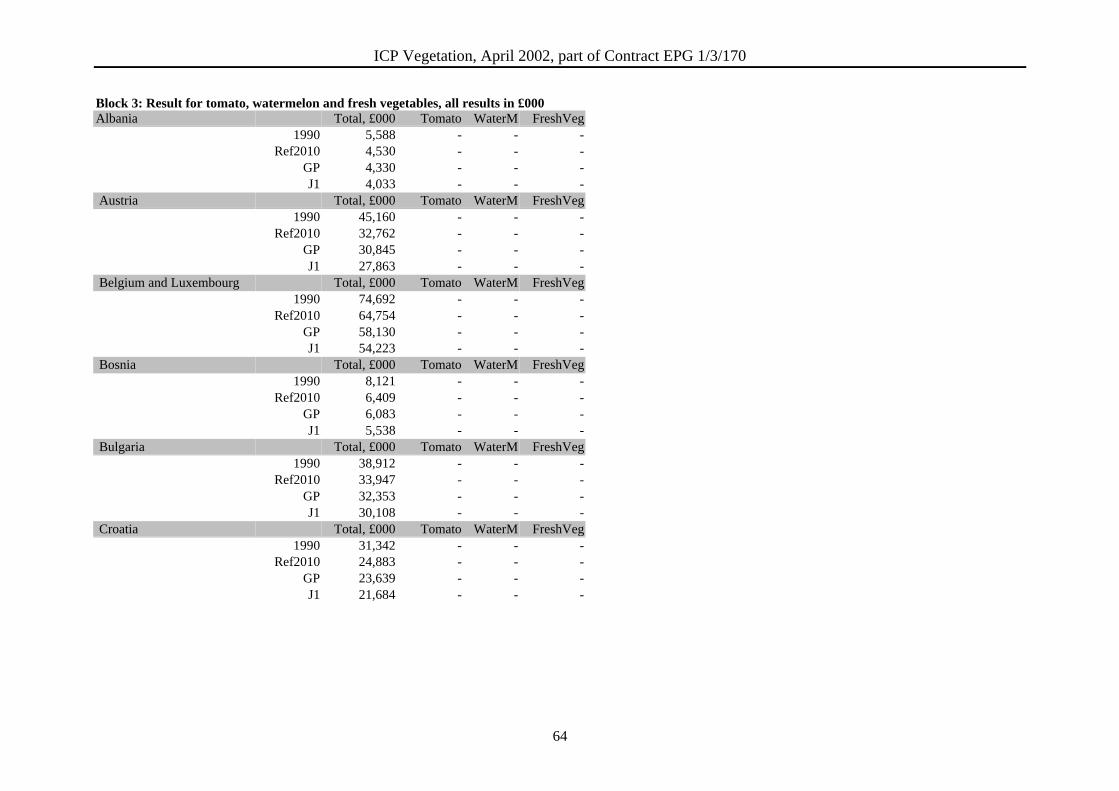
ICP Vegetation, April 2002, part of Contract EPG 1/3/170
64
Block 3: Result for tomato, watermelon and fresh vegetables, all results in £000Albania Total, £000 Tomato WaterM FreshVeg
1990 5,588 - - -Ref2010 4,530 - - -
GP 4,330 - - -J1 4,033 - - -
Austria Total, £000 Tomato WaterM FreshVeg1990 45,160 - - -
Ref2010 32,762 - - -GP 30,845 - - -J1 27,863 - - -
Belgium and Luxembourg Total, £000 Tomato WaterM FreshVeg1990 74,692 - - -
Ref2010 64,754 - - -GP 58,130 - - -J1 54,223 - - -
Bosnia Total, £000 Tomato WaterM FreshVeg1990 8,121 - - -
Ref2010 6,409 - - -GP 6,083 - - -J1 5,538 - - -
Bulgaria Total, £000 Tomato WaterM FreshVeg1990 38,912 - - -
Ref2010 33,947 - - -GP 32,353 - - -J1 30,108 - - -
Croatia Total, £000 Tomato WaterM FreshVeg1990 31,342 - - -
Ref2010 24,883 - - -GP 23,639 - - -J1 21,684 - - -
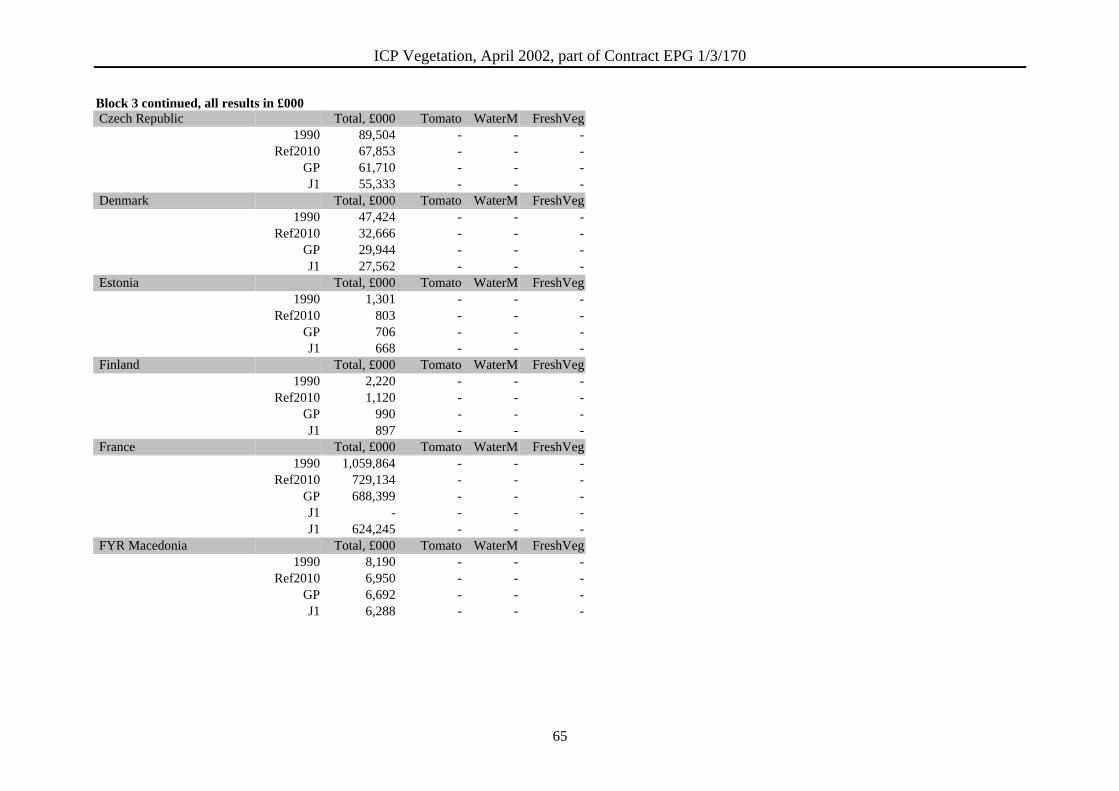
ICP Vegetation, April 2002, part of Contract EPG 1/3/170
65
Block 3 continued, all results in £000 Czech Republic Total, £000 Tomato WaterM FreshVeg
1990 89,504 - - -Ref2010 67,853 - - -
GP 61,710 - - -J1 55,333 - - -
Denmark Total, £000 Tomato WaterM FreshVeg1990 47,424 - - -
Ref2010 32,666 - - -GP 29,944 - - -J1 27,562 - - -
Estonia Total, £000 Tomato WaterM FreshVeg1990 1,301 - - -
Ref2010 803 - - -GP 706 - - -J1 668 - - -
Finland Total, £000 Tomato WaterM FreshVeg1990 2,220 - - -
Ref2010 1,120 - - -GP 990 - - -J1 897 - - -
France Total, £000 Tomato WaterM FreshVeg1990 1,059,864 - - -
Ref2010 729,134 - - -GP 688,399 - - -J1 - - - -J1 624,245 - - -
FYR Macedonia Total, £000 Tomato WaterM FreshVeg1990 8,190 - - -
Ref2010 6,950 - - -GP 6,692 - - -J1 6,288 - - -
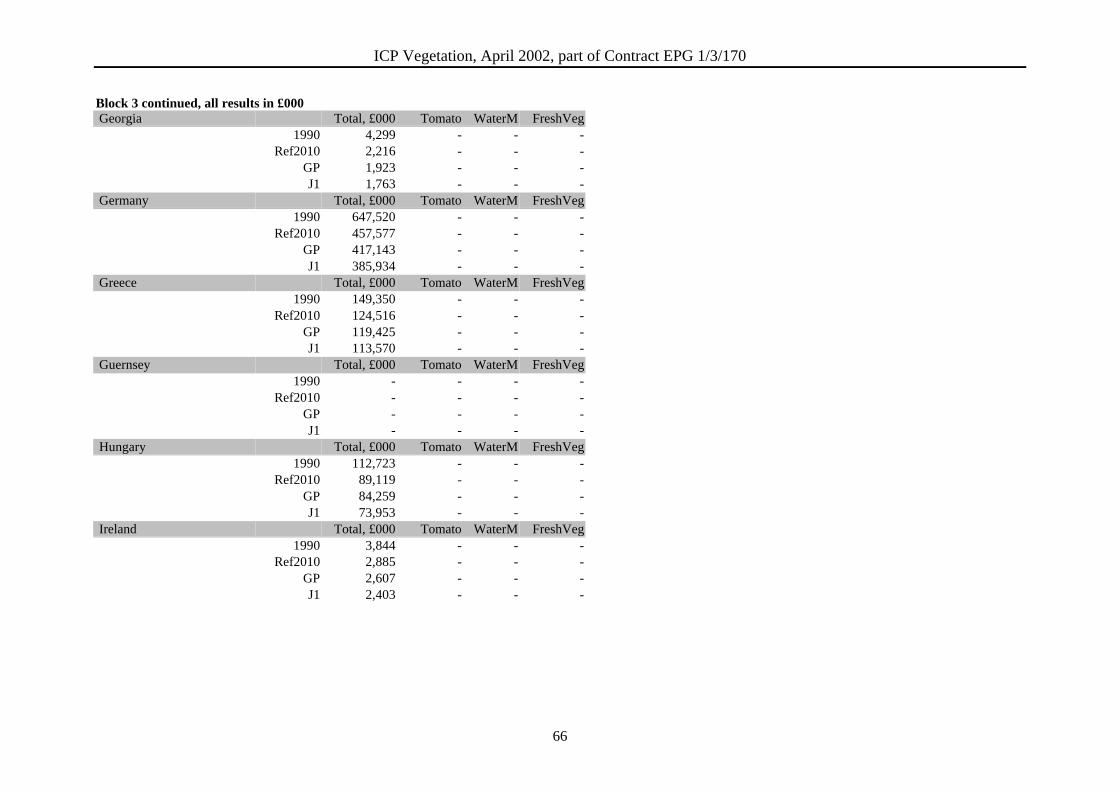
ICP Vegetation, April 2002, part of Contract EPG 1/3/170
66
Block 3 continued, all results in £000 Georgia Total, £000 Tomato WaterM FreshVeg
1990 4,299 - - -Ref2010 2,216 - - -
GP 1,923 - - -J1 1,763 - - -
Germany Total, £000 Tomato WaterM FreshVeg1990 647,520 - - -
Ref2010 457,577 - - -GP 417,143 - - -J1 385,934 - - -
Greece Total, £000 Tomato WaterM FreshVeg1990 149,350 - - -
Ref2010 124,516 - - -GP 119,425 - - -J1 113,570 - - -
Guernsey Total, £000 Tomato WaterM FreshVeg1990 - - - -
Ref2010 - - - -GP - - - -J1 - - - -
Hungary Total, £000 Tomato WaterM FreshVeg1990 112,723 - - -
Ref2010 89,119 - - -GP 84,259 - - -J1 73,953 - - -
Ireland Total, £000 Tomato WaterM FreshVeg1990 3,844 - - -
Ref2010 2,885 - - -GP 2,607 - - -J1 2,403 - - -
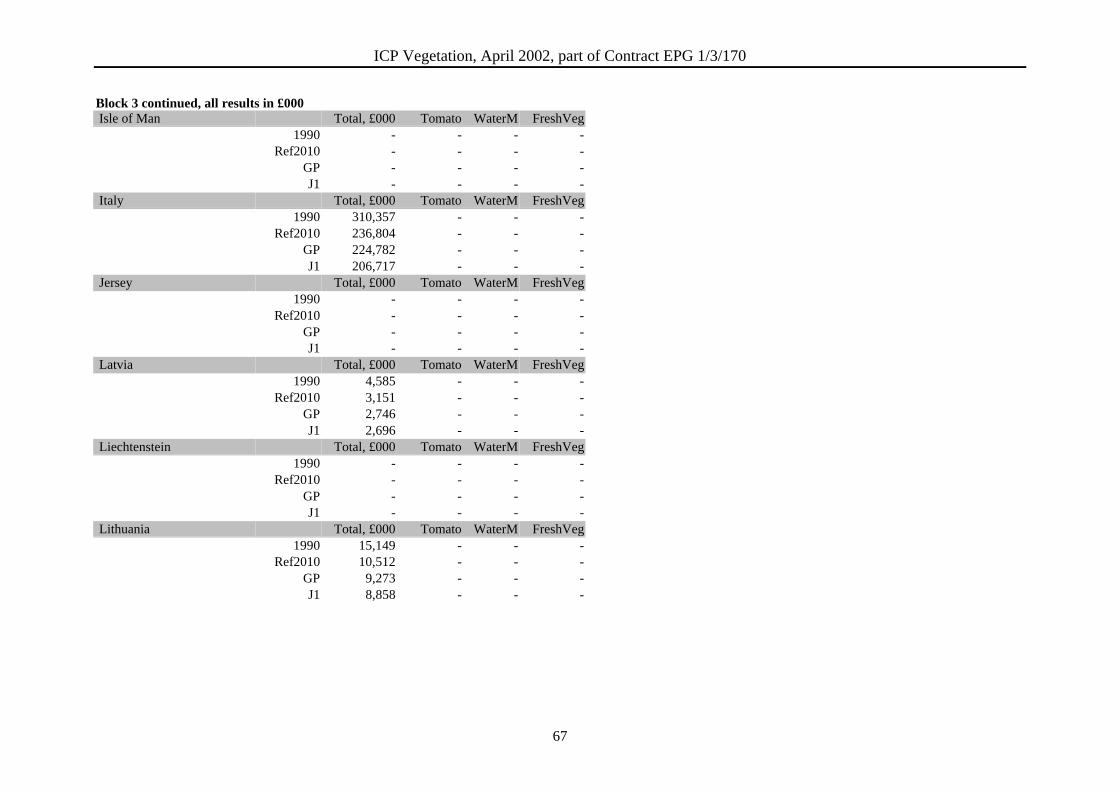
ICP Vegetation, April 2002, part of Contract EPG 1/3/170
67
Block 3 continued, all results in £000 Isle of Man Total, £000 Tomato WaterM FreshVeg
1990 - - - -Ref2010 - - - -
GP - - - -J1 - - - -
Italy Total, £000 Tomato WaterM FreshVeg1990 310,357 - - -
Ref2010 236,804 - - -GP 224,782 - - -J1 206,717 - - -
Jersey Total, £000 Tomato WaterM FreshVeg1990 - - - -
Ref2010 - - - -GP - - - -J1 - - - -
Latvia Total, £000 Tomato WaterM FreshVeg1990 4,585 - - -
Ref2010 3,151 - - -GP 2,746 - - -J1 2,696 - - -
Liechtenstein Total, £000 Tomato WaterM FreshVeg1990 - - - -
Ref2010 - - - -GP - - - -J1 - - - -
Lithuania Total, £000 Tomato WaterM FreshVeg1990 15,149 - - -
Ref2010 10,512 - - -GP 9,273 - - -J1 8,858 - - -
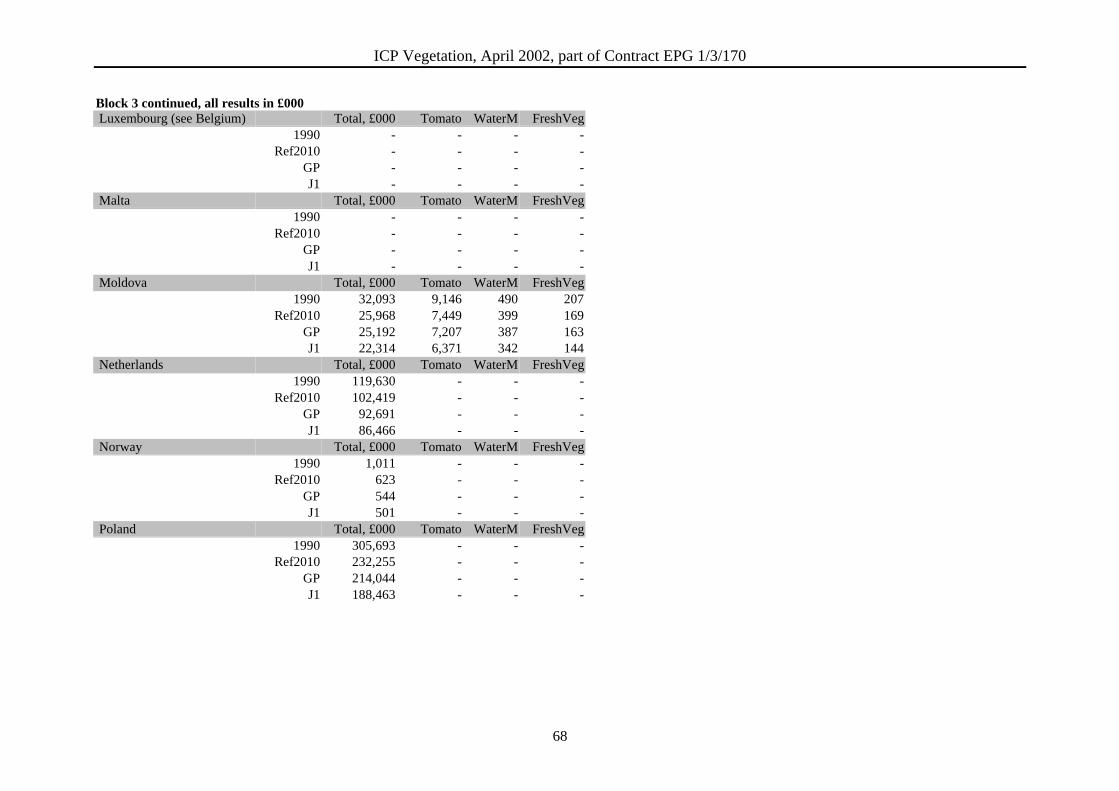
ICP Vegetation, April 2002, part of Contract EPG 1/3/170
68
Block 3 continued, all results in £000 Luxembourg (see Belgium) Total, £000 Tomato WaterM FreshVeg
1990 - - - -Ref2010 - - - -
GP - - - -J1 - - - -
Malta Total, £000 Tomato WaterM FreshVeg1990 - - - -
Ref2010 - - - -GP - - - -J1 - - - -
Moldova Total, £000 Tomato WaterM FreshVeg1990 32,093 9,146 490 207
Ref2010 25,968 7,449 399 169GP 25,192 7,207 387 163J1 22,314 6,371 342 144
Netherlands Total, £000 Tomato WaterM FreshVeg1990 119,630 - - -
Ref2010 102,419 - - -GP 92,691 - - -J1 86,466 - - -
Norway Total, £000 Tomato WaterM FreshVeg1990 1,011 - - -
Ref2010 623 - - -GP 544 - - -J1 501 - - -
Poland Total, £000 Tomato WaterM FreshVeg1990 305,693 - - -
Ref2010 232,255 - - -GP 214,044 - - -J1 188,463 - - -
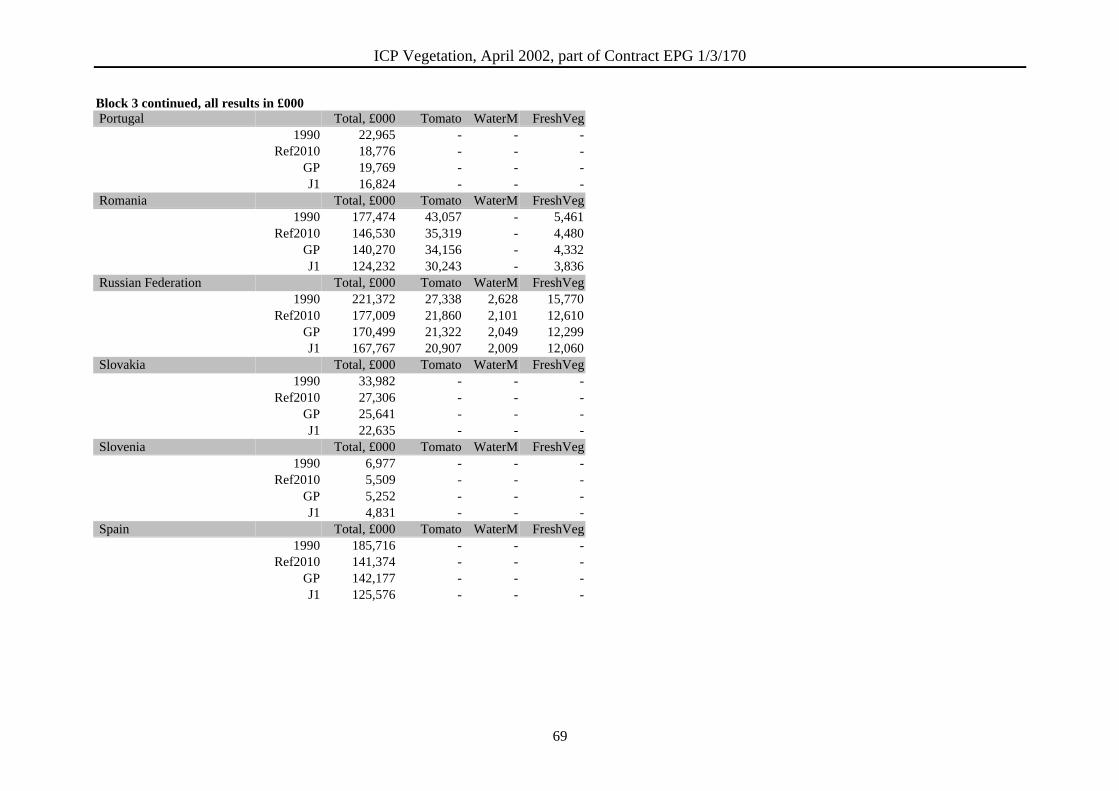
ICP Vegetation, April 2002, part of Contract EPG 1/3/170
69
Block 3 continued, all results in £000 Portugal Total, £000 Tomato WaterM FreshVeg
1990 22,965 - - -Ref2010 18,776 - - -
GP 19,769 - - -J1 16,824 - - -
Romania Total, £000 Tomato WaterM FreshVeg1990 177,474 43,057 - 5,461
Ref2010 146,530 35,319 - 4,480GP 140,270 34,156 - 4,332J1 124,232 30,243 - 3,836
Russian Federation Total, £000 Tomato WaterM FreshVeg1990 221,372 27,338 2,628 15,770
Ref2010 177,009 21,860 2,101 12,610GP 170,499 21,322 2,049 12,299J1 167,767 20,907 2,009 12,060
Slovakia Total, £000 Tomato WaterM FreshVeg1990 33,982 - - -
Ref2010 27,306 - - -GP 25,641 - - -J1 22,635 - - -
Slovenia Total, £000 Tomato WaterM FreshVeg1990 6,977 - - -
Ref2010 5,509 - - -GP 5,252 - - -J1 4,831 - - -
Spain Total, £000 Tomato WaterM FreshVeg1990 185,716 - - -
Ref2010 141,374 - - -GP 142,177 - - -J1 125,576 - - -
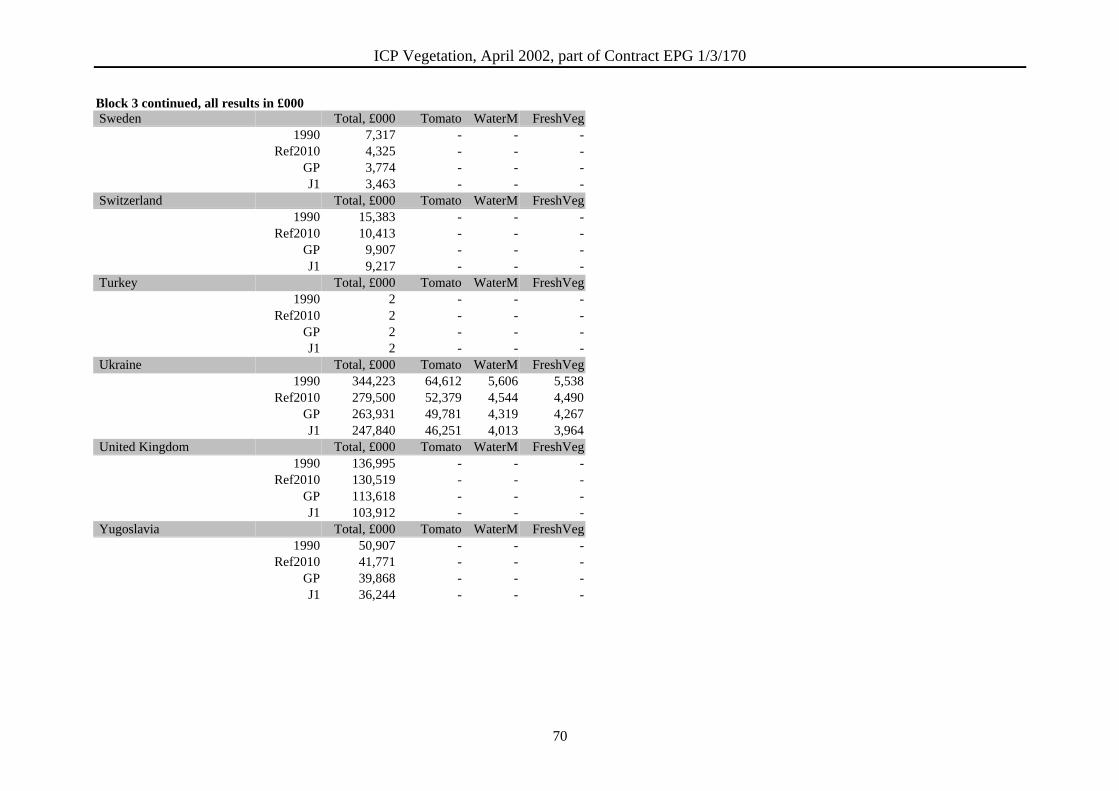
ICP Vegetation, April 2002, part of Contract EPG 1/3/170
70
Block 3 continued, all results in £000 Sweden Total, £000 Tomato WaterM FreshVeg
1990 7,317 - - -Ref2010 4,325 - - -
GP 3,774 - - -J1 3,463 - - -
Switzerland Total, £000 Tomato WaterM FreshVeg1990 15,383 - - -
Ref2010 10,413 - - -GP 9,907 - - -J1 9,217 - - -
Turkey Total, £000 Tomato WaterM FreshVeg1990 2 - - -
Ref2010 2 - - -GP 2 - - -J1 2 - - -
Ukraine Total, £000 Tomato WaterM FreshVeg1990 344,223 64,612 5,606 5,538
Ref2010 279,500 52,379 4,544 4,490GP 263,931 49,781 4,319 4,267J1 247,840 46,251 4,013 3,964
United Kingdom Total, £000 Tomato WaterM FreshVeg1990 136,995 - - -
Ref2010 130,519 - - -GP 113,618 - - -J1 103,912 - - -
Yugoslavia Total, £000 Tomato WaterM FreshVeg1990 50,907 - - -
Ref2010 41,771 - - -GP 39,868 - - -J1 36,244 - - -
ICP Vegetation, April 2002, part of Contract EPG 1/3/170
71
Top Related
Copyright © 2022 FDOKUMEN

