


Bahasa
Halaman
Hukum

Trivedi et al., IJPSR, 2013; Vol. 4(12): 4567-4572. E-ISSN: 0975-8232; P-ISSN: 2320-5148
International Journal of Pharmaceutical Sciences and Research 4567
IJPSR (2013), Vol. 4, Issue 12 (Research Article)
Received on 05 July, 2013; received in revised form, 25 August, 2013; accepted, 16 November, 2013; published 01 December, 2013
DEVELOPMENT AND VALIDATION OF SPECTROPHOTOMETRIC METHOD FOR THE
ESTIMATION OF RITONAVIR IN TABLET DOSAGE FORM
C.D. Trivedi*, R. B. Mardia, B.N. Suhagia and S.P. Chauhan
Faculty of Pharmacy Dharamsinh Desai University, Nadiad- 387001, Gujarat, India
ABSTRACT: A simple, precise, accurate and repeatable method for
bulk and tablet dosage form of Ritonavir have been developed using
spectrophotometric method. Differential spectrophotometric method
was used. The developed method was validated according to ICH
(Q2R1) guidelines and was found to be accurate, precise and specific.
Amplitude difference was taken at absorbance maxima at 246 nm and
absorbance minima at 266 nm. Linearity range was found to be within
the concentration range of 10-30 μg/mL. Limit of detection and
quantification was found to be 2.62 and 7.96 μg/mL respectively. The
proposed method was found accurate in the range of 95.5 to 105.5%. It
can be successfully applied for the estimation of Ritonavir in bulk and
pharmaceutical dosage forms. Results of the analysis were validated
statistically and by recovery studies.
INTRODUCTION: Ritonavir, an anti-retro-viral
agent (HIV protease inhibitor), chemically it is 1,3-
thiazol-5-ylmethyl N-[(2S,3S,5S)-3-hydroxy-5-
[(2S)-3-methyl-2-{[methyl({[2-(propan-2-yl)-1,3-
thiazol-4-yl]methyl})carbamoyl]amino}butan
amido]-1,6-diphenylhexan-2-yl]carbamate (figure
1), having molecular formula C37H48N6O5S2 and
molecular weight 720.944. Ritonavir has been
reported to be quantified individually or in
combination by spectrophotographic method and
HPLC 1, 2
.
Literature survey revealed that few analytical
methods are available for determination of
Ritonavir from biological fluid with combination
of other drugs by RP-HPLC 3, 4, 5
.
QUICK RESPONSE CODE
DOI: 10.13040/IJPSR.0975-8232.4(12).4567-72
Article can be accessed online on: www.ijpsr.com
DOI link: http://dx.doi.org/10.13040/IJPSR.0975-8232.4(12).4567-72
Isosorbide mononitrate is a nitrate- class drug used
for the prophylactic treatment of angina pectoris;
that is, it is taken in order to prevent or at least
reduce the occurrence of angina 3.
There were many methods for Ritonavir estimation
including spectroscopic methods 6, 7, 8, 9
as well as
RP-HPLC 10
methods. But no any difference
spectrometric method has been reported for
estimation of Ritonavir. So it was thought of our
interest to develop and validate simple difference
spectrometric method by measuring absorbance
difference in two equimolar solution of Ritonavir
different chemical form which exhibit different
spectral characteristics. Difference spectroscopy 13
is selectivity and accuracy of spectrophotometric
analysis of sample containing absorbing interferent
may be markedly improved by the technique of
difference spectrometry. The essential feature of a
difference spectroscopic assay is that measured
value is the difference absorbance (∆A) between
two equimolar solutions of the analyte in different
chemical form which exhibit different spectral
characteristics.
Keywords:
Ritonavir, Differential
spectrophotometric method, accurate,
precise
Correspondence to Author:
Chintan Trivedi
Faculty of Pharmacy Dharamsinh
Desai University, Nadiad- 387001,
Gujarat, India
E-mail: [email protected]
Trivedi et al., IJPSR, 2013; Vol. 4(12): 4567-4572. E-ISSN: 0975-8232; P-ISSN: 2320-5148
International Journal of Pharmaceutical Sciences and Research 4568
FIGURE 1: STRUCTURE OF RITONAVIR
1
EXPERIMENTAL:
Materials: Ritonavir API was obtained from
Aurobindo, Hyderabad obtained as a gift sample.
Dosage form of Ritonavir, Viriton (Ranbaxy,
Mumbai) Tablet labeled to contain 100 mg of
ritonavir was purchased from local market.
In Reagents, Sodium hydroxide (0.1 N) solution
which was prepared by weighing 4 gm and
dissolved and diluted up to 1000 ml using distilled
water in laboratory. Distilled water was prepared
by using distillation assembly in laboratory.
Methanol having AR grade was used for preparing
solutions.
Instrument, Shimadzu UV 1800 UV-visible
double-beam spectrophotometer with 1 cm
matched quartz cells was used.
Method development:
1. Selection of solvent: Selection of solvent
was carried out by checking the solubility
of Ritonavir in different solvents. Various
solvents were used like distilled water,
methanol etc. Methanol was selected as a
solvent on the basis of solubility of
Ritonavir.
2. Preparation of stock solution: The given
standard drug Ritonavir was weighed
accurately (0.1 gm) and transferred to 100
ml volumetric flask. To prepare solution
having concentration 1000 µg/ml (100 ml),
it was dissolved and diluted up to the mark
by methanol which was used as a solvent.
This solution was stored as a stock solution.
From this solution calibrating standards
were prepared.
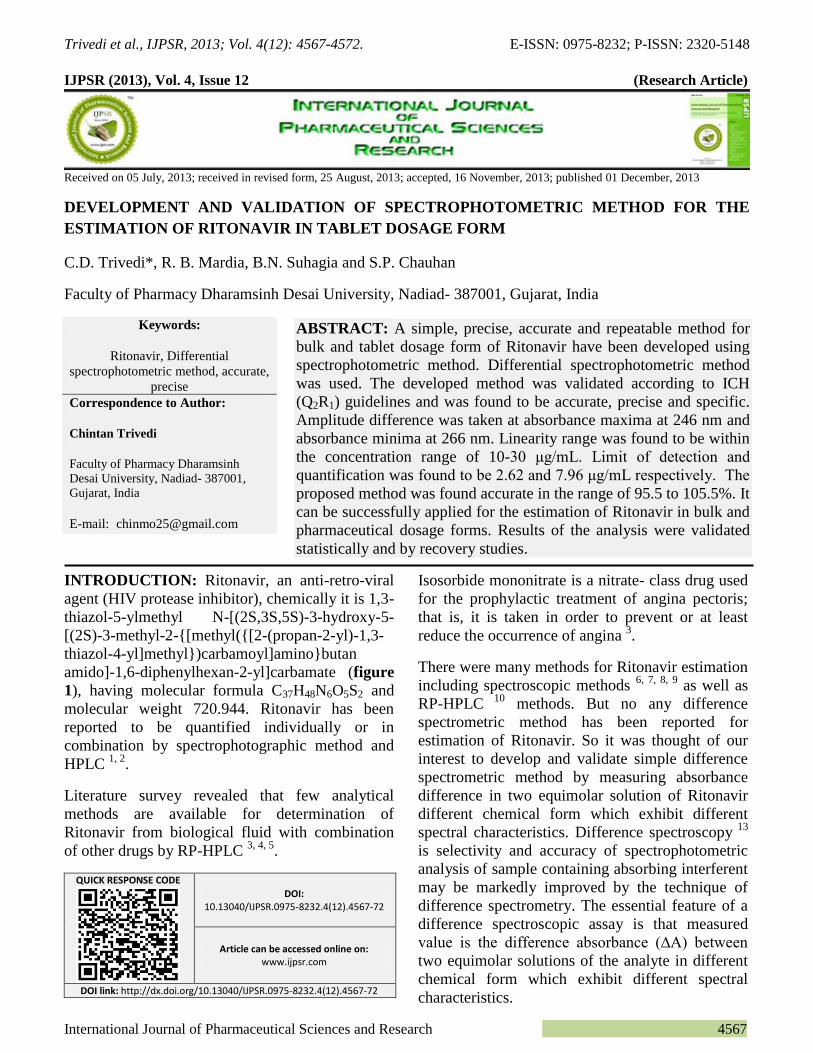
3. Preparation of calibrating standards:
From the stock solution solutions having
concentration 10 ppm, 15 ppm, 20 ppm, 25
ppm and 30 ppm were prepared. For this
we had withdrawn 0.5 ml, 0.75 ml, 1 ml,
1.25 ml and 1.5 ml in five 50 ml volumetric
flask. These solutions were diluted with
methanol upto the mark so the resulting
solutions have concentration of 10, 15, 20,
25, 30 ppm respectively. Using these
solutions scanning between 200-400 nm
was taken with help of UV instrument
(Figure 2).
FIGURE 2: OVERLAIN SPECTRA OF RITONAVIR IN
METHANOL FROM 10 TO 30 PPM BETWEEN 200-400
nm
Selection of solvent for difference spectroscopic
method condition: Differential Spectrophoto-
metric method was selected for the further process.
There were three solvents tried (NaOH, HCl, and
Water) randomly by making set of two solvents.
For the six possibilities e.g. one of the above
solvent was taken as reference and other one was
taken as sample or test and baseline was corrected.
From them based on linearity NaOH as reference
and Water as test possibility was selected. The
calibration curve was as follow.
In this 5 volumetric flasks were taken. To each
flask 0.5 ml, 0.75 ml, 1 ml, 1.25 ml, 1.50 ml stock
solution (1000μg/ml) was added respectively. Then
it was diluted with NaOH up to the mark. That
gave solution having concentration 10, 15, 20, 25,
30 ppm. Similarly solutions having same
concentrations were prepared in water. In UV
spectrometer, cuvette having NaOH solution was
kept in reference holder and cuvette having water
solution was kept in test holder.
Trivedi et al., IJPSR, 2013; Vol. 4(12): 4567-4572. E-ISSN: 0975-8232; P-ISSN: 2320-5148
International Journal of Pharmaceutical Sciences and Research 4569
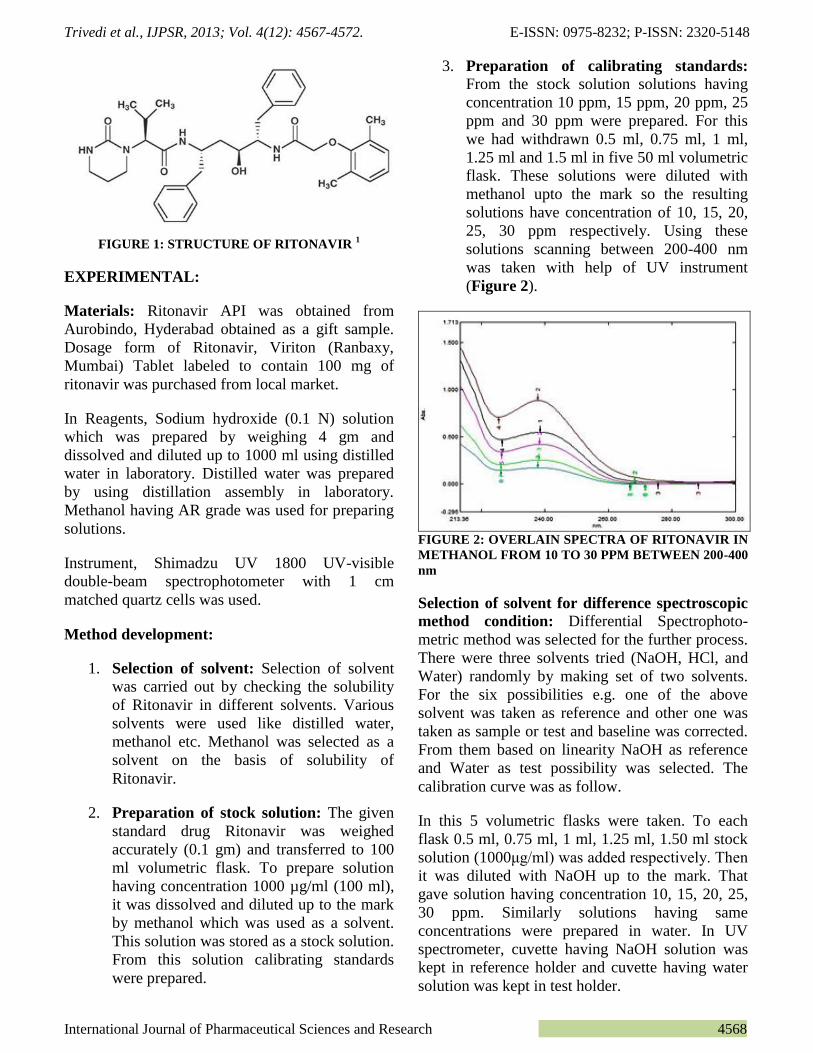
The base line was taken using NaOH and water as
a blank between 200nm to 400nm. The solution of
NaOH having concentration 10 ppm was filled in
cuvette and kept in reference holder while solution
of water having concentration 10 ppm was filled in
cuvette and was kept in test holder. Then the
spectrums between 200-400 nm were taken.
Remaining calibration standards were scanned in
above manner and their spectrums were taken.
(Figure 3) Then 1st derivative spectra were
calculated and overlain as shown in figure 4.
FIGURE 3: DIFFERENTIAL SPECTRUMS IN NaOH
(AS REFERENCE) AND WATER (AS TEST)
FIGURE 4: 1
ST DERIVATIVE DIFFERENCE OF
SPECTRUM OF RITONAVIR IN NaOH (REFERENCE)
AND WATER (TEST)
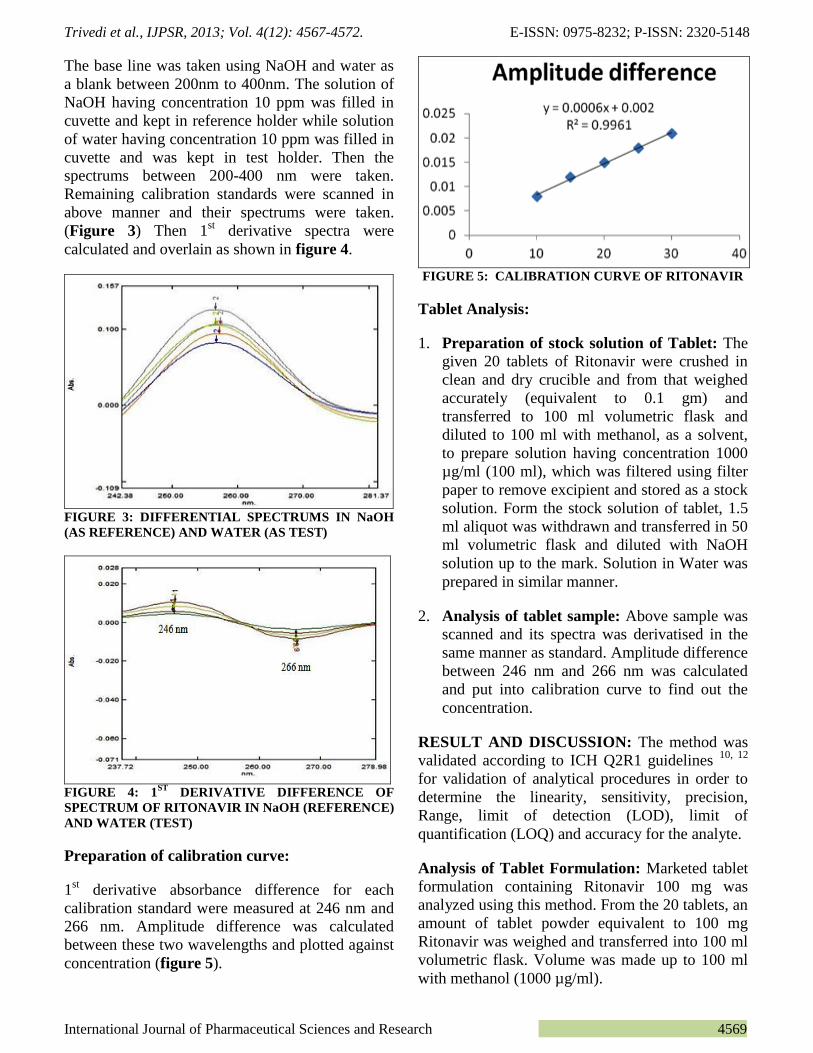
Preparation of calibration curve:
1st derivative absorbance difference for each
calibration standard were measured at 246 nm and
266 nm. Amplitude difference was calculated
between these two wavelengths and plotted against
concentration (figure 5).
FIGURE 5: CALIBRATION CURVE OF RITONAVIR
Tablet Analysis:
1. Preparation of stock solution of Tablet: The
given 20 tablets of Ritonavir were crushed in
clean and dry crucible and from that weighed
accurately (equivalent to 0.1 gm) and
transferred to 100 ml volumetric flask and
diluted to 100 ml with methanol, as a solvent,
to prepare solution having concentration 1000
µg/ml (100 ml), which was filtered using filter
paper to remove excipient and stored as a stock
solution. Form the stock solution of tablet, 1.5
ml aliquot was withdrawn and transferred in 50
ml volumetric flask and diluted with NaOH
solution up to the mark. Solution in Water was
prepared in similar manner.
2. Analysis of tablet sample: Above sample was
scanned and its spectra was derivatised in the
same manner as standard. Amplitude difference
between 246 nm and 266 nm was calculated
and put into calibration curve to find out the
concentration.
RESULT AND DISCUSSION: The method was
validated according to ICH Q2R1 guidelines 10, 12
for validation of analytical procedures in order to
determine the linearity, sensitivity, precision,
Range, limit of detection (LOD), limit of
quantification (LOQ) and accuracy for the analyte.
Analysis of Tablet Formulation: Marketed tablet
formulation containing Ritonavir 100 mg was
analyzed using this method. From the 20 tablets, an
amount of tablet powder equivalent to 100 mg
Ritonavir was weighed and transferred into 100 ml
volumetric flask. Volume was made up to 100 ml
with methanol (1000 µg/ml).
256 nm
Trivedi et al., IJPSR, 2013; Vol. 4(12): 4567-4572. E-ISSN: 0975-8232; P-ISSN: 2320-5148
International Journal of Pharmaceutical Sciences and Research 4570
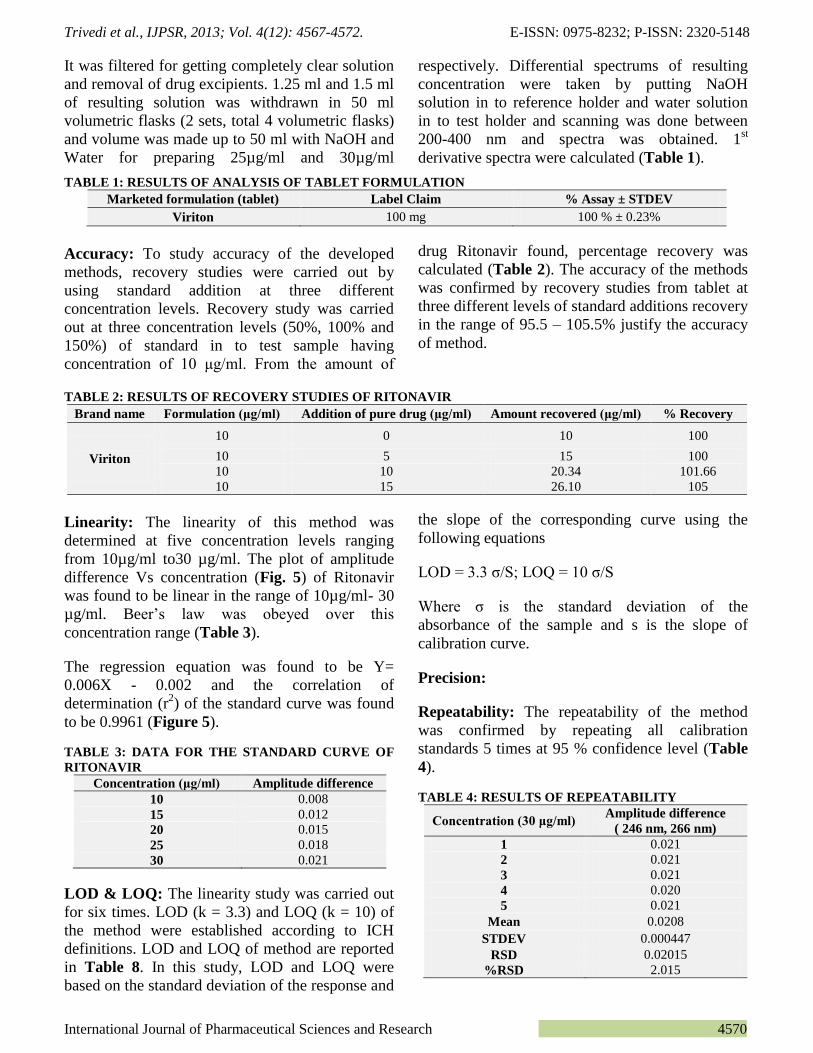
It was filtered for getting completely clear solution
and removal of drug excipients. 1.25 ml and 1.5 ml
of resulting solution was withdrawn in 50 ml
volumetric flasks (2 sets, total 4 volumetric flasks)
and volume was made up to 50 ml with NaOH and
Water for preparing 25µg/ml and 30µg/ml
respectively. Differential spectrums of resulting
concentration were taken by putting NaOH
solution in to reference holder and water solution
in to test holder and scanning was done between
200-400 nm and spectra was obtained. 1st
derivative spectra were calculated (Table 1).
TABLE 1: RESULTS OF ANALYSIS OF TABLET FORMULATION
Marketed formulation (tablet) Label Claim % Assay ± STDEV
Viriton 100 mg 100 % ± 0.23%
Accuracy: To study accuracy of the developed
methods, recovery studies were carried out by
using standard addition at three different
concentration levels. Recovery study was carried
out at three concentration levels (50%, 100% and
150%) of standard in to test sample having
concentration of 10 μg/ml. From the amount of
drug Ritonavir found, percentage recovery was
calculated (Table 2). The accuracy of the methods
was confirmed by recovery studies from tablet at
three different levels of standard additions recovery
in the range of 95.5 – 105.5% justify the accuracy
of method.
TABLE 2: RESULTS OF RECOVERY STUDIES OF RITONAVIR
Brand name Formulation (μg/ml) Addition of pure drug (μg/ml) Amount recovered (μg/ml) % Recovery
Viriton
10 0 10 100
10 5 15 100
10 10 20.34 101.66
10 15 26.10 105
Linearity: The linearity of this method was
determined at five concentration levels ranging
from 10µg/ml to30 µg/ml. The plot of amplitude
difference Vs concentration (Fig. 5) of Ritonavir
was found to be linear in the range of 10µg/ml- 30
µg/ml. Beer’s law was obeyed over this
concentration range (Table 3).
The regression equation was found to be Y=
0.006X - 0.002 and the correlation of
determination (r2) of the standard curve was found
to be 0.9961 (Figure 5).
TABLE 3: DATA FOR THE STANDARD CURVE OF
RITONAVIR
Concentration (μg/ml) Amplitude difference
10 0.008
15 0.012
20 0.015
25 0.018
30 0.021
LOD & LOQ: The linearity study was carried out
for six times. LOD (k = 3.3) and LOQ (k = 10) of
the method were established according to ICH
definitions. LOD and LOQ of method are reported
in Table 8. In this study, LOD and LOQ were
based on the standard deviation of the response and
the slope of the corresponding curve using the
following equations
LOD = 3.3 σ/S; LOQ = 10 σ/S
Where σ is the standard deviation of the
absorbance of the sample and s is the slope of
calibration curve.
Precision:
Repeatability: The repeatability of the method
was confirmed by repeating all calibration
standards 5 times at 95 % confidence level (Table
4).
TABLE 4: RESULTS OF REPEATABILITY
Concentration (30 μg/ml) Amplitude difference
( 246 nm, 266 nm)
1 0.021
2 0.021
3 0.021
4 0.020
5 0.021
Mean 0.0208
STDEV 0.000447
RSD 0.02015
%RSD 2.015
Trivedi et al., IJPSR, 2013; Vol. 4(12): 4567-4572. E-ISSN: 0975-8232; P-ISSN: 2320-5148
International Journal of Pharmaceutical Sciences and Research 4571
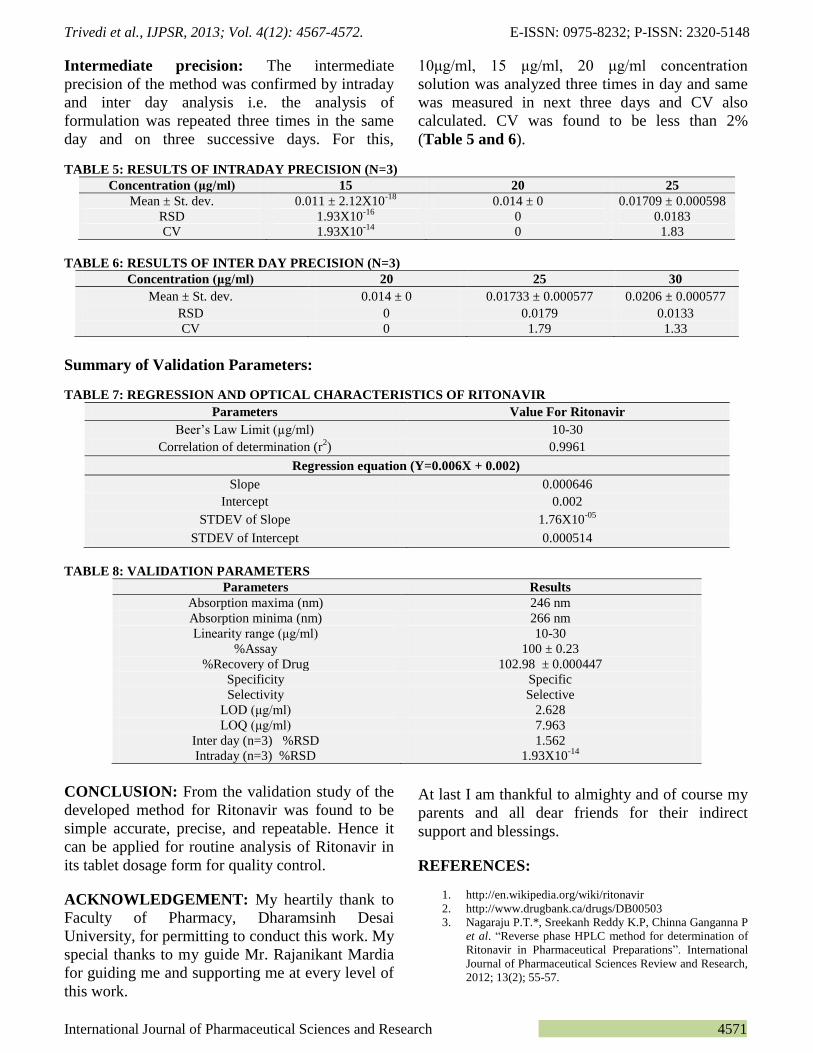
Intermediate precision: The intermediate
precision of the method was confirmed by intraday
and inter day analysis i.e. the analysis of
formulation was repeated three times in the same
day and on three successive days. For this,
10μg/ml, 15 μg/ml, 20 μg/ml concentration
solution was analyzed three times in day and same
was measured in next three days and CV also
calculated. CV was found to be less than 2%
(Table 5 and 6).
TABLE 5: RESULTS OF INTRADAY PRECISION (N=3)
Concentration (μg/ml) 15 20 25
Mean ± St. dev. 0.011 ± 2.12X10⁻¹⁸
0.014 ± 0 0.01709 ± 0.000598
RSD 1.93X10⁻¹⁶
0 0.0183
CV 1.93X10⁻¹⁴
0 1.83
TABLE 6: RESULTS OF INTER DAY PRECISION (N=3)
Concentration (μg/ml) 20 25 30
Mean ± St. dev. 0.014 ± 0 0.01733 ± 0.000577 0.0206 ± 0.000577
RSD 0 0.0179 0.0133
CV 0 1.79 1.33
Summary of Validation Parameters:
TABLE 7: REGRESSION AND OPTICAL CHARACTERISTICS OF RITONAVIR
Parameters Value For Ritonavir
Beer’s Law Limit (µg/ml) 10-30
Correlation of determination (r2) 0.9961
Regression equation (Y=0.006X + 0.002)
Slope 0.000646
Intercept 0.002
STDEV of Slope 1.76X10-05
STDEV of Intercept 0.000514
TABLE 8: VALIDATION PARAMETERS
Parameters Results
Absorption maxima (nm) 246 nm
Absorption minima (nm) 266 nm
Linearity range (μg/ml) 10-30
%Assay 100 ± 0.23
%Recovery of Drug 102.98 ± 0.000447
Specificity Specific
Selectivity Selective
LOD (μg/ml) 2.628
LOQ (μg/ml) 7.963
Inter day (n=3) %RSD 1.562
Intraday (n=3) %RSD 1.93X10⁻¹⁴
CONCLUSION: From the validation study of the
developed method for Ritonavir was found to be
simple accurate, precise, and repeatable. Hence it
can be applied for routine analysis of Ritonavir in
its tablet dosage form for quality control.
ACKNOWLEDGEMENT: My heartily thank to
Faculty of Pharmacy, Dharamsinh Desai
University, for permitting to conduct this work. My
special thanks to my guide Mr. Rajanikant Mardia
for guiding me and supporting me at every level of
this work.
At last I am thankful to almighty and of course my
parents and all dear friends for their indirect
support and blessings.
REFERENCES:
1. http://en.wikipedia.org/wiki/ritonavir
2. http://www.drugbank.ca/drugs/DB00503
3. Nagaraju P.T.*, Sreekanh Reddy K.P, Chinna Ganganna P
et al. “Reverse phase HPLC method for determination of
Ritonavir in Pharmaceutical Preparations”. International
Journal of Pharmaceutical Sciences Review and Research,
2012; 13(2); 55-57.
Trivedi et al., IJPSR, 2013; Vol. 4(12): 4567-4572. E-ISSN: 0975-8232; P-ISSN: 2320-5148
International Journal of Pharmaceutical Sciences and Research 4572
4. Mardia RB. “Analysis of some antiretroviral drugs in
bulk, pharmaceutical formulations and biological fluid”,
Unpublished, Ph. D thesis, Saurashtra University.
(http://etheses.saurashtrauniversity.edu/977/1/mardia_rb_t
hesis_pharmacy.pdf 2012.
5. Mardia R.B., Suhagia B. N., Pasha T.Y., Chauhan S. P.
and Solanki S. D.: Development and validation of HPTLC
method for simultaneous analysis of lopinavir and
ritonavir in their combined tablet dosage form.
International Journal for Pharmaceutical Research
Scholars 2012; 1(1): 39- 44.
6. Chiranjeevi K., Kumar GV., Channabasavaraj K.P.,
Manjunath Y and T. Tamizh mani: Third order derivative
estimation of ritonavir in bulk and pharmaceutical dosage
forms spectrophotometric. International Journal of
Pharmaceutical Sciences 2011; 3(1):1017-1020
7. Nagulwar. V.P. and Bhusari .K. P.: Simultaneous
Estimation of ritonavir and Lopinavir by Absorption ratio
(Q-analysis) UV Spectrophotometric Method in
Combined Tablet Dosage Form: Scholars Research
Library (http://scholarsresearchlibrary.com/archive.html)”.
8. Chiranjeevi K., Channabasavaraj K.P., Reddy P.S. and
Nagaraju P.T, Development and Validation of
Spectrophotometric Method for Quantitative estimation of
ritonavir in Bulk and Pharmaceutical Dosage Forms.
International Journal of Chem.Tech Research 2011; Vol.3
(1): 58-62
9. Behera A: Method development, validation and stability
study of ritonavir in bulk and pharmaceutical dosage form
using spectroscopic method. ChronYoungSci 2011; Vol.
2(3): 161-168.
10. Chiranjeevi K. and Channabasavaraj K.P: Development
and validation of RP-HPLC method for quantitative
estimation of ritonavir in bulk and pharmaceutical dosage
form. International Journal of Pharmaceutical Sciences
and Research 2011; Vol. 2(3): 596-600.
11. Swartz. M. E, Krull. I. S.: Analytical Method
Development and Validation. Published by Marcel
Dekker, First Indian Reprint, 26-27
12. Beckett A. H., Stenlake J. B.: Practical Pharmaceutical
Chemistry. CBS Publishers and distributors 2005; 4(2):
272-302
13. ICH Harmonized Tripartite guideline, Validation of
Analytical Procedures text and Methodology Q2 (R1)
Currant step 4 version, Parent guideline dated 27 October
1994 (Complementary guideline on Methodology dated 6
November 1996 incorporated in November 2005).
All © 2013 are reserved by International Journal of Pharmaceutical Sciences and Research. This Journal licensed under a Creative Commons Attribution-NonCommercial-ShareAlike 3.0 Unported License.
This article can be downloaded to ANDROID OS based mobile. Scan QR Code using Code/Bar Scanner from your mobile. (Scanners are
available on Google Playstore)
How to cite this article:
Trivedi CD, Mardia RB, Suhagia BN and Chauhan SP: Development and validation of spectrophotometric method for the
estimation of Ritonavir in tablet dosage form. Int J Pharm Sci Res 2013; 4(12): 4567-72. doi: 10.13040/IJPSR. 0975-
8232.4(12).4567-72
Top Related
Copyright © 2022 FDOKUMEN

